
Identification of Embodied Environmental Attributes of Construction in Metropolitan and Growth Region of Melbourne, Australia to Support Urban Planning


 ,
,  ,
,  ,
,  ,
,  , ,
, , 
Abstract
:1. Introduction
2. Literature Review
3. Research Objectives
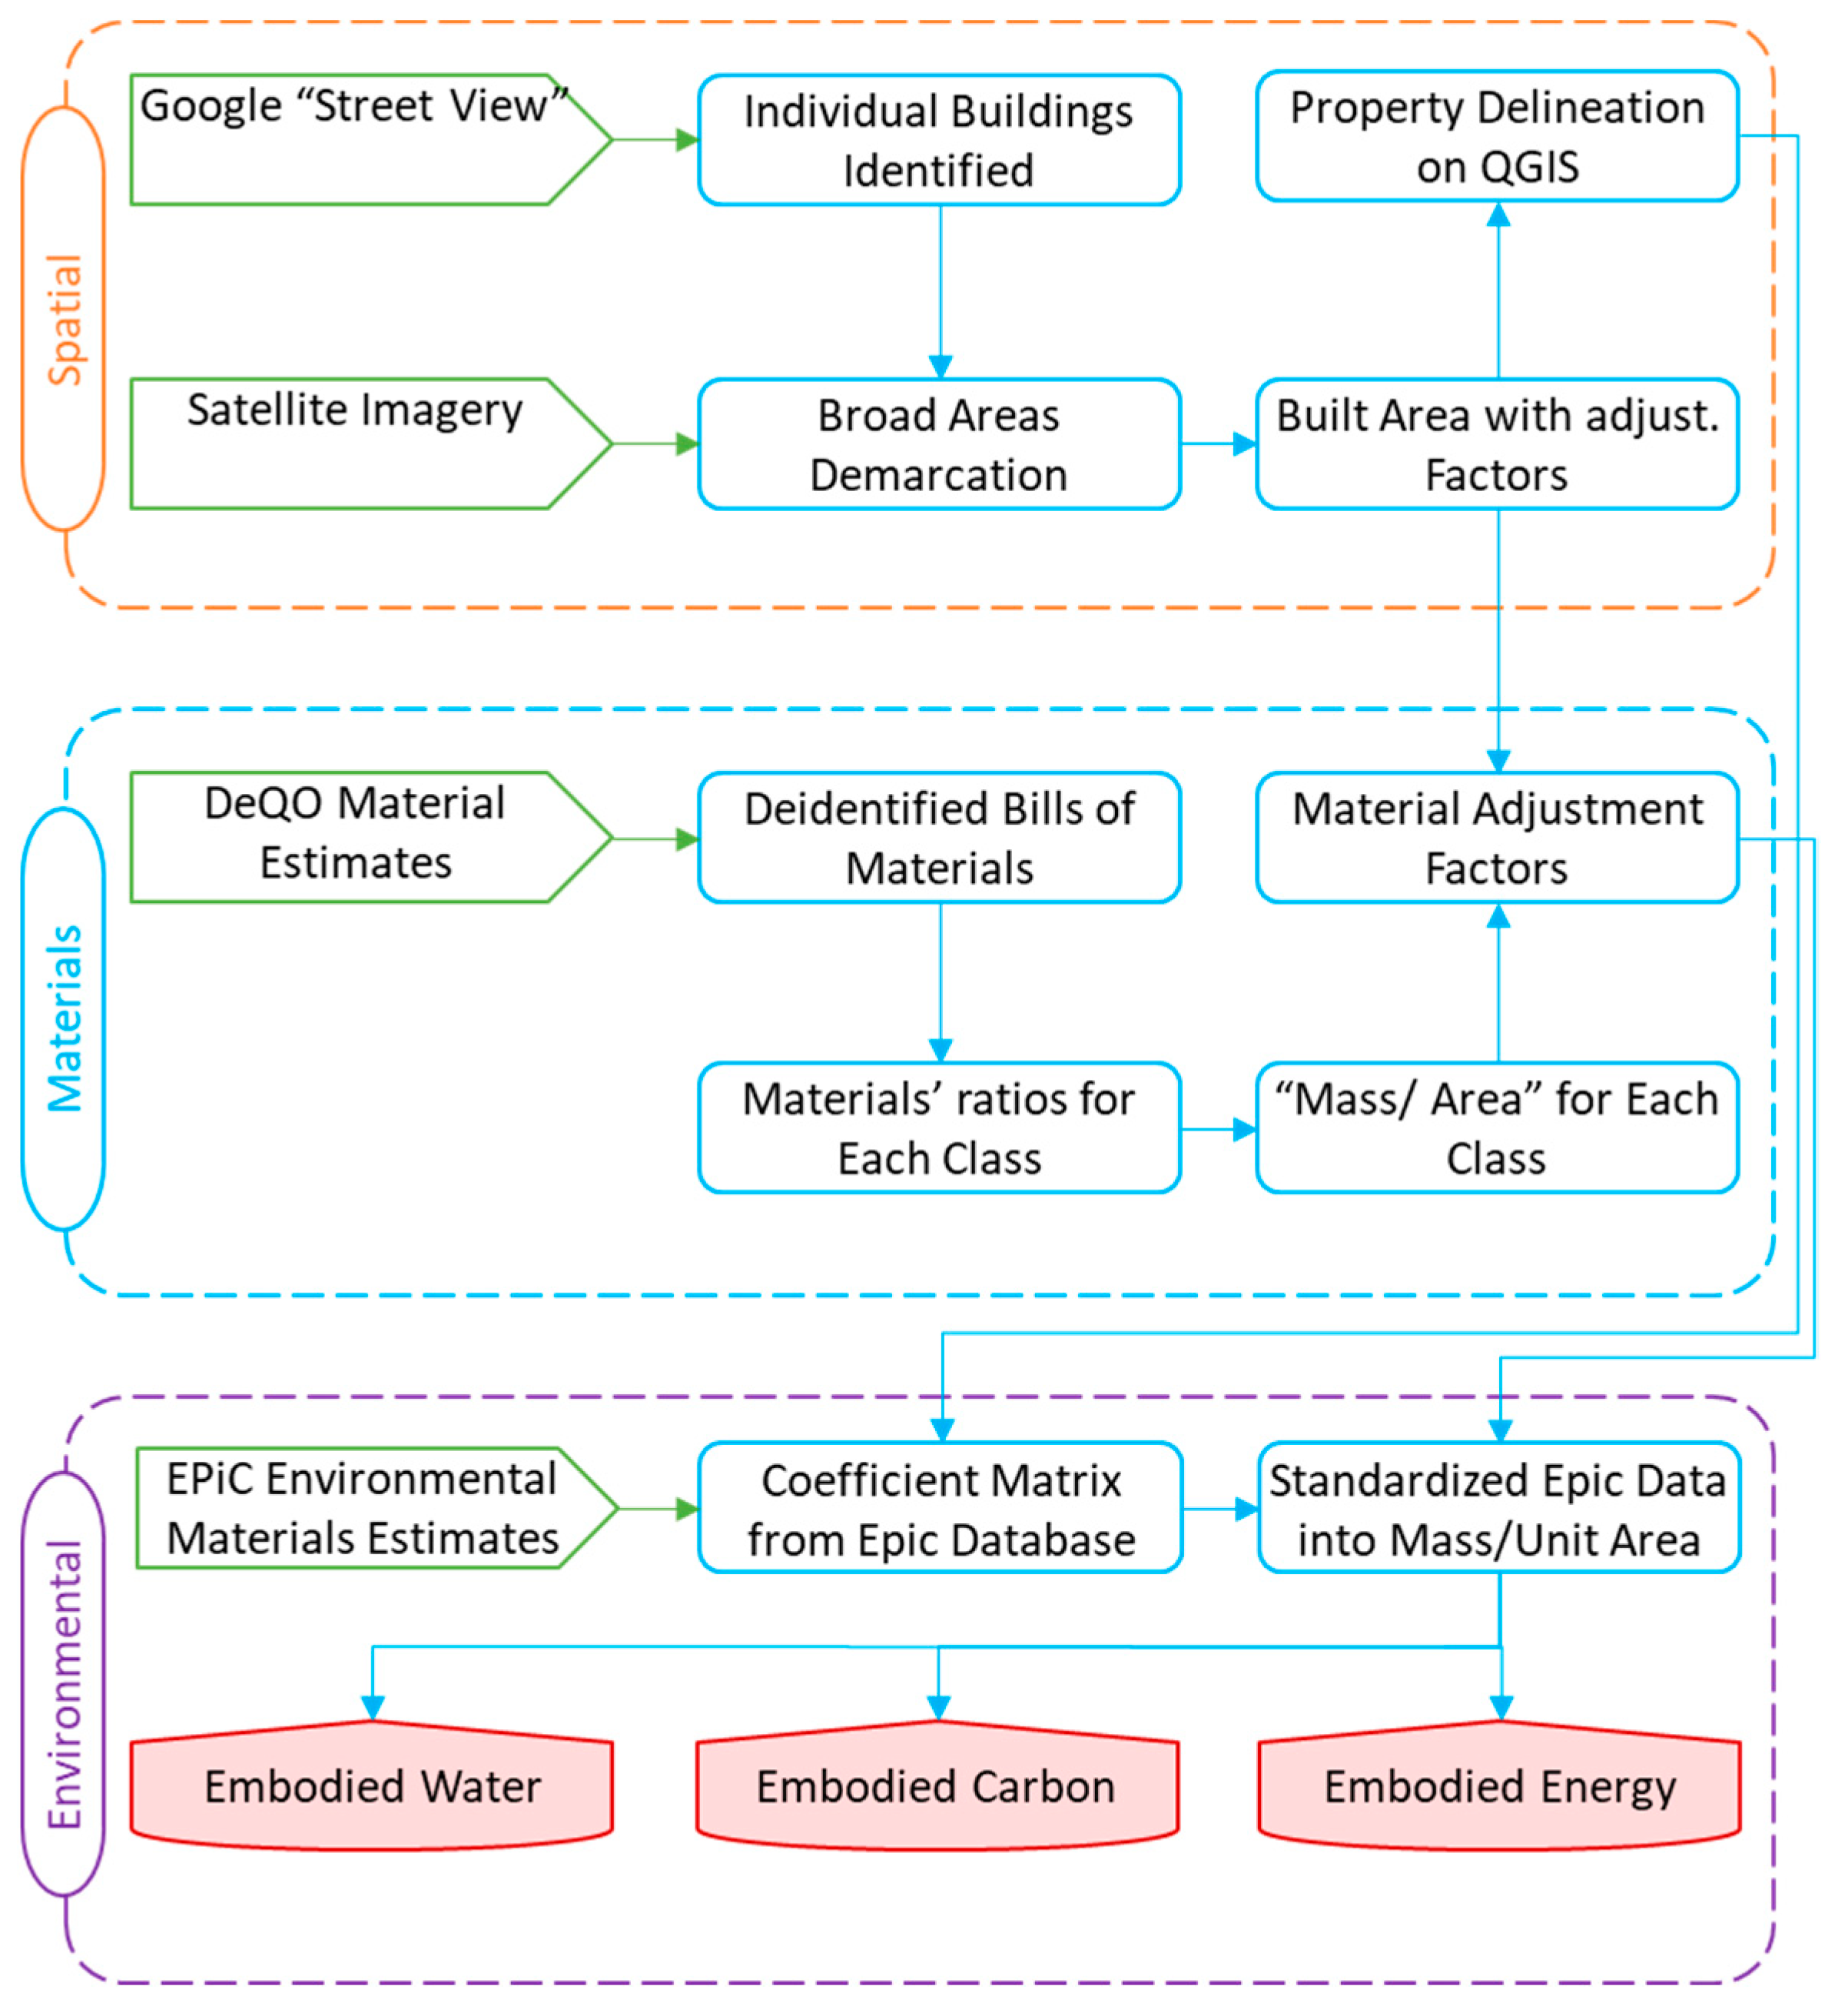
4. Methodology
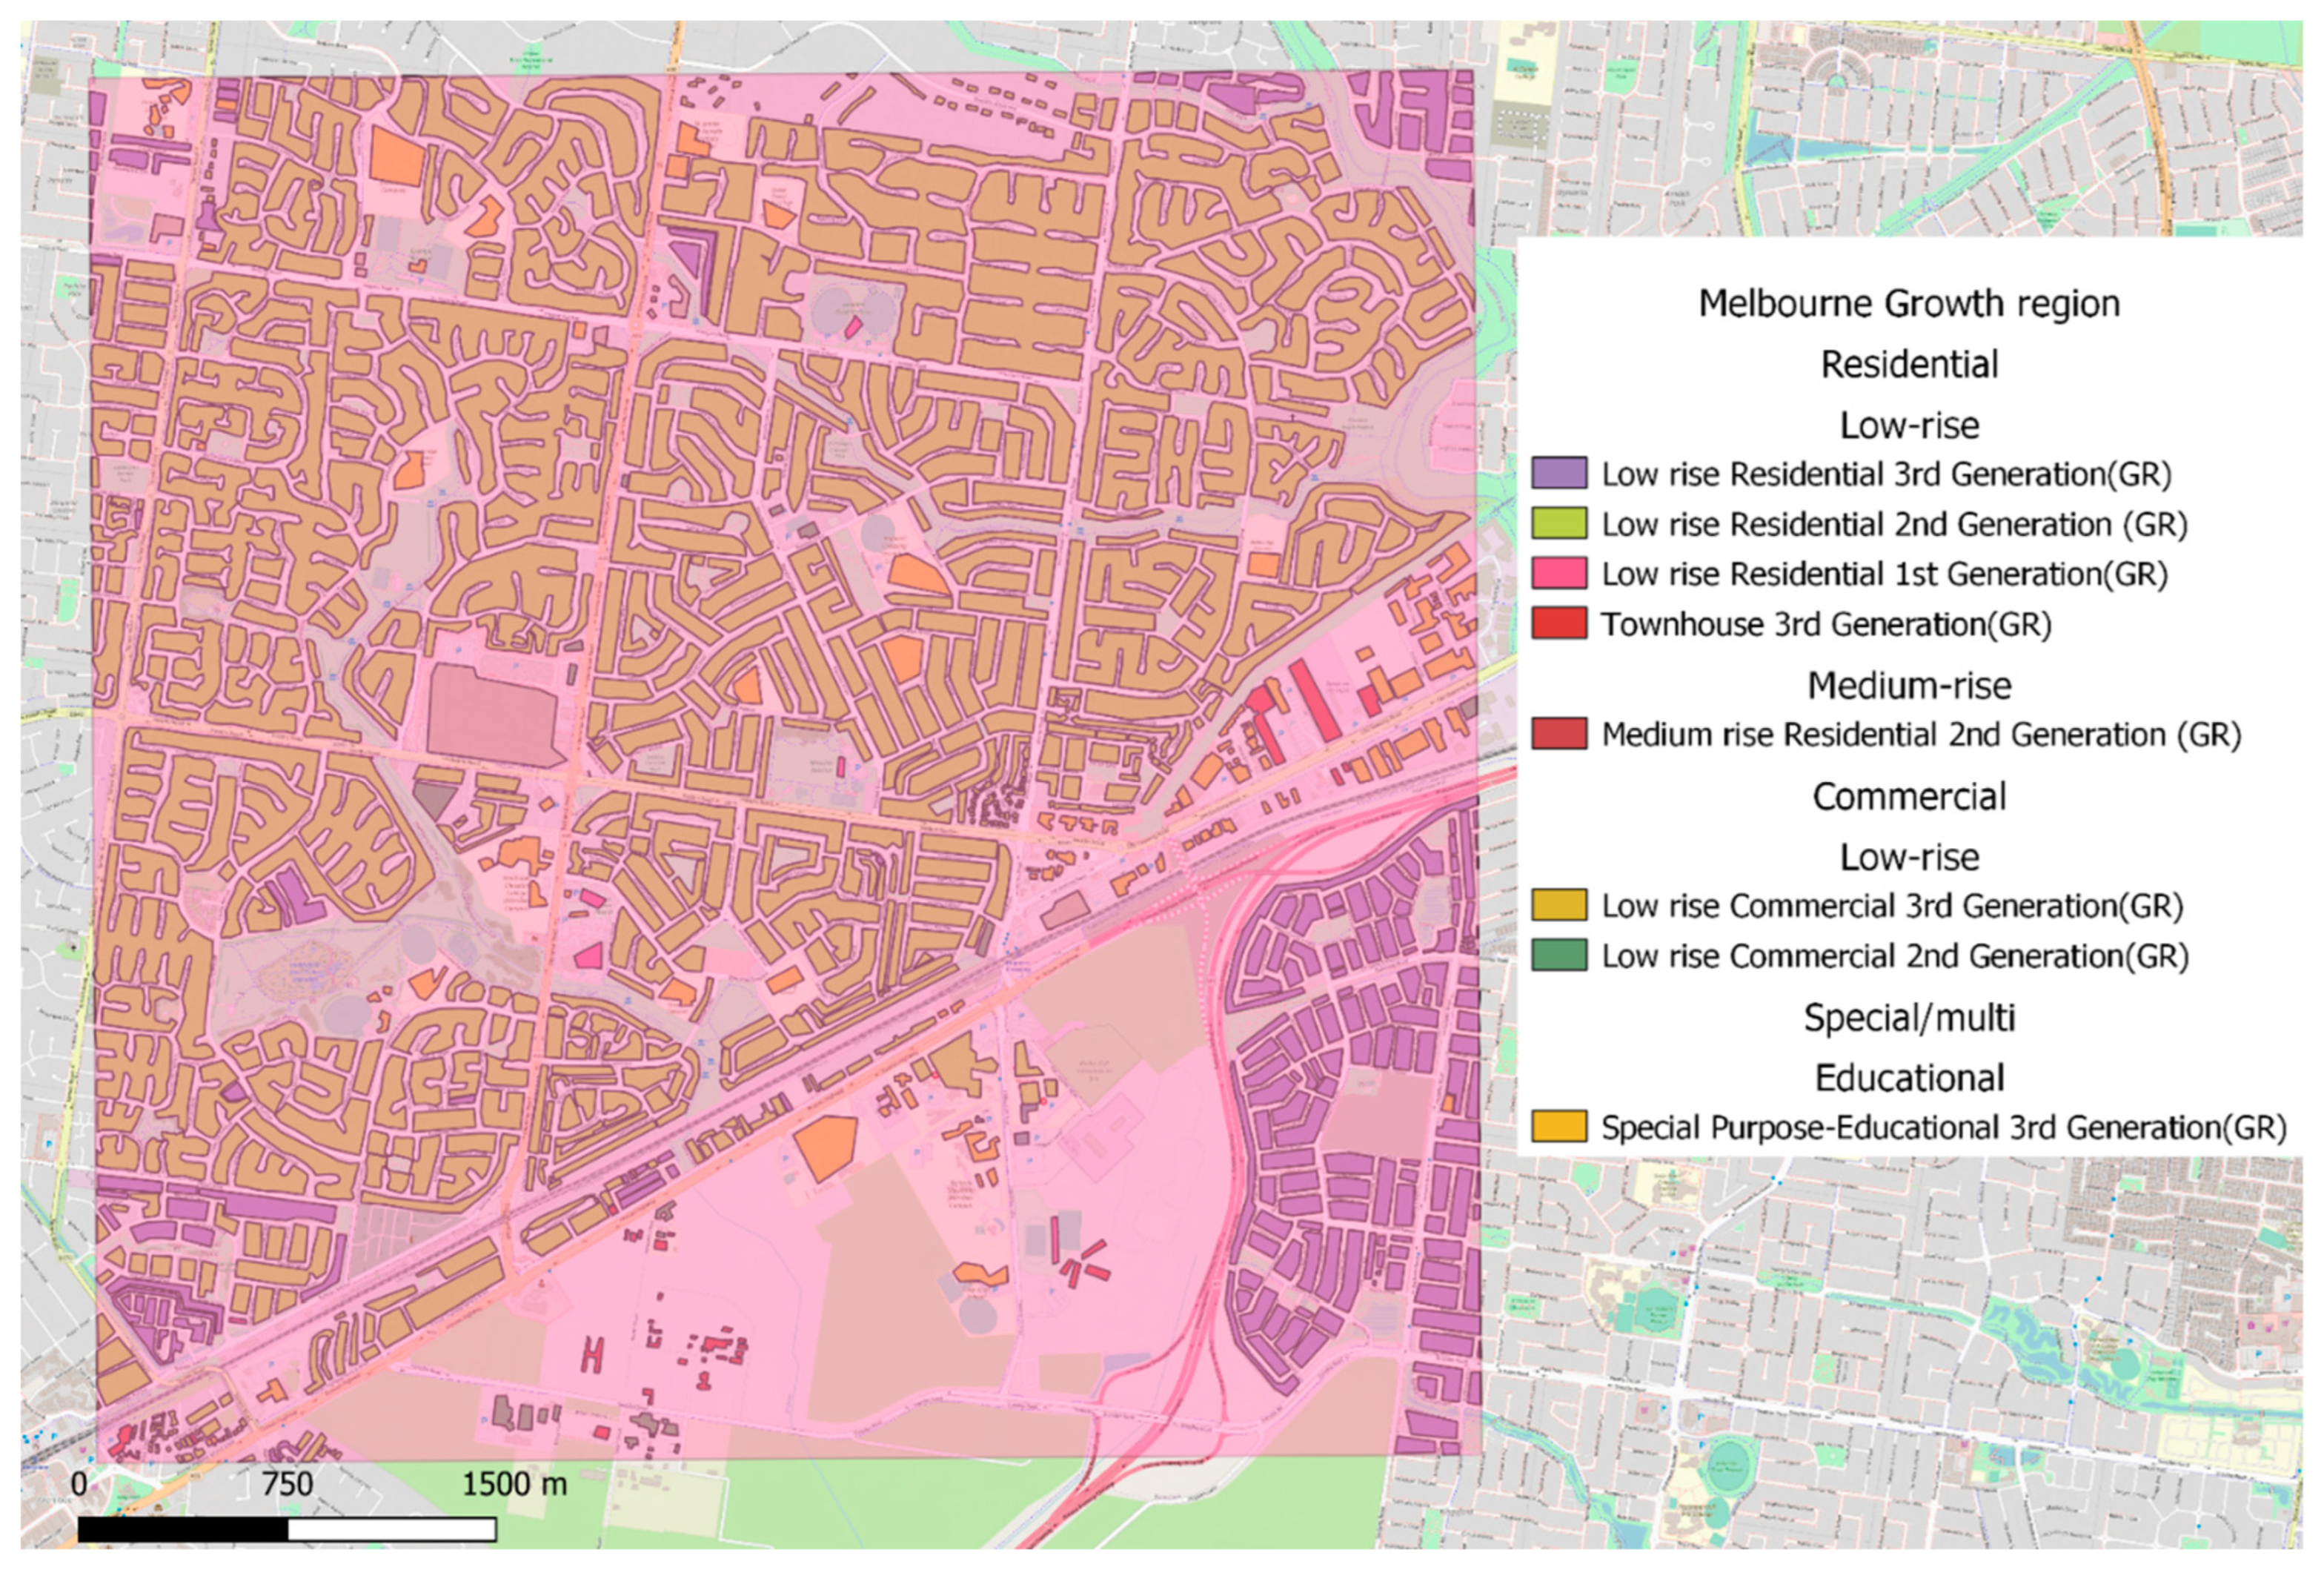
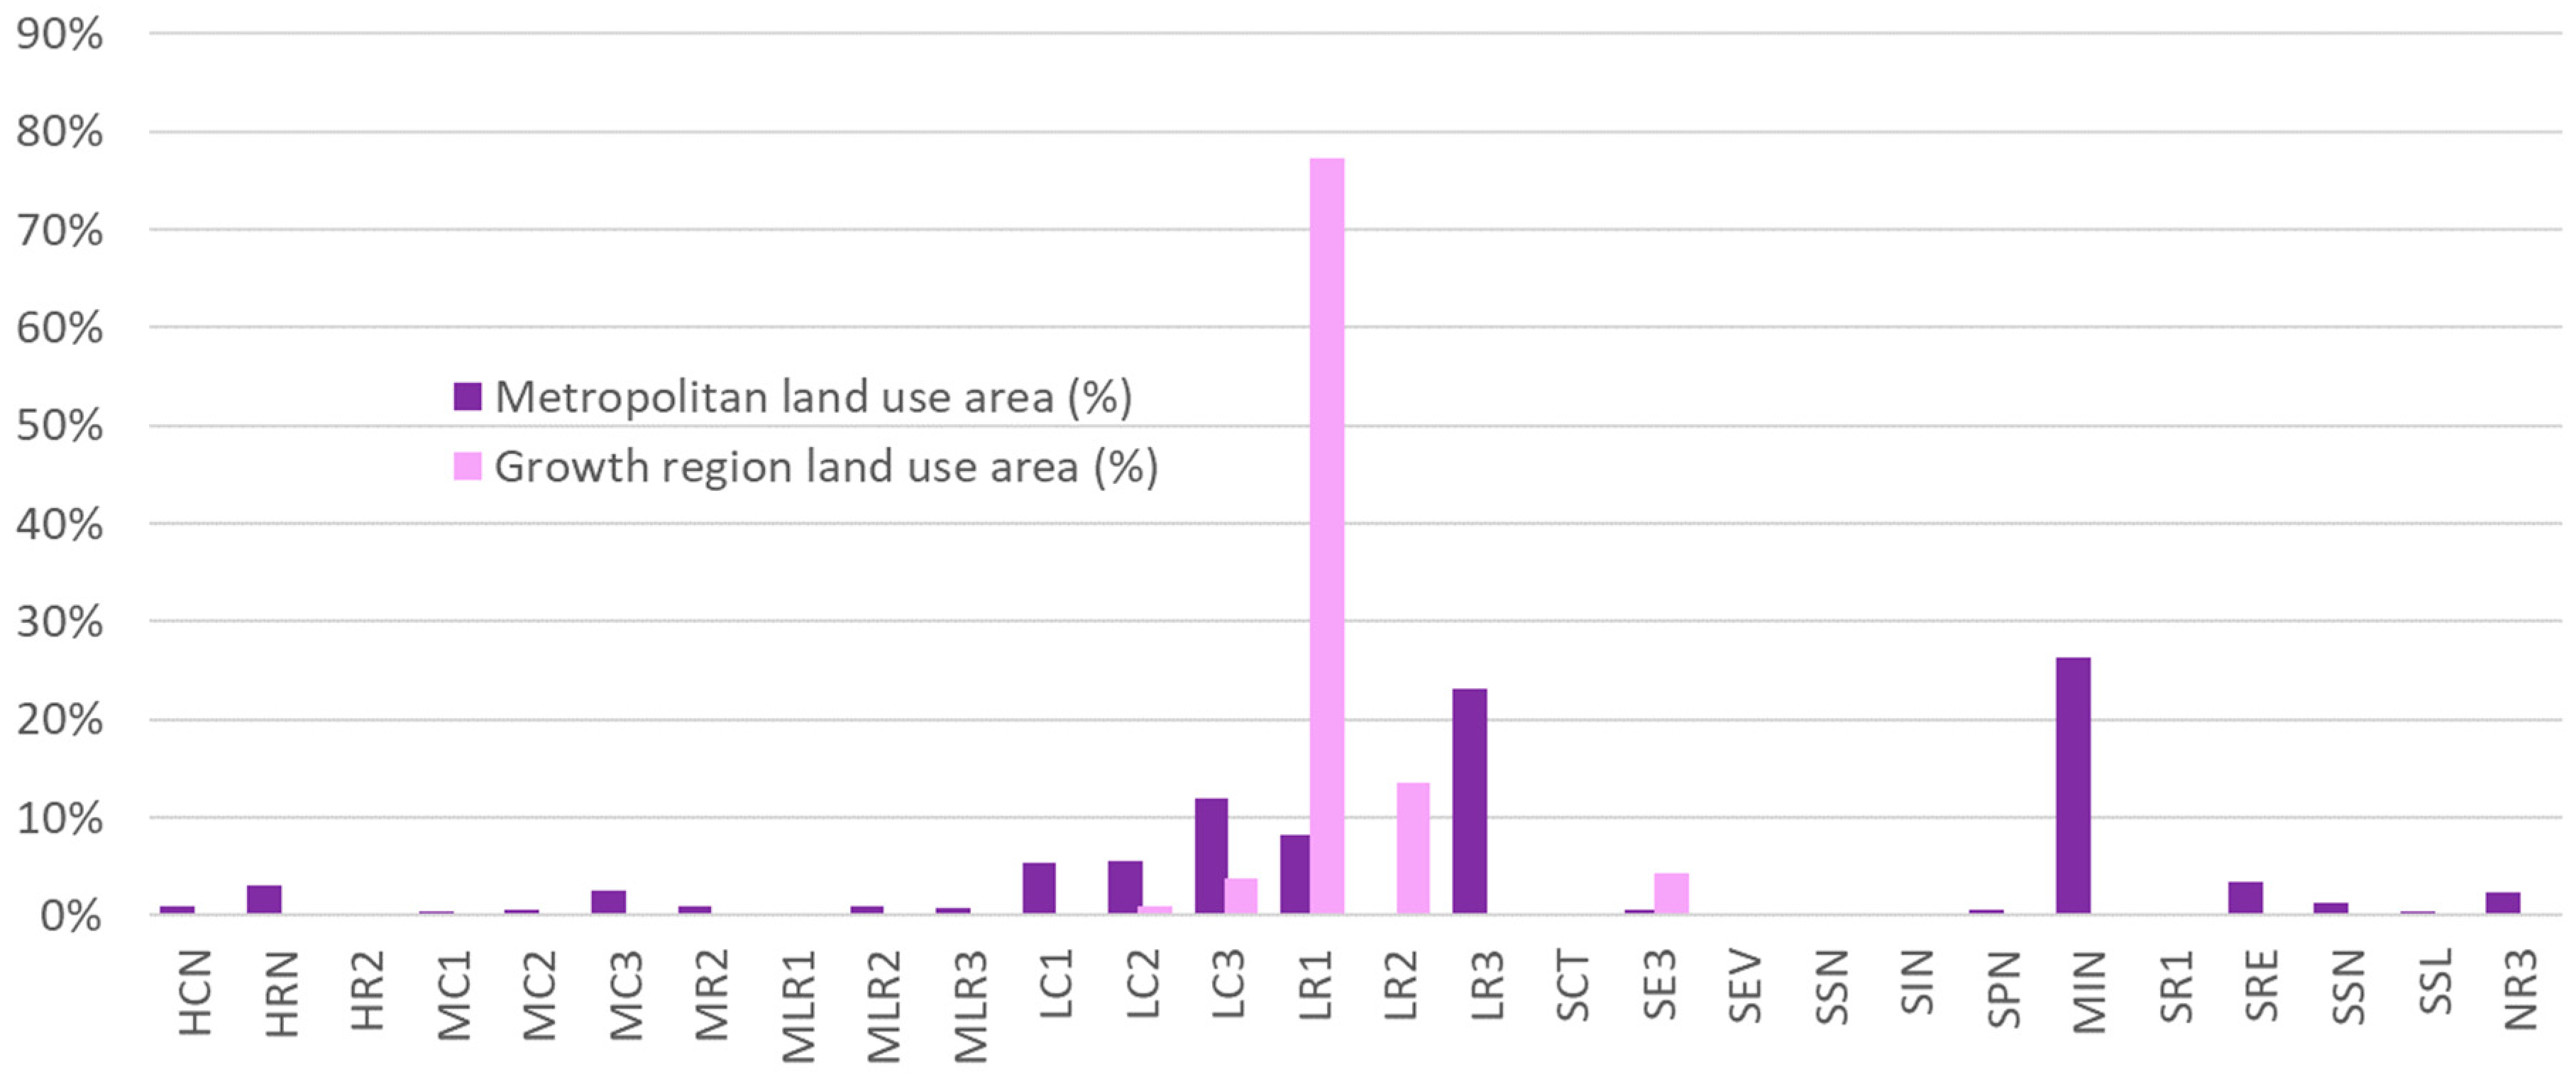
4.1. Spatial Analysis
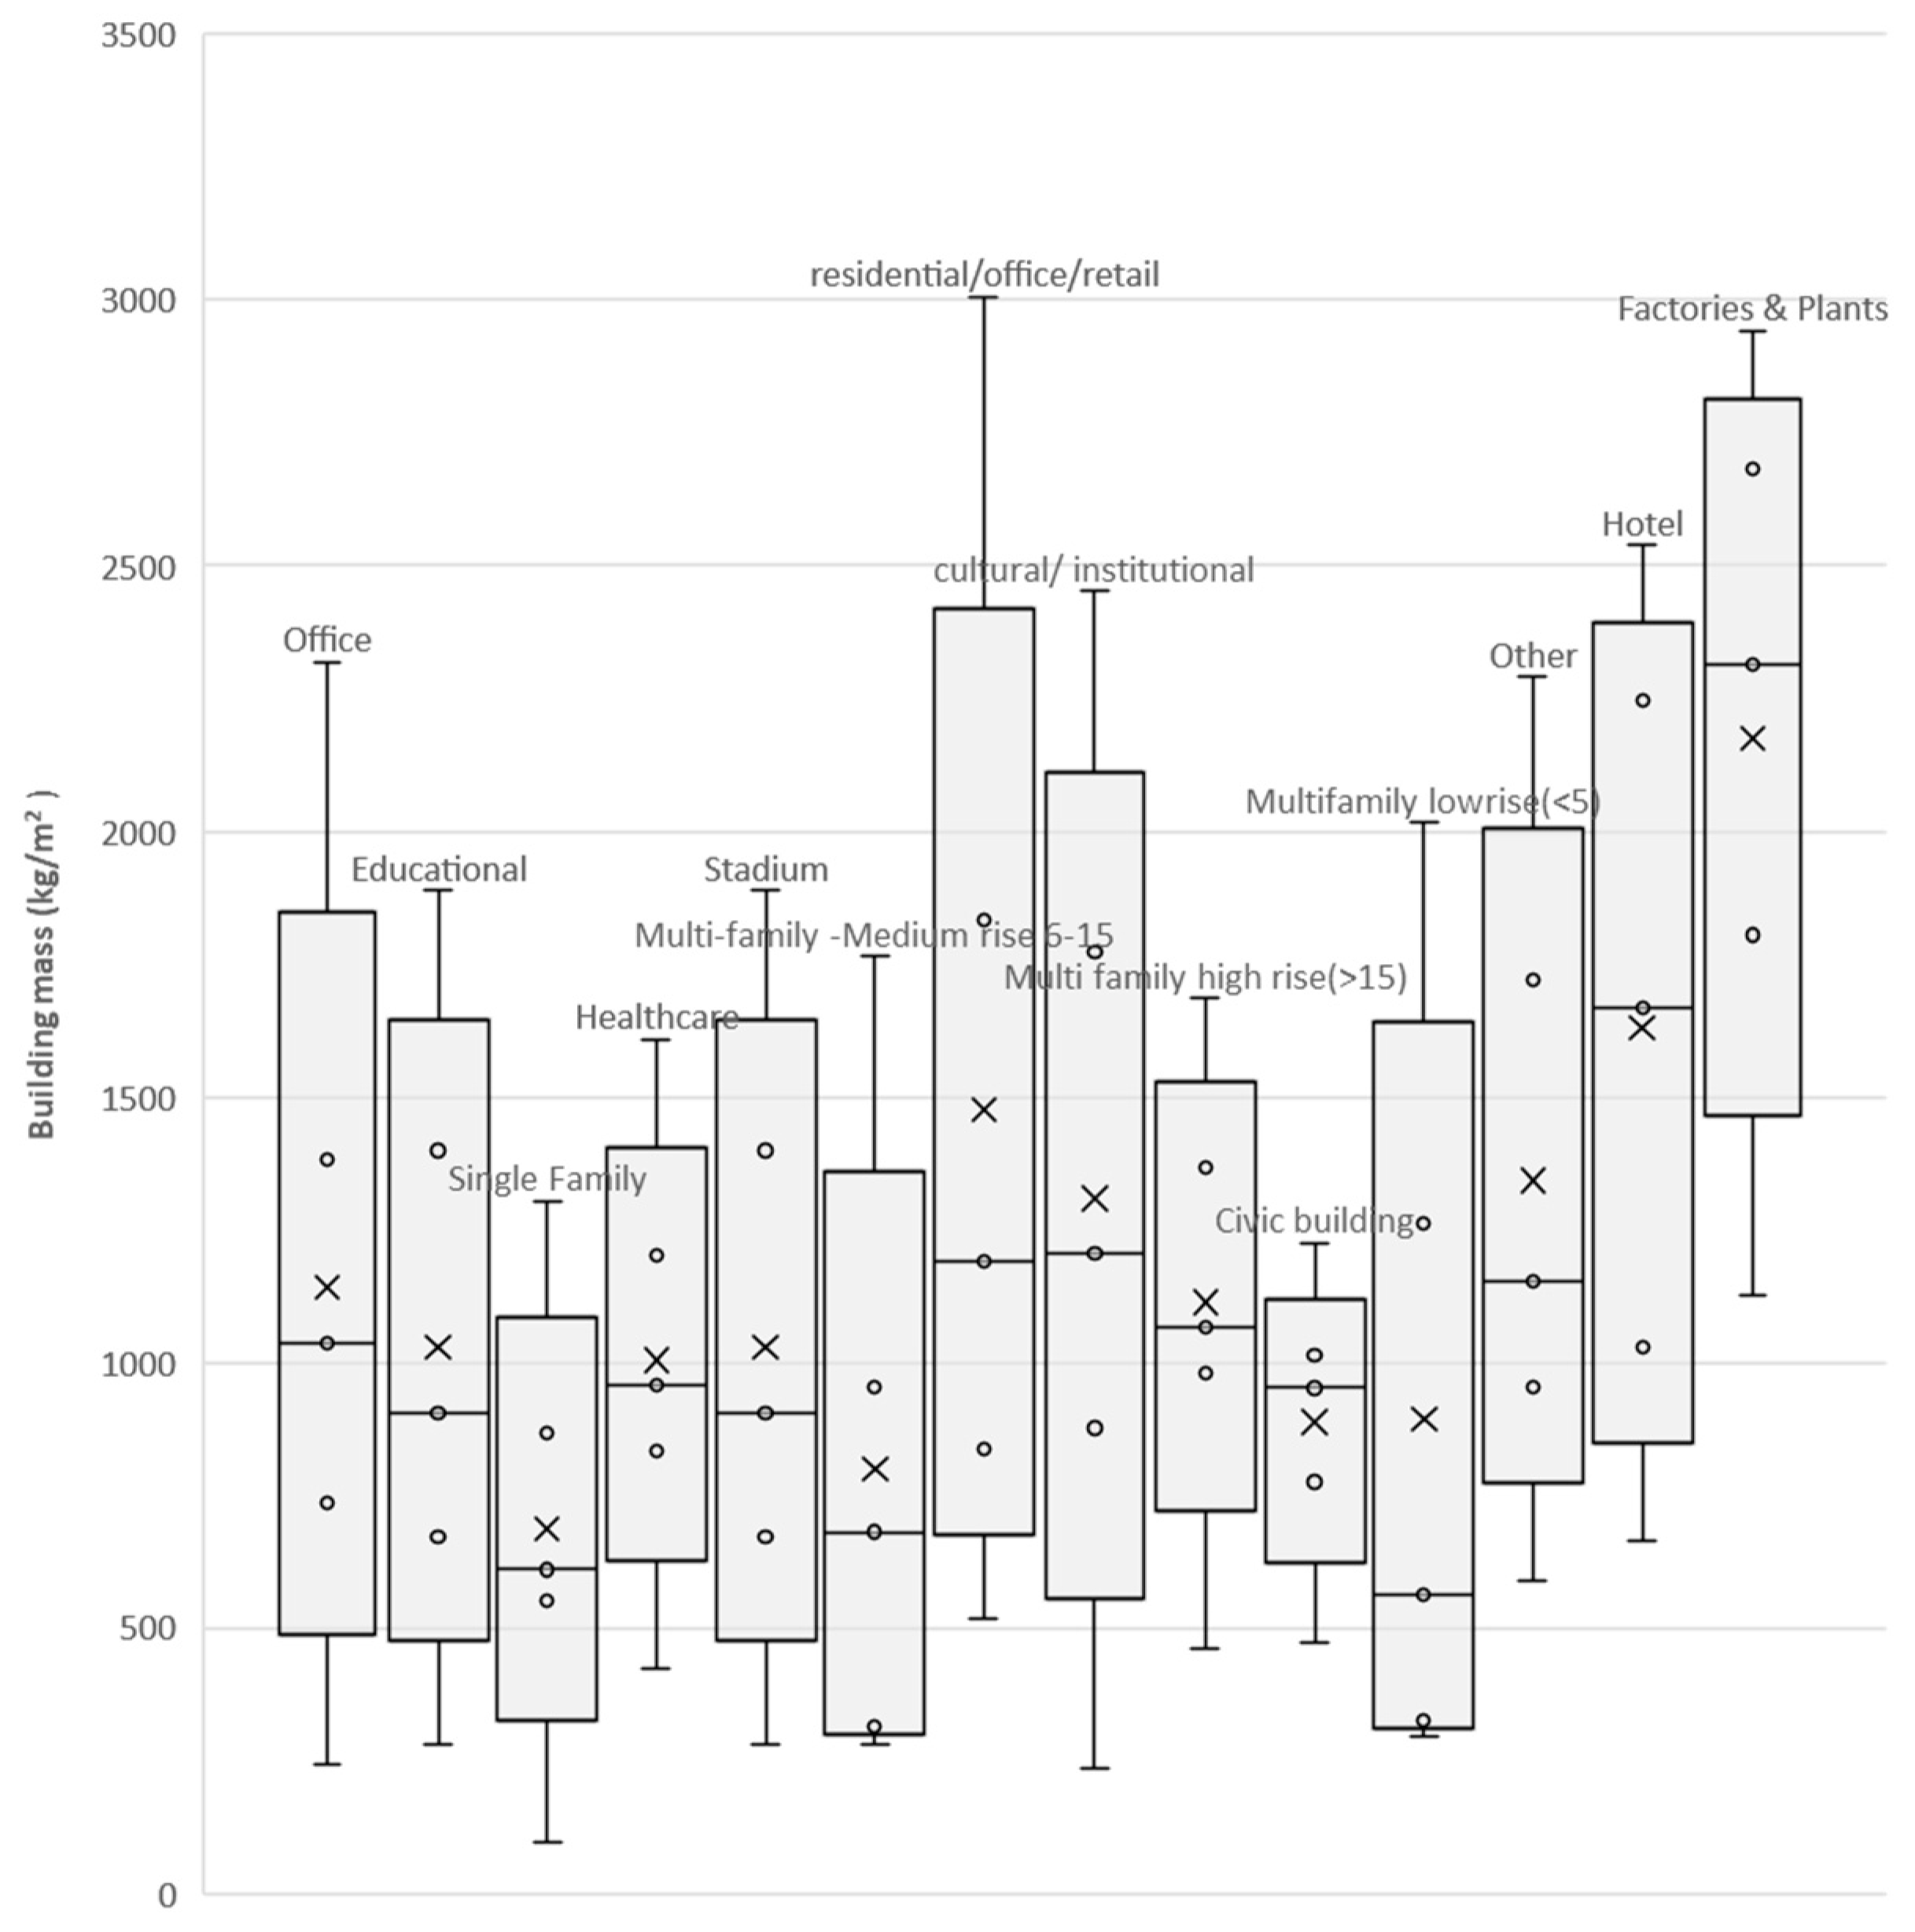
4.2. Material Analysis
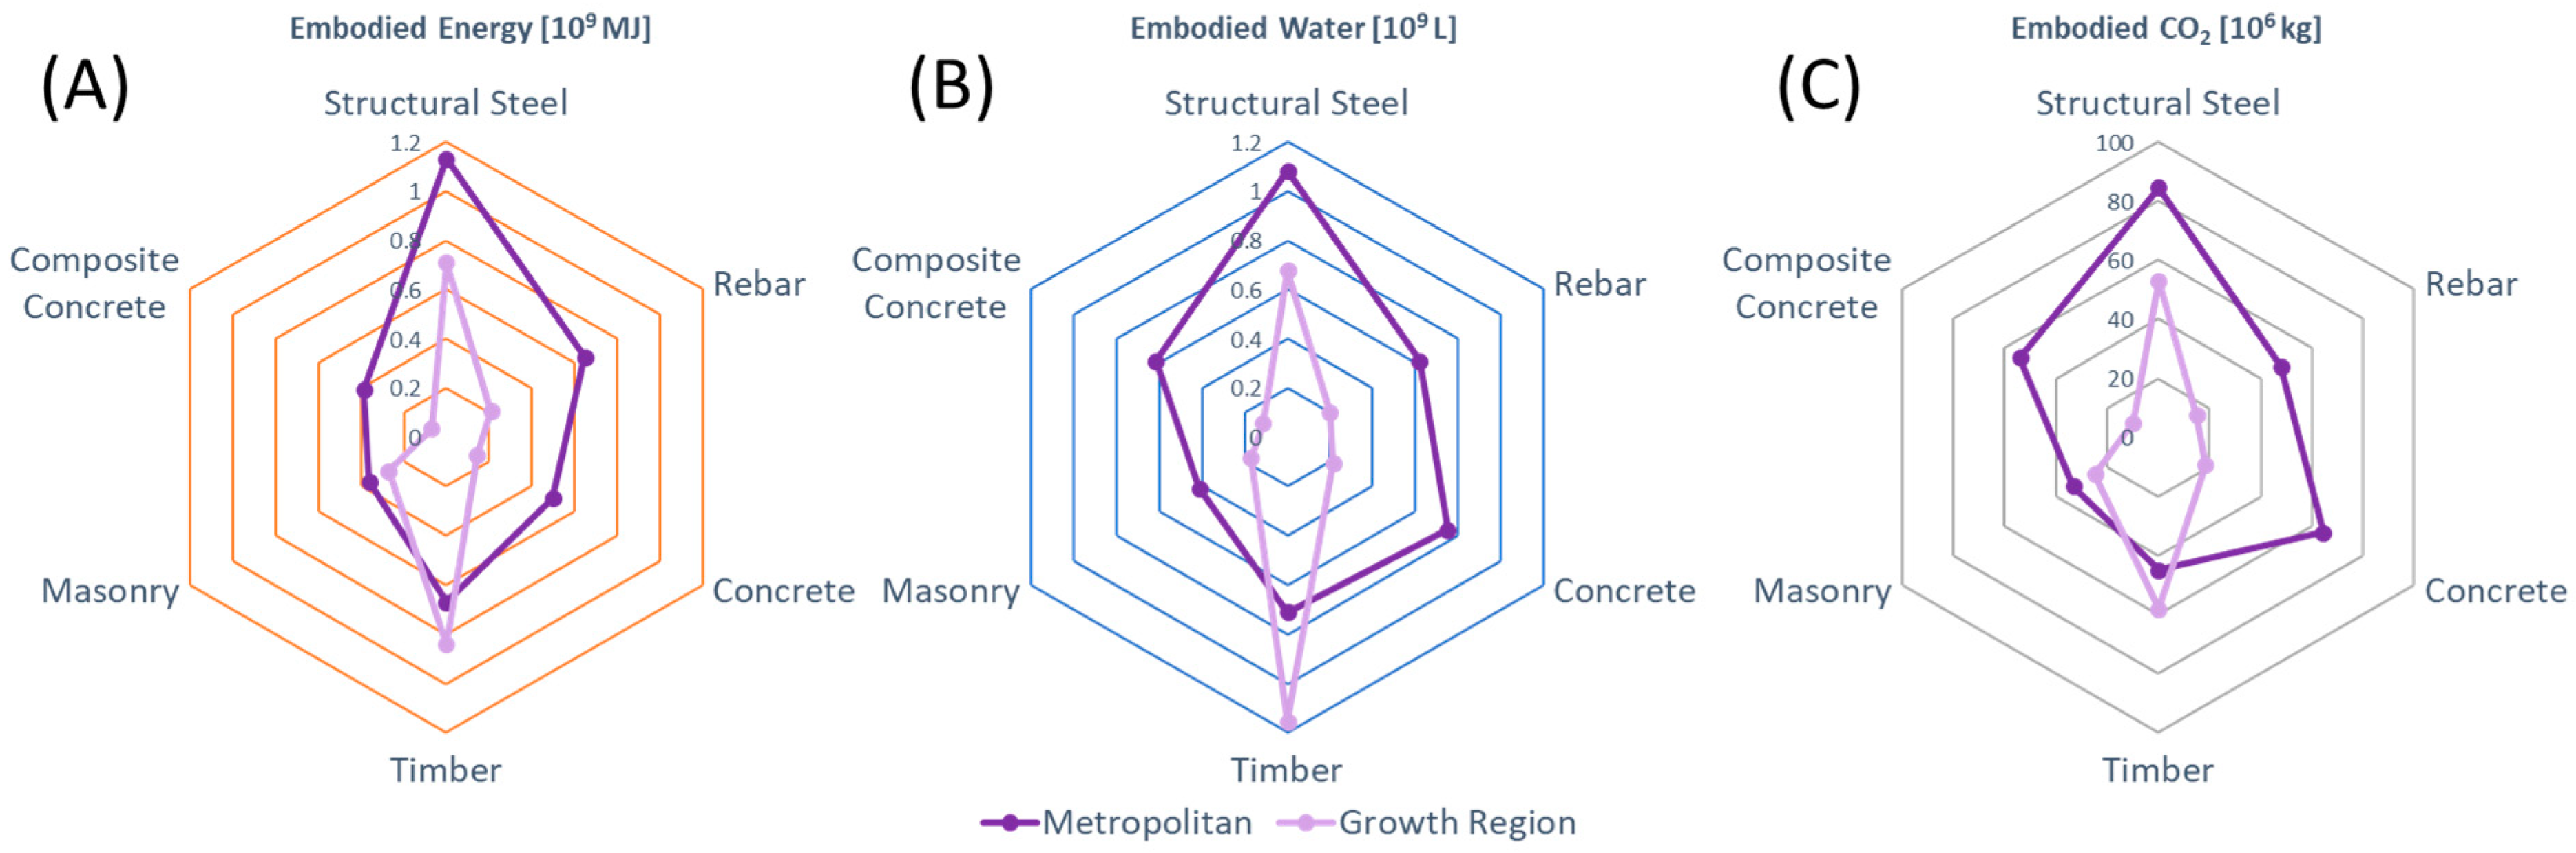
4.3. Environmrntal Analysis
4.4. Assumptions and Limitations
5. Results
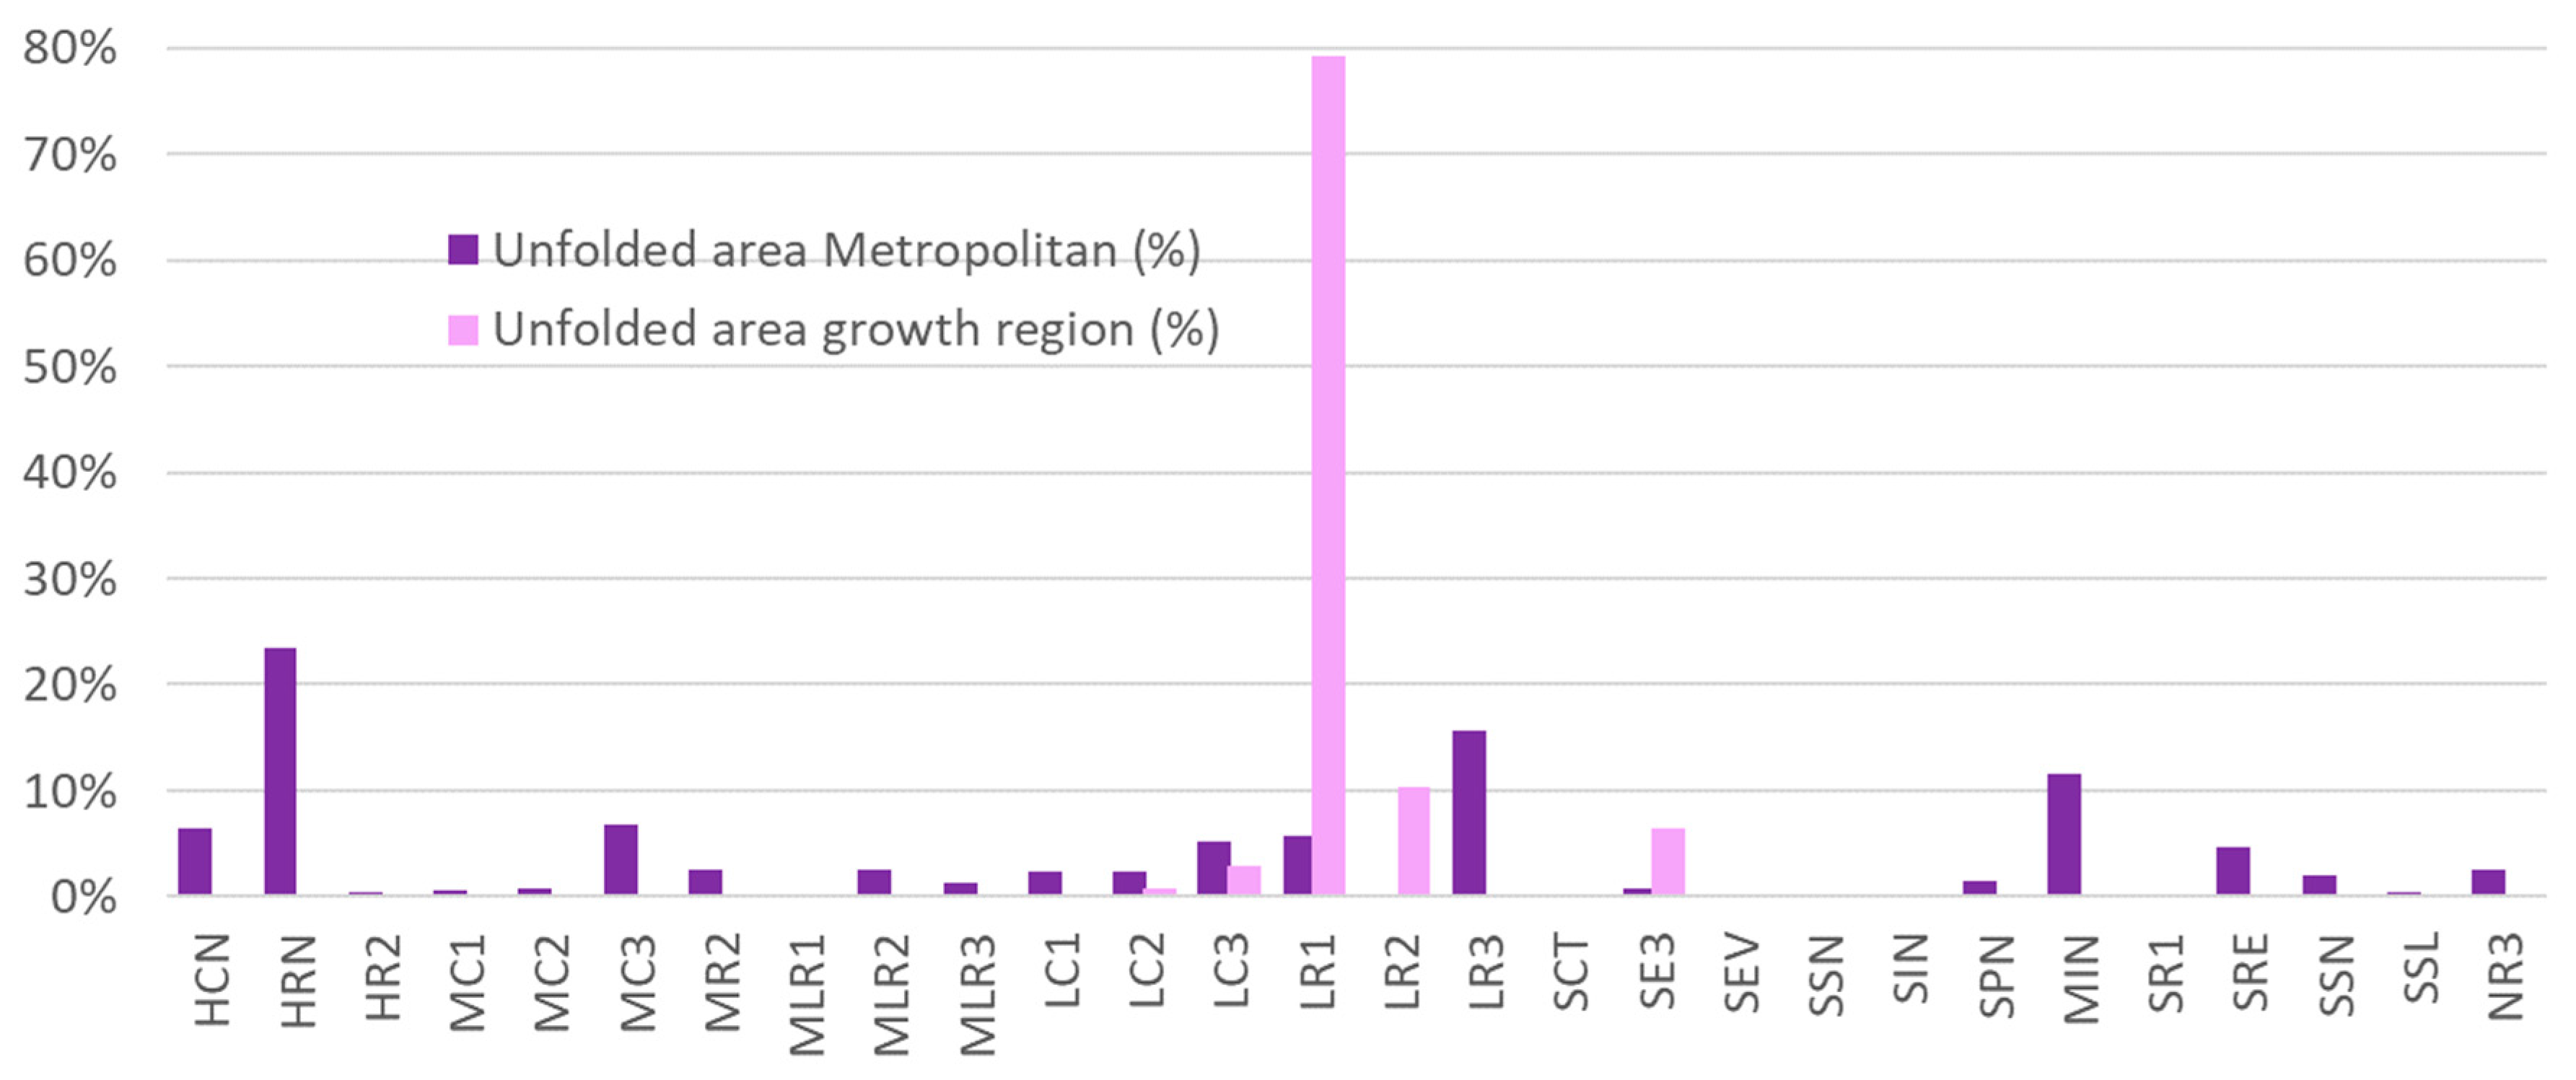
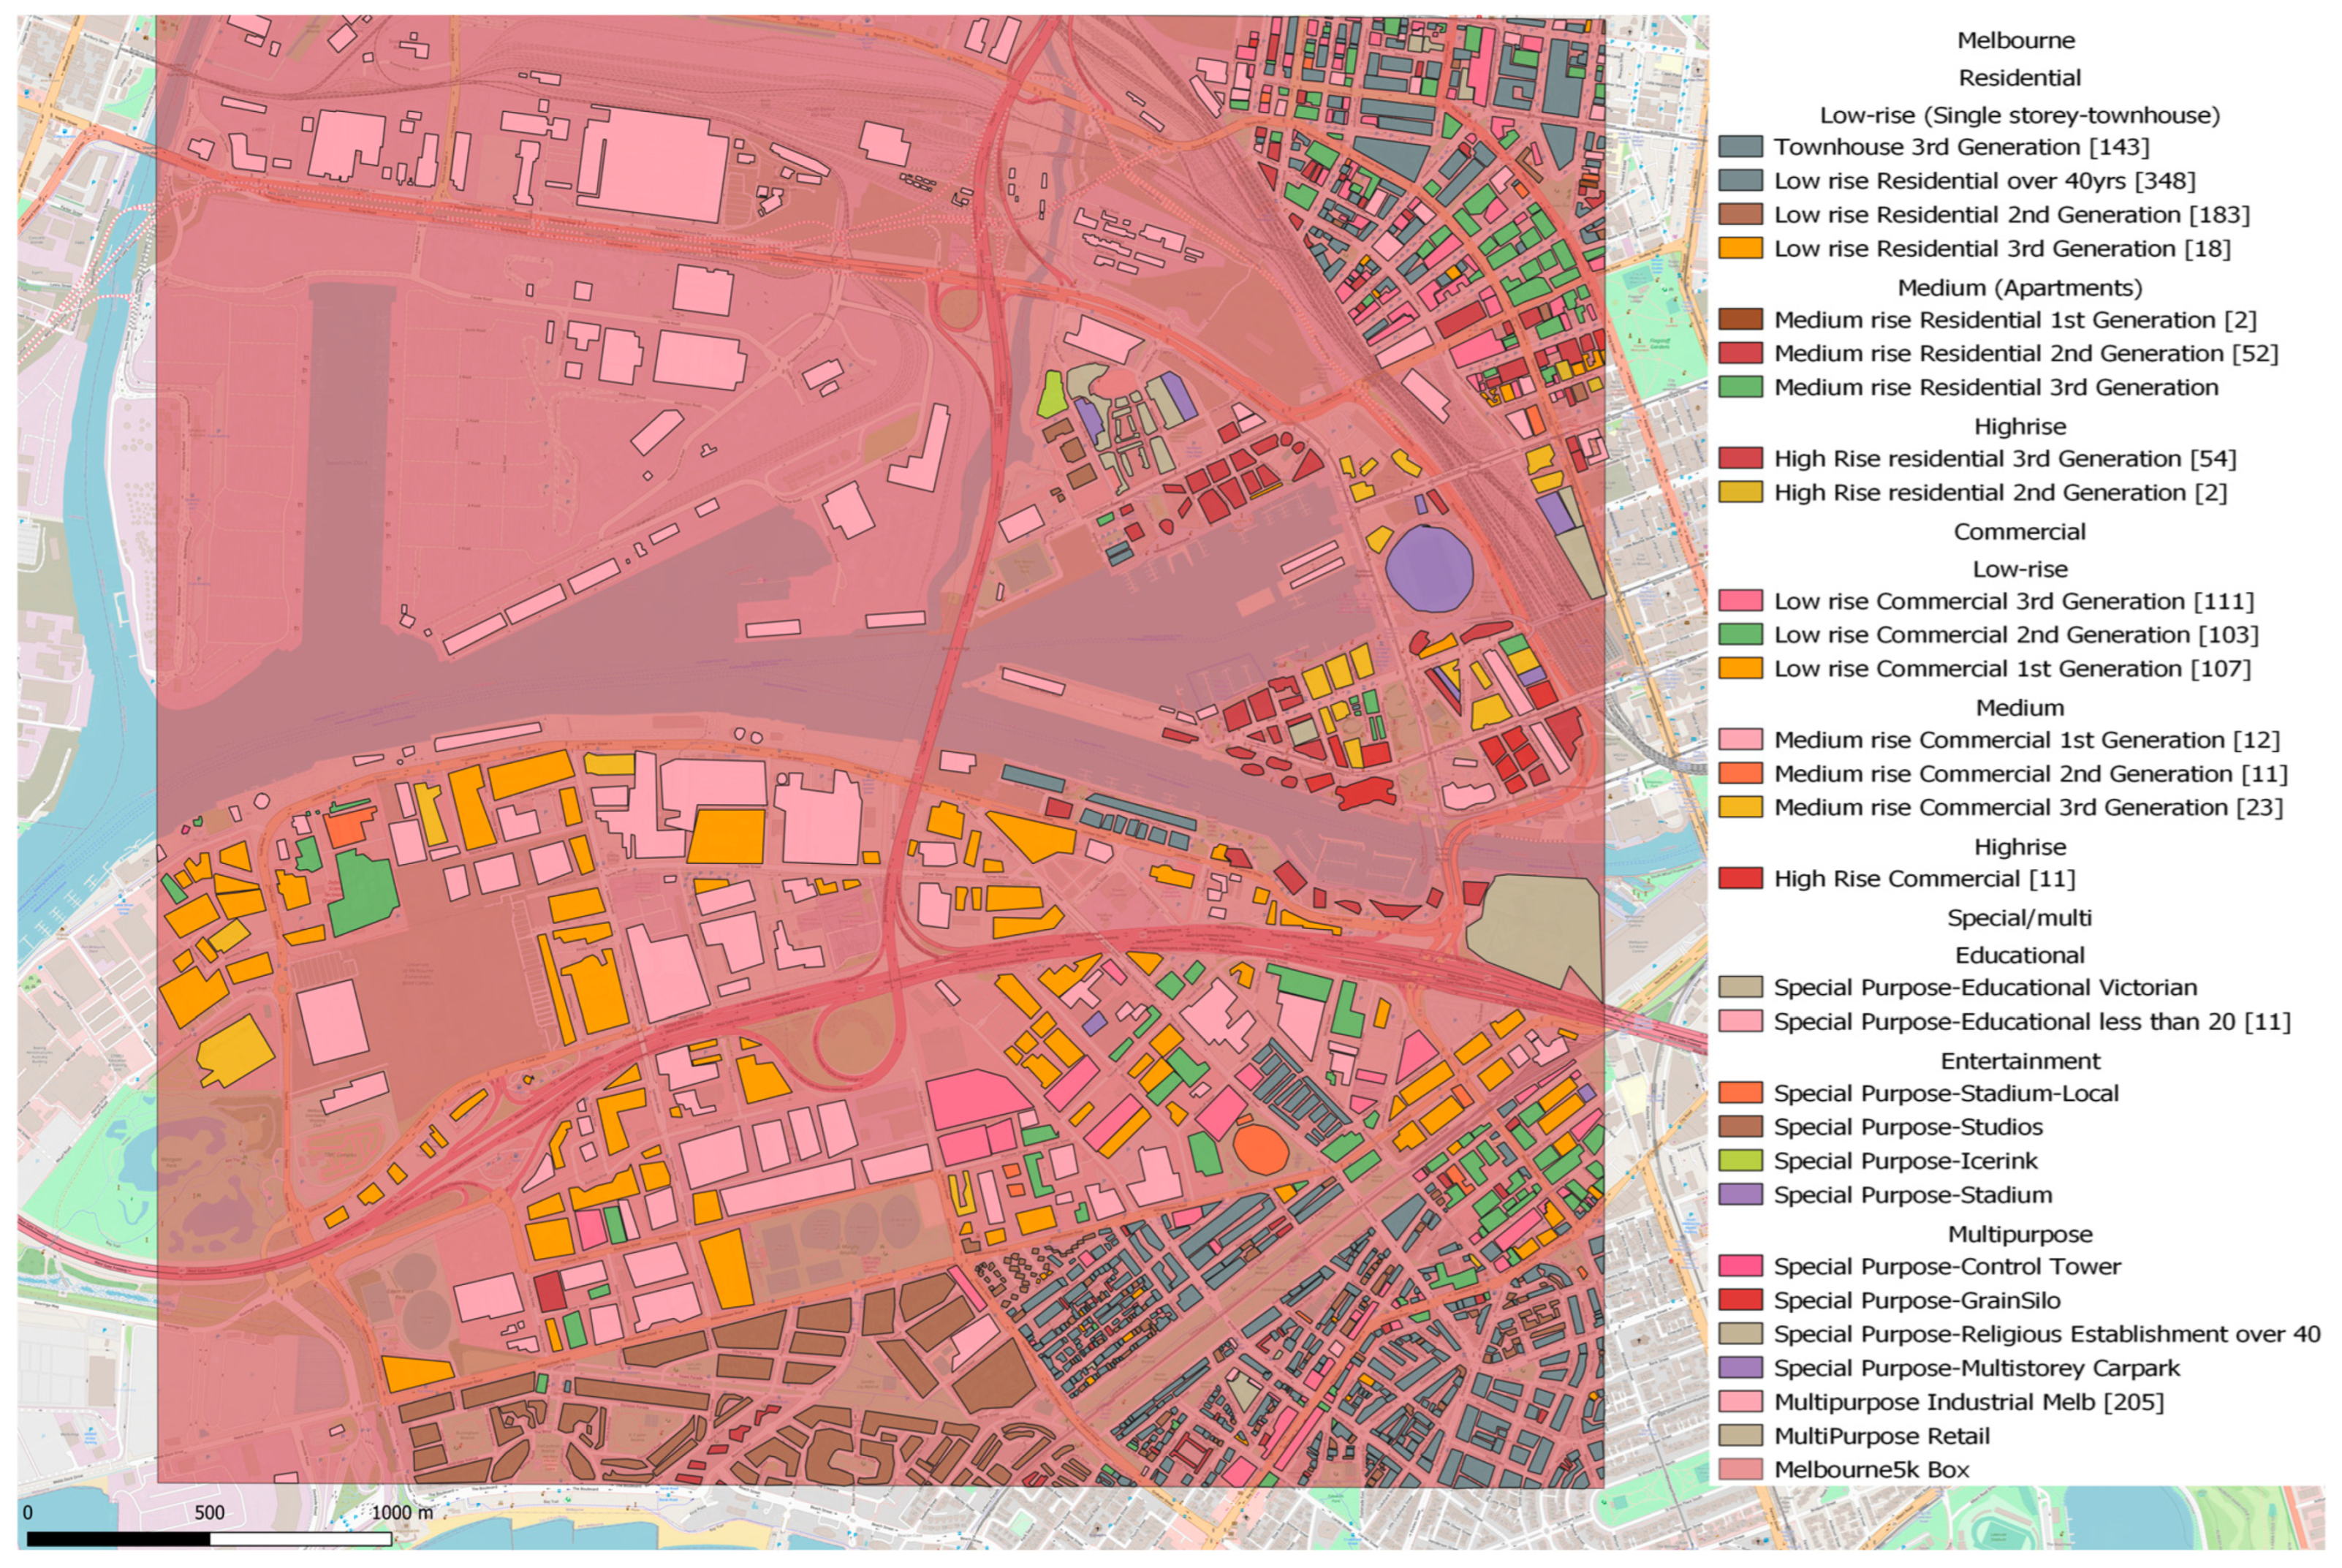
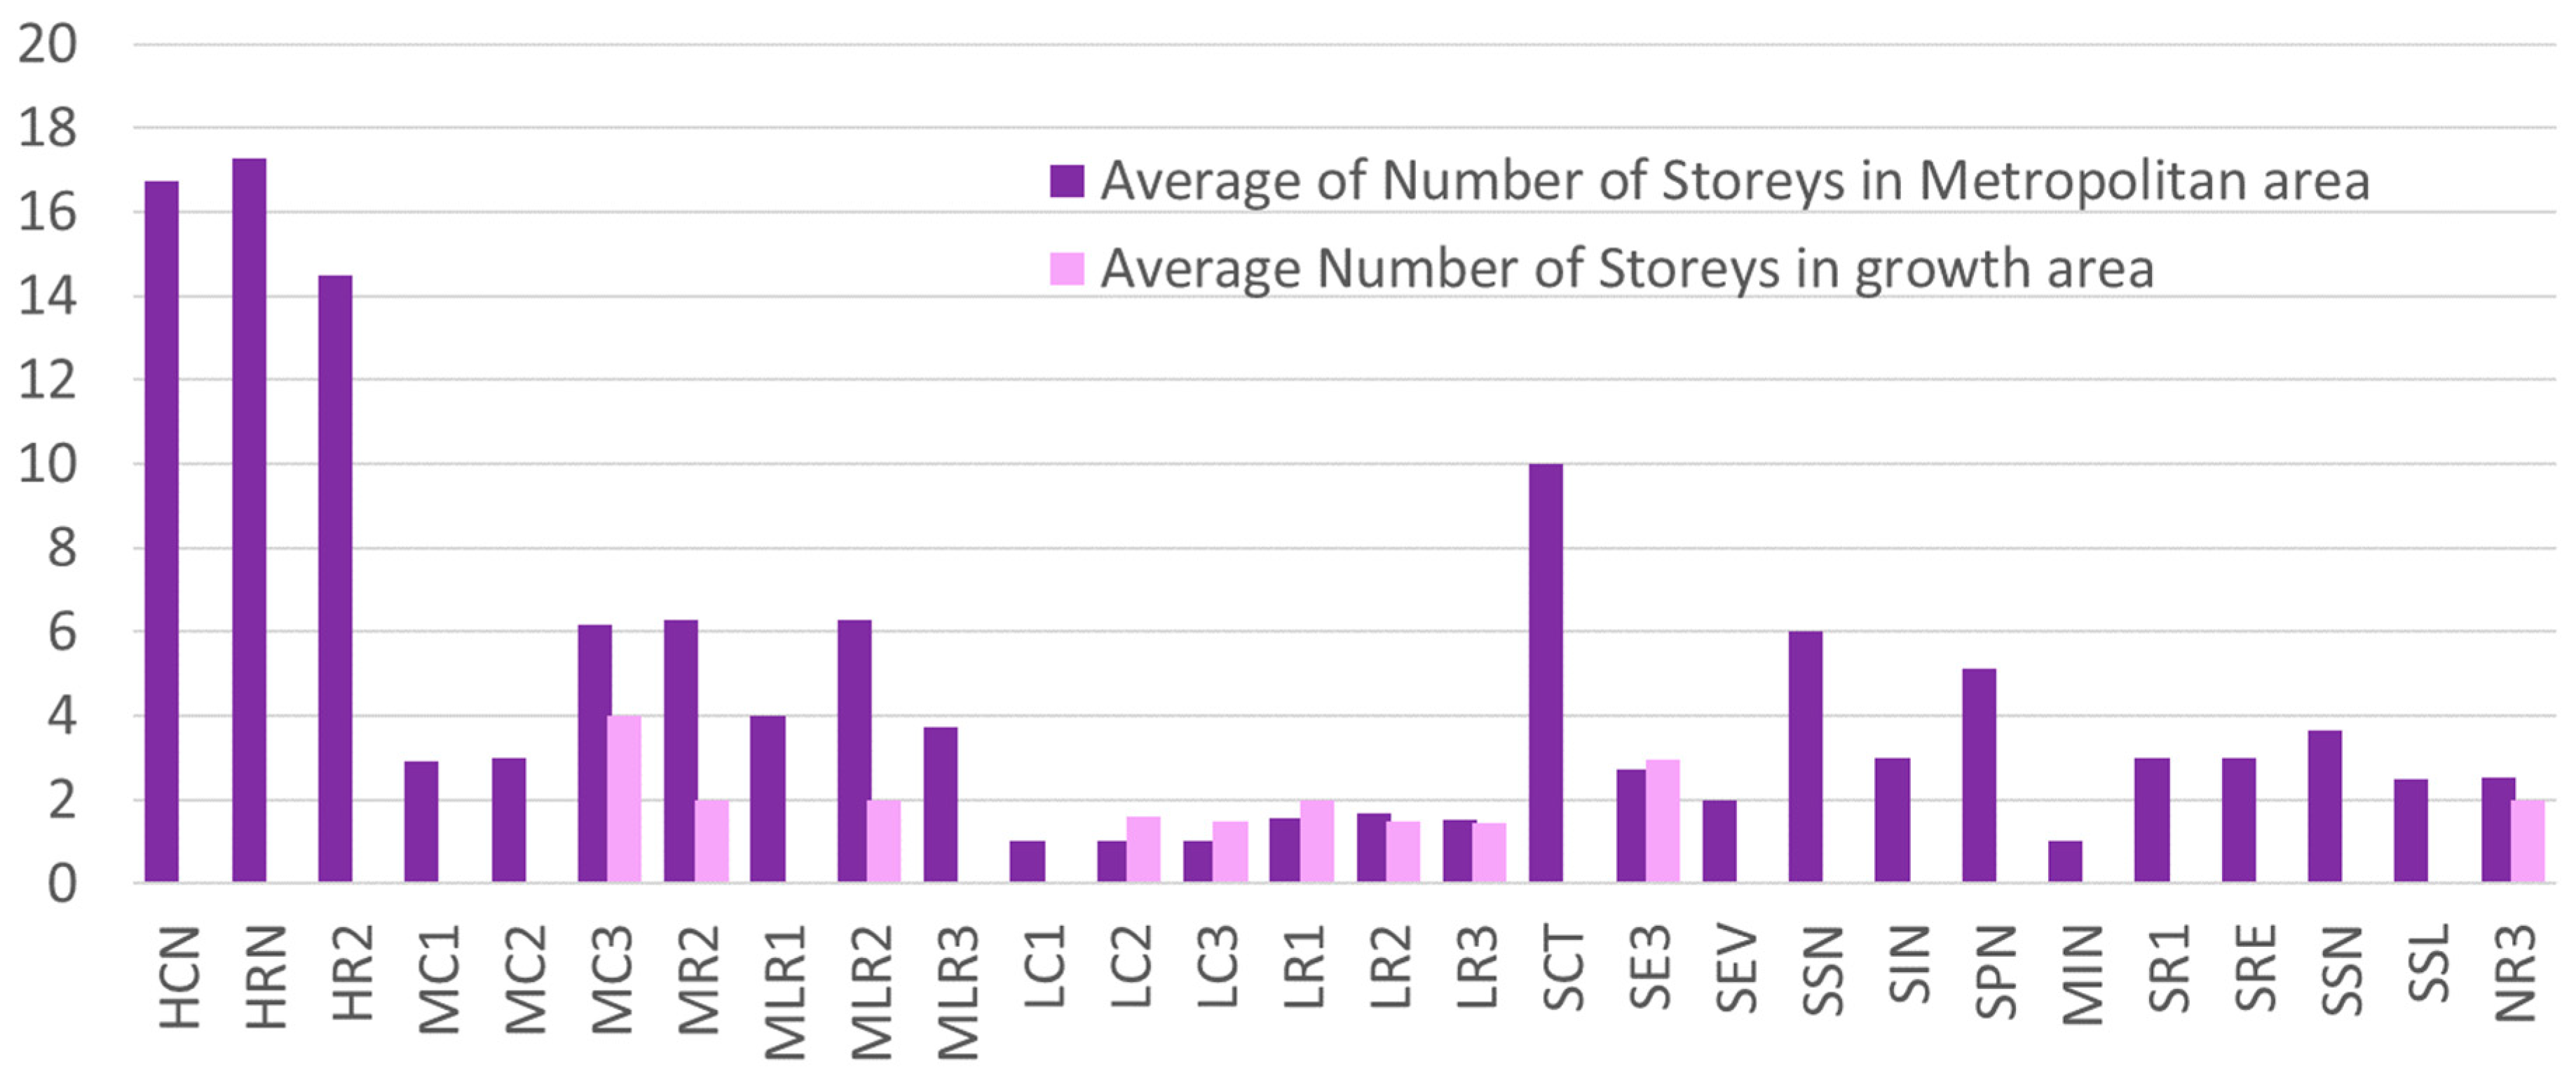
5.1. Spatial Distribution
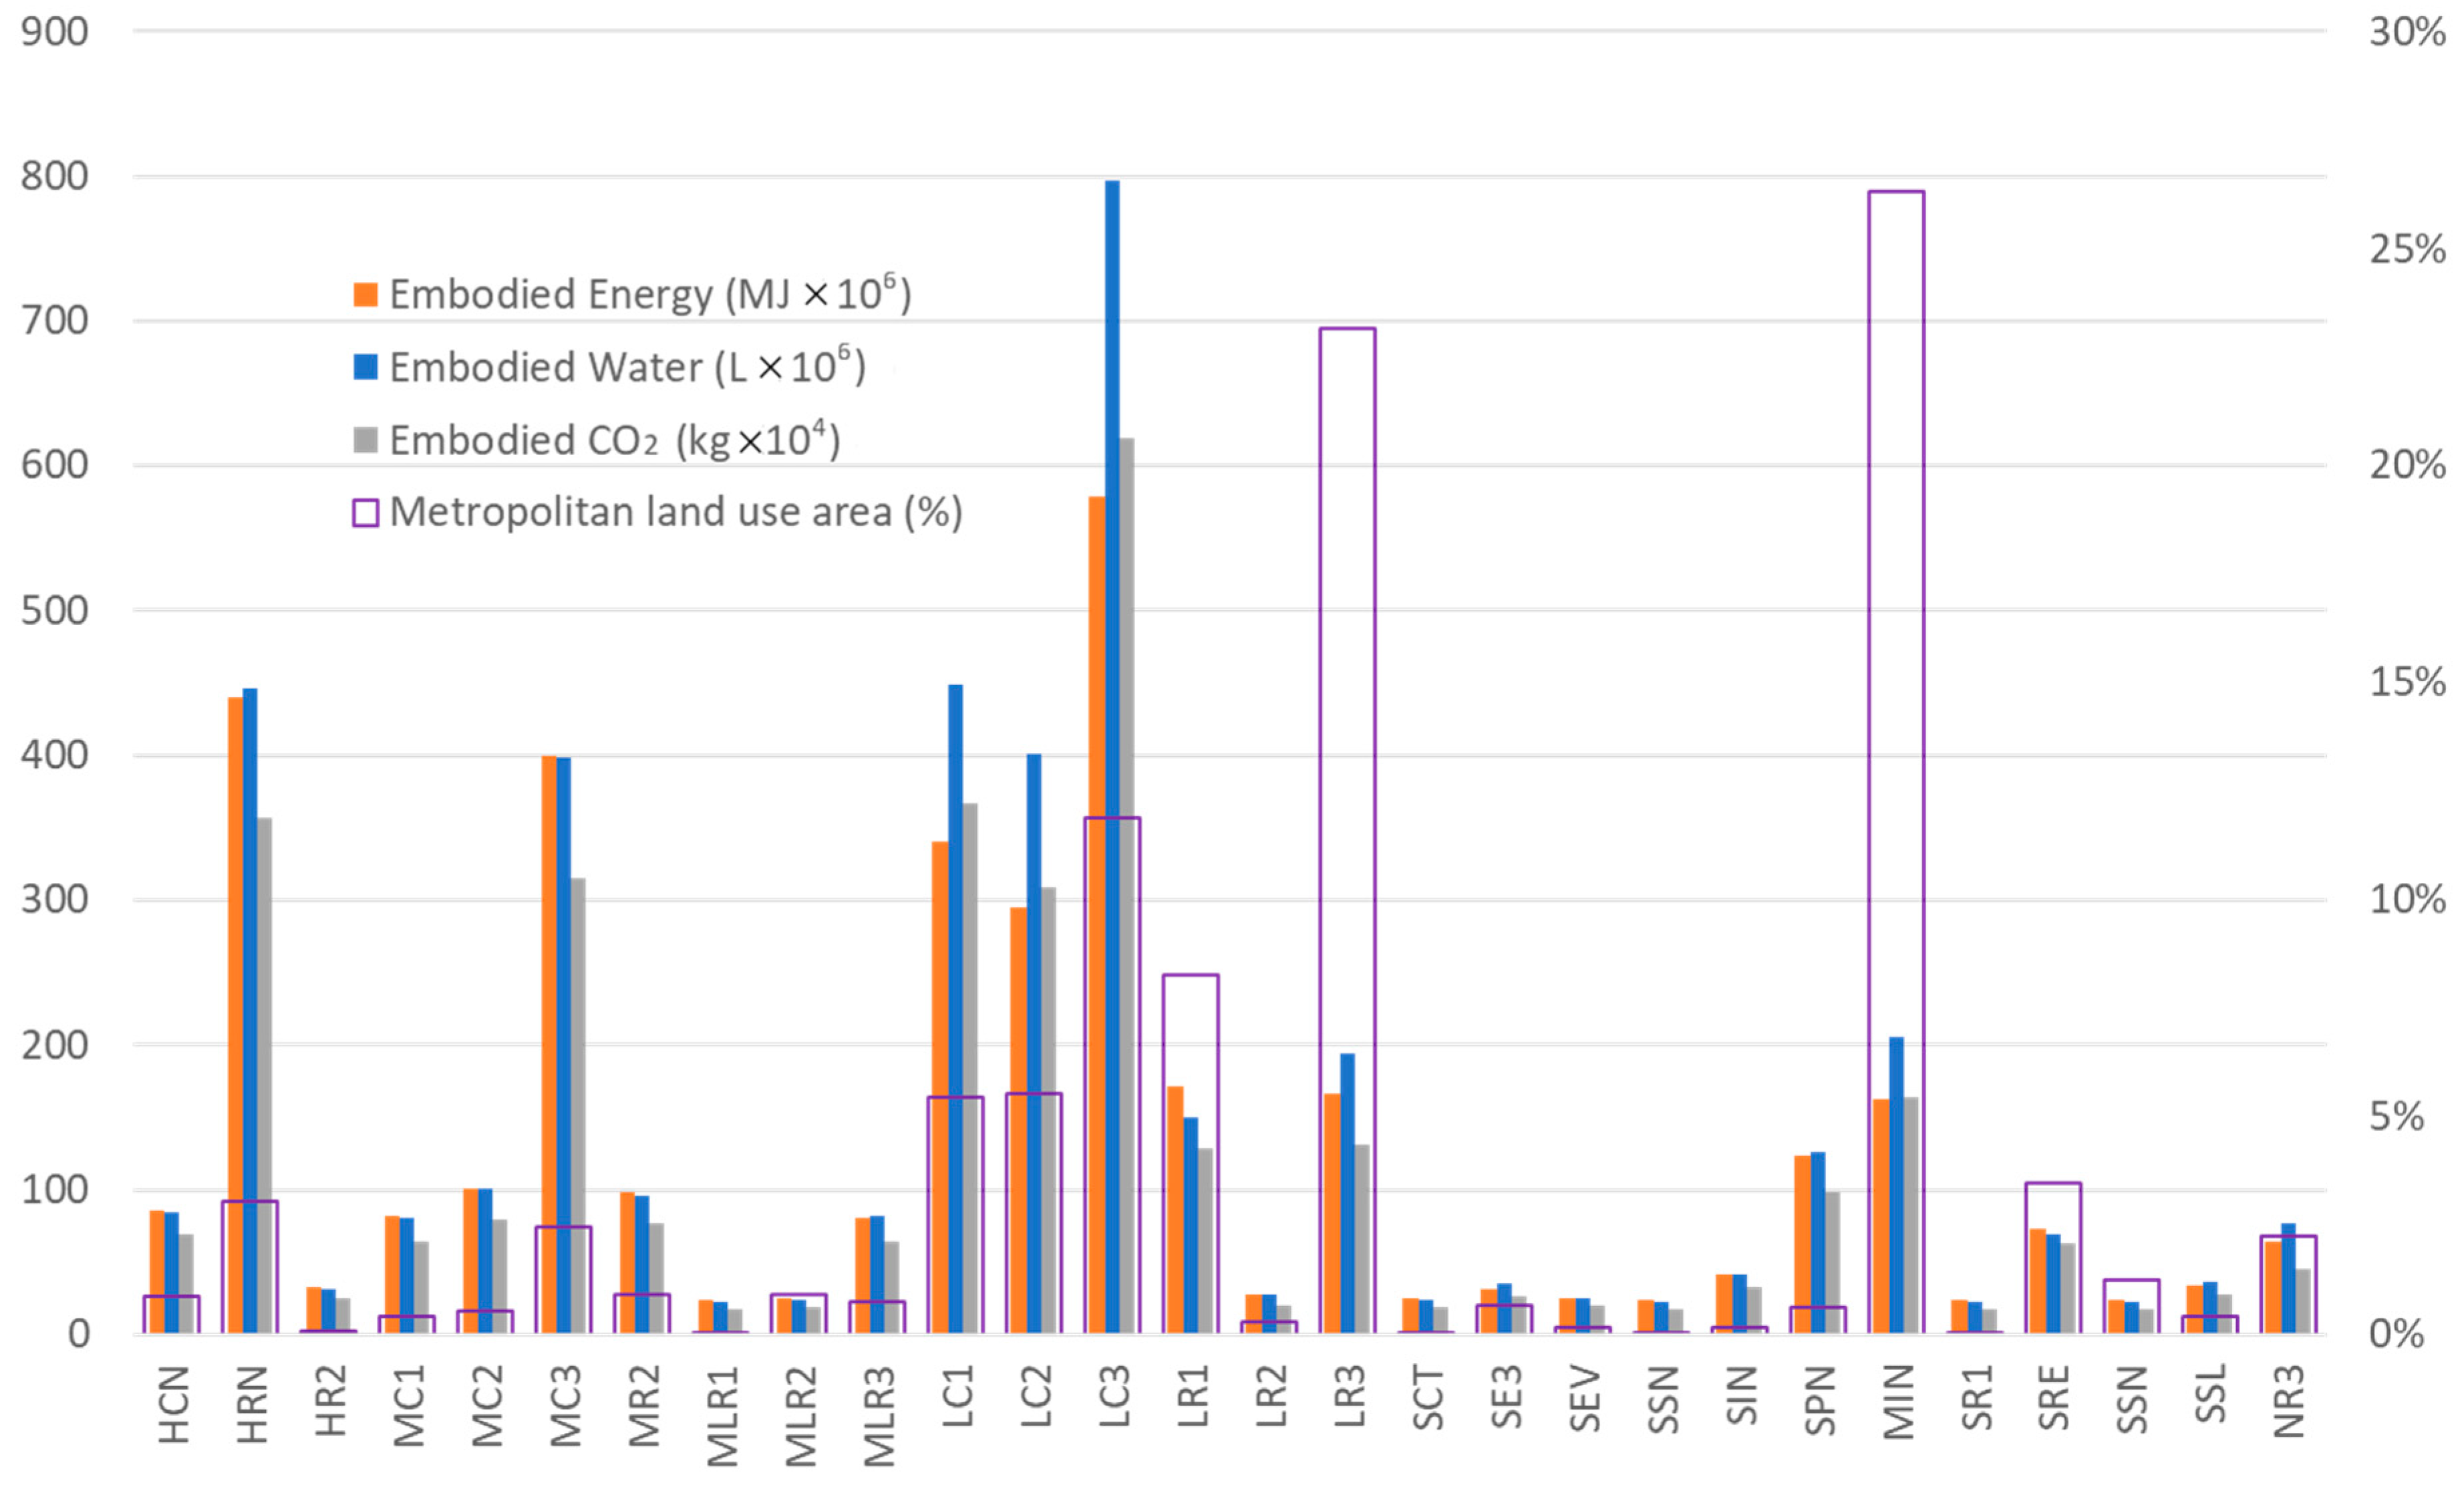
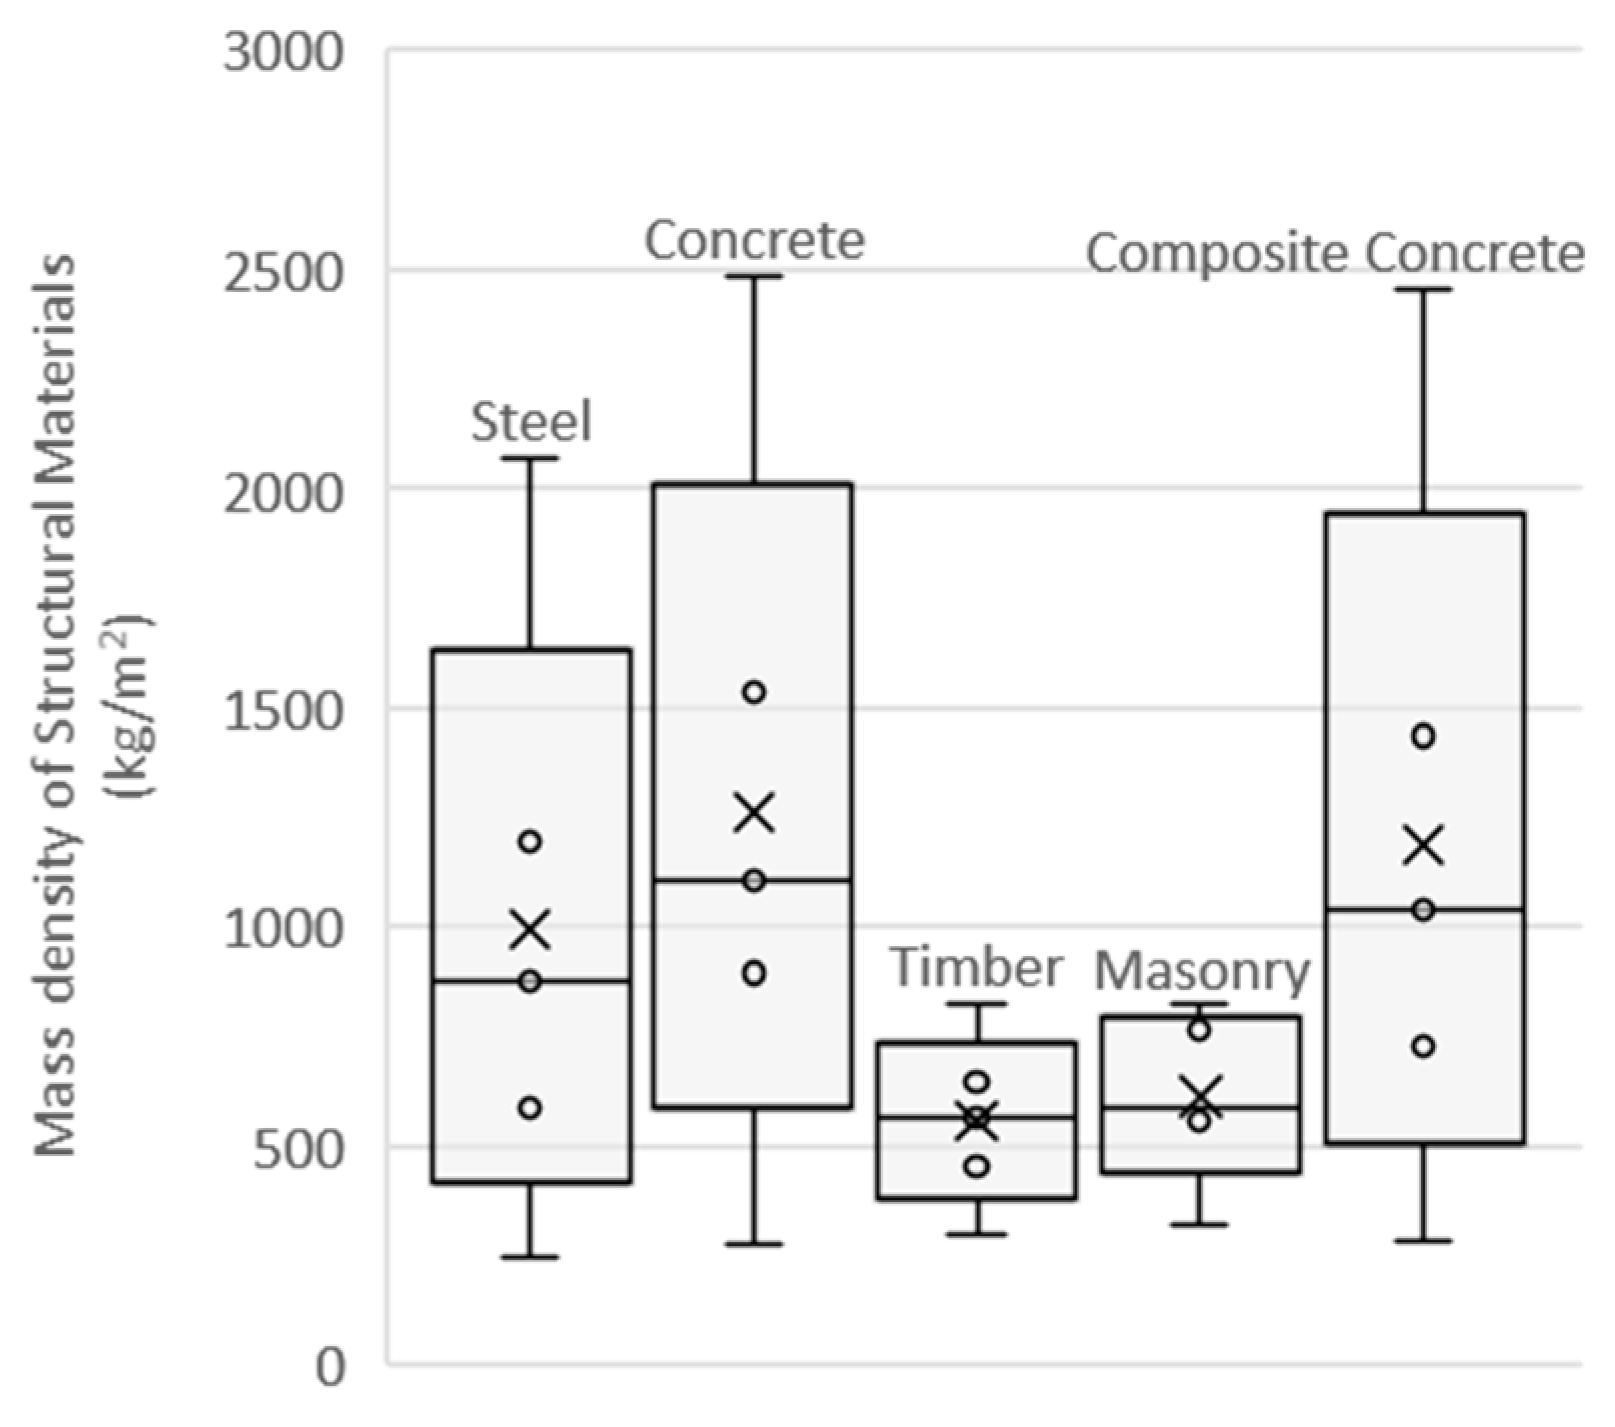
5.2. Embodied Materials
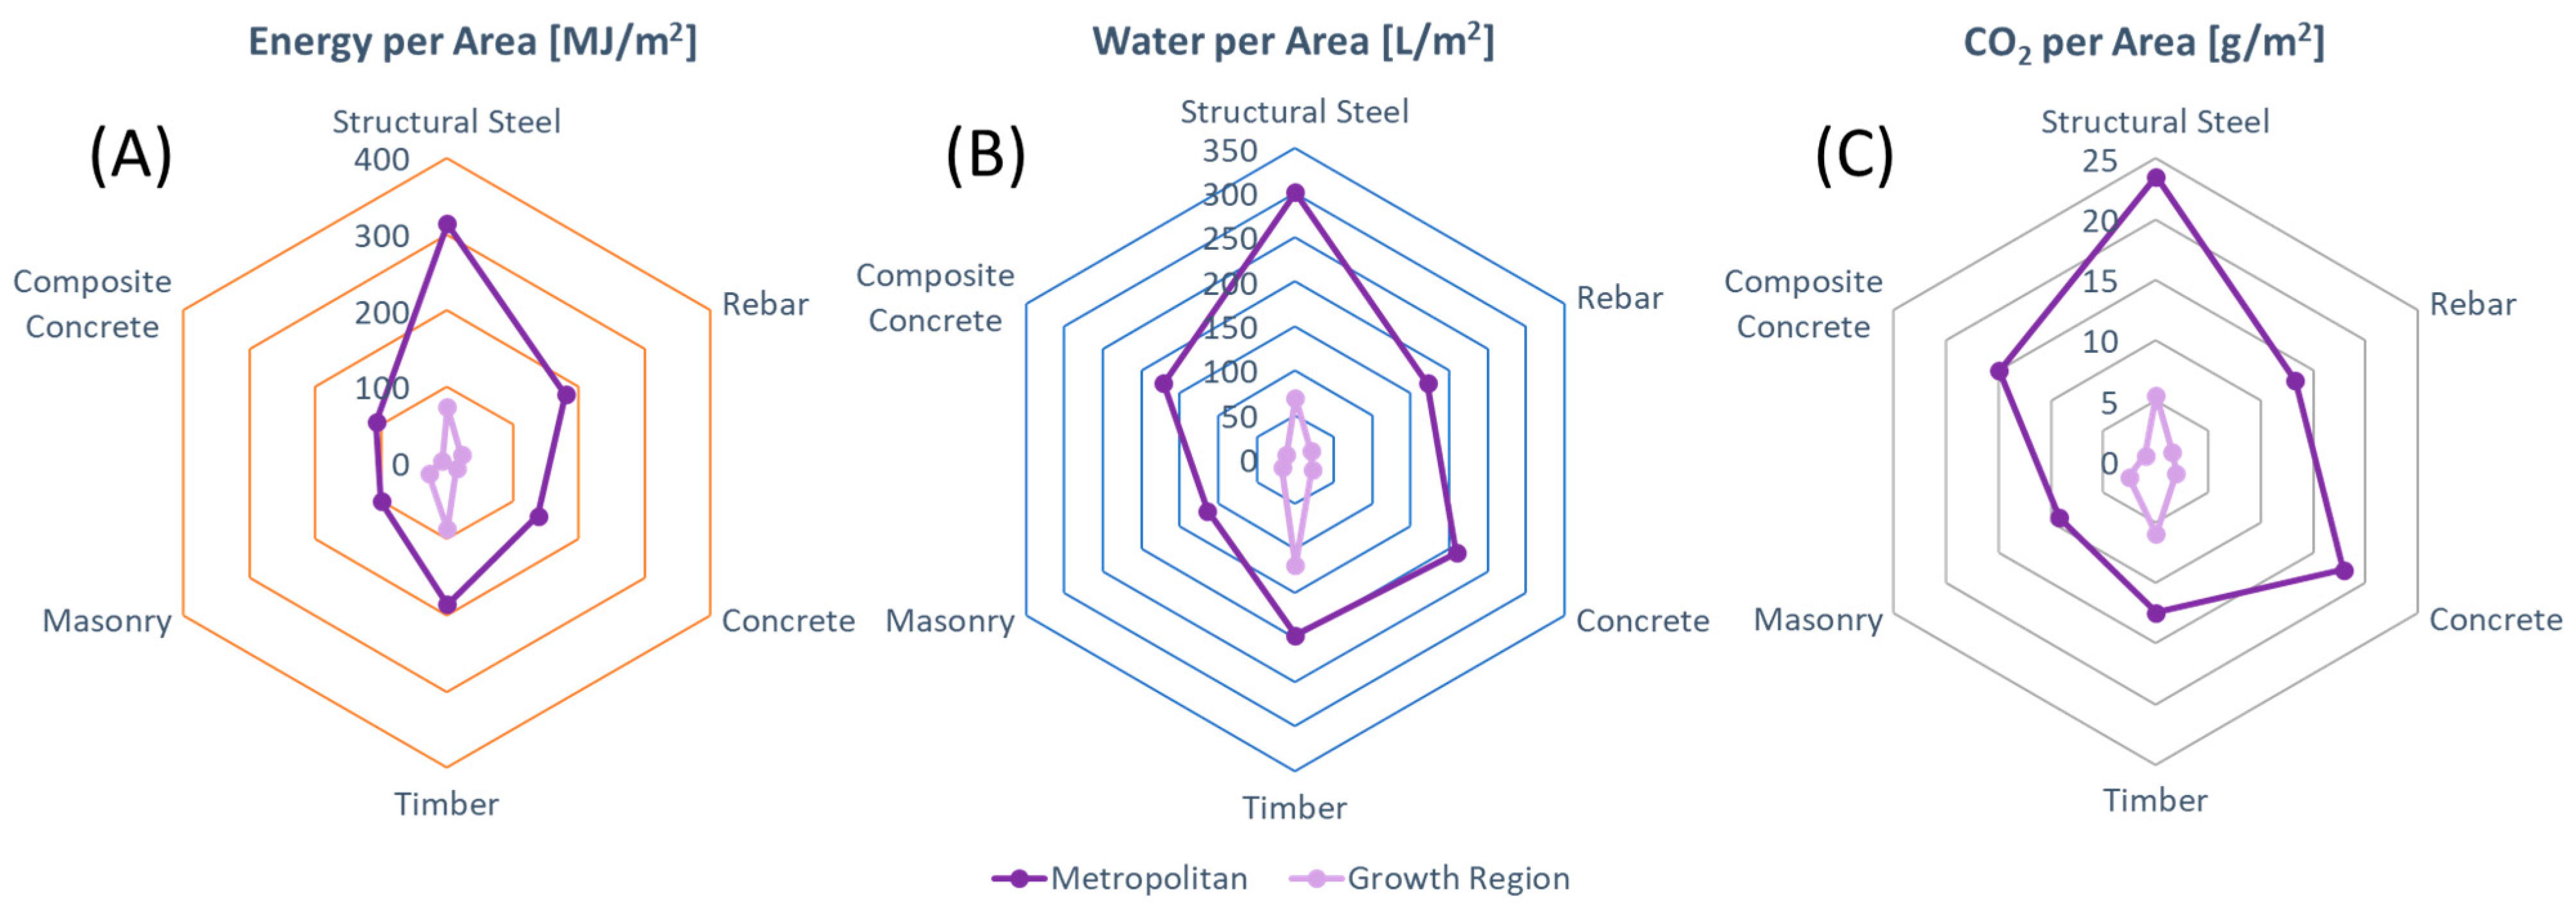
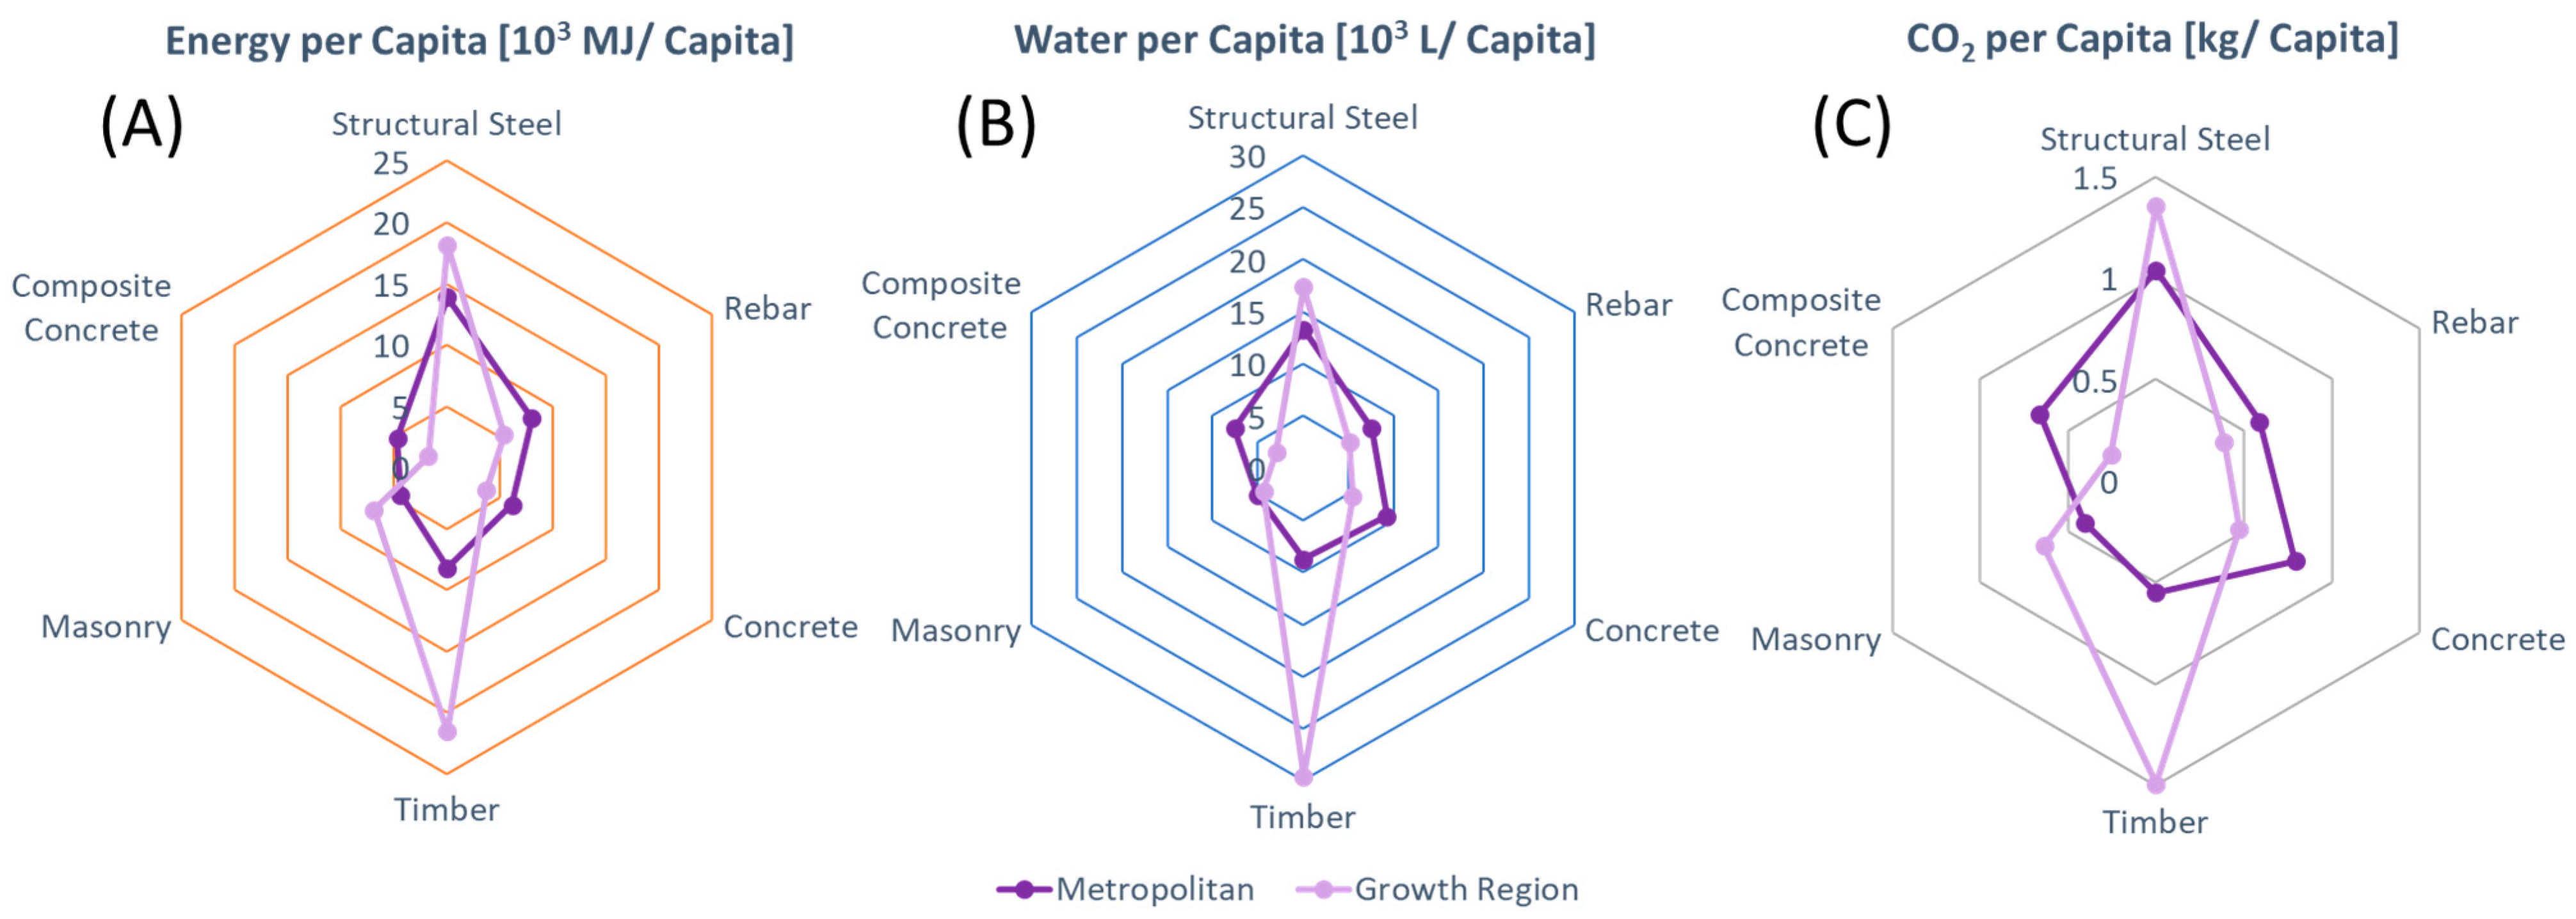
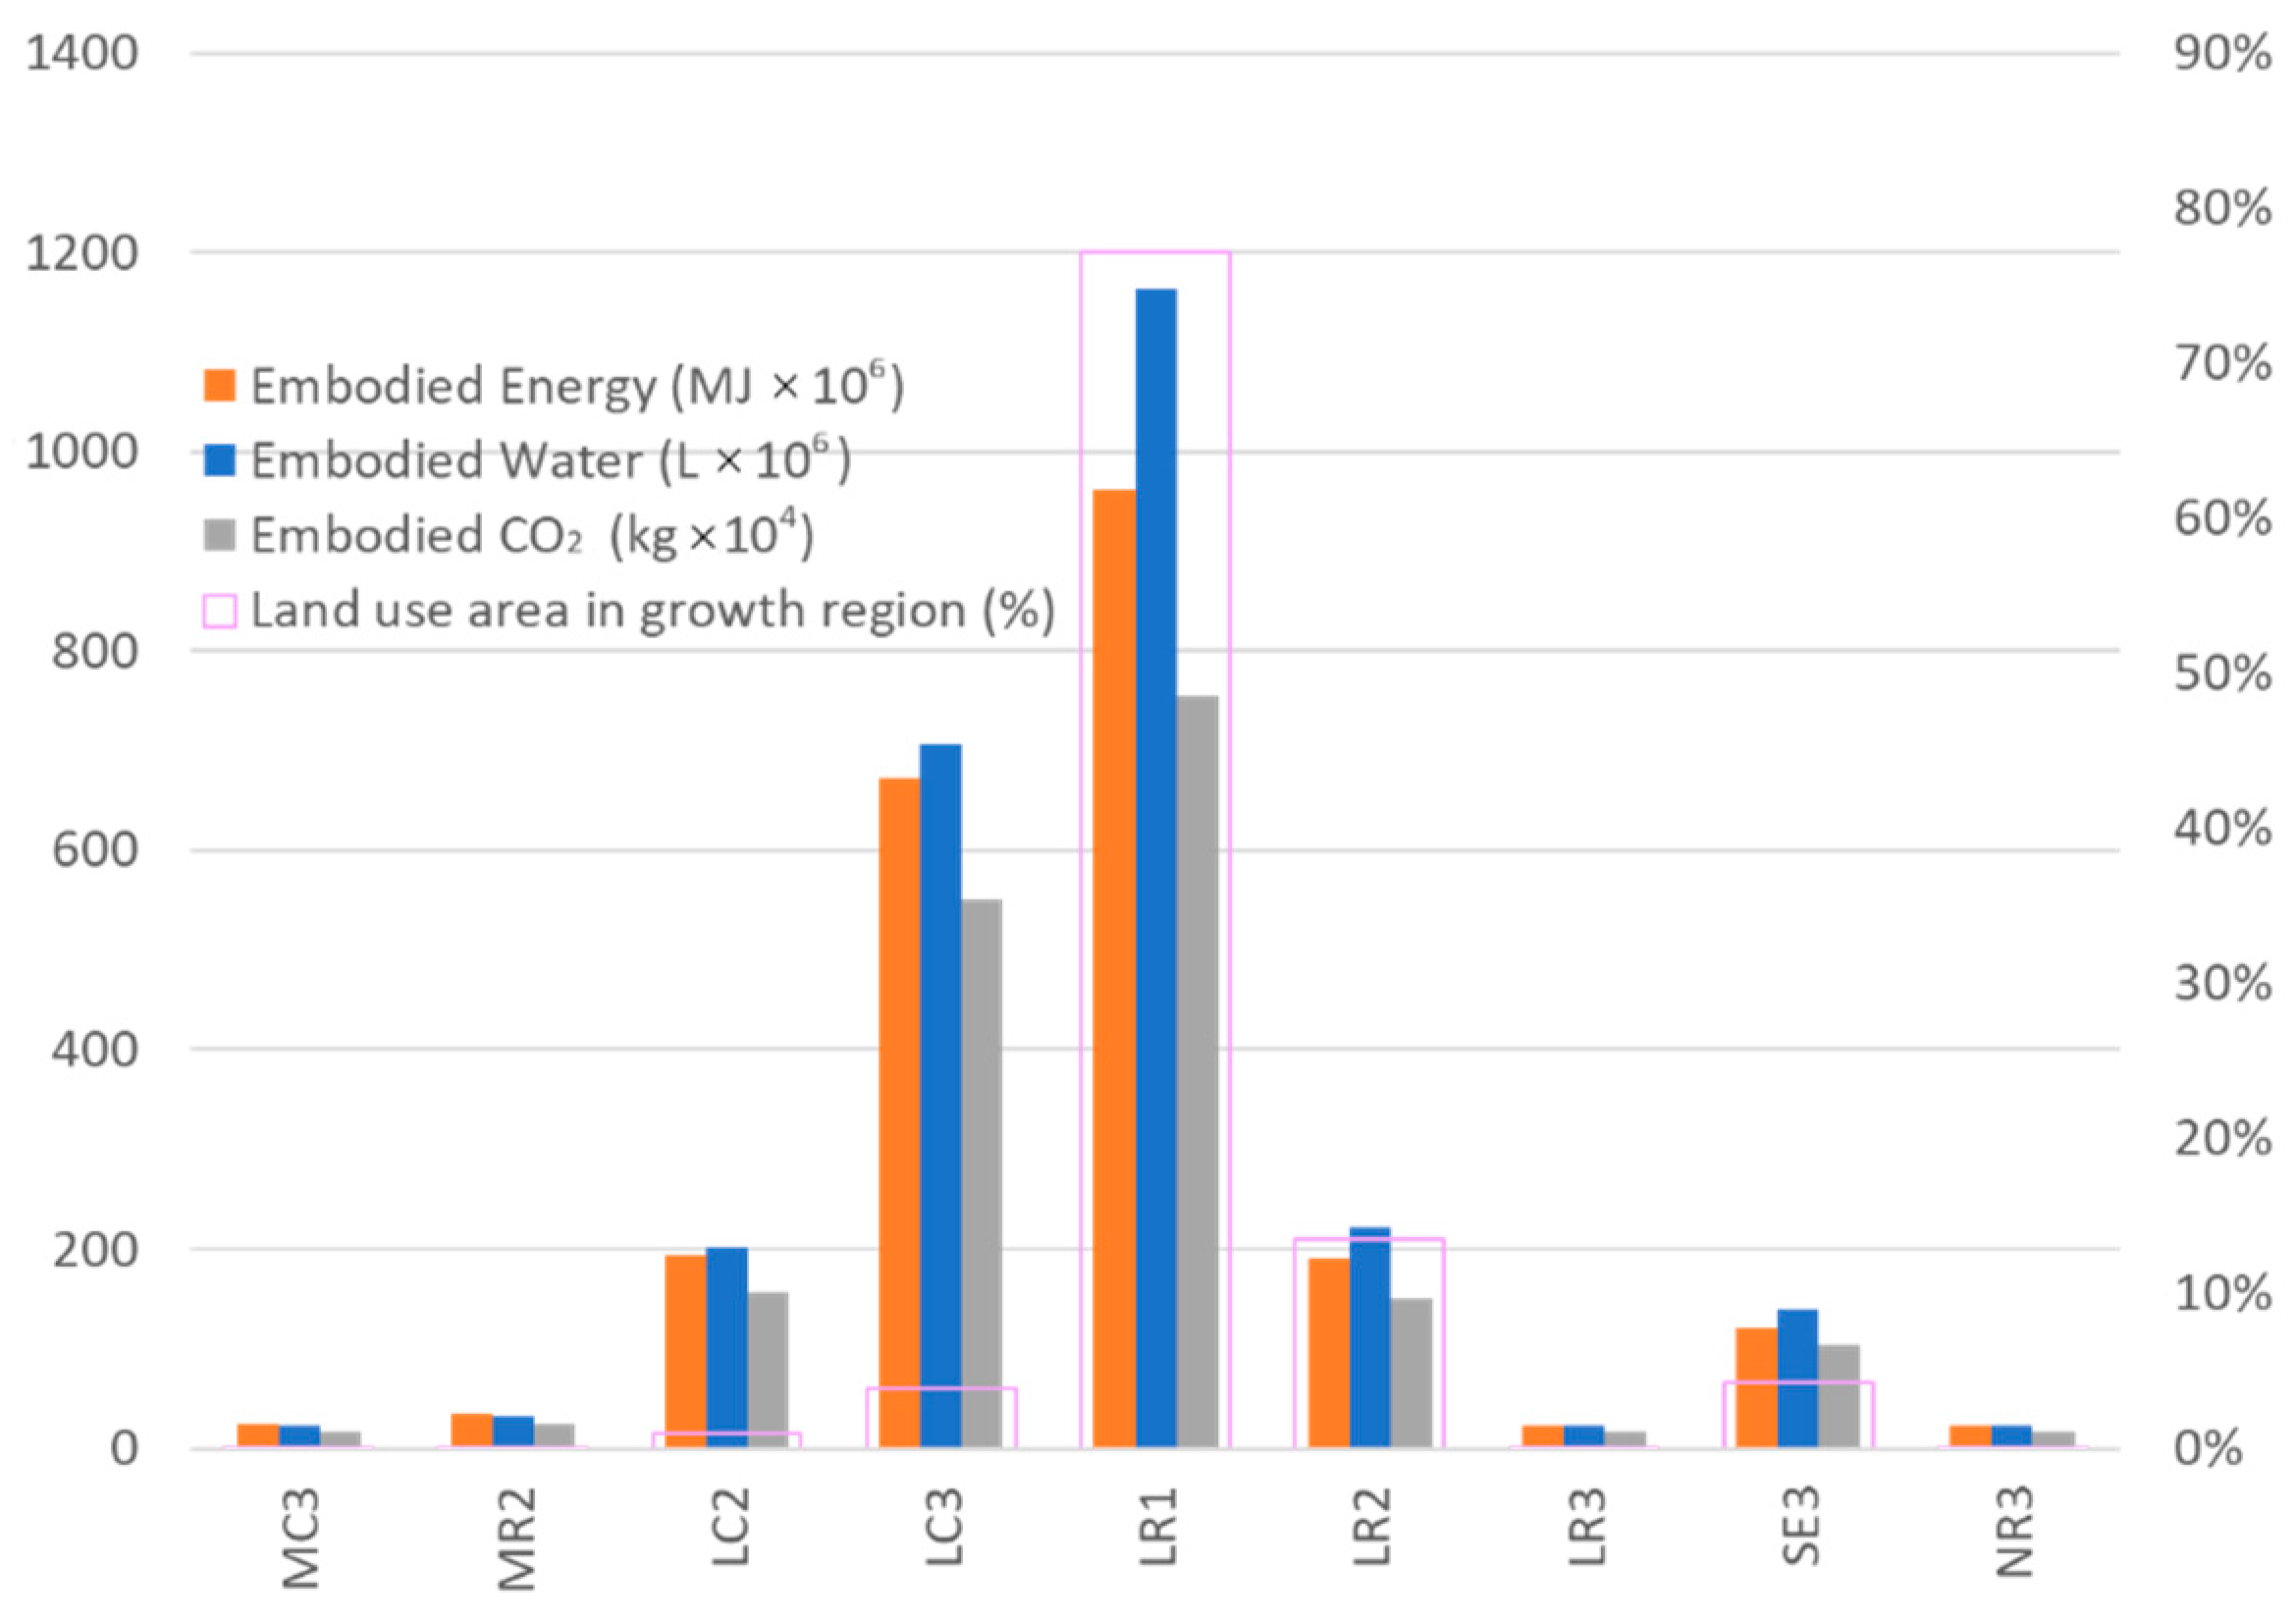
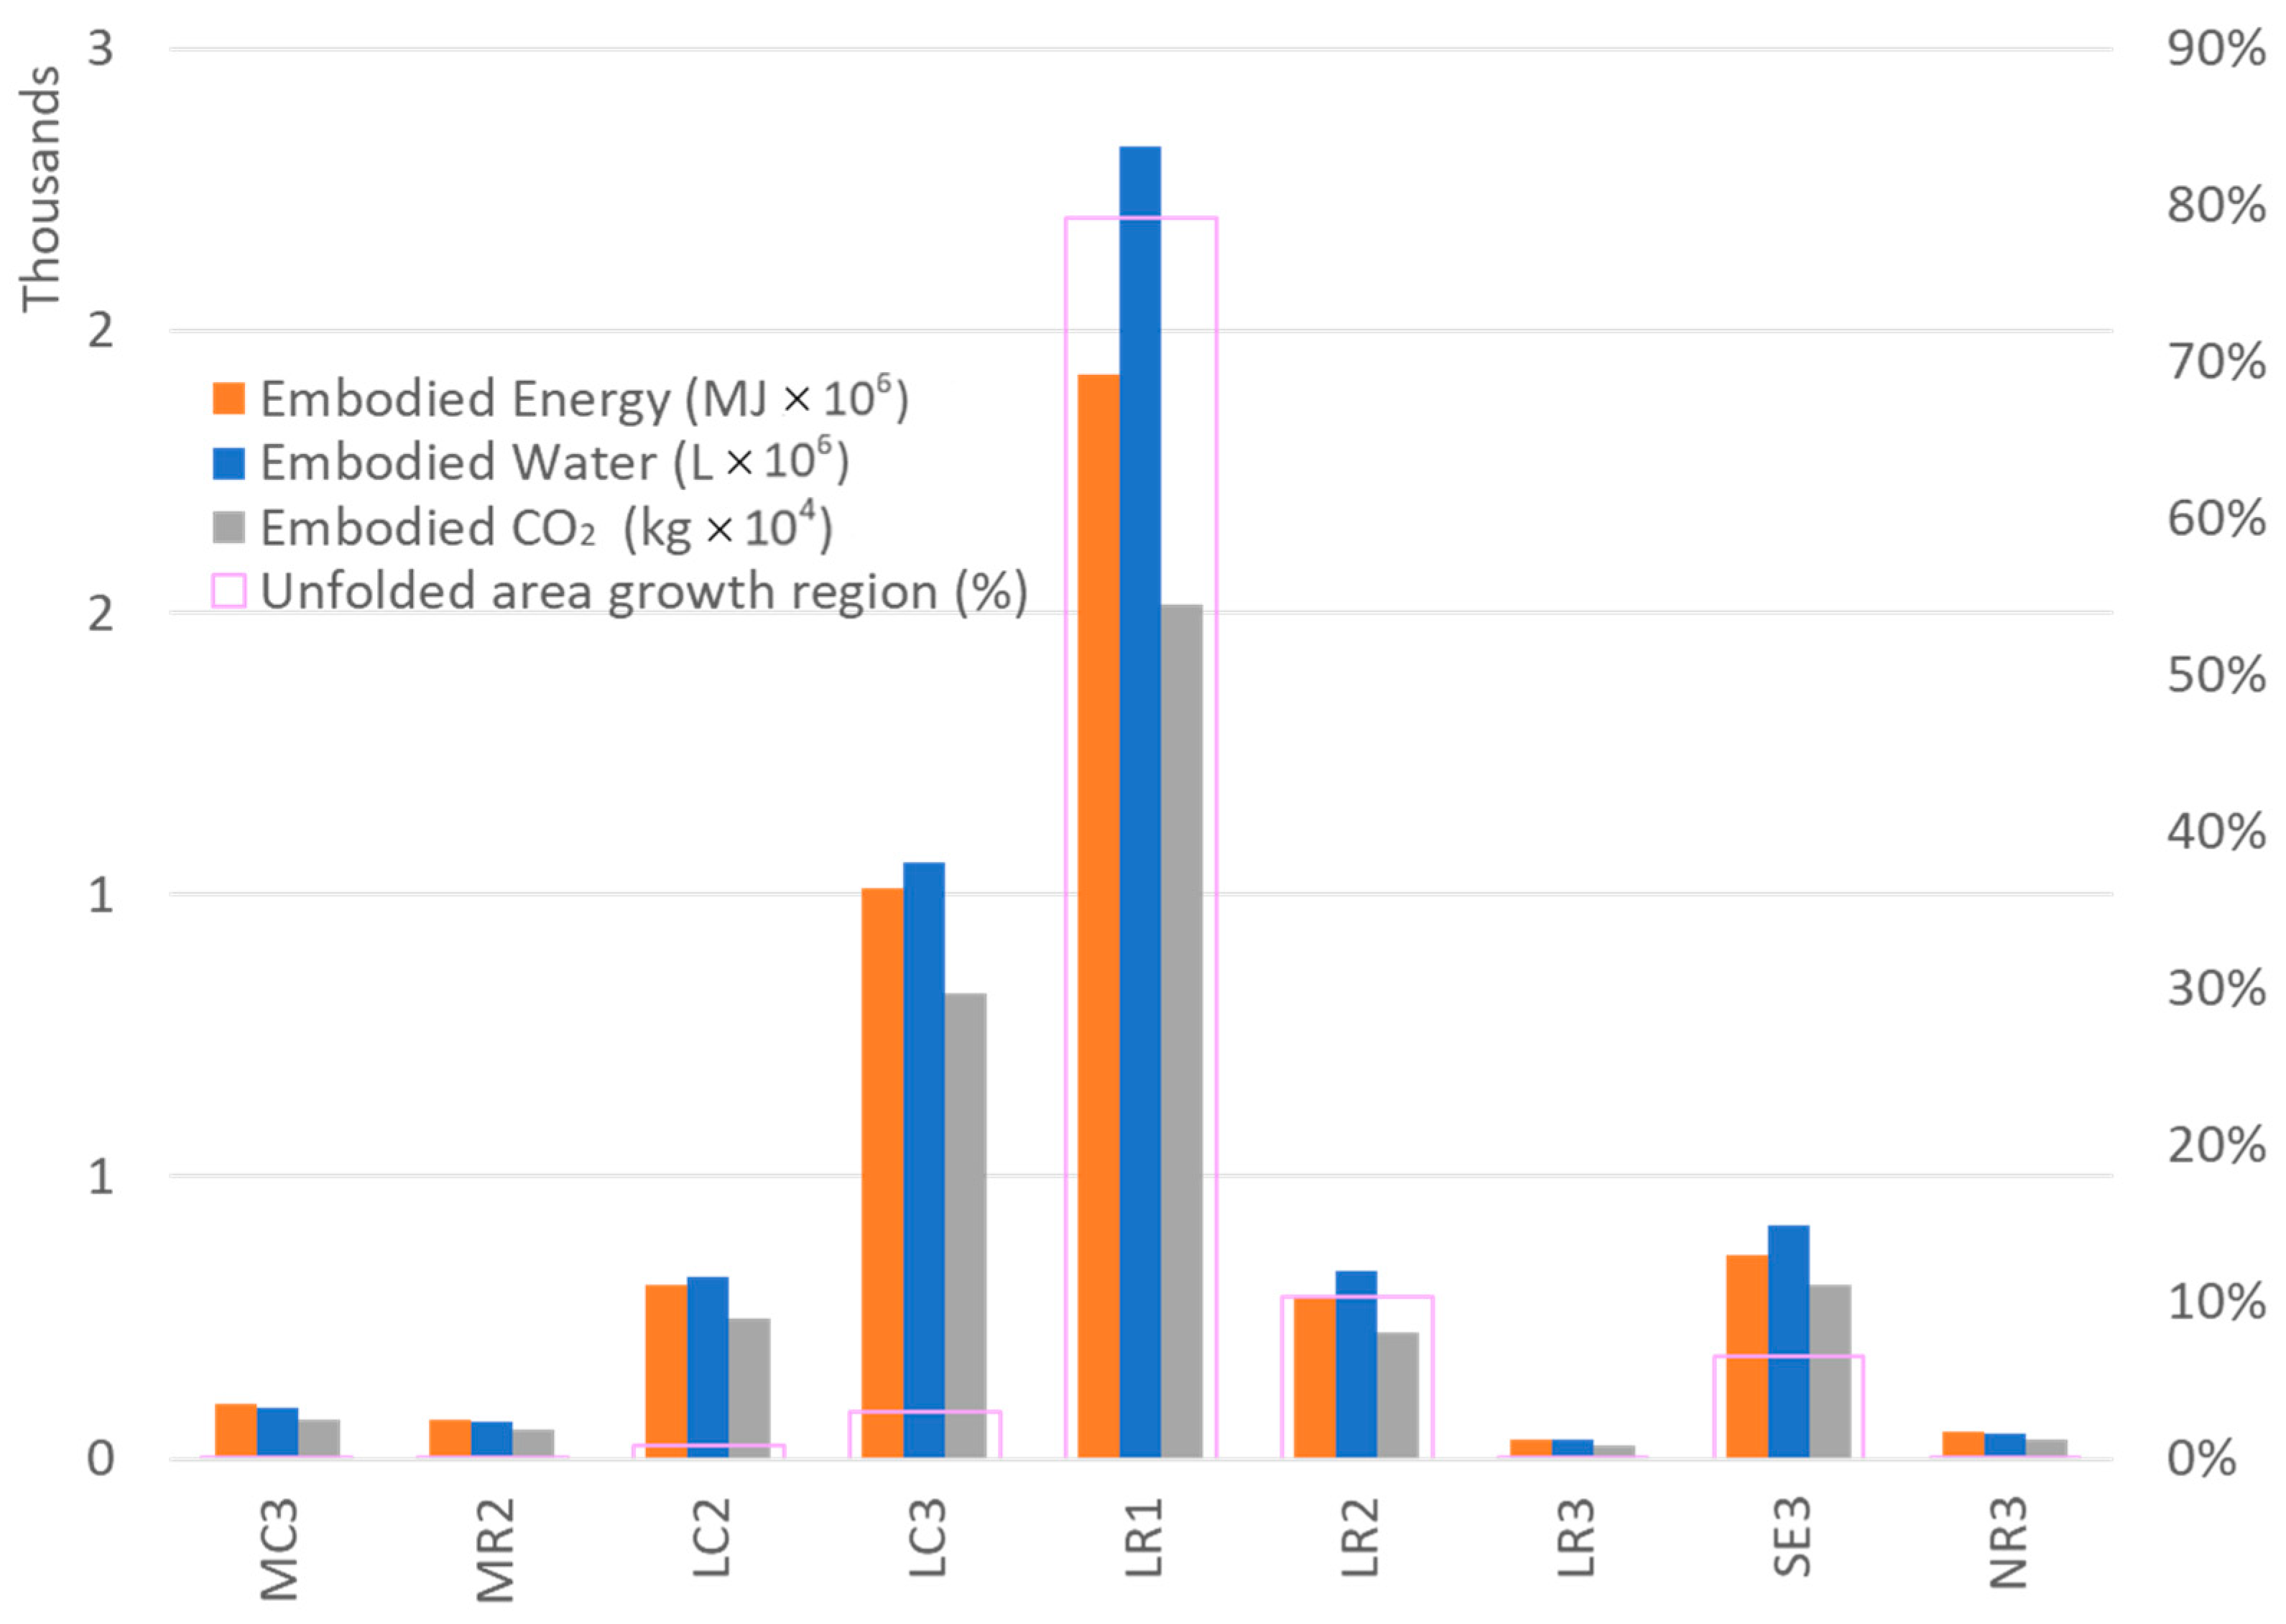
5.3. Densities of Attributes
6. Discussion
7. Conclusions and Recommendations
Author Contributions
Funding
Informed Consent Statement
Conflicts of Interest
Appendix A

| Description | Example | Visual Identifiers |
|---|---|---|
| High-rise commercial | 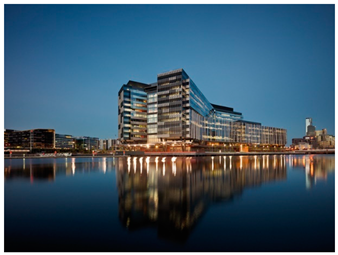 [70] | Predominantly glass and steel wall Large footprint Office precinct Built-in last 20 years Typically, high-rise construction over 15 storeys |
| High-rise residential | 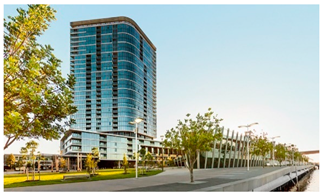 | Predominantly glass and steel wall Large footprint Residential users High-rise construction over 15 storeys Built-in last 20 years |
| High-rise residential 2nd Generation | 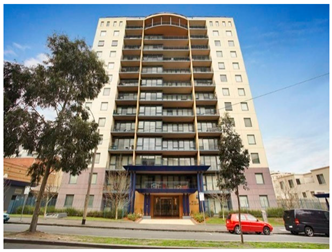 | Primarily Concrete Wall Large footprint Residential users High-rise construction over 12 storeys Over 20 years old, less than 50 |
| Low-rise commercial 1st Generation |  | Brick Finish 1–2 storeys tall Pre-war construction Inner Suburbs Location Commercial land-use |
| Low-rise commercial 2nd Generation | 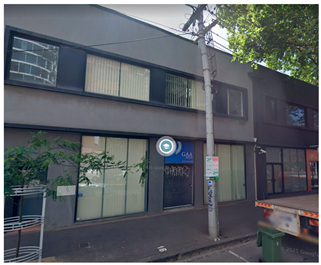 | Over 20 years old, less than 50 Rendered wall finish Small window to wall ratio Low-rise, less than 2 storeys Small footprint Commercial land-use |
| Low-rise commercial 3rd Generation | 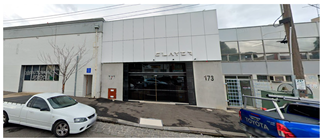 | Less than 20 years old Concrete wall Steel sheet roofing Small window to wall ratio Low-rise, less than 2 storeys Small footprint Commercial land-use |
| Low-rise residential 1st Generation |  | Tin/Tile roof Inner Suburbs of Metropolitan Wrought ironwork Brick finish Pre-war construction was largely Victorian |
| Low-rise residential 2nd Generation | 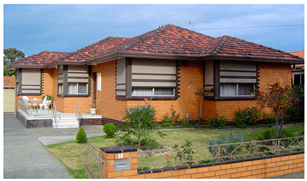 | Tile roof Metropolitan, Port residential region, sth Williamstown road Central Werribee, Older constructions growth region, Variable footprint, Larger in Growth Region, more condensed, “workers” housing Port Metropolitan, Terraces vs Bungalow Not Townhouse as predominantly no incorporated garage |
| Low-rise residential 3rd Generation |  | Colourbond steel/Tile roof More frequent in growth regions A greater ratio of built area to green space versus old constructions Typically brick timber construction with masonry veneer |
| Medium-rise Commercial 1st Generation | 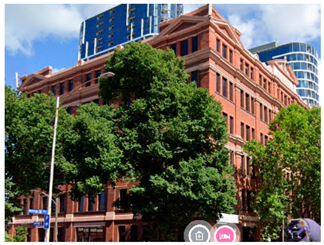 | Brick Finish 4 + Storeys tall Pre-war construction Inner Suburbs Location |
| Medium-rise Commercial 2nd Generation | 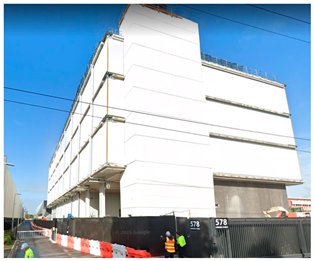 | Industrial location 4 + Storeys tall Concrete and steel are predominant materials |
| Medium-rise Commercial 3rd Generation | 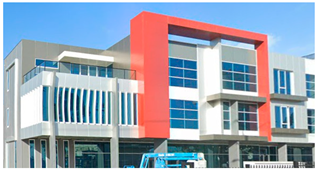 | Industrial location 4 + Storeys tall Concrete and steel are predominant materials Increased mixed-use with included office space |
| Medium-rise residential 1st Generation | 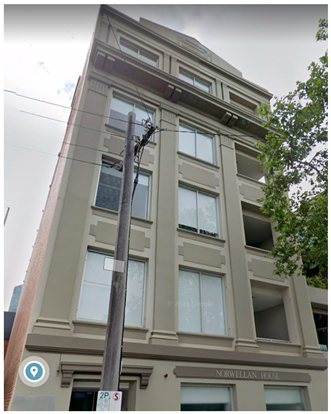 | 4–5 Storeys tall Masonry/Brick finish Inner Suburb location Residential use Some repurposed from different earlier use |
| Medium-rise residential 2nd Generation | 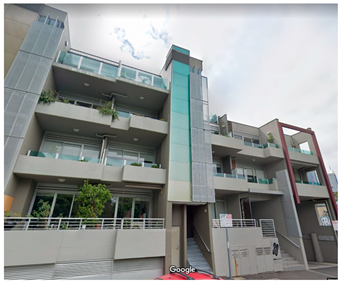 | 4–5 Storeys tall Concrete Predominant feature Brickwork in addition in portions Larger balcony comparative to 1st generation Residential use |
| Medium-rise residential 3rd Generation | 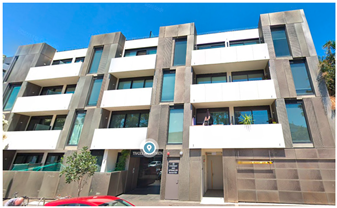 | 4–5 Storeys tall Concrete Predominant feature Less than 20 years old Increased window: wall ratio |
| Special Purpose Control tower | 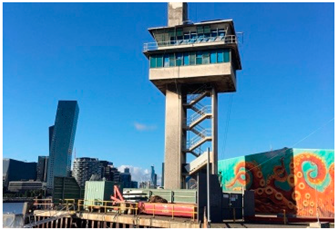 | Single land-use item Concrete construction A large amount of material for small footprint owing to high elevation |
| Special purpose educational 3rd Generation | 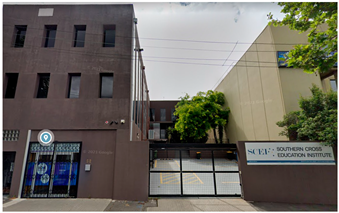 | Less than 20 years old Concrete and masonry wall Steel sheet roofing Small window to wall ratio Low-rise, typically 2 storeys Located amongst residential areas |
| Special purpose educational 1st Generation | 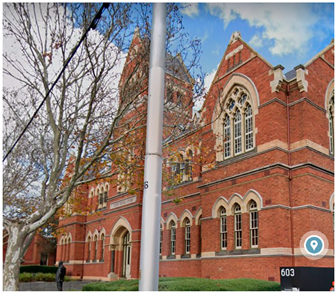 | 4–5 Storeys tall Masonry/Brick finish Inner Suburb location Educational use Typically located near educational facilities |
| Special purpose Grain Silo | 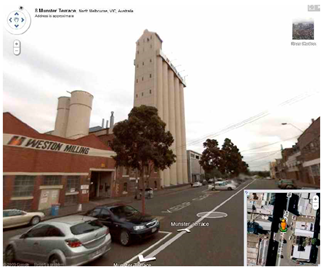 | Single land-use item Concrete construction A large amount of material for a small footprint owing to a size proportional to the built area |
| Special Purpose Ice-rink | 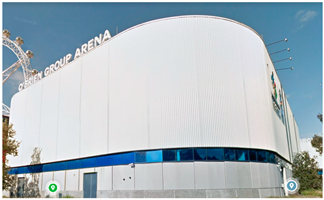 | Single land-use item Reinforced Concrete construction Steel sheet wall |
| Special Purpose Multistorey car park | 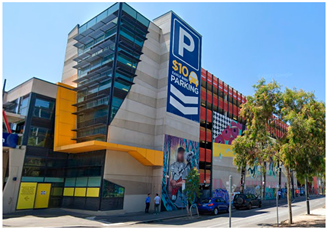 | Reinforced Concrete and composite concrete construction Exposed concrete walls Minimal use of Enclosed spaces |
| Mixed Purpose Industrial | 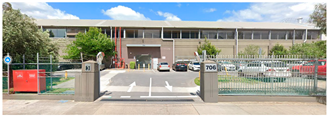 | 2 Storeys tall Concrete, steel construction predominantly Mixed-use office and warehousing typically Located in industrial areas |
| Special Purpose Religious establishment 1st generation | 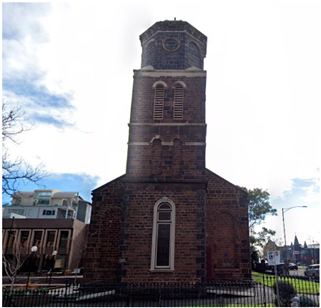 | 4–5 Storeys tall Masonry/Brick finish Inner Suburb location Typically located near residential areas |
| Special Purpose Religious establishment |  | Low-rise construction Lightweight construction Built post-war Typically located near residential areas |
| Special Purpose Stadium | 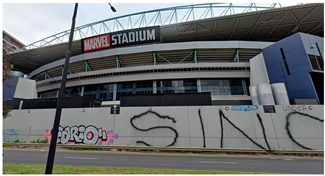 | Single land-use item Reinforced Concrete construction Heavyweight The broad range of materials used The high density of higher performance materials |
| Special Purpose Stadium Local |  | Low-rise construction Lightweight construction Typically timber and steel frame structures Typically located near residential areas |
| Townhouse 3rd Generation | 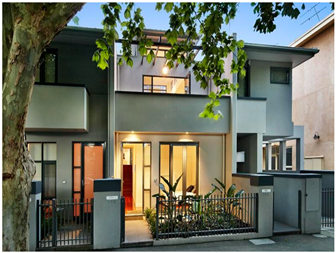 | Flat or Tile roof Typical of Knockdown rebuilds in inner Metropolitan suburbs Incorporated garage 2–3 Storeys Situated amongst 1st generation homes in inner suburbs |
Appendix B. Reduction Coefficients
| Timber Reduction Coefficient | Masonry Reduction Coefficient | Composite Concrete Reduction Coefficient | |
|---|---|---|---|
| High-rise commercial | 10.00% | 50.00% | 100.00% |
| High-rise residential | 10.00% | 50.00% | 100.00% |
| High-rise residential 2nd Generation | 10.00% | 10.00% | 100.00% |
| Low-rise commercial 1st Generation | 10.00% | 70.00% | 100.00% |
| Low-rise commercial 2nd Generation | 10.00% | 40.00% | 100.00% |
| Low-rise commercial 3rd Generation | 10.00% | 30.00% | 100.00% |
| Low-rise residential 1st Generation | 80.00% | 100.00% | 20.00% |
| Low-rise residential 2nd Generation | 80.00% | 100.00% | 20.00% |
| Low-rise residential 3rd Generation | 80.00% | 100.00% | 20.00% |
| Medium-rise Commercial 1st Generation | 10.00% | 40.00% | 100.00% |
| Medium-rise Commercial 2nd Generation | 10.00% | 50.00% | 100.00% |
| Medium-rise Commercial 3rd Generation | 20.00% | 40.00% | 100.00% |
| Medium-rise residential 1st Generation | 10.00% | 100.00% | 100.00% |
| Medium-rise residential 1st Generation | 10.00% | 100.00% | 100.00% |
| Medium-rise residential 2nd Generation | 10.00% | 80.00% | 100.00% |
| Medium-rise residential 3rd Generation | 10.00% | 70.00% | 100.00% |
| Special Purpose Control tower | 10.00% | 0.00% | 100.00% |
| Special purpose educational 3rd Generation | 10.00% | 50.00% | 100.00% |
| Special purpose educational Victorian | 10.00% | 100.00% | 10.00% |
| Special purpose Grain Silo | 10.00% | 0.00% | 100.00% |
| Special Purpose Ice-rink | 10.00% | 0.00% | 100.00% |
| Special Purpose Multistorey carpark | 10.00% | 0.00% | 100.00% |
| Mixed Purpose Industrial | 10.00% | 30.00% | 100.00% |
| Special Purpose Religious establishment 1st Generation | 10.00% | 100.00% | 20.00% |
| Special Purpose Religious establishment | 10.00% | 100.00% | 20.00% |
| Special Purpose Stadium | 10.00% | 10.00% | 100.00% |
| Special Purpose Stadium Local | 20.00% | 50.00% | 100.00% |
| Townhouse 3rd Generation | 100.00% | 40.00% | 20.00% |
| Low-rise residential 1st Generation | 0.4 |
| Low-rise residential 2nd Generation | 0.5 |
| Low-rise residential 3rd Generation | 0.6 |
| Mixed Purpose Industrial | 0.1 |
Appendix C. Box-and-Whisker Input Data
| Steel | Concrete | Timber | Masonry | Composite Concrete | |
|---|---|---|---|---|---|
| Max | 23.93% | 28.71% | 9.55% | 9.49% | 28.33% |
| Uq | 21.45% | 27.50% | 11.61% | 13.71% | 25.73% |
| Mean | 20.97% | 26.47% | 13.49% | 14.11% | 24.96% |
| Lq | 18.19% | 27.79% | 14.16% | 17.35% | 22.51% |
| Min | 17.16% | 19.48% | 20.82% | 22.71% | 19.83% |
| Statistical Identifier | Mass per Unit is [kg/m2] | |
|---|---|---|
| High-rise commercial | Uq | 244 |
| High-rise residential | Uq | 463 |
| High-rise residential 2nd Generation | Uq | 463 |
| Low-rise commercial 1st Generation | Lq | 1128 |
| Low-rise commercial 2nd Generation | Lq | 1128 |
| Low-rise commercial 3rd Generation | Lq | 1128 |
| Low-rise residential 1st Generation | Min | 98 |
| Low-rise residential 2nd Generation | Min | 98 |
| Low-rise residential 3rd Generation | Min | 98 |
| Medium-rise Commercial 1st Generation | Mean | 517 |
| Medium-rise Commercial 2nd Generation | Mean | 517 |
| Medium-rise Commercial 3rd Generation | Mean | 517 |
| Medium-rise residential 1st Generation | Lq | 296 |
| Medium-rise residential 1st Generation | Lq | 296 |
| Medium-rise residential 2nd Generation | Mean | 282 |
| Medium-rise residential 3rd Generation | Lq | 296 |
| Mixed Purpose Industrial | Min | 1128 |
| Special Purpose Control Tower | Mean | 589 |
| Special purpose educational 3rd Generation | Lq | 282 |
| Special purpose educational Victorian | Min | 282 |
| Special purpose Grain Silo | Lq | 589 |
| Special Purpose Ice rink | Lq | 472 |
| Special Purpose Multistorey carpark | Mean | 589 |
| Special Purpose Religious establishment 1st Generation | Min | 235 |
| Special Purpose Religious establishment | Min | 235 |
| Special Purpose Stadium | Uq | 282 |
| Special Purpose Stadium Local | Mean | 472 |
| Townhouse 3rd Generation | Min | 98 |
| Material Assumptions | Steel | Rebar | Concrete | Timber | Masonry | Composite Concrete | |
|---|---|---|---|---|---|---|---|
| Melbourne | Mass [kg] | Mass [kg] | Mass [kg] | Mass [kg] | Mass [kg] | Mass [kg] | |
| High-rise commercial | 1,919,819.849 | 1,329,106.05 | 590,713.7998 | 2,461,924.368 | 103,930.0971 | 613,476.2677 | 2,303,142.276 |
| High-rise residential | 12,979,023.81 | 8,985,478.026 | 3,993,545.789 | 16,643,944.49 | 702,623.8456 | 4,147,432.422 | 15,570,491.39 |
| High-rise residential 2nd Generation | 291,752.7178 | 201,982.6508 | 89,770.06701 | 374,135.6907 | 15,794.13209 | 18,645.85039 | 350,005.7667 |
| Low-rise commercial 2nd Generation | 48,550,329.6 | 0 | 48,550,329.6 | 74,151,100.66 | 3,777,977.866 | 18,525,347.61 | 60,066,534.06 |
| Low-rise commercial 3rd Generation | 103,990,862.1 | 0 | 103,990,862.1 | 158,825,634.1 | 8,092,121.693 | 29,759,842.28 | 128,657,636.6 |
| Low-rise commercial 1st Generation | 47,627,052.67 | 0 | 47,627,052.67 | 72,740,976.34 | 3,706,132.426 | 31,802,842.51 | 58,924,254.58 |
| Low-rise residential 1st Generation | 5,918,808.551 | 0 | 5,918,808.551 | 6,719,303.15 | 5,744,155.184 | 7,835,144.107 | 1,368,118.042 |
| Low-rise residential 2nd Generation | 207,254.1491 | 0 | 207,254.1491 | 235,284.4233 | 201,138.4529 | 274,356.9269 | 47,906.28692 |
| Low-rise residential 3rd Generation | 6,484,860.411 | 0 | 6,484,860.411 | 7,361,911.204 | 6,293,503.874 | 8,584,466.855 | 1,498,959.538 |
| Medium-rise Commercial 2nd Generation | 2,444,934.563 | 1,692,647.005 | 752,287.558 | 3,085,540.988 | 157,214.3278 | 822,437.9424 | 2,909,304.286 |
| Medium-rise Commercial 3rd Generation | 11,445,117.46 | 7,923,542.859 | 3,521,574.604 | 14,443,895.38 | 1,471,889.248 | 3,079,967.537 | 13,618,904.07 |
| Medium-rise Commercial 1st Generation | 1,847,553.781 | 1,279,075.694 | 568,478.0864 | 2,331,638.238 | 118,801.5131 | 497,190.6742 | 2,198,462.165 |
| Medium-rise residential 2nd Generation | 2,283,747.528 | 1,581,055.981 | 702,691.547 | 2,882,120.736 | 146,849.6694 | 1,229,147.411 | 2,717,502.779 |
| Medium-rise residential 3rd Generation | 1,717,919.856 | 1,189,329.131 | 528,590.7249 | 2,623,785.446 | 133,681.1355 | 1,147,136.586 | 2,125,412.791 |
| Medium-rise residential 1st Generation | 40,711.80876 | 28,185.09837 | 12,526.71039 | 62,179.29835 | 3168.017883 | 38,836.00869 | 50,368.70537 |
| Medium-rise residential 1st Generation | 6677.598261 | 4622.952643 | 2054.645619 | 10,198.72089 | 519.6219808 | 6369.927352 | 8261.533685 |
| Special Purpose Control tower | 41,138.40605 | 28,480.43496 | 12,657.97109 | 51,917.23326 | 2645.284233 | 0 | 48,951.87905 |
| Special purpose educational 3rd Generation | 1,445,711.303 | 0 | 1,445,711.303 | 2,208,040.301 | 112,499.0366 | 689,550.0158 | 1,788,635.998 |
| Special purpose educational Victorian | 313,797.384 | 0 | 313,797.384 | 356,237.1941 | 38,067.22363 | 415,395.7173 | 36,266.74684 |
| Special purpose Grain Silo | 52,507.12822 | 0 | 52,507.12822 | 80,194.33406 | 4085.87892 | 0 | 64,961.89072 |
| Special Purpose Ice rink | 600,842.665 | 415,967.9989 | 184,874.6662 | 917,669.258 | 46,754.99236 | 0 | 743,363.3654 |
| Special Purpose Multistorey carpark | 3,284,772.007 | 2,274,072.928 | 1,010,699.079 | 4,145,427.373 | 211,217.605 | 0 | 3,908,653.189 |
| Mixed Purpose Industrial | 21,668,384.38 | 0 | 21,668,384.38 | 24,598,944.56 | 2,628,623.679 | 8,605,190.353 | 25,042,968.83 |
| Special Purpose Religious establish ment 1st Generation | 84,719.64838 | 0 | 84,719.64838 | 48,088.81681 | 10,277.46554 | 112,149.3706 | 19,582.7384 |
| Special Purpose Religious establishment | 5,959,247.004 | 0 | 5,959,247.004 | 6,765,210.738 | 722,925.0464 | 7,888,675.338 | 1,377,465.291 |
| Special Purpose Stadium | 322,2821.159 | 2,231,183.88 | 991,637.2798 | 4,132,857.543 | 174,468.5139 | 205,969.7733 | 3,866,308.425 |
| Special Purpose Stadium Local | 1,718,223.174 | 0 | 1,718,223.174 | 2,168,421.237 | 220,970.5776 | 577,983.5392 | 2,044,567.622 |
| Townhouse 3rd Generation | 1,633,381.3 | 0 | 1,633,381.3 | 1,854,289.426 | 1,981,478.954 | 864,888.7865 | 377,552.0709 |
| Growth Region | |||||||
| Low-rise commercial 2nd Generation | 6,837,281.235 | 3,418,640.617 | 3,418,640.617 | 10,442,605.3 | 532,047.823 | 2,608,901.167 | 8,459,093.678 |
| Low-rise commercial 3rd Generation | 26,269,118.72 | 13,134,559.36 | 13,134,559.36 | 40,120,923.65 | 2,044,149.853 | 7,517,630.051 | 32,500,189.55 |
| Low-rise residential 2nd Generation | 43,245,751.31 | 0 | 43,245,751.31 | 49,094,561.93 | 41,969,647.17 | 57,247,449.48 | 9,996,149.072 |
| Low-rise residential 3rd Generation | 7,567,747.247 | 0 | 7,567,747.247 | 8,591,254.047 | 7,344,436.672 | 10,017,960.49 | 1,749,266.167 |
| Low-rise residential 1st Generation | 3418.037108 | 0 | 3418.037108 | 3880.312619 | 3317.176997 | 4524.696664 | 790.0708726 |
| Medium-rise Commercial 3rd Generation | 327,428.4301 | 226,681.2208 | 100,747.2093 | 413,219.1744 | 42,108.64478 | 88,113.46311 | 389,617.3539 |
| Medium-rise residential 2nd Generation | 44,425.41501 | 8885.083003 | 35,540.33201 | 67,851.10314 | 3456.994752 | 33,902.80818 | 54,963.1841 |
| Special purpose educational 3rd Generation | 7,343,530.044 | 1,468,706.009 | 5,874,824.035 | 11,215,801.01 | 571,441.9283 | 3,502,588.135 | 9,085,425.396 |
| Townhouse 3rd Generation | 14,259.75809 | 0 | 14,259.75809 | 16,188.33193 | 17,298.72293 | 7550.65879 | 3296.108017 |
| Material Assumptions | Steel | Rebar | Concrete | Timber | Masonry | Composite Concrete | ||||||||||||
|---|---|---|---|---|---|---|---|---|---|---|---|---|---|---|---|---|---|---|
| Melbourne | Embodied Energy (MJ) | Embodied Water (L) | Embodied Greenhouse Gas Emissions (kgCO₂e) | Embodied Energy (MJ) | Embodied Water (L) | Embodied Greenhouse Gas Emissions (kgCO₂e) | Embodied Energy (MJ) | Embodied Water (L) | Embodied Greenhouse Gas Emissions (kgCO₂e) | Embodied Energy (MJ) | Embodied Water (L) | Embodied Greenhouse Gas Emissions (kgCO₂e) | Embodied Energy (MJ) | Embodied Water (L) | Embodied Greenhouse Gas Emissions (kgCO₂e) | Embodied Energy (MJ) | Embodied Water (L) | Embodied Greenhouse Gas Emissions (kgCO₂e) |
| High-rise commercial | 51,569,314.73 | 49,309,834.44 | 3,854,407.544 | 23,251,026.75 | 22,172,718.26 | 1,752,251.291 | 4,101,155.677 | 4,477,624.945 | 615,481.0921 | 1,647,652.373 | 2,309,759.158 | 114,097.9929 | 1,595,038.296 | 2,269,862.19 | 147,234.3042 | 3,019,119 | 4,305,874.689 | 416,568.3 |
| High-rise residential | 348,636,547.4 | 333,361,234.8 | 26,057,886.27 | 23,251,026.75 | 22,172,718.26 | 1,752,251.291 | 25,847,903.54 | 30,200,935.17 | 3,321,676.101 | 11,139,024 | 15,615,225.11 | 771,364.3381 | 10,783,324.3 | 15,345,499.96 | 995,383.7813 | 20,410,883 | 29,110,049.13 | 2,816,228 |
| High-rise residential 2nd Generation | 7,836,926.85 | 7,493,556.344 | 585,749.6873 | 23,251,026.75 | 22,172,718.26 | 1,752,251.291 | 507,452.1639 | 673,117.4873 | 64,044.18811 | 250,391.7531 | 351,011.3264 | 17,339.33501 | 48,479.211 | 68,989.64643 | 4475.004092 | 458,811.9 | 654,358.6073 | 63,305.39 |
| Low-rise commercial 2nd Generation | 0 | 0 | 0 | 23,200,481.04 | 22,139,021.12 | 1,668,008.441 | 81,862,815.13 | 133,999,277.9 | 10,348,198.05 | 72,590,066.72 | 65,041,666.95 | 4,873,591.447 | 48,165,903.78 | 68,543,786.15 | 4,446,083.426 | 68,598,108 | 111,521,759.7 | 9,594,699 |
| Low-rise commercial 3rd Generation | 0 | 0 | 0 | 23,200,481.04 | 22,139,021.12 | 1,668,008.441 | 175,343,500.1 | 287,015,568.1 | 22,164,999.61 | 155,482,026.2 | 139,313,967.1 | 10,438,836.98 | 77,375,589.93 | 110,111,416.4 | 7,142,362.147 | 1.47 × 10⁸ | 238,870,550 | 20,551,065 |
| Low-rise commercial 1st Generation | 0 | 0 | 0 | 23,200,481.04 | 22,139,021.12 | 1,668,008.441 | 95,353,932.03 | 135,993,999.2 | 13,156,628.76 | 71,209,628.43 | 63,804,775.85 | 4,780,910.829 | 82,687,390.52 | 117,670,517.3 | 7,632,682.201 | 67,293,585 | 109,400,961.2 | 9,412,237 |
| Low-rise residential 1st Generation | 0 | 0 | 0 | 23,200,481.04 | 22,139,021.12 | 1,668,008.441 | 8,337,778.779 | 11,904,852.32 | 1,089,695.685 | 110,368,197.7 | 98,891,375.65 | 7,409,960.188 | 27,423,004.37 | 14,103,259.39 | 2,507,246.114 | 1,562,439 | 2,540,098.808 | 218,535.7 |
| Low-rise residential 2nd Generation | 0 | 0 | 0 | 23,200,481.04 | 22,139,021.12 | 1,668,008.441 | 291,957.2801 | 416,862.6196 | 38,156.99561 | 3,188,741.84 | 4,470,133.257 | 220,816.6298 | 960,249.244 | 493,842.4684 | 87,794.2166 | 54,710.68 | 88,944.59288 | 7652.287 |
| Low-rise residential 3rd Generation | 0 | 0 | 0 | 23,200,481.04 | 22,139,021.12 | 1,668,008.441 | 10,889,363.13 | 13,643,031.19 | 1,556,965.901 | 99,773,856.44 | 139,867,840.1 | 6,909,222.453 | 30,045,633.99 | 15,452,040.34 | 2,747,029.394 | 1,711,865 | 2,783,023.991 | 239,435.6 |
| Medium-rise Commercial 2nd Generation | 65,674,703.81 | 62,797,203.9 | 4,908,676.316 | 23,200,481.04 | 22,139,021.12 | 1,668,008.441 | 3,143,044.252 | 5,649,345.045 | 388,497.6608 | 3,020,716.094 | 2,706,601.867 | 202,806.4828 | 2,878,532.798 | 1,480,388.296 | 263,180.1416 | 3,322,528 | 5,401,522.471 | 464,716.3 |
| Medium-rise Commercial 3rd Generation | 307,433,462.9 | 293,963,440.1 | 22,978,274.29 | 23,200,481.04 | 22,139,021.12 | 1,668,008.441 | 14,713,077.07 | 26,445,459.36 | 1,818,617.736 | 28,280,880.01 | 25,340,045.3 | 1,898,737.13 | 10,779,886.38 | 5,543,941.566 | 985,589.6118 | 15,553,271 | 25,285,363.49 | 2,175,409 |
| Medium-rise Commercial 1st Generation | 49,628,136.94 | 47,453,708.26 | 3,709,319.513 | 23,200,481.04 | 22,139,021.12 | 1,668,008.441 | 2,662,813.404 | 4,329,006.215 | 372,443.0991 | 2,282,652.273 | 2,045,286.85 | 153,253.9519 | 1,740,167.36 | 894,943.2135 | 159,101.0157 | 2,510,722 | 4,081,746.568 | 351,170.3 |
| Medium-rise residential 2nd Generation | 61,344,972.05 | 58,657,176.88 | 4,585,062.344 | 23,200,481.04 | 22,139,021.12 | 1,668,008.441 | 3,291,483.902 | 5,351,052.481 | 460,374.1529 | 2,821,569.548 | 2,528,163.908 | 189,436.0735 | 4,302,015.938 | 2,212,465.339 | 393,327.1715 | 3,103,484 | 5,045,416.664 | 434,079 |
| Medium-rise residential 3rd Generation | 46,145,970.28 | 44,124,110.76 | 3,449,054.48 | 23,251,026.75 | 22,172,718.26 | 1,752,251.291 | 3,558,723.84 | 4,720,522.286 | 449,137.0719 | 2,119,309.481 | 2,970,951.011 | 146,759.6941 | 2,982,555.125 | 4,244,405.37 | 275,312.7807 | 2,786,139 | 3,973,597.827 | 384,422.5 |
| Medium-rise residential 1st Generation | 1,093,581.817 | 1,045,667.149 | 81,736.78527 | 23,183,632.47 | 22,105,323.98 | 1,725,293.579 | 63,338.09437 | 113,844.6426 | 7828.938929 | 57,642.08537 | 78,295.58196 | 3463.039548 | 135,926.0304 | 69,904.81565 | 12,427.52278 | 57,522.84 | 93,516.4105 | 8045.621 |
| Medium-rise residential 1st Generation | 179,370.5625 | 171,511.543 | 13,406.56266 | 23,183,632.47 | 22,105,323.98 | 1,725,293.579 | 10,945.41296 | 18,913.16366 | 1493.384131 | 9454.52194 | 12,842.13249 | 568.0117777 | 22,294.74573 | 11,465.86923 | 2038.376753 | 9434.964 | 15,338.67051 | 1319.652 |
| Special Purpose Control tower | 1,105,040.876 | 1,056,624.137 | 82,593.26137 | 23,251,026.75 | 22,172,718.26 | 1,752,251.291 | 55,718.31641 | 96,278.6549 | 7602.166299 | 41,936.92649 | 58,789.22134 | 2904.082938 | 0 | 0 | 0 | 55,904.78 | 90,885.87809 | 7819.305 |
| Special purpose educational 3rd Generation | 0 | 0 | 0 | 23,183,632.47 | 22,105,323.98 | 1,725,293.579 | 2,437,676.492 | 3,990,174.162 | 308,144.2909 | 1,783,499.772 | 2,500,196.644 | 123,505.2659 | 1,792,830.041 | 2,551,335.059 | 165,492.0038 | 2,042,686 | 3,320,848.074 | 285,706.9 |
| Special purpose educational Victorian | 0 | 0 | 0 | 23,183,632.47 | 22,105,323.98 | 1,725,293.579 | 442,043.8921 | 631,159.3765 | 57,772.37974 | 603,497.4764 | 846,012.0873 | 41,791.49191 | 1,080,028.865 | 1,536,964.154 | 99,694.97215 | 47,540.97 | 67,803.04843 | 6559.551 |
| Special purpose Grain Silo | 0 | 0 | 0 | 23,183,632.47 | 22,105,323.98 | 1,725,293.579 | 105,124.3118 | 149,928.5376 | 14,504.71433 | 64,775.34692 | 90,805.22885 | 4485.616747 | 0 | 0 | 0 | 85,156.57 | 121,450.4913 | 11,749.63 |
| Special Purpose Ice rink | 16,139,558.36 | 15,432,412.76 | 1,206,307.197 | 23,183,632.47 | 22,105,323.98 | 1,725,293.579 | 1,048,010.776 | 1,703,778.852 | 146,583.4523 | 741,228.732 | 1,039,090.454 | 51,329.2197 | 0 | 0 | 0 | 848,947.3 | 1,380,156.054 | 118,740.8 |
| Special Purpose Multistorey carpark | 88,234,029.61 | 84,368,105.63 | 6,594,811.491 | 23,183,632.47 | 22,105,323.98 | 1,725,293.579 | 4,734,224.801 | 7,696,554.538 | 662,167.8237 | 3,348,531.347 | 4,694,133.952 | 231,881.8656 | 0 | 0 | 0 | 446,3820 | 7,256,950.789 | 624,346.8 |
| Mixed Purpose Industrial | 0 | 0 | 0 | 23,251,026.75 | 22,172,718.26 | 1,752,251.291 | 41,786,533.29 | 45,661,131 | 5,194,283.572 | 4,1672,798.94 | 58,418,954.5 | 2,885,792.415 | 22,373,494.92 | 31,839,204.31 | 2,065,245.685 | 32,828,066 | 46,819,463.47 | 4,529,511 |
| Special Purpose Religious establish ment 1st Generation | 0 | 0 | 0 | 23,183,632.47 | 22,105,323.98 | 1,725,293.579 | 63,038.16638 | 89,905.17925 | 8697.803388 | 162,933.4616 | 228,408.0436 | 11,282.95098 | 291,588.3636 | 414,952.6712 | 26,915.84895 | 22,364.18 | 36,358.03996 | 3128.039 |
| Special Purpose Religious establishment | 0 | 0 | 0 | 23,183,632.47 | 22,105,323.98 | 1,725,293.579 | 7,260,520.81 | 12,545,841.7 | 990,620.1438 | 13,153,621.22 | 17,866,640.69 | 790,247.4414 | 27,610,363.68 | 14,199,615.61 | 2,524,376.108 | 1,573,114 | 2,557,453.257 | 220,028.7 |
| Special Purpose Stadium | 86,569,934.52 | 82,776,921.93 | 6,470,433.251 | 23,183,632.47 | 22,105,323.98 | 1,725,293.579 | 4,435,441.756 | 7,664,236.712 | 605,168.426 | 3,174,454.61 | 4,311,880.278 | 190,715.8942 | 720,894.2067 | 370,745.592 | 65,910.32747 | 4,415,461 | 7,178,331.925 | 617,582.9 |
| Special Purpose Stadium Local | 0 | 0 | 0 | 23,183,632.47 | 22,105,323.98 | 1,725,293.579 | 2,327,180.649 | 4,021,259.741 | 317,518.824 | 4,020,559.659 | 5,461,149.718 | 241,548.4626 | 2,022,942.387 | 1,040,370.371 | 184,954.7326 | 2,334,969 | 3,796,020.239 | 326,588 |
| Townhouse 3rd Generation | 0 | 0 | 0 | 23,183,632.47 | 22,105,323.98 | 1,725,293.579 | 1,990,049.902 | 3,438,713.516 | 271,520.9517 | 36,053,009.56 | 48,971,013.91 | 2,166,004.181 | 3,027,110.753 | 1,556,799.816 | 276,764.4117 | 431,177.8 | 700,977.2077 | 60,308.1 |
| Growth | ||||||||||||||||||
| Low-rise commercial 2nd Generation | 132,643,256 | 126,831,566.9 | 9,914,057.79 | 23,200,481.04 | 22,139,021.12 | 1,668,008.441 | 11,528,636.25 | 18,870,948.06 | 1,457,323.584 | 10,222,766.87 | 9,159,735.321 | 686,341.6917 | 6,783,143.035 | 9,652,934.319 | 626,136.2802 | 9,660,584 | 15,705,467.73 | 1,351,209 |
| Low-rise commercial 3rd Generation | 509,620,903.2 | 487,292,152.3 | 38,090,222.15 | 23,200,481.04 | 22,139,021.12 | 1,668,008.441 | 44,293,499.71 | 72,502,966.91 | 5,599,097.789 | 39,276,295.27 | 35,192,083.87 | 2,636,953.31 | 19,545,838.13 | 27,815,231.19 | 1,804,231.212 | 37,116,367 | 60,341,059.88 | 5,191,402 |
| Low-rise residential 2nd Generation | 0 | 0 | 0 | 23,200,481.04 | 22,139,021.12 | 1,668,008.441 | 60,919,947.72 | 86,982,756.47 | 7,961,857.218 | 665,364,419.5 | 932,740,174.3 | 46,075,705.11 | 200,366,073.2 | 103,045,409.1 | 18,319,183.83 | 11,415,956 | 18,559,221.91 | 1,596,730 |
| Low-rise residential 3rd Generation | 0 | 0 | 0 | 23,200,481.04 | 22,139,021.12 | 1,668,008.441 | 12,707,744.28 | 15,921,238.88 | 1,816,958.835 | 116,434,785 | 163,223,939.3 | 8,062,972.198 | 35,062,861.73 | 18,032,328.89 | 3,205,747.358 | 1,997,724 | 3,247,752.582 | 279,418.2 |
| Low-rise residential 1st Generation | 0 | 0 | 0 | 23,200,481.04 | 22,139,021.12 | 1,668,008.441 | 4814.961832 | 6874.901705 | 629.2854812 | 63,736.23882 | 57,108.51918 | 4279.158326 | 15,836.43832 | 8144.453995 | 1447.902932 | 902.2889 | 1466.874947 | 126.2016 |
| Medium-rise Commercial 3rd Generation | 8,795,231.368 | 8,409,873.293 | 657,375.5404 | 23,200,481.04 | 22,139,021.12 | 1,668,008.441 | 420,920.0771 | 756,566.7429 | 52,028.05059 | 809,075.5009 | 724,942.4286 | 54,320.15177 | 308,397.1209 | 158,604.2336 | 28,196.30819 | 444,956.8 | 723,378.0606 | 62,,235.34 |
| Medium-rise residential 2nd Generation | 344,741.2205 | 329,636.5794 | 25,766.74071 | 23,200,481.04 | 22,139,021.12 | 1,668,008.441 | 77,488.36159 | 125,974.88 | 10,838.16293 | 66,422.69716 | 59,515.62165 | 4459.52323 | 118,659.8286 | 61,025.05473 | 10,848.89862 | 62,769.9 | 102,046.6905 | 8779.517 |
| Special purpose educational 3rd Generation | 56,985,793.14 | 54,488,992.93 | 4,259,247.426 | 23,200,481.04 | 22,139,021.12 | 1,668,008.441 | 12,382,244.31 | 20,268,198.62 | 1,565,227.34 | 9,059,335.796 | 12,699,817.13 | 627,348.3708 | 9,106,729.152 | 12,959,576.1 | 840,621.1525 | 10,375,877 | 16,868,338.48 | 1,451,256 |
| Townhouse 3rd Generation | 0 | 0 | 0 | 23,200,481.04 | 22,139,021.12 | 1,668,008.441 | 17,373.54909 | 30,020.6834 | 2370.434318 | 314,750.2636 | 427,527.1254 | 18,909.6665 | 26,427.30577 | 13,591.18582 | 2416.210813 | 3764.272 | 6119.676654 | 526.5022 |
References
- Meng, F.; Liu, G.; Liang, S.; Su, M.; Yang, Z. Critical review of the energy-water-carbon nexus in cities. Energy 2019, 171, 1017–1032. [Google Scholar] [CrossRef]
- Keivani, R. A review of the main challenges to urban sustainability. Int. J. Urban Sustain. Dev. 2010, 1, 5–16. [Google Scholar] [CrossRef]
- Hu, M.; Chen, S.; Wang, Y.; Xia, B.; Wang, S.; Huang, G. Identifying the key sectors for regional energy, water and carbon footprints from production-, consumption- and network-based perspectives. Sci. Total Environ. 2021, 764, 142821. [Google Scholar] [CrossRef]
- Anand, C.K.; Amor, B. Recent developments, future challenges and new research directions in LCA of buildings: A critical review. Renew. Sustain. Energy Rev. 2017, 67, 408–416. [Google Scholar] [CrossRef]
- Kim, Y.W.; Hwang, Y.W.; Jo, H.J.; Kim, J. Water footprint assessment in expressway infrastructure system. J. Clean. Prod. 2021, 280, 124449. [Google Scholar] [CrossRef]
- Rodrigues, V.; Martins, A.A.; Nunes, M.I.; Quintas, A.; Mata, T.M.; Caetano, N.S. LCA of constructing an industrial building: Focus on embodied carbon and energy. Energy Procedia 2018, 153, 420–425. [Google Scholar] [CrossRef]
- Wang, C.; Lin, L.; Olsson, G.; Liu, Y.; Xu, M. The scope and understanding of the water–electricity nexus. Resour. Conserv. Recycl. 2019, 150, 104453. [Google Scholar] [CrossRef]
- La Rocca, A. 5-Common-Building-Materials. Available online: https://civiltoday.com/construction/building/248-5-common-building-materials (accessed on 6 March 2022).
- Eibedingil, I.G.; Gill, T.E.; Van Pelt, R.S.; Tong, D.Q. Combining optical and radar satellite imagery to investigate the surface properties and evolution of the Lordsburg Playa, New Mexico, USA. Remote Sens. 2021, 13, 3402. [Google Scholar] [CrossRef]
- Jat, M.K.; Garg, P.K.; Khare, D. Monitoring and modelling of urban sprawl using remote sensing and GIS techniques. Int. J. Appl. Earth Obs. Geoinf. 2008, 10, 26–43. [Google Scholar] [CrossRef]
- Wu, Q.; Li, H.; Wang, R.; Paulussen, J.; He, Y.; Wang, M.; Wang, B.; Wang, Z. Monitoring and predicting land use change in Beijing using remote sensing and GIS. Landsc. Urban Plan. 2006, 78, 322–333. [Google Scholar] [CrossRef]
- Ramage, M.H.; Burridge, H.; Busse-Wicher, M.; Fereday, G.; Reynolds, T.; Shah, D.U.; Wu, G.; Yu, L.; Fleming, P.; Densley-Tingley, D.; et al. The wood from the trees: The use of timber in construction. Renew. Sustain. Energy Rev. 2017, 68, 333–359. [Google Scholar] [CrossRef]
- Hoekstra, A.Y.; Mekonnen, M.M.; Chapagain, A.K.; Mathews, R.E.; Richter, B.D. Global monthly water scarcity: Blue water footprints versus blue water availability. PLoS ONE 2012, 7, e32688. [Google Scholar] [CrossRef] [PubMed]
- Hoekstra, A.Y.; Hung, P.Q. Virtual water trade: A quantification of virtual water flows between nations in relation to international crop trade. In Proceedings of the International Expert Meeting on Virtual Water Trade, Delft, The Netherlands, 12–13 December 2002; Volume 12, pp. 25–47. [Google Scholar]
- Mekonnen, M.; Hoekstra, A. National water footprint accounts: The green, blue and grey water footprint of production and consumption. Volume 1: Main Report. In Daugherty Water for Food Global Institute: Faculty Publications; UNESCO-IHE: Delft, The Netherlands, 2011. [Google Scholar]
- Aldaya, M.M.; Chapagain, A.K.; Hoekstra, A.Y.; Mekonnen, M.M. The Water Footprint Assessment Manual; Routledge: London, UK, 2012. [Google Scholar]
- Tariq, M.A.U.R.; Damnics, R.R.; Rajabi, Z.; Laiq Ur, M.; Shahid, R.; Muttil, N. Identification of major inefficient water consumption areas considering water consumption, efficiencies, and footprints in Australia. Appl. Sci. 2020, 10, 6156. [Google Scholar] [CrossRef]
- Mack Vergara, Y.L. Concrete Water Footprint: A Streamlined Methodology. Ph.D. Thesis, Universidade de São Paulo, São Paulo, Brazil, 2019. [Google Scholar]
- Netz, J.; Sundin, J. Water Footprint of Concrete; KTH Royal Institute of Technology: Stockholm, Sweden, 2015. [Google Scholar]
- Nezamoleslami, R.; Hosseinian, S.M. Data needed for assessing water footprint of steel production. Data Brief 2020, 30, 105461. [Google Scholar] [CrossRef]
- Crawford, R.H.; Stephan, A.; Prideaux, F. Environmental Performance in Construction (EPiC) Database; The University of Melbourne: Melbourne, Australia, 2019; ISBN 0734054955. [Google Scholar]
- De Wolf, C.; Ochsendorf, J.; Cox, D.; Hattan, A.; Yang, F.; Charlson, A. Survey of material quantities and embodied carbon in existing building structures. ICE J. Eng. Sustain. 2015. [Google Scholar] [CrossRef]
- De Wolf, C.; Hoxha, E.; Hollberg, A.; Fivet, C.; Ochsendorf, J. Database of embodied quantity outputs: Lowering material impacts through engineering. J. Archit. Eng. 2020, 26, 4020016. [Google Scholar] [CrossRef]
- Ogawa, Y.; Oki, T.; Chen, S.; Sekimoto, Y. Joining street-view images and building footprint gis data. In Proceedings of the 1st ACM SIGSPATIAL International Workshop on Searching and Mining Large Collections of Geospatial Data, Beijing, China, 2 November 2021; Association for Computing Machinery, Inc.: New York, NY, USA, 2021; pp. 18–24. [Google Scholar]
- Sun, Y.; Montazeri, S.; Wang, Y.; Zhu, X.X. Automatic registration of a single SAR image and GIS building footprints in a large-scale urban area. ISPRS J. Photogramm. Remote Sens. 2020, 170, 1–14. [Google Scholar] [CrossRef]
- Chen, K.; Reichard, G.; Akanmu, A.; Xu, X. Geo-registering UAV-captured close-range images to GIS-based spatial model for building façade inspections. Autom. Constr. 2021, 122, 103503. [Google Scholar] [CrossRef]
- Basaraner, M.; Cetinkaya, S. Performance of shape indices and classification schemes for characterising perceptual shape complexity of building footprints in GIS. Int. J. Geogr. Inf. Sci. 2017, 31, 1952–1977. [Google Scholar] [CrossRef]
- Risbey, J.S.; Pook, M.J.; Mcintosh, P.C.; Ummenhofer, C.C.; Meyers, G. Characteristics and variability of synoptic features associated with cool season rainfall in southeastern Australia. Int. J. Climatol. 2009, 29, 1595–1613. [Google Scholar] [CrossRef]
- Meehl, G.A.; Washington, W.M.; Collins, W.D.; Arblaster, J.M.; Hu, A.; Buja, L.E.; Strand, W.G.; Teng, H. How much more global warming and sea level rise? Science 2005, 307, 1769–1772. [Google Scholar] [CrossRef] [Green Version]
- Commonwealth Scientific and Industrial Research Organisation (CSIRO); Marine and Atmospheric Research Australia; Bureau of Meteorology. Climate Change in Australia: Technical Report 2007/[CSIRO and the Bureau of Meteorology], Revised ed.; CSIRO Marine and Atmospheric Research: Canbera, Australia, 2007; ISBN 9781921232930.
- Karoly, D.J. Ozone and climate change. Science 2003, 302, 236–237. [Google Scholar] [CrossRef] [PubMed] [Green Version]
- Rutherfurd, I.; Finlayson, B. Whither Australia: Will availability of water constrain the growth of australia’s population? Geogr. Res. 2011, 49, 301–316. [Google Scholar] [CrossRef]
- Ejaz Qureshi, M.; Proctor, W.; Young, M.D.; Wittwer, G. The economic impact of increased water demand in Australia: A computable general equilibrium analysis. Econ. Pap. 2012, 31, 87–102. [Google Scholar] [CrossRef]
- Gu, Y.; Xu, J.; Keller, A.A.; Yuan, D.; Li, Y.; Zhang, B.; Weng, Q.; Zhang, X.; Deng, P.; Wang, H.; et al. Calculation of water footprint of the iron and steel industry: A case study in Eastern China. J. Clean. Prod. 2015, 92, 274–281. [Google Scholar] [CrossRef] [Green Version]
- Zhang, G.P.; Mathews, R.E.; Frapporti, G.; Mekonnen, M.M. Water Footprint Assessment for the Hertfordshire and North London Area; Report RESE000335; Environment Agency: London, UK, 2014.
- Schyns, J.F.; Booij, M.J.; Hoekstra, A.Y. The water footprint of wood for lumber, pulp, paper, fuel and firewood. Adv. Water Resour. 2017, 107, 490–501. [Google Scholar] [CrossRef]
- Treloar, G.J.; Fay, R.; Ilozor, B.; Love, P.E.D. An analysis of the embodied energy of office buildings by height. Facilities 2001, 19, 204–214. [Google Scholar] [CrossRef]
- Pullen, S. Embodied energy of Building Materials in Houses. Ph.D. Thesis, University of Adelaide, Adelaide, Australia, 1995. [Google Scholar]
- Cabeza, L.F.; Barreneche, C.; Miró, L.; Martínez, M.; Fernández, A.I.; Urge-Vorsatz, D. Affordable construction towards sustainable buildings: Review on embodied energy in building materials. Curr. Opin. Environ. Sustain. 2013, 5, 229–236. [Google Scholar] [CrossRef]
- Troy, P.; Holloway, D.; Pullen, S.; Bunker, R. Embodied and operational energy consumption in the city. Urban Policy Res. 2003, 21, 9–44. [Google Scholar] [CrossRef]
- Luo, Z.; Yang, L.; Liu, J. Embodied carbon emissions of office building: A case study of China’s 78 office buildings. Build. Environ. 2016, 95, 365–371. [Google Scholar] [CrossRef] [Green Version]
- Gan, V.J.L.; Chan, C.M.; Tse, K.T.; Lo, I.M.C.; Cheng, J.C.P. A comparative analysis of embodied carbon in high-rise buildings regarding different design parameters. J. Clean. Prod. 2017, 161, 663–675. [Google Scholar] [CrossRef]
- National Trust. Australia Housing Styles. Available online: https://www.nationaltrust.org.au/ (accessed on 3 March 2022).
- Cracknell, A.P. Introduction to Remote Sensing; CRC Press: Boca Raton, FL, USA, 2007; ISBN 1420008978. [Google Scholar]
- Weng, Q. Remote Sensing and GIS Integration; McGraw-Hill Professional Publishing: New York, NY, USA, 2009. [Google Scholar]
- Yalew, S.G.; Van Griensven, A.; Mul, M.L.; van der Zaag, P. Land suitability analysis for agriculture in the Abbay basin using remote sensing, GIS and AHP techniques. Model. Earth Syst. Environ. 2016, 2, 101. [Google Scholar] [CrossRef] [Green Version]
- Weng, Q. A remote sensing? GIS evaluation of urban expansion and its impact on surface temperature in the Zhujiang Delta, China. Int. J. Remote Sens. 2001, 22, 1999–2014. [Google Scholar]
- Niu, F.; Yin, G.; Luo, J.; Lin, Z.; Liu, M. Permafrost distribution along the Qinghai-Tibet engineering corridor, China using high-resolution statistical mapping and modeling integrated with remote sensing and GIS. Remote Sens. 2018, 10, 215. [Google Scholar] [CrossRef] [Green Version]
- Youssef, A.M.; Pradhan, B.; Tarabees, E. Integrated evaluation of urban development suitability based on remote sensing and GIS techniques: Contribution from the analytic hierarchy process. Arab. J. Geosci. 2011, 4, 463–473. [Google Scholar] [CrossRef]
- Darkwah, R.M.; Cobbinah, P.B. Stewardship of urban greenery in an era of global urbanisation. Int. J. Environ. Ecol. Geol. Geophys. Eng. 2014, 8, 671–674. [Google Scholar]
- Radhi, H.; Fikry, F.; Sharples, S. Impacts of urbanisation on the thermal behaviour of new built up environments: A scoping study of the urban heat island in Bahrain. Landsc. Urban Plan. 2013, 113, 47–61. [Google Scholar] [CrossRef]
- Lu, X.; Viljanen, M. Fibrous insulation materials in building engineering applications. In Fibrous and Composite Materials for Civil Engineering Applications; Woodhead Publishing: Cambridge, UK, 2011; pp. 271–305. [Google Scholar]
- Han, M.Y.; Chen, G.Q.; Shao, L.; Li, J.S.; Alsaedi, A.; Ahmad, B.; Guo, S.; Jiang, M.M.; Ji, X. Embodied energy consumption of building construction engineering: Case study in E-town, Beijing. Energy Build. 2013, 64, 62–72. [Google Scholar] [CrossRef]
- Gusakova, N.V.; Filyushina, K.E.; Gusakov, A.M.; Minaev, N.N. Selection criteria of space planning and structural solutions of low-rise buildings. Mag. Civ. Eng. 2017, 75, 84–93. [Google Scholar]
- Lotfabadi, P. High-rise buildings and environmental factors. Renew. Sustain. Energy Rev. 2014, 38, 285–295. [Google Scholar] [CrossRef]
- Güneralp, B.; Zhou, Y.; Ürge-Vorsatz, D.; Gupta, M.; Yu, S.; Patel, P.L.; Fragkias, M.; Li, X.; Seto, K.C. Global scenarios of urban density and its impacts on building energy use through 2050. Proc. Natl. Acad. Sci. USA 2017, 114, 8945–8950. [Google Scholar] [CrossRef] [Green Version]
- Dixit, M.K.; Fernández-Solís, J.L.; Lavy, S.; Culp, C.H. Identification of parameters for embodied energy measurement: A literature review. Energy Build. 2010, 42, 1238–1247. [Google Scholar] [CrossRef]
- Emmanuel, R. Estimating the environmental suitability of wall materials: Preliminary results from Sri Lanka. Build. Environ. 2004, 39, 1253–1261. [Google Scholar] [CrossRef]
- Lenzen, M.; Treloar, G. Embodied energy in buildings: Wood versus concrete—Reply to Börjesson and Gustavsson. Energy Policy 2002, 30, 249–255. [Google Scholar] [CrossRef]
- Nässén, J.; Holmberg, J.; Wadeskog, A.; Nyman, M. Direct and indirect energy use and carbon emissions in the production phase of buildings: An input–output analysis. Energy 2007, 32, 1593–1602. [Google Scholar] [CrossRef]
- Google Earth FAQs–Google Earth–TerraMetrics 3D Terrain Data & Visualization. Available online: https://earthengine.google.com/faq/ (accessed on 3 March 2022).
- DELWP Census 2016 Data. Available online: https://www.planning.vic.gov.au/land-use-and-population-research/victorian-population/census-2016 (accessed on 1 March 2022).
- Fantilli, A.P.; Mancinelli, O.; Chiaia, B. The carbon footprint of normal and high-strength concrete used in low-rise and high-rise buildings. Case Stud. Constr. Mater. 2019, 11, e00296. [Google Scholar] [CrossRef]
- Atmaca, A.; Atmaca, N. Carbon footprint assessment of residential buildings, a review and a case study in Turkey. J. Clean. Prod. 2022, 340, 130691. [Google Scholar] [CrossRef]
- Onat, N.C.; Kucukvar, M.; Tatari, O. Scope-based carbon footprint analysis of U.S. residential and commercial buildings: An input-output hybrid life cycle assessment approach. Build. Environ. 2014, 72, 53–62. [Google Scholar] [CrossRef]
- Shi, Y.; Yun, Y.X.; Liu, C.; Chu, Y.Q. Carbon footprint of buildings in the urban agglomeration of central Liaoning, China. Chin. J. Appl. Ecol. 2017, 28, 2040–2046. [Google Scholar] [CrossRef]
- Mastrucci, A.; Marvuglia, A.; Benetto, E.; Leopold, U. A spatio-temporal life cycle assessment framework for building renovation scenarios at the urban scale. Renew. Sustain. Energy Rev. 2020, 126, 109834. [Google Scholar] [CrossRef] [Green Version]
- Xiao, J.; Wang, C.; Ding, T.; Akbarnezhad, A. A recycled aggregate concrete high-rise building: Structural performance and embodied carbon footprint. J. Clean. Prod. 2018, 199, 868–881. [Google Scholar] [CrossRef]
- Hosseinian, S.M.; Ghahari, S.M. The relationship between structural parameters and water footprint of residential buildings. J. Clean. Prod. 2021, 279, 123562. [Google Scholar] [CrossRef]
- Chang, Y.; Huang, Z.; Ries, R.J.; Masanet, E. The embodied air pollutant emissions and water footprints of buildings in China: A quantification using disaggregated input-output life cycle inventory model. J. Clean. Prod. 2016, 113, 274–284. [Google Scholar] [CrossRef]


| Code | Program | DEQO Classification |
|---|---|---|
| HCN | High-rise Commercial | Office |
| HRN | High-rise Residential | Multi Family High-rise (>15) |
| HR2 | High-rise Residential 2nd Generation | Multi Family High-rise (>15) |
| MC1 | Medium-rise Commercial 1st Generation | Residential/Office/Retail |
| MC2 | Medium-rise Commercial 2nd Generation | Residential/Office/Retail |
| MC3 | Medium-rise Commercial 3rd Generation | Residential/Office/Retail |
| MR2 | Medium-rise Residential 2nd Generation | Multifamily-Medium-rise 6–15 |
| MLR1 | Medium-rise Residential 1st Generation | Multifamily Low-rise (<5) |
| MLR2 | Medium-rise Residential 2nd Generation | Multifamily Low-rise (<5) |
| MLR3 | Medium-rise Residential 3rd Generation | Multifamily Low-rise (<5) |
| LC1 | Low-rise Commercial 1st Generation | Factories and Plants |
| LC2 | Low-rise Commercial 2nd Generation | Factories and Plants |
| LC3 | Low-rise Commercial 3rd Generation | Factories and Plants |
| LR1 | Low-rise Residential 1st Generation | Single Family |
| LR2 | Low-rise Residential 2nd Generation | Single Family |
| LR3 | Low-rise Residential 3rd Generation | Single Family |
| SCT | Special Purpose Control Tower | Other |
| SE3 | Special Purpose Educational 3rd Generation | Educational |
| SEV | Special Purpose Educational Victorian | Educational |
| SSN | Special Purpose Grain Silo | Other |
| SIN | Special Purpose Ice Rink | Civic Building |
| SPN | Special Purpose Multistorey Carpark | Other |
| MIN | Mixed Purpose Industrial | Factories and Plants |
| SR1 | Special Purpose Religious Establishment 1st Generation | Cultural/Institutional |
| SRE | Special Purpose Religious Establishment | Cultural/Institutional |
| SSN | Special Purpose Stadium | Stadium |
| SSL | Special Purpose Stadium Local | Civic Building |
| NR3 | Townhouse 3rd Generation | Single Family |
| Sum of Perimeter [m] | Sum of Wall Area [m2] | Sum of Area [m2] | Number of Storeys | |
|---|---|---|---|---|
| HCN | 2654 | 134,583 | 36,685 | 16.73 |
| HRN | 11,037 | 579,201 | 130,701 | 17.26 |
| HR2 | 309 | 13,389 | 2938 | 14.50 |
| MC1 | 19,491 | 19,491 | 236,579 | 1.00 |
| MC2 | 29,877 | 119,508 | 506,733 | 1.00 |
| MC3 | 19,018 | 76,072 | 232,080 | 1.00 |
| MR2 | 29,043 | 141,738 | 351,980 | 1.57 |
| MLR1 | 2001 | 9708 | 12,325 | 1.67 |
| MLR2 | 46,562 | 71,113 | 385,642 | 1.53 |
| MLR3 | 1997 | 19,378 | 22,547 | 3.00 |
| LC1 | 6537 | 140,406 | 105,546 | 6.17 |
| LC2 | 1750 | 18,535 | 17,038 | 2.92 |
| LC3 | 6445 | 119,658 | 38,611 | 6.27 |
| LR1 | 3346 | 37,704 | 31,901 | 3.74 |
| LR2 | 131 | 1572 | 756 | 4.00 |
| LR3 | 45 | 540 | 124 | 4.00 |
| SCT | 75 | 2250 | 333 | 10.00 |
| SE3 | 2302 | 19,857 | 28,179 | 2.73 |
| SEV | 486 | 2916 | 6485 | 2.00 |
| SSN | 89 | 1602 | 490 | 6.00 |
| SIN | 421 | 3789 | 6997 | 3.00 |
| SPN | 2011 | 29,211 | 26,589 | 5.13 |
| MIN | 56,359 | 322,233 | 1,119,508 | 1.98 |
| SR1 | 363 | 3993 | 2101 | 3.00 |
| SRE | 5964 | 47,607 | 147,786 | 3.00 |
| SSN | 1628 | 29,823 | 53,285 | 3.67 |
| SSL | 791 | 5385 | 17,356 | 2.50 |
| NR3 | 15,284 | 115,047 | 97,134 | 2.51 |
| Sum of Wall Area [m2] | Sum of Perimeter [m] | Sum of the Area [m2] | Number of Storeys | |
|---|---|---|---|---|
| LC2 | 28,600 | 4281 | 52,058 | 1.59 |
| LC3 | 76,011 | 16,945 | 200,009 | 1.50 |
| LR1 | 1,619,442 | 365,692 | 8,036,689 | 1.50 |
| LR2 | 308,382 | 72,095 | 1,171,977 | 1.44 |
| LR3 | 888 | 148 | 794 | 2.00 |
| MR2 | 6288 | 524 | 4718 | 4.00 |
| MC3 | 1632 | 272 | 1289 | 2.00 |
| SE3 | 93,939 | 10,160 | 223,650 | 2.96 |
| NR3 | 1320 | 220 | 1325 | 2.00 |
| Material Assumptions | Steel | Rebar | Concrete | Timber | Masonry | Composite Concrete |
|---|---|---|---|---|---|---|
| Hot-Rolled Structural Steel | Steel ReinForcement Bar —12 mm dia. | Concrete 50 MPa | Hardwood | Concrete Block | Concrete 32 MPa | |
| Embodied Energy (MJ) | 38.8 | 34.5 | 1.66 | 15.85 | 2.6 | 1.31 |
| Embodied Water (L) | 37.1 | 32.9 | 1.81 | 22.22 | 3.7 | 1.87 |
| Embodied Greenhouse Gas Emissions (kg CO₂) | 2.9 | 2.6 | 0.25 | 1.09 | 0.24 | 0.18 |
Publisher’s Note: MDPI stays neutral with regard to jurisdictional claims in published maps and institutional affiliations. |
© 2022 by the authors. Licensee MDPI, Basel, Switzerland. This article is an open access article distributed under the terms and conditions of the Creative Commons Attribution (CC BY) license (https://creativecommons.org/licenses/by/4.0/).
Share and Cite
Rydlewski, J.; Rajabi, Z.; Tariq, M.A.U.R.; Muttil, N.; Sidiqui, P.; Shah, A.A.; Khan, N.A.; Irshad, M.; Alam, A.; Butt, T.A.; et al. Identification of Embodied Environmental Attributes of Construction in Metropolitan and Growth Region of Melbourne, Australia to Support Urban Planning. Sustainability 2022, 14, 8401. https://doi.org/10.3390/su14148401
Rydlewski J, Rajabi Z, Tariq MAUR, Muttil N, Sidiqui P, Shah AA, Khan NA, Irshad M, Alam A, Butt TA, et al. Identification of Embodied Environmental Attributes of Construction in Metropolitan and Growth Region of Melbourne, Australia to Support Urban Planning. Sustainability. 2022; 14(14):8401. https://doi.org/10.3390/su14148401
Chicago/Turabian StyleRydlewski, James, Zohreh Rajabi, Muhammad Atiq Ur Rehman Tariq, Nitin Muttil, Paras Sidiqui, Ashfaq Ahmad Shah, Nasir Abbas Khan, Muhammad Irshad, Arif Alam, Tayyab Ashfaq Butt, and et al. 2022. "Identification of Embodied Environmental Attributes of Construction in Metropolitan and Growth Region of Melbourne, Australia to Support Urban Planning" Sustainability 14, no. 14: 8401. https://doi.org/10.3390/su14148401