Article

Spatiotemporal Characteristics of the Correlation among Tourism, CO2 Emissions, and Economic Growth in China

1
Department of Tourism Management, Jinling Institute of Technology, Nanjing 210038, China
2
College of Earth Sciences, Chengdu University of Technology, Chengdu 610051, China
3
Key Laboratory of Coalbed Methane Resources and Reservoir Formation Process of the Ministry of Education, China University of Mining and Technology, Xuzhou 221116, China
*
Author to whom correspondence should be addressed.
Sustainability 2022, 14(14), 8373; https://doi.org/10.3390/su14148373
Submission received: 9 June 2022 / Revised: 2 July 2022 / Accepted: 6 July 2022 / Published: 8 July 2022
(This article belongs to the Section Sustainable Forestry)

Abstract

:
Elucidating the correlation among tourism, CO2 emissions, and economic growth from a spatiotemporal standpoint is of utmost significance for the tourism industry responding to China’s “double-carbon” goal. This study expansively uses the bottom-up approach, Theil index, Exploratory Spatial Data Analysis (ESDA), and Logarithmic Mean Divisia Index (LMDI) method to calculate tourism CO2 emissions (TE) at different spatial scales in China during 2000–2019, and based on the TE, we further analyze the spatial heterogeneity of the TE intensity (TEI) and examine the spatiotemporal effects of driving factors on TE increases. The results revealed that (i) China’s TE increased from 3714.06 × 104 t to 19,396.00 × 104 t, and the TEI declined from 47 to 9 g/yuan during 2000–2019. (ii) The high-TEI provinces varied from agglomerative distribution in the north by western region to scattered distribution in the eastern region. (iii) China’s TEI exhibited increasing spatial differences, primarily within regions during 2000–2009, which also distributed with both the global and local agglomeration in space before 2014, and since then, only the local agglomeration enhanced and characterized by diffusing low–low (L–L) agglomeration from the east to the central and west regions. (iv) The tourism industrial scale and the industrial economy exerted cumulative effects on TE increases, and the energy intensity and energy structure exerted reduction effects. The spatial structure played different roles on TE among the regions. Policy implications are also discussed depending on the study results.

1. Introduction

With the escalation of global warming, carbon emissions have garnered increasing attention, and addressing climate change has become a global issue for humanity [1]. As China’s economy is growing rapidly, urbanization and industrialization are advancing continuously, and the energy demand is increasing rapidly, a prominent contradiction exists between economic growth and the energy environment [2]. Per the International Energy Agency (IEA), China’s total CO2 emissions exceeded that of the United States in 2007 and ranked first globally [3]. Amid intense international pressure to decrease carbon emissions, China pledged at the Paris Climate Conference in 2015 to decrease carbon emissions per unit of GDP by 60–65% till 2030, thereby attaining a solid decoupling of economic growth, resources consumption, and carbon emissions. Nevertheless, data from the BP Statistical Yearbook of World Energy (2021) showed that China’s CO2 emissions increased by 0.6% in 2020, and its share increased from 20.9% in 2005 to 30.7% in 2020 [4]. Hence, China is facing unprecedented challenges while sustaining economic growth and controlling CO2 emissions.
To unswervingly follow the green and low-carbon, high-quality development path, in 2020, China officially proposed the strategic goal of striving to reach the carbon peaking by 2030 and carbon neutrality by 2060. Additionally, the “double-carbon” goal was incorporated into the 2021 government work report for the first time, suggesting that in managing the correlation between development and emission reduction, China will firmly promote greener economic and social transformation and development based on the low-carbon use of energy. In China, the tourism industry has been a strategic pillar industry of the national economy. With the rapid development of the tourism scale, tourism CO2 emissions (TE) have long been a key factor affecting the environmental quality [5,6]. Thus, China’s tourism industry has a more critical responsibility and plays a vital role in responding to climate change and executing energy conservation and emission reduction.
At present, both domestic and foreign studies conducted quantitative research on TE, primarily focusing on aspects of the TE measurement [7,8,9,10], factors affecting TE [11,12,13,14], the decoupling effect of TE [15,16,17], TE efficiency [18], and other segments. Overall, studies have used different methods and perspectives to analyze TE and obtained many valuable research conclusions [19,20,21,22]. Nevertheless, the response of China’s tourism industry to the “double-carbon” goal remains unclear. Many issues are worth extensive and continuous investigation, such as:
(i) The country’s 14th Five-Year Plan and the Outline of Vision for 2035 proposed “implement a system that focuses on carbon intensity control and supplements by total carbon emission control in reaching the carbon peaking” [23]. Regarding tourism, TE intensity (TEI) control becomes an essential issue. TEI is the amount of CO2 emissions produced by a unit of tourism economic growth, based on which the correlation between the tourism economic growth and environmental impact can be judged. Thus, to promote emission reduction from the tourism industry, we should focus more on reducing TEI. Nevertheless, few studies on TEI have been conducted with a short period and relatively outdated data [24,25,26], which might lead to a limited understanding of the evolutional dynamics of TEI.
(ii) It is imperative to attach great importance to the fact that for a developing country with a massive volume like China that implements emission-reduction policies from top to bottom, the impact of regional differences and interactions cannot be overlooked [27,28]. The economic benefits, industrial scale, industrial structure, energy consumption, and technology of tourism in different areas will markedly affect the TE and TEI [29,30]. Exploring the driving factors of China’s TE from a spatial standpoint can help us elucidate the correlation between tourism development and CO2 emissions, which is also the key to formulating policies in alignment with local conditions and breaking through the barriers of administrative divisions to bolster the overall tourism low-carbon development. Nevertheless, there is a little exploration in this field in China [31,32,33], which might hinder the specific optimization countermeasures owing to the lack of considering the spatial effect.
Based on the abovementioned considerations, this study takes China’s provincial tourism industry as the primary research unit, takes 2000–2019 as the time series, and comprehensively uses the bottom-up method, Theil index, Exploratory Spatial Data Analysis (ESDA), and Logarithmic Mean Divisia Index (LMDI) to extensively research the following issues:
(1).
The spatiotemporal evolution of China’s TE.
(2).
The spatiotemporal evolution and heterogeneity of TEI, demonstrating the correlation changes between tourism economic growth and CO2 emissions.
(3).
The spatiotemporal evolution of the effects of driving forces on China’s TE, demonstrating the correlation changes between tourism development and CO2 emissions.
Through the research, we hope to explicate the correlation changes between tourism development, CO2 emissions, and economic growth at multi-spatial scales and provide a policy basis for the development of China’s low-carbon economic tourism.

2. Literature Review

2.1. Impact of Tourism on CO2 Emissions

The nexus between tourism and the environment is very complex [34]. Some studies have demonstrated that tourism had a significantly negative impact on CO2 emissions in both long and short perspective [35,36]. However, by comparing analysis, Paramati et al. [37] pointed out that the impact of tourism on CO2 emissions decreases much faster in the developed economies than in the developing ones [37]. Through a study conducted in the EU from 1991 to 2013, an opposite finding has been indicated that tourism reduces CO2 emissions in the western part of the EU and contributes to them in the eastern part of the EU [38]. As Katircioglu et al. [39] observed, the negative environmental impact is not caused by every kind of tourism activity. Tang et al. [33] indicated that the volume of tourist traffic, tourist production, and the energy structure affect the increase in carbon dioxide emissions.
Although there are still controversies about the relationship between tourism and carbon emissions in empirical research, the academic community basically recognizes the direct impact of tourism sectors in promoting carbon emissions. Tourism transport is the most vital polluting sources [6,40,41], and tourism activity as well as the accommodation sector are also the important sources of carbon emissions [34,42,43]. For instance, a global estimation by UNWTO-UNEP-WMO [1] reported that the share of tourism in global CO2 emissions was at 4.9%, among which 75% was derived from tourism transport. A more recent study conducted by Lenzen at al. [44] also estimated that the contribution of tourism to global emissions was 8.1%, with 49.1% attributed to transport.

2.2. TE Measurement

TE measurement is a crucial basis for judging the dynamic changes in TE. From the standpoint of spatial scale, the measurement of TE comprises global, national, regional, provincial, municipal, and other aspects, covering a broad range [1,6,45,46,47,48,49]. For example, Lenzen et al. [44] assessed carbon emissions from tourism on a global scale. Robaina-Alves et al. [50] assessed the energy consumption and carbon emissions of Portuguese tourism industry at the national level. Taking the Yangtze River Delta in China as an example, Chen et al. [6] indicated the carbon emissions was increasing with the fast development of regional tourism during 2001 to 2015. Moreover, as the smallest spatial scale of tourist destination, Wang et al. [51] estimated the greenhouse gas emissions of amusement parks in Taiwan.
Furthermore, from the aspect of research methods, Kelly et al. [52] first proposed a bottom-up method to identify and evaluate the impact of tourism energy management schemes on greenhouse gas emissions by measuring the total TE. Dwyer et al. [53] measured TE in Australia using the production approach and expenditure approach. The results showed that the tourism greenhouse gas emissions measured by the production approach accounted for 3.9% of the total emissions, compared with 5.3% by the expenditure approach. Wu and Shi [54] estimated the total TE in China using the bottom-up approach, which starts with the tourists in the destination and statistically calculates the energy consumption and carbon emissions level by level. Camelia et al. [55] investigated the impact of changes in the final demand for tourism sector on the CO2 emissions in Romania, using the environmental input–output IO approach. Zhong et al. [56] introduced the ecological multiplier method, together with the input–output table, and measured China’s total TE through the bottom-up approach. In addition, the environmentally extended tourism satellite account was applied to calculate direct and indirect TE [57]. Despite various methods used for calculating TE, significant controversy exists about the accuracy of each method; the critical value of TE measurement is that it can help all circles understand its changing trend and contribution to carbon emissions at different spatial scales [25,26,27,56,57,58,59,60].

2.3. TEI

Some countries consider the carbon emission intensity of various economic sectors as the basis for formulating policies [61]. TEI denotes the TE per unit of tourism revenue, and the most significant advantage of TEI lies in combining tourism’s economic benefits and environmental damage. Wang et al. demonstrated that China’s TEI was constantly declining during 1993–2012 [31]. Neger et al. [41] revealed the need to include indicators in the national tourism statistics and visitor surveys for the accurate calculation of the sector’s carbon intensity. Overall, if the tourism income and employment continue to uphold or increase, TEI is a valuable indicator [61].
Nevertheless, relevant studies on TE and TEI from the standpoint of regional differences and interactions are limited. Indeed, with economic globalization and integration becoming the development trend, the indirect impact of neighboring countries or areas on CO2 emissions is becoming increasingly prominent and has garnered the attention and research of scholars. Yao et al. claimed that the TEI of various cities has a strong spatial correlation and agglomeration in China’s Yangtze River Delta region during 2010–2016 [62]. Wang et al. reported that global CO2 emissions have significant spatial clustering characteristics, and the clustering types closely associate with geographic location and income level [63]. Furthermore, Wang et al. reported that regions with lower tourism eco-efficiency show diffusion trends [64].

2.4. Driving Forces of TE

Currently, two types of decomposition methods are used widely—structural decomposition analysis (SDA) [65] and index decomposition analysis (IDA) [66,67]. Compared with SDA, IDA is used widely in energy and environmental economics to assess energy consumption and emissions [32]. In addition, IDA uses the concept of index numbers during decomposition analysis and requires less data, making it more advantageous in studies involving temporal and spatial series [46]. Considering the data availability and the requirement of spatiotemporal analysis, IDA is adopted to analyze the factors that drive TE.
Of note, IDA is primarily divided into Laspeyres index decomposition and Divisia index decomposition analyses [66]. As the LMDI leaves no residuals during analysis and has time-reversal and factor-reversal characteristics, the LMDI method is selected to analyze the factors driving TE in Chinese provinces. LMDI performs well, primarily when significant variations exist in the values of variables, and LMDI can handle zero values in a dataset [66,67]. Using the LMDI method, Liu et al. demonstrated that energy intensity, expenditure size, and industry size were the primary forces driving TE growth in Chengdu city, China [5]. In addition, Liu et al. reported that tourist arrivals and expenditure size were the key factors in advancing TE and that decline in TEI could effectively lower the TE [68]. Moreover, Luo et al. investigated the tourist population and found that visitors’ average transport line distance were the primary contributors to the increase in direct TE [69]. Overall, similar with TE and TEI research, previous studies primarily investigated the influencing factors of TE through quantitative analysis but rarely consider spatial heterogeneity [70].

3. Materials and Methods

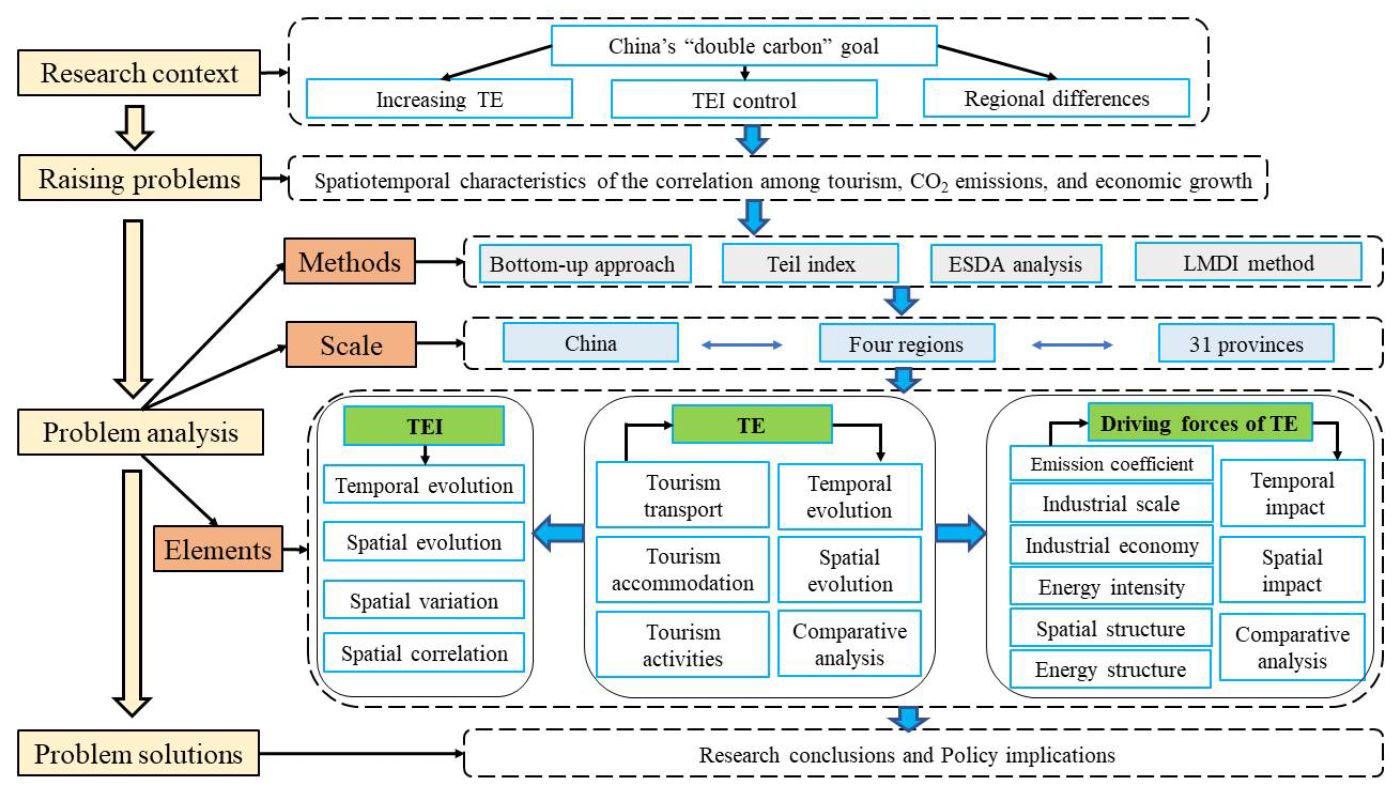
3.1. Research Framework

Figure 1 shows the research framework. China’s economic regions are categorized into four major regions: eastern, central, western, and northeastern. The east comprises Beijing, Tianjin, Hebei, Shanghai, Jiangsu, Zhejiang, Fujian, Shandong, Guangdong, and Hainan. The center comprises Shanxi, Anhui, Jiangxi, Henan, Hubei, and Hunan. The west comprises Inner Mongolia, Guangxi, Chongqing, Sichuan, Guizhou, Yunnan, Xizang, Shaanxi, Gansu, Qinghai, Ningxia, and Xinjiang. The northeast comprises Liaoning, Jilin, and Heilongjiang. Thus, we explored on the basis of three spatial scales, namely the 31 Provincial-level Administrative Regions (provinces) in China as the smallest spatial scale research unit (Hong Kong, Macau, and Taiwan are default owing to the lack of data), the four regions as medium spatial scales, and the whole country as the largest scale space.
Furthermore, from the temporal aspect, since the global outbreak of COVID-19 in 2020, China has taken an active and continuous flow-control approach to stop the rapid spread of the epidemic, and economic development has been sacrificed to some extent. Among all the industrial sectors, tourism has been one of the most seriously affected industries, given its human mobility feature. Since 2020, the tourism industry has experienced an abnormal market development state as a result of strict policy control. Thus, the research time selected in this paper is from the new century to the time before the outbreak, that is, 2000–2019.

3.2. Methods and Data Sources

3.2.1. Bottom-Up Approach

Currently, the tourism industry in China and all provinces has not yet established an independent industrial carbon emission accounting system and tourism satellite accounts. Meanwhile, it is pragmatic to focus on tourism-related industries as carbon sources directly originate from the three main sectors starting with tourists, namely accommodation, transportation, and activities when accounting for the environmental impact [6]. Therefore, the bottom-up approach is selected among various calculation methods for TE, which is more flexible and time-sensitive and includes the total direct TE and tourism energy consumption (TC) from the three sectors [54]. Drawing on the empirical research methods of Becken and Patterson [58] and Patterson and McDonald [71], we first estimated the TC and TE from the three sectors and then added them up. Then, represented each province with i , the total national TC in the year with E t o t a l t , and the total national TE in the year with C t o t a l t . The formula is as follows:
E t o t a l t = i = 1 31 ( E t r a n s p o r t t + E a c c o m m o d a t i o n t + E a c t i v i t i e s t )    
C t o t a l t = i = 1 31 ( C t r a n s p o r t t + C a c c o m m o d a t i o n t + C a c t i v i t i e s t )            
The formulas for calculating the TC and TE from three sectors are as follows:
          E t r a n s p o r t t = i = 1 31 j = 1 4 T i j t P j δ j
          C t r a n s p o r t t = i = 1 31 j = 1 4 T i j t P j θ j
      E a c c o m m o d a t i o n t = i = 1 31 B i t L i t ϑ
        C a c c o m m o d a t i o n t = i = 1 31 B i t L i t
E a c t i v i t i e s t = i = 1 31 q = 1 5 N i t A q t q
C a c t i v i t i e s t = i = 1 31 q = 1 5 N i t A q t q
Table 1 presents the parameter meanings and values of Formulas (3)–(8). Based on previous studies and combined with Chinese actual situation, we estimated the values of relevant parameters.

3.2.2. TEI

TEI is the amount of carbon dioxide emitted per unit of tourism revenue growth, calculated as follows:
Y i t = C i t R i t    
Y t o t a l t = i = 1 31 C i t i = 1 31 R i t = C t o t a l t R t o t a l t
where Y i t denotes the TEI of province i in year t ; Y t o t a l t   denotes the national TEI; C i t denotes the TE of province i in year t ; R i t denotes the provincial tourism revenue of province i in year t ; R t o t a l t   represents the national total tourism revenue in year t .

3.2.3. Theil Index

Theil index stems from physics, also known as the Theil entropy standard, and was proposed by economist Theil using the concept of entropy in information theory in 1976; it is an index for assessing fairness. It can measure the contribution of the disparity within and between groups to the overall disparity, respectively [74], which has been broadly used in regional comparisons of different dimensions [75,76]. The Theil index is used to analyze the spatial unbalanced characteristics of China’s TEI [31], the value of which is between 0 and 1. The smaller the value, the smaller the difference between regions or provinces. The larger the value, the more significant the differences between regions or provinces. The calculation and decomposition formula of the Theil index is as follows:
T = T B R + T w R
T B R = k = 1 4 C k t C t o t a l t ln C k t / C t o t a l t R k t / R t o t a l t
T W R = k = 1 4 C k t C t o t a l t i = 1 31 C k i t C k t ln C k i t / C k t R k i t / R k t  
where T , T B R , and T w R denote the overall difference of TEI, the difference of TEI among regions, and the difference of TEI within regions, respectively; C k t   denotes the TE of region   k   in year   t ; C k i t   denotes the TE of the province i   in region k in year t ; R k t   denotes the tourism revenue of region k   in year t ; R k i t   denotes the tourism revenue of the province i   in region k   in year t .

3.2.4. ESDA

ESDA is a spatial identification function and is primarily used for detecting the spatial correlation and aggregation effect of variables. It is categorized into global autocorrelation and local autocorrelation. Global autocorrelation is applied to detect the spatial pattern of the entire study area, and a single value reflects the degree of autocorrelation in the area. Local autocorrelation calculates the degree of correlation between each spatial unit and neighboring units on a certain attribute [63]. We assessed the spatial characteristics of the TEI of various provinces in China on global and local dimensions, respectively.
The global spatial autocorrelation is often measured by Moran’s I index, and its formula is:
I t = 31 × i = 1 31 m = 1 31 ω i m Y i t Y ¯ t Y m t Y ¯ t i = 1 31 m = 1 31 ω i m i = 1 31 ( Y i t Y ¯ t )      
where I t is global Moran’s I index in year t , and the range is [−1, 1]; Y i t and Y m t denote the TEIs at the spatial position i and m in year t ; Y ¯ t denotes the average TEI in year t ; and ω i m denotes the spatial weight matrix. If I t > 0 , a significant positive correlation exists, and similar observations (high or low) tend to be spatially clustered. If I t < 0 , a significant negative correlation, and similar observations tend to be spread out. No spatial autocorrelation exists when I = 0 . Meanwhile, statistical test of Moran’s value with Z-value is required to check the correlation.
In addition, we used the local indicators of spatial association (LISA) to analyze the local spatial association and difference of TEI between each province and its surrounding provinces. Currently, the commonly used LISA statistic is the localized version of Moran’s I [63,77]. The formula is:
I i t = 31 × Y i t Y ¯ t m = 1 31 ω i m ( Y m t Y ¯ t ) i = 1 31 ( Y i t Y ¯ t ) 2
If I i t > 0 , it signifies that the property value of the province is like that of the neighboring provinces, and I i t < 0 signifies that the property value of the province differs from that of the neighboring provinces.

3.2.5. LMDI Method

The Japanese energy economist Kaya proposed the Kaya identity in 1989 to determine the impact level of human activities on CO2 [78]. Recent studies showed that energy consumption and carbon emissions closely correlate with the industry and energy structure, energy efficiency, and other variables [6,33]. Considering this, by extension, the Kaya identity can be used to examine the primary driving forces of TE [5,66]. The formula is:
C t o t a l = i = 1 31 x = 1 3 C i x = i = 1 31 x = 1 3 C i x E i x E i x E i E i G i G i G G V V
where C t o t a l denotes the total TE in China; C i x and E i x denote the TE and TC from the province i , sector x , respectively; E i denotes the total TC from the province i ; G i denotes the tourism revenue from the province i ; G denotes the total tourism revenue of China; V denotes the total number of Chinese tourist arrivals. Let:
μ = C i x E i x , ρ = E i x E i , σ = E i G i , τ = G i G , φ = G V , = V
where μ   denotes the TE per unit of TC from sector x (tourism transportation, tourism accommodation, and tourism activities) of province i , representing the TE coefficient; ρ represents the proportion of the TC from sector x to the total TC of province i , reflecting the tourism energy structure of the province; σ is the TC per unit of tourism revenue of province i , that is, the tourism energy intensity, which can measure the technical level and energy efficiency of the place; τ   is the proportion of the tourism revenue of province i to the total tourism revenue, presenting the spatial distribution structure of tourism; φ denotes the per-capita tourism consumption, reflecting the consumption level of the tourism industry and the economic status of the industry; is the number of tourists, reflecting the reception scale of the tourism industry.
Then, the LMDI method was used to decompose the factors driving TE [66,79,80]. The variation in TE ( Δ C ) can be decomposed into:
Δ C = C t C 0 = Δ C u + Δ C ρ + Δ C σ + Δ C τ + Δ C φ + Δ C    
Δ C μ ,   Δ C ρ , Δ C σ , Δ C τ , Δ C φ , Δ C , respectively, represent the variation in TE due to changes in the six driving forces mentioned above. According to LMDI, the expressions of the contribution values of the decomposition factors are as follows:
Δ C μ = i = 1 31 x = 1 3 C i x t C i x 0 ln C i x t ln C i x 0 ln μ t μ 0
Δ C ρ = i = 1 31 x = 1 3 C i x t C i x 0 ln C i x t ln C i x 0 ln ρ t ρ 0
Δ C σ = i = 1 31 x = 1 3 C i x t C i x 0 ln C i x t ln C i x 0 ln σ t σ 0  
  Δ C τ = i = 1 31 x = 1 3 C i x t C i x 0 ln C i x t ln C i x 0 ln τ t τ 0
Δ C φ = i = 1 31 x = 1 3 C i x t C i x 0 ln C i x t ln C i x 0 ln φ t φ 0  
Δ C = i = 1 31 x = 1 3 C i x t C i x 0 ln C i x t ln C i x 0 ln t 0  
According to the formulas, each item on the right is marked as F μ , F ρ , F σ , F τ , F φ , F ; then, the driving forces can be called TE coefficient effect F u , energy structure effect F ρ , energy intensity effect F σ , spatial structure effect F τ , industrial economic effect F φ , and industrial scale effect F .

3.2.6. Data Sources

The primary data and sources primarily included: (i) the passenger turnover of four types of tourism transportation, the number of inbound and domestic tourists, and the inbound and domestic tourism income from the Statistical Yearbooks of various provinces and the National Economy and Social Development Statistical Bulletin from 2001 to 2020. Each province’s total annual tourism revenue is the sum of domestic tourism revenue and tourism foreign exchange revenue, of which tourism foreign exchange revenue (USD) is converted into RMB according to the average exchange rate of RMB to USD for the year issued by the National Bureau of Statistics. (ii) The number of beds and room occupancy rates of star-rated tourist hotels in each province were from the China Tourism Statistical Yearbook from 2001 to 2020. (iii) The proportion of various tourism activities of inbound tourists, urban and rural, came from the Inbound Tourist Sampling Survey Data (2001–2008), sample survey data of domestic tourism in China (2001–2008), and Tourism Sampling Survey Data (2009–2020). The national data were applied to replace the proportion of urban and rural tourist numbers in each province.

4. Results and Analysis

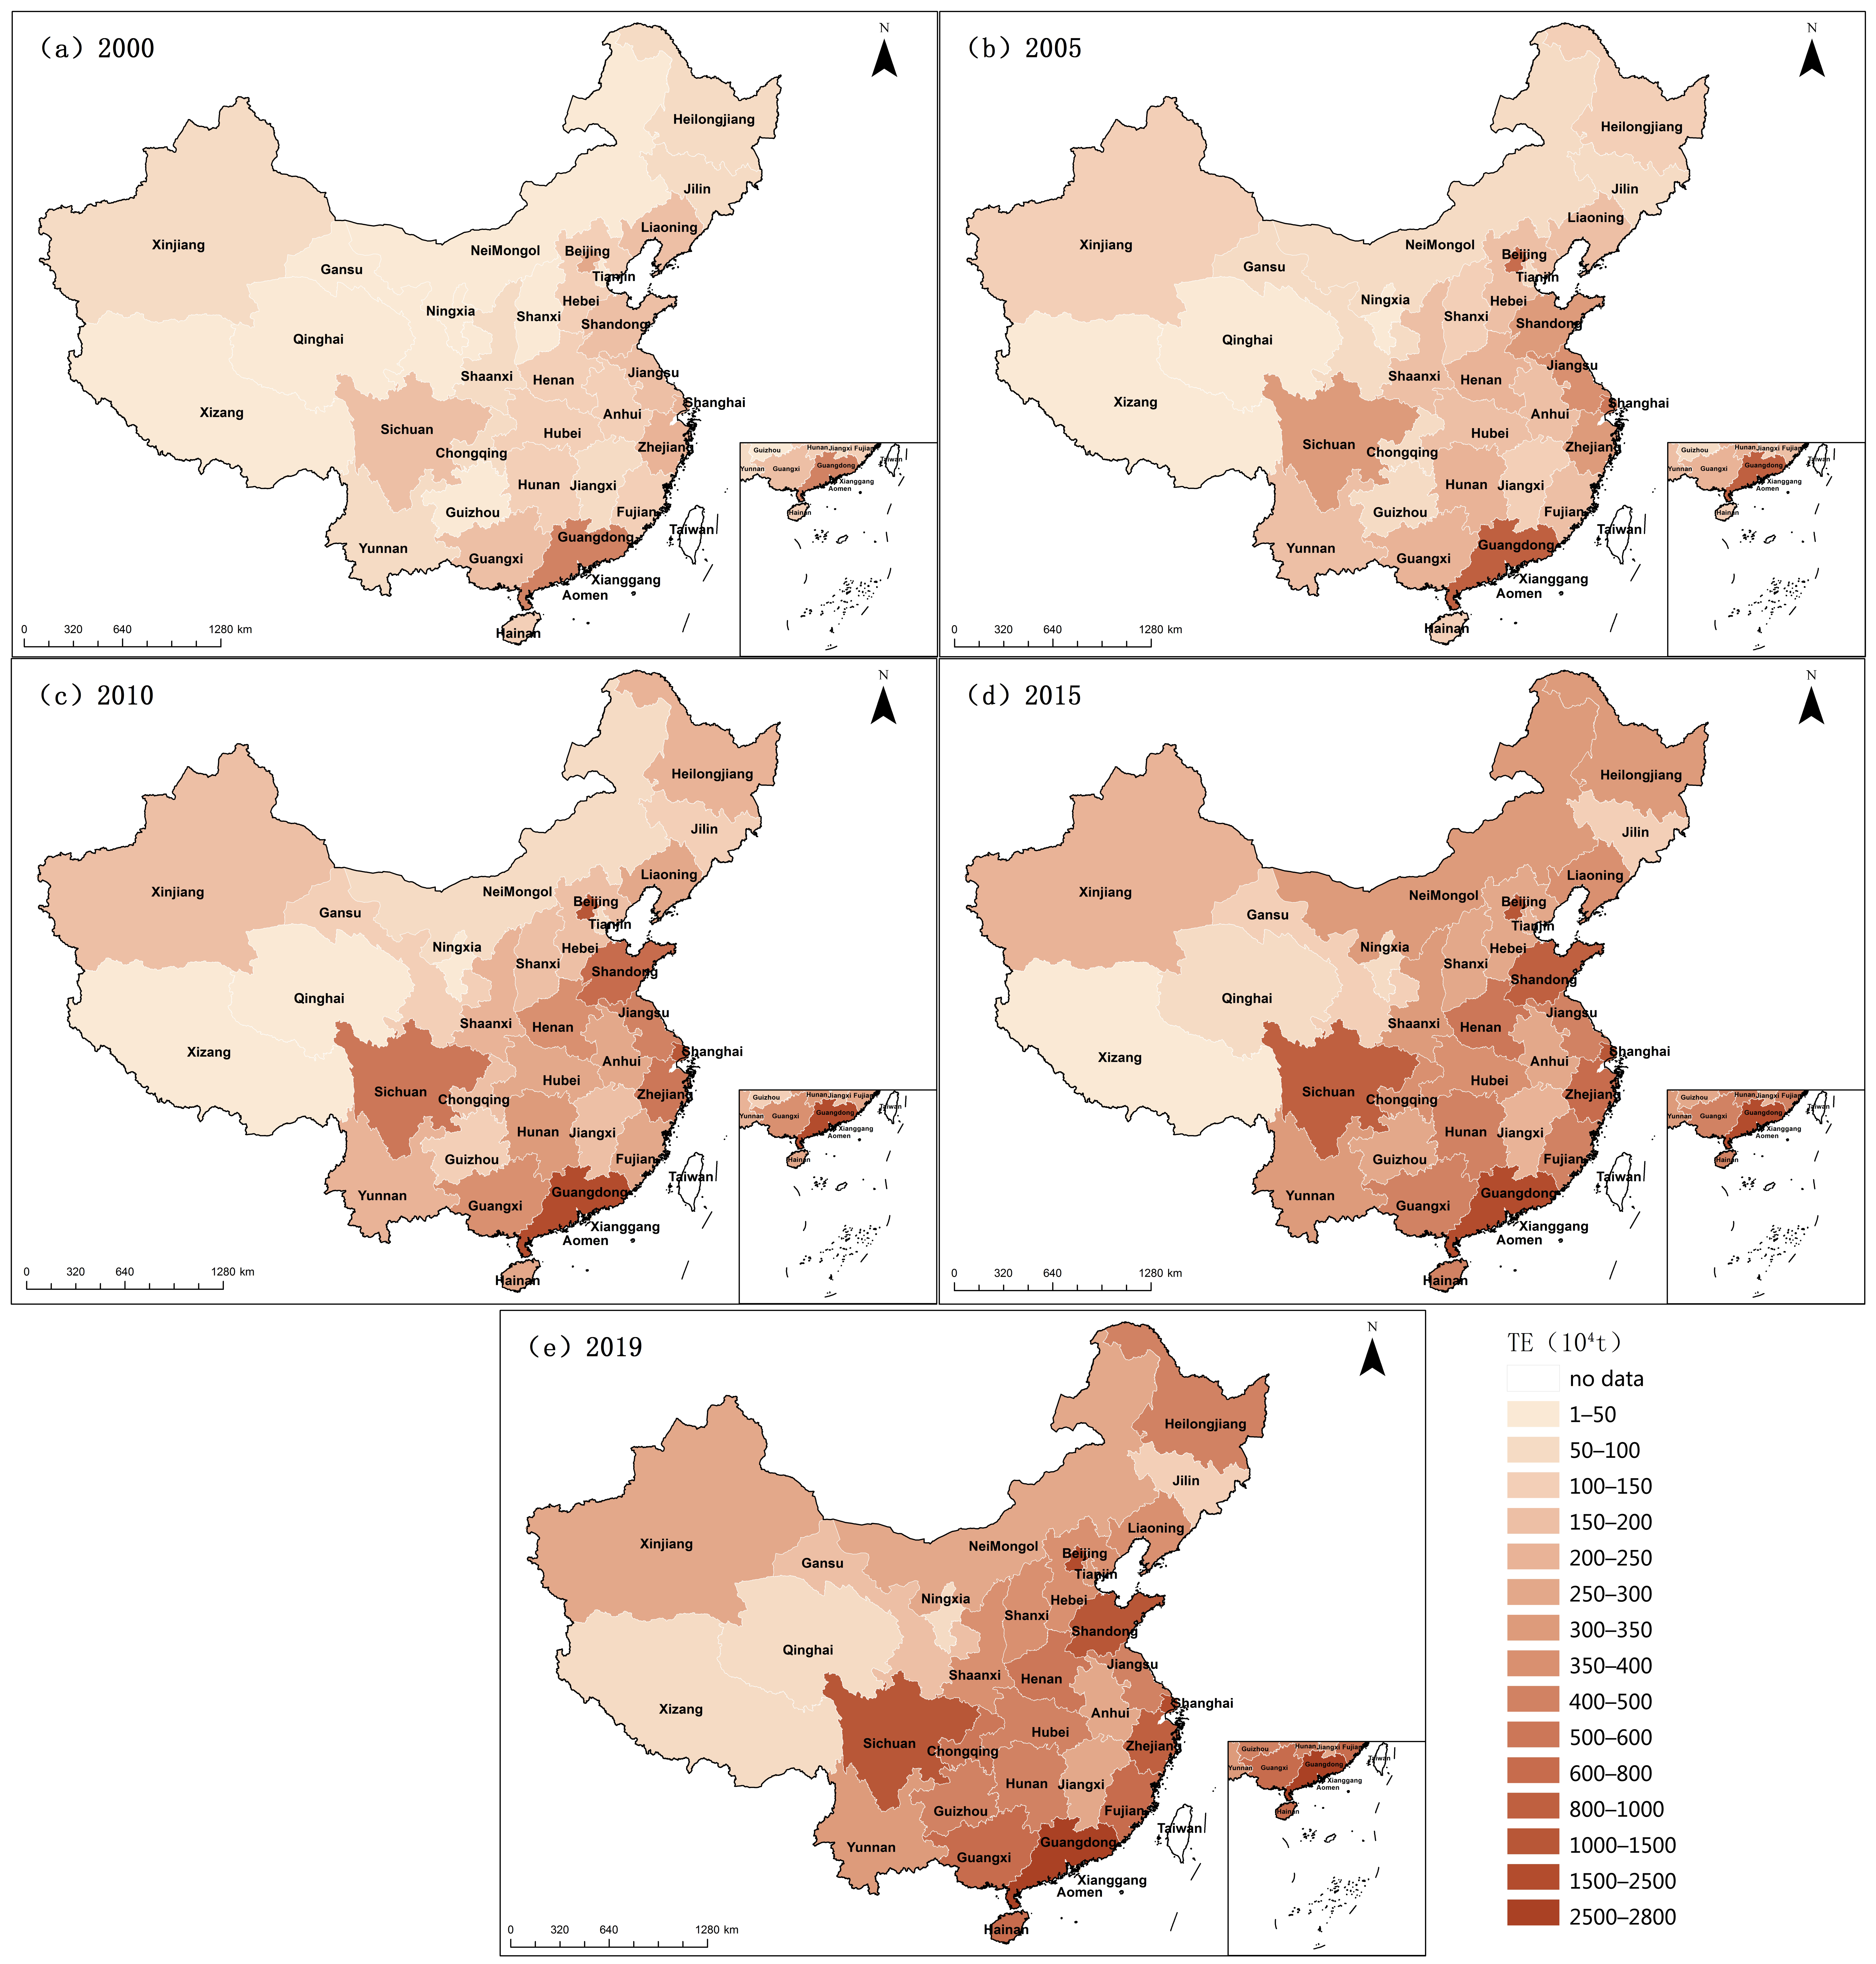
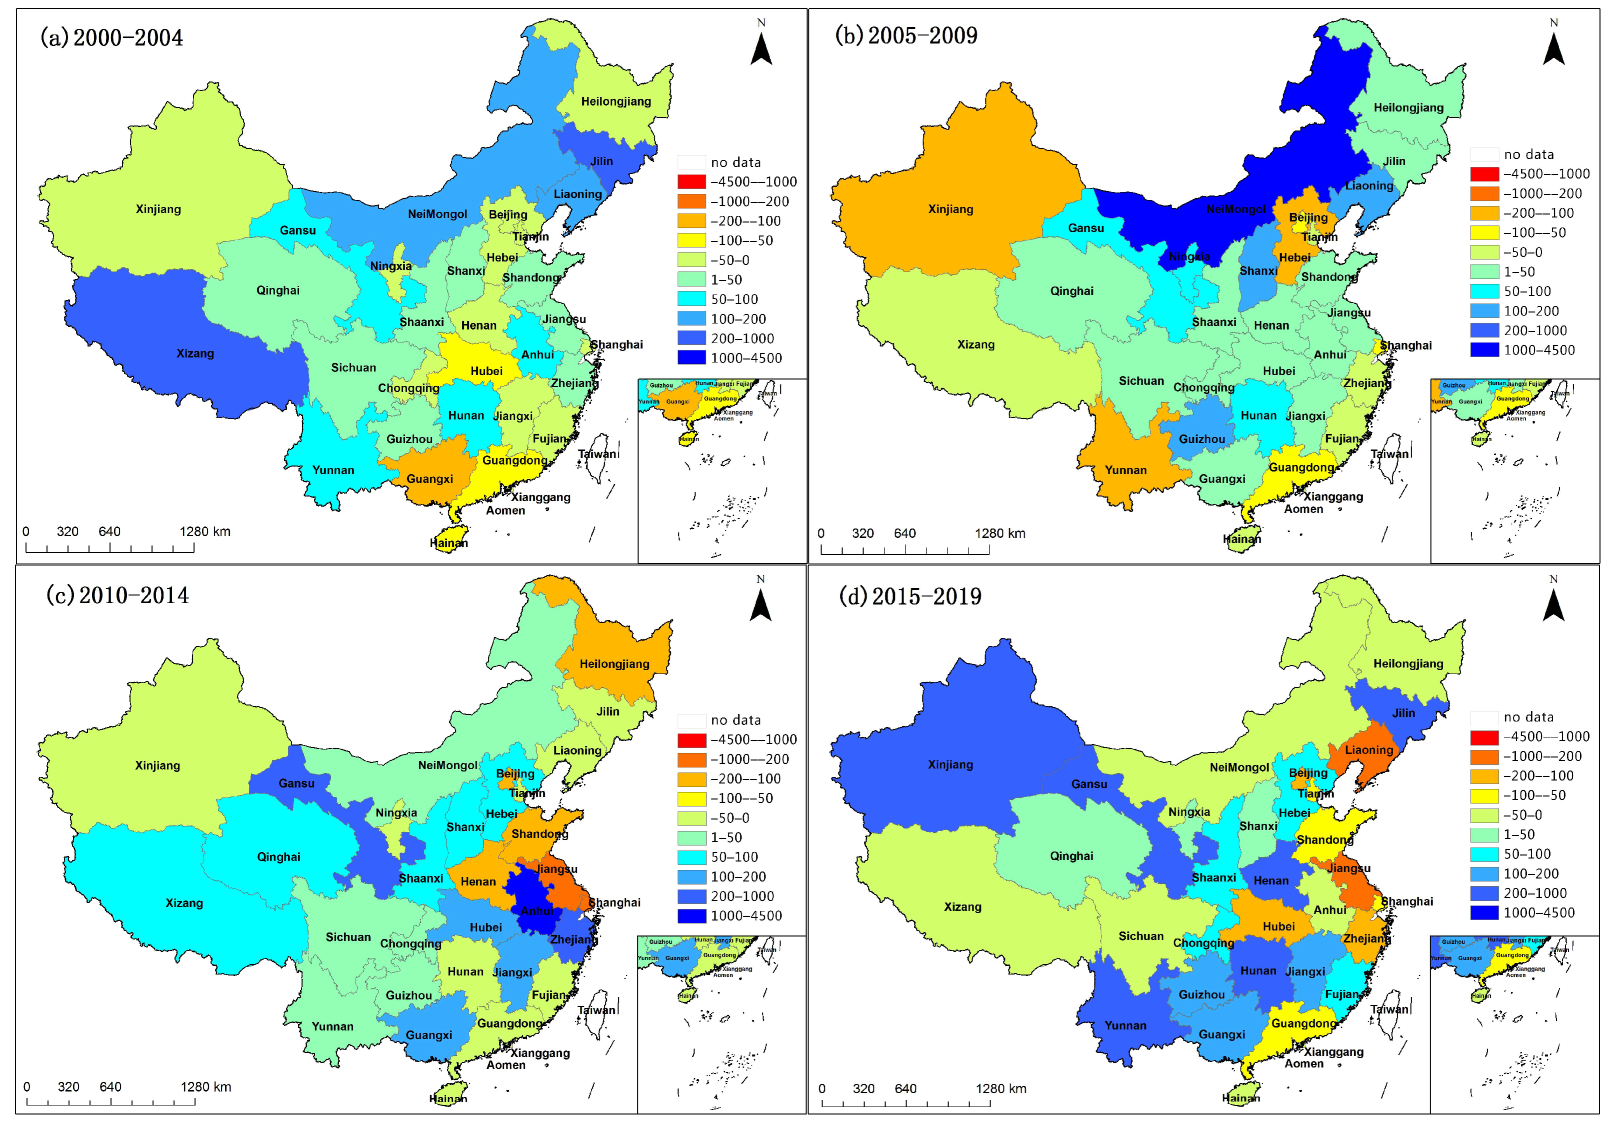
4.1. Spatiotemporal Evolution of TE

4.1.1. Evolutional Characteristics of TE at National and Regional Scales

According to Formulas (1)–(8), Figure 2 shows the results of TE and their annual growth rates. China’s total TE exhibited a rapid growth trend, from 3714.06 × 104 t in 2000 to 19,396.00 × 104 t in 2019, with an average annual growth rate of 9.32%, suggesting that the overall development of the tourism industry was still highly dependent on fuel energy.
Based on the inter-annual changes of TE, the temporal variation in China’s TE can be categorized into three stages. The first stage was the period of rapid growth (2000–2007), during which TE fluctuated markedly and increased rapidly, with an average annual growth rate of 12.61%, far exceeding the average during the study period. Among them, the fluctuations during 2003–2004 were the most significant. Affected by the SARS epidemic in 2003, the tourism flow was strictly restricted, and the growth rate of TE exhibited a negative growth rate of only –0.49%. In 2004, the tourism industry in China was ushered in. With the overall revitalization, the inbound tourism market has fully recovered to the best level in history and has made breakthroughs. The number of inbound tourists exceeded 100 million for the first time, and the number of domestic tourists also exceeded 1 billion for the first time [81], which led to a remarkable TE increase in 2004.
The second stage was the steady growth stage (2008–2012), of which the average annual growth rate was 8.74%. The growth rate and fluctuation range slowed down markedly compared with the previous period. In 2008, owing to a series of disaster events and financial crises, inbound tourism experienced the first negative growth since SARS, and the growth rate of domestic and outbound tourism decelerated significantly; this year, the growth of TE was only 3.70%.
The third stage was the slow growth stage (2013–2019). The average annual growth rate was only 6.45%. At the end of 2012, the “Eight Regulations of the Central Government” was promulgated, and illegal activities, such as public funds eating, drinking, and reception, were effectively curbed. In 2013, the occupancy rate of star-rated hotels declined considerably. Meanwhile, with the accentuated green development in China, in 2016 and 2019, the growth rate of TE even fell below 6.00%.
From the aspect of TE changes in each region, both the order of the TE increase and the average annual growth rate are the east, west, central, and northeast increased by 4.89, 4.47, 2.81, and 2.14 times, respectively; the growth rates were 10.11%, 9.53%, 7.60%, and 6.51%, respectively.

4.1.2. Evolutional Characteristics of TE at the Provincial Scale

As shown in Figure 3, TE in all provinces exhibited a significant increasing trend. In 2000 (Figure 3a), the five provinces with the highest TE were Guangdong (488.2 × 10⁴ t), Beijing (275.15 × 10⁴ t), Shanghai (226.48 × 10⁴ t), Zhejiang (200.96 × 10⁴ t), and Jiangsu (189.19 × 10⁴ t), all located in the eastern part of China. In contrast, Xizang, Qinghai, Ningxia, Tianjin, and Gansu had the lowest TE that year, all of which were below 45 × 104 t, especially Xizang, with only 5.26 × 10⁴ t.
In 2005 (Figure 3b), TE of Guangdong firstly approached 1000 × 104 t. In 2010 (Figure 3c), TE of Guangdong, Beijing, and Shanghai exceeded 1000 × 104 t, and Sichuan, Shandong, and Zhejiang exceeded 500 × 104 t emissions. In 2015 (Figure 3d), the newly added TE in Henan Province exceeded 500 × 104 t, and a total of 19 provinces’ TE exceeded 300 × 104 t. Compared with 2005, TE in 20 provinces have doubled, of which seven provinces have tripled. In 2019 (Figure 3e), TE in most provinces was still increasing.
From the overall change during the study period, Guangdong, Beijing, and Shanghai reported the most significant increase in TE with 2261.88 × 104 t, 1946.39 × 104 t, and 1655.11 × 104 t, respectively. The average growth rate of TE in Xizang, Tianjin, and Shanghai was the fastest, with 17.83%, 14.45%, and 13.54%.

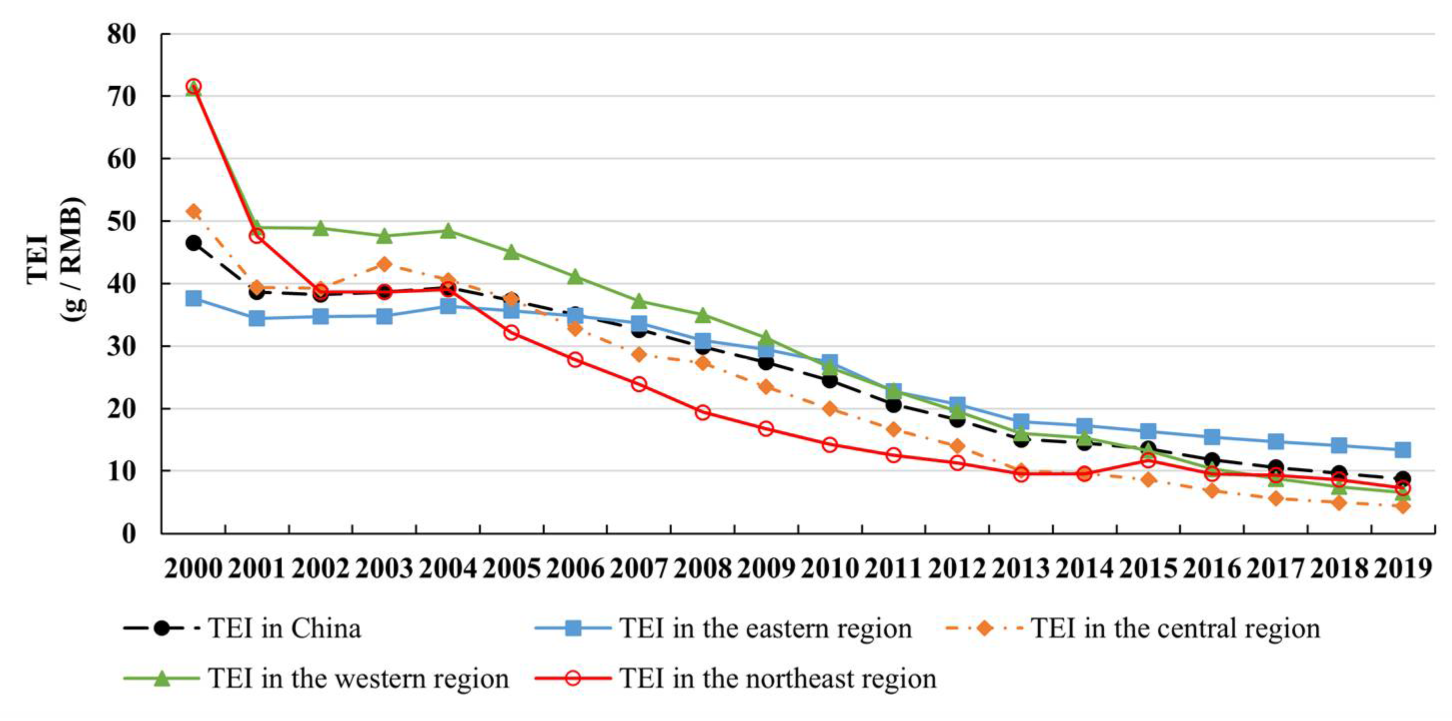
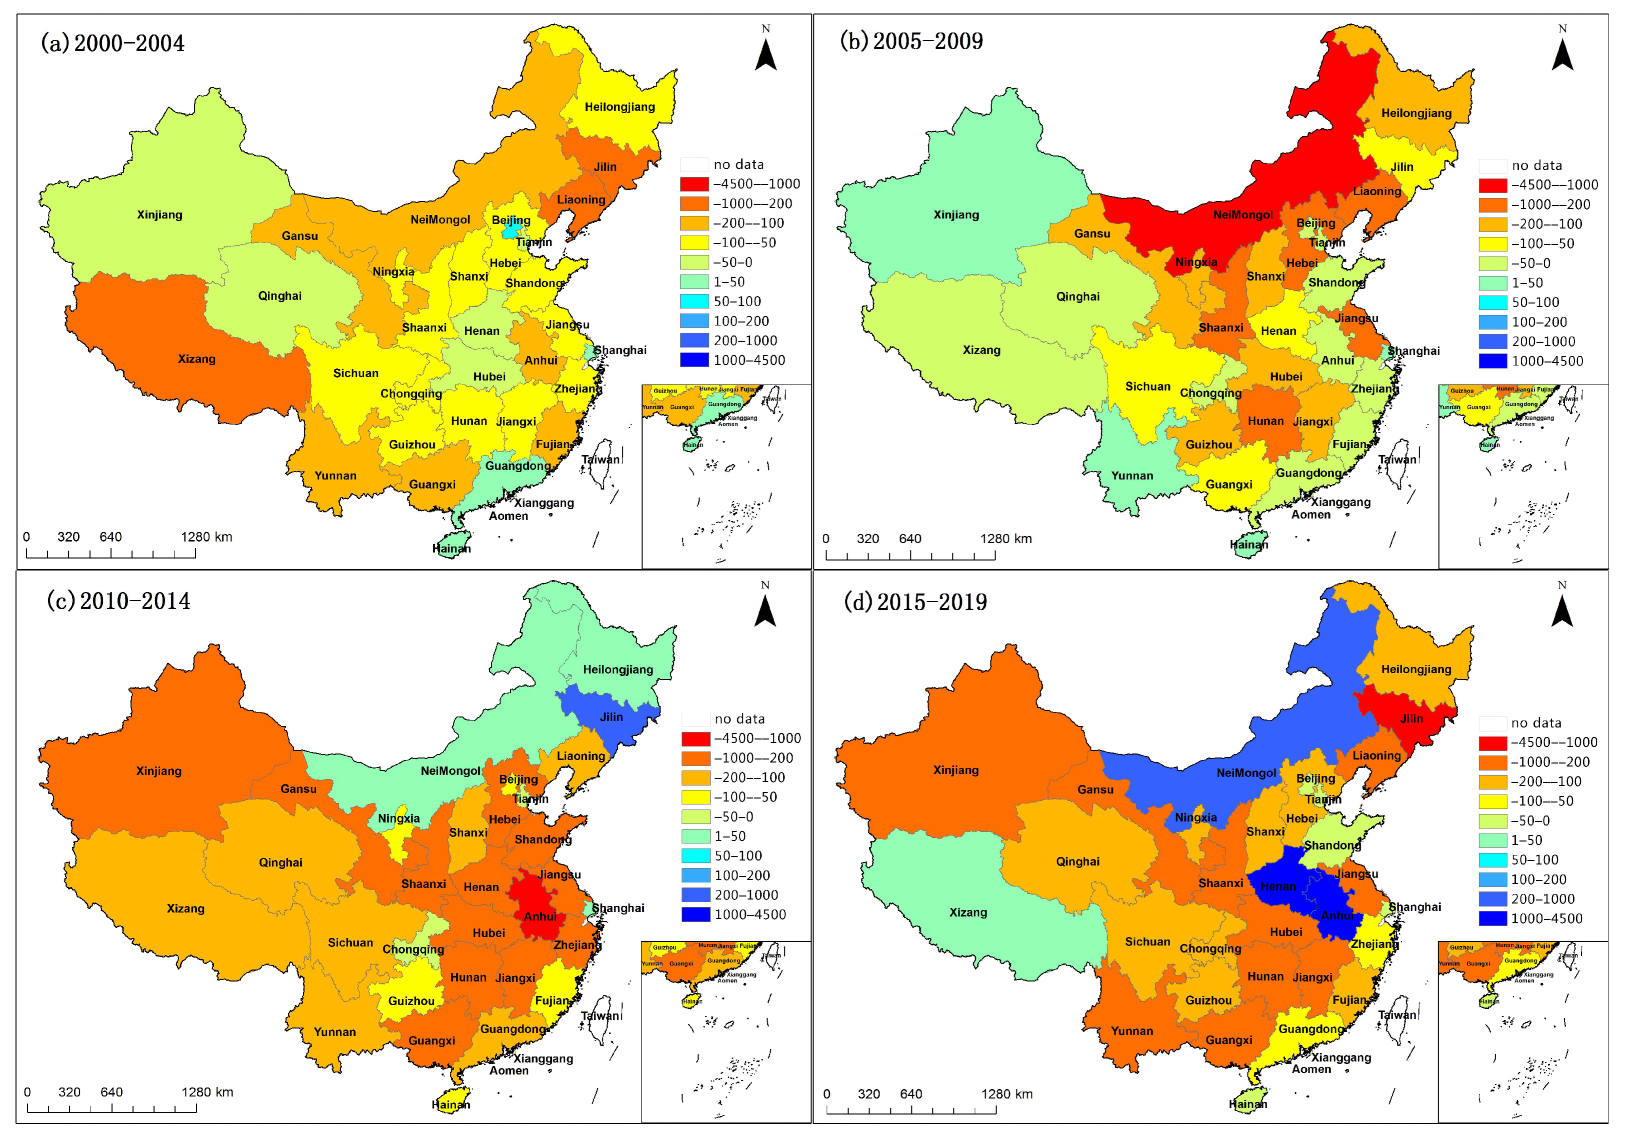
4.2. Spatiotemporal Evolution of TEI

4.2.1. Evolutional Characteristics of TEI at National and Regional Scales

According to Formulas (9) and (10), TEI was calculated, as shown in Figure 4. The overall TEI in China exhibited a rapid downward trend, from 47 g/RMB in 2000 to 9 g/RMB in 2019. Except for a marginal increase in 2003 and 2004, the overall rate declined at an average annual rate of 8.28%.
To further compare the changes in each stage, in the first stage (2000–2007), both the tourism economy and TE grew at a high rate (annual average of 18.44% and 12.61%), while TEI declined the slowest (annual average of −4.76%), reflecting the discrepancy between tourism economic development and environmental impact at this stage. In the second stage (2008–2012), the tourism economy grew the fastest (annual average of 22.29%), the growth rate of TE decreased (annual average of 8.74%), and TEI fell significantly (annual average of −10.96%), reflecting the low-carbon transformation of the tourism industry. In the third stage (2013–2019), the tourism economy was still proliferating (annual average of 18.14%), the growth rate of TE was the slowest (annual average of 6.45%), and TEI maintained a rapid decline (annual average −9.87%). From a comprehensive comparison, since the second stage, the TEI control has gradually exhibited practical results. Especially since the “18th National Congress,” the enhancement of energy utilization technology, the continuous deepening of energy conservation and emission reduction actions, the dependence of tourism economic development on carbon emissions has been reduced further, fully reflecting the continuous transformation of China’s tourism economy and atmospheric environmental protection from conflicting to coordinated development.
From the standpoint of TEI changes in four regions, both the order of decrease and the average annual decline rate of TEI during the study period were, in the central, west, northeast, and east areas, 91.39%, 90.83%, 89.80%, and 64.41%, respectively, and the deceleration rates were 11.71%, 11.48%, 10.65%, and 5.17%, respectively. Further comparing the TEI changes of each region in three stages, we found that TEI in the central and western regions decreased gradually, and the rate of decline increased, while TE continued to increase, and the growth rate decreased gradually, reflecting the characteristics of continuous low-carbon transformation. The eastern and northeastern regions exhibited prominent low-carbon characteristics in the first to second stages of transformation. Nevertheless, in the third stage, they exhibited a decline in the growth rate of the tourism economy, carbon emission growth rate, and TEI, indicating that the development speed of low carbonization has stalled.

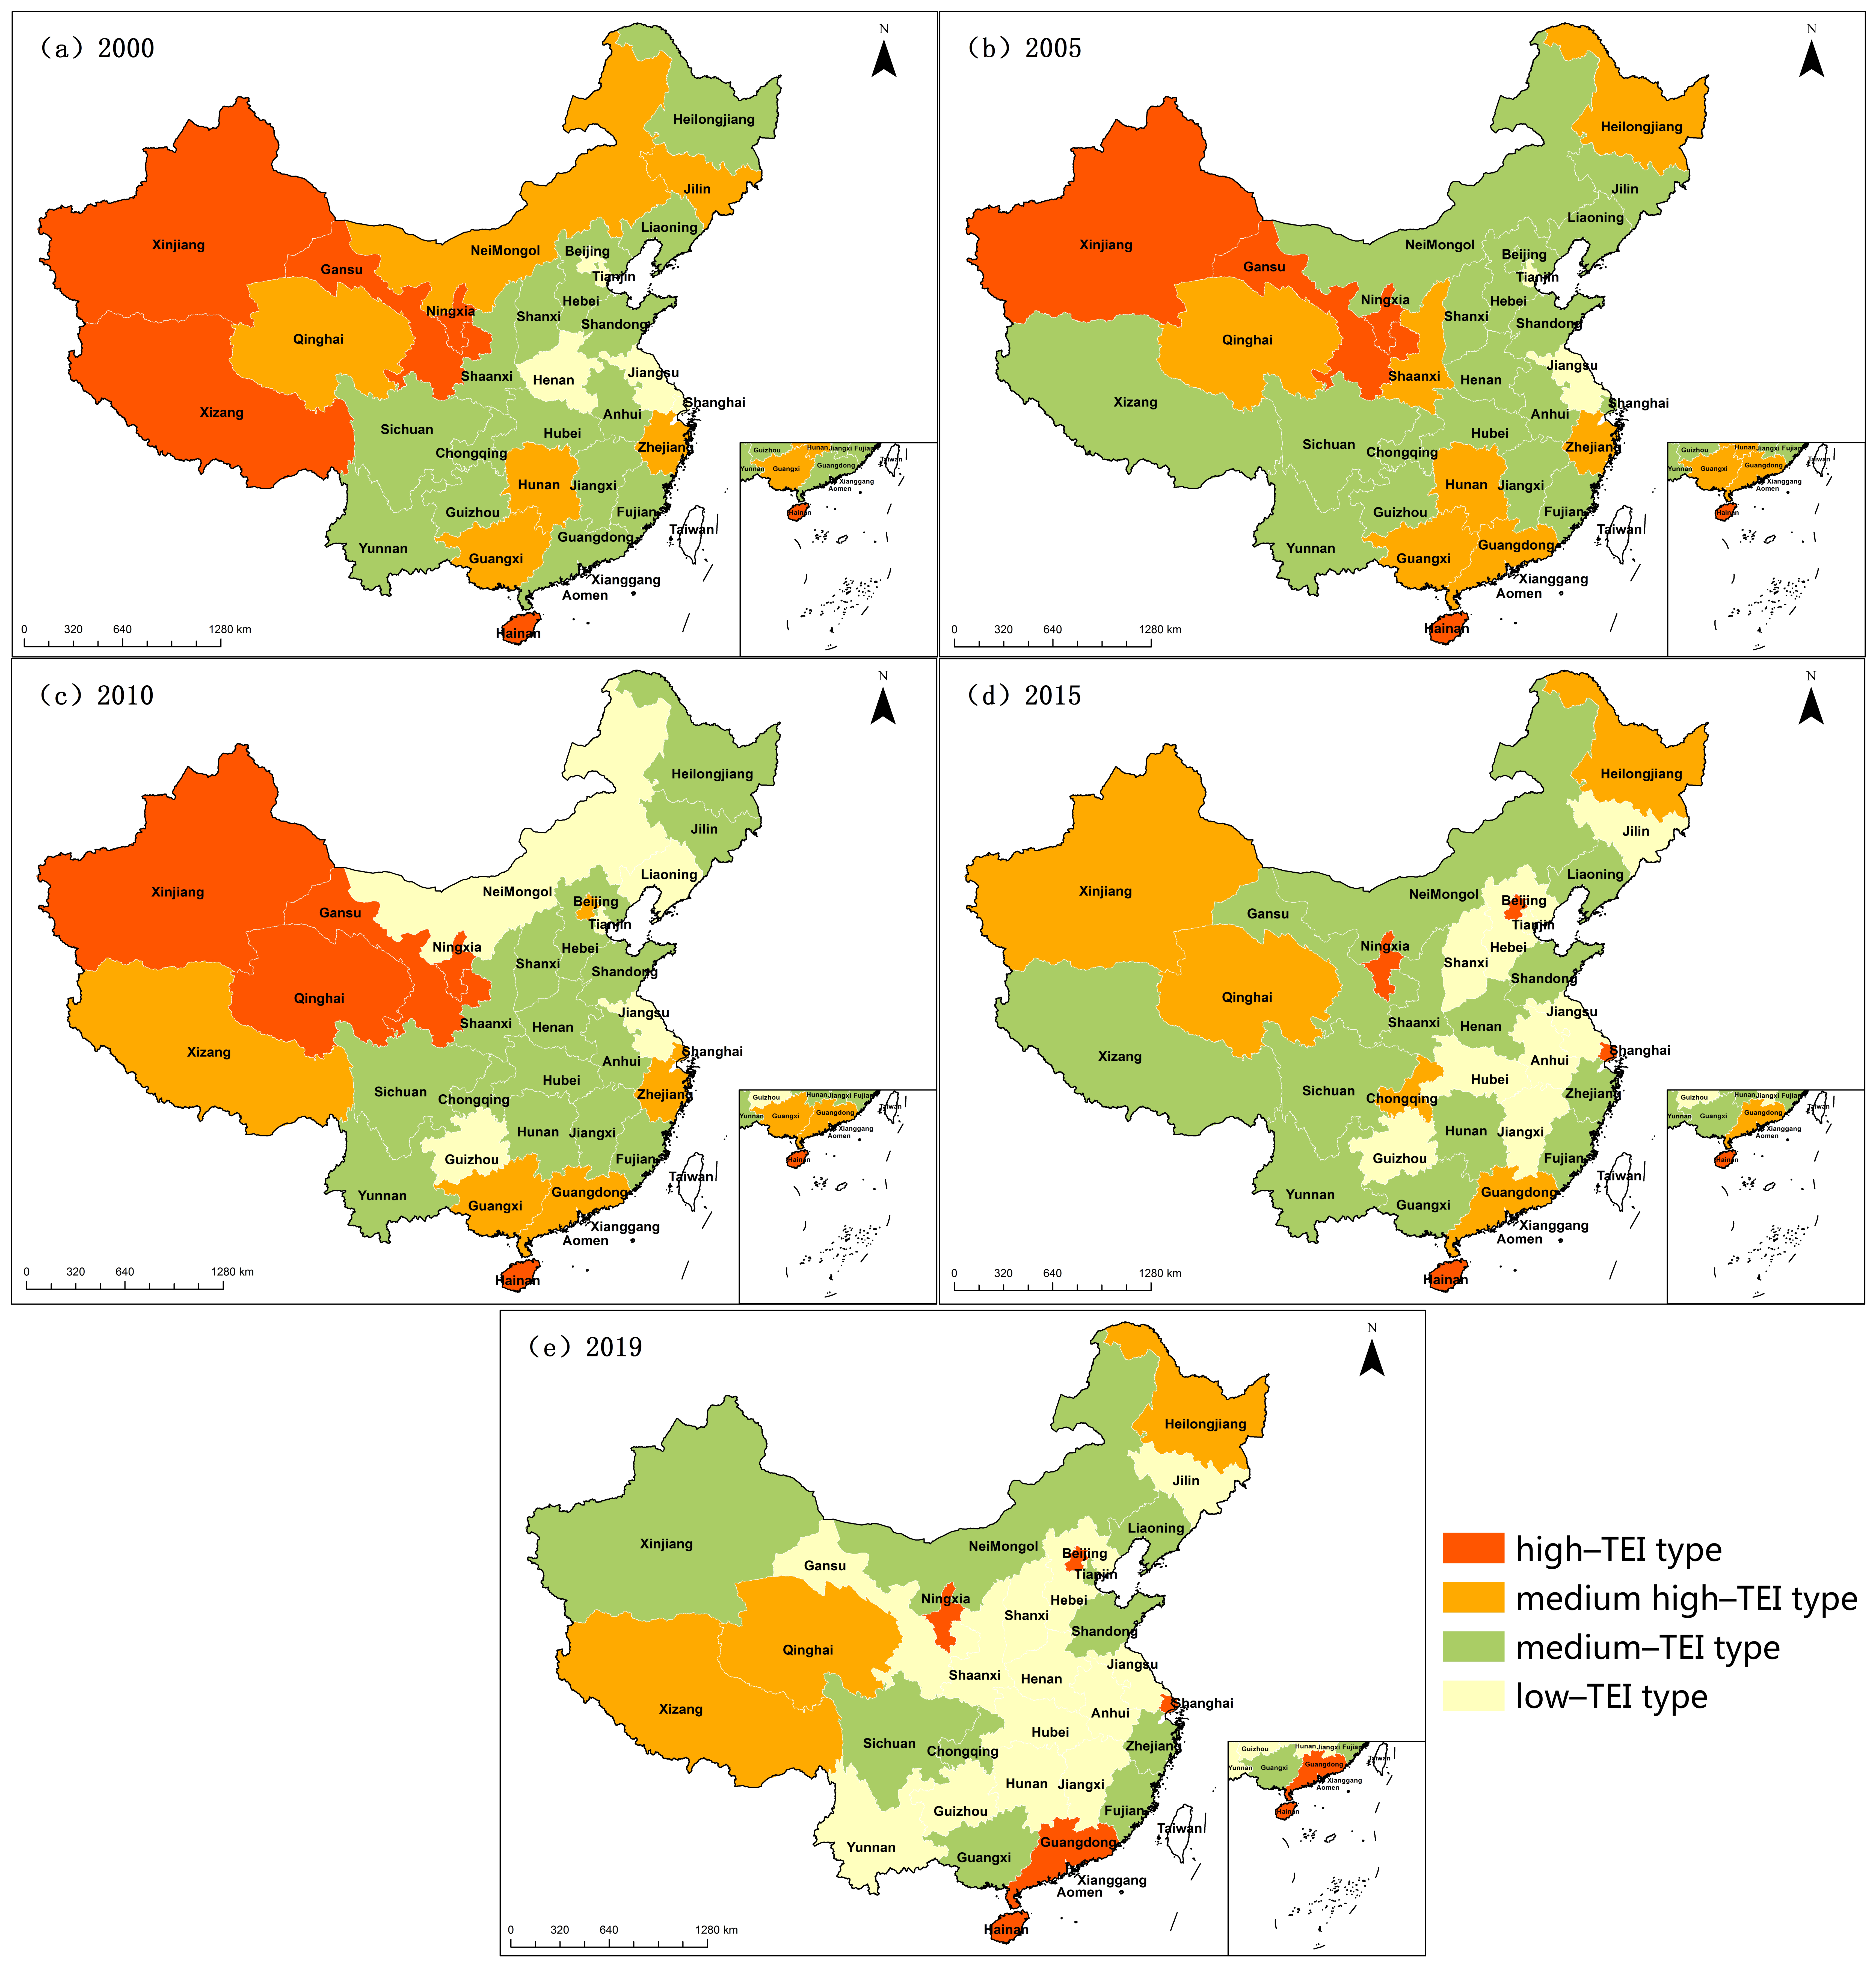
4.2.2. Evolutional Characteristics of TEI at the Provincial Scale

Based on the classification standard of Wang et al. [82], by comparing the TEI of every province with 0.5 times, 1 times, and 1.5 times, the national average value of TEI in that year, we divided 31 provinces into four categories, that is, low-TEI type, medium-TEI type, medium-high-TEI type, and high-TEI type, as shown in Figure 5, further clarifying the spatiotemporal pattern changes based on the relative value of TEI.
The results showed that the number of high-TEI provinces was relatively stable, and the representative years during 2000–2019 were 5→4→5→4→5. From spatial distribution, high-TEI provinces were always located in the eastern and western regions, and the spatial pattern shifted from western aggregation to eastern dispersion. The number of provinces with medium-high-TEI changed from relatively stable to a sharp decrease, the number of each representative year was 6→7→6→5→3, and the spatial distribution primarily declined from the scattered distribution characteristics of provinces in various regions to the distribution in the western and northeastern regions. The provinces with the medium TEI were the most widely distributed, with the number increasing first and then decreasing, and the number of each representative year was 15→18→15→13→10. The number of provinces with low TEI first declined and then increased sharply. In 2005, there were only two provinces, and the number increased to 13 in 2019; they were primarily concentrated in the central and western regions, with a few in the east.
For specific provinces throughout the entire study period, Jiangsu was the only province that always maintained a low-TEI type, and the TEI type in Hebei, Shanxi, Jilin, Zhejiang, Anhui, Jiangxi, Hubei, Hunan, Guangxi, Guizhou, Yunnan, Gansu, and Xinjiang changed from high to low. However, Ningxia in the west and Hainan in the east were always the high-TEI type, although the absolute value of TEI has been declining over the years. Furthermore, all the TEI types of Beijing, Shanghai, and Guangdong in the east changed from low to high. Hence, the changes in these five provinces reflect that the correlation among tourism development, economy, and environment has not been able to develop coordinately, which is worthy of reflection.

4.3. Spatial Differences of TEI

4.3.1. Overall Variance

According to Formulas (11)–(13), Table 2 presents the Theil index results of China’s TEI. The total Theil index of TEI first continued to decline from 0.1198 in 2000 to 0.0745 in 2004, and then it continued to increase from 2005 to 2019. The Theil index of TEI only exhibited a marginal decrease in 2012 during the period, suggesting that the overall difference in China’s TEI revealed a relatively apparent expansion trend. The inter-regional Theil index exhibited a fluctuating upward trend, and the intra-regional Theil index had more complex changes than inter-regional Theil index, but also showed an overall upward trend.
For the contribution rates, the intra-regional differences dominated the overall differences in China’s TEI, with an average contribution rate of 85.62% during 2000–2019. Nevertheless, the inter-regional contribution rate exhibited an overall upward trend, reflecting the dependence of the spatial difference in China’s TEI on the intra-regional difference, which is decreasing.

4.3.2. Intra-Regional Differences

As the intra-regional differences dominated the overall difference in China’s TEI, the Theil index of differences in four regions was further calculated, as shown in Table 3. The eastern region of China had a first-mover advantage in terms of tourism resource endowment, location space, and policy support, and the Theil index there was always higher than that of other regions. Besides, there have always been four TEI types, that is, low, medium, medium-high, and high in the east, and the Theil index itself has continued to rise, suggesting that although the eastern tourism has taken the lead, the development among provinces is increasingly heterogeneous.
The central region is located between the eastern coastal provinces and the western inland provinces, with relatively similar conditions such as geographical location and resource endowment. The overall social environment, energy use efficiency, and tourism development level are also relatively close, and the number of provinces is much less than that in the eastern and western regions. Except for individual years, such as 2000 and 2007, the Theil index in the central area exhibited a characteristic of first decreasing till 2012 and increasing afterwards with an increasing differentiation of tourism development in each province.
The overall change in the Theil index in the west was similar to that in the central regions, first decreasing and then increasing. The geographic latitude span in China’s western region was large, and the resource endowments were not the same; thus, the Theil index value was always more significant than the central region. Furthermore, the rapid increase in internal differentiation since 2016 could be associated with the tourism industry in Chongqing, Sichuan, Guizhou, Yunnan, and Shaanxi.
The Theil index exhibited a continuous upward trend in Northeast China, suggesting that the heterogeneity of the tourism development in the three provinces was increasing. For example, during the study period, Heilongjiang had the most significant increase in TE, reaching 4.7 times that of Jilin, while the increase in tourism revenue was only approximately 1/2 that of Jilin.

4.4. Spatial Autocorrelation of TEI

4.4.1. Global Spatial Autocorrelation Analysis

According to Formula (14), we adopted GeoDa software to evaluate Moran’s I index of China’s TEI during 2000–2019 and conducted a significance test. The results (Table 4) showed that the 2000–2013 years passed the 10% significance level test, suggesting that China’s TEI had a significant positive correlation between 2000 and 2013; that is, provinces with similar levels of TEI were clustered and distributed in geographic space. Further analysis of the specific values showed that the Moran’s I index decreased in stages during 2000–2013 (2000–2004, 2005–2009, and 2010–2013), suggesting that its spatial correlation decreased gradually.
During 2014–2019, Moran’s I index failed the significance test, suggesting no significant correlation between the TEI of various provinces, which also verified a growing trend in the four regions’ Theil index since 2014 (Table 3).

4.4.2. Local Spatial Autocorrelation Analysis

Based on Equation (15), we calculated the LISA index, which decreased in stages during 2000–2014 and then gradually increased. Combined with the global autocorrelation results, 2004, 2009, 2014, and 2019 were selected as representative years, and GeoDa software was applied to draw a cluster map of TEI. The results of the clusters were classified into five types, as shown in Figure 6.
In 2004, the number of high–high (H–H) clustering and low–low (L–L) clustering provinces were 4 and 21, respectively, accounting for 80% of the total, suggesting that the TEI of most provinces had local spatial clustering characteristics. In 2009, the number of H–H clustering provinces decreased to 2, and the number of L–L clustering was still 21; however, the spatial distribution of the provinces changed. Moreover, three high–low (H–L) clustering provinces were added, namely Beijing, Shanghai, and Guangdong; that is, there were areas with low TEI around these three provinces. In 2014, the LISA index was the smallest and the local spatial aggregation was the weakest, with only five provinces exhibiting local spatial aggregation. By 2019, the LISA index continued to increase, with 2 H–H clustering provinces, 14 L–L clustering provinces, and 1 H–L clustering province, suggesting that a turning point of the local spatial clustering characteristics of TEI had taken place from 2014.
Overall, before 2014, the TEI had the characteristics of global and local agglomeration in spatial distribution, primarily the H–H agglomeration in the western region and the L–L agglomeration in most provinces, but the correlation weakened gradually. Since 2014, TEI has not had a significant global correlation, but the local agglomeration has increased gradually, and it was characterized by diffusing L–L agglomeration from the eastern region to the central and west.

4.5. Spatiotemporal Effect of Driving Forces on TE Increment

Based on Formulas (16)–(24) and the TE in various provinces, the LMDI decomposition model was used to decompose the impact factors for TE increases in all provinces during the four sample periods of 2000–2004, 2005–2009, 2010–2014, 2015–2019, and the entire study period of 2000–2019, to obtain the contribution amount and contribution rate, respectively.
As shown in Table 5, compared with 2000, six factors in 2019 together led to an increase of 15,681.93 × 104 t in China’s TE. The industrial economy, industrial scale, and TE coefficient exerted a cumulative effect on TE. The industrial scale was the primary incremental effect factor contributing 24,372.58 × 104 t, and the industrial economy was the secondary incremental factor, contributing 5563.67 × 104 t. Nevertheless, the contribution of TE coefficient effect was minimal, only 167.81 × 10⁴ t, which was ignored in the following part. Energy structure, energy intensity, and spatial structure were all reduction factors, and the reductions caused by the three were −570.88 × 10⁴ t, −12,602.17 × 104 t, and −1249.08 × 104 t, of which energy intensity was the primary reduction factor.
As far as each region is concerned, the results showed that the situation in the eastern and northeastern regions was similar to that of the entire country, and the difference was that the spatial structure factors in the central and western regions produced cumulative effects.

4.5.1. Industrial Scale Effect

The ever-increasing number of tourists in China, further combined with the turnover of tourism transportation, the bed and occupancy rate of star-rated hotels, and the proportion of different tourism activities, determined the contribution and contribution rate of TE formed by the industrial-scale effect. Among all the influencing factors, the scale of the tourism industry was the dominant factor that promoted TE growth, both nationally and regionally (Table 5).
Taking the contribution rate as an indicator, Figure 7 presents the spatiotemporal effect of tourism industrial scale on the local TE change during the four sample periods between 2000 and 2019. Of note, the contribution rate of the industrial-scale effect in the six provinces of Beijing, Shanghai, Jiangsu, Zhejiang, Guangdong in the eastern region, and Xizang in the western region continued to increase in the first three sample periods and decrease in the last sample periods (Figure 7a–d). The main reason is that after the implementation of the “Eight Regulations” from the end of 2012, the number of beds and occupancy rates of tourist-star hotels in the most economically developed provinces of Beijing, Shanghai, Jiangsu, Zhejiang, and Guangdong gradually declined since 2013, leading to the mitigation of the cumulative carbon emissions of tourism accommodation and affected the increase in the total incremental TE. Nevertheless, the situation in Xizang was relatively remarkable. The accommodation of tourist-star hotels in Xizang is also influenced by the “Eight Regulations.” The number of beds in tourist star hotels in Xizang in 2019 decreased by 41.5%, compared with that in 2018, even fell by 16.6% from the base year, resulting in a decline in the number of star-rated hotel accommodations even when the bed occupancy rate increased, further decreasing the contribution rate of Xizang’s tourism industrial scale during 2015–2019.
Furthermore, Figure 7c,d show that the scale of the tourism industry in some provinces played a “reduction” role during the sample period, such as Jilin in northeast China (during 2010–2014), the Inner Mongolia Autonomous Region in the western region, and Anhui and Henan Province in the central region (during 2015–2019). Indeed, the tourism industrial scale in the four provinces has led to an increase in TE, but as the total increase in TE was negative, the contribution rate of the tourism industry scale was negative, creating a “decremental false appearance.” Moreover, the total increase in these four provinces was negative in a specific sample period, primarily because the considerable reduction effect of the energy intensity effect on TE exceeded the carbon emission promotion effect formed by the tourism industrial scale.

4.5.2. Industrial Economy Effect

The industrial economy effect denotes the increase in TE owing to the impact of tourism consumption per capita on tourism-related traffic, lodging, and activities, which is determined by tourism revenue and the number of tourists. The variation characteristics of tourism revenue in various provinces over the years are identical to the number of tourists, except for special events in a few years, exhibiting a trend of continuous increase. Taking the contribution ratio as the indicator, Figure 8 shows the spatiotemporal effects of the tourism economy of each province on local TE change within four sample periods; additionally, the overall promoting effect of economic development was weaker than the impact of the tourism industrial scale on the increase in TE.
Further analysis of the calculation parameters showed that if the ratio of tourism consumption per capita at the end of the sample period to the base period ( φ t / φ 0 ) was >1, the economic effect would definitely exert a promotion effect on TE. However, it is not that the larger the ratio, the stronger the economic effect will have on the promotion of TE. Taking Shanxi as an example, during 2005–2009, the ratio of tourism consumption per capita to the baseline at the end of the period was smaller than that of the previous sample period; however, TE due to economic effects increased instead. Likewise, during 2015–2019, the same situation happened in most provinces as in Shanxi during 2005–2009, demonstrating that the industrial economy exerts a positive impact on TE, but the extent to which how the industrial economy promotes TE must be combined with specific types of transportation, accommodation, and activities to be finally determined.
In addition, Jilin in 2010–2014, and Inner Mongolia, Anhui, and Henan in 2015–2019 had a negative economic effect contribution ratio because of the negative total increase in TE in these places, resulting in the “decremental false appearance” of the tourism economy on TE.

4.5.3. Energy Intensity Effect

The energy intensity effect is that the energy consumption per unit of tourism income acts on tourism sectors, respectively, which, in turn, affects the TE decrease. In the “Eleventh Five-Year” plan, the country started setting off a wave of strengthening emission reduction technology innovation and low-carbon management. The average growth rate of TC across the country declined from 11.96% during the “Tenth Five-Year” period to 7.54% during the “Twelfth Five-Year Plan” period but increased to 7.82% during the “Thirteenth Five-Year Plan” period. From a regional standpoint, the eastern region led implementation of energy conservation and emission reduction but experienced a rebound in growth rate of TC during the “Thirteenth Five-Year Plan” period. The central, western, and northeast region have witnessed a continuous decline in the growth rate of TC since the “Twelfth Five-Year Plan” period. Judging from the average growth rate of TC in each region, the east (10.77%) > the west (8.52%) > the middle (7.52%) > the northeast (6.75%). Regarding energy intensity, during 2000–2019, when the growth rate of TC gradually stalled and tourism revenue increased rapidly, the overall energy intensity of all provinces across the country continued to decline.
With the continuous enhancement of energy efficiency and technology, the corresponding reduction in energy intensity has become the primary factor for the TE reduction in the entire country and each region (Table 5). By analyzing the changes in the contribution rate of energy intensity effect in each province (Figure 9a–d) and the reasons behind it, when the tourism energy intensity ratio of a particular place in a sample period ( σ t / σ 0 ) was >1, the energy intensity effect promoted the increase in TE. When the ratio was <1, the energy intensity effect reduced the increase in TE. Additionally, the smaller the tourism energy intensity ratio was <1, the smaller the corresponding increase in TE, and the more significant the contribution of energy intensity to decreasing TE. Thus, according to the specific value of the contribution rate of energy intensity effect in each province, the energy intensity in the eastern region had the worst effect on the TE reduction; in particular, Beijing and Shanghai in the east did not play a role in reducing emissions and promoted TE instead, with contribution rates of 7.55% and 25.66%, respectively, during the entire study period.
Notably, Jilin during 2010–2014 and Inner Mongolia, Anhui, and Henan during 2015–2019 were unique (Figure 9c,d); it was not because the energy intensity ratio was >1, but because the total TE increase was negative during the sample period, thereby leading to the “incremental false appearance.”

4.5.4. Spatial Structure Effect

The spatial structure effect denotes the impact of the proportion of regional tourism revenue in the total tourism revenue on tourism transportation, accommodation, and activities, respectively, thereby leading to the increase in TE. In 2000, the eastern region of China was the leading tourist destination, accounting for 64.87% of income, followed by the central, western, and northeastern regions, accounting for 14.76%, 14.75%, and 5.62%, respectively. In the eastern part of China, mass tourism was dominated by Beijing, Shanghai, and Guangdong, and the tourism revenue of the three places accounted for 37.24% in total. The rapid growth of the tourism industry since the beginning of the twenty-first century across the country, especially the profound changes in both tourism supply and demand, has caused a massive change in the spatial structure of China’s tourism. In 2009, the sum of the revenue ratio of the central, western, and northeastern regions reached nearly 50%; in particular, the northeast reached a maximum of 10.01%. Then, by 2019, the proportion of tourism revenue in the east and northeast continued to decline to 38.63% and 8.74%, while that in the central and western regions continued to increase to 23.53% and 31.62%, reflecting the gradual transformation of China’s tourism spatial structure from the point-line development structure dominated by the eastern developed areas to the inland scattered planar development structure.
From a national viewpoint, the spatial structure of tourism was the reduction factor for TE (Table 5). Nevertheless, judging from the spatial and temporal contribution of the spatial structure shown in Figure 10a–d to the TE increase in various provinces, the situation is complicated. The analysis revealed that in any sample period, when the ratio of tourism spatial structure ( τ t / τ 0 ) was >1, its spatial structure had a cumulative effect on TE increase. When the ratio was <1, the spatial structure had a reduction effect on TE increase. Hence, along with the ratio change of tourism revenue in different provinces and regions, the spatial structure exhibited a changing effect on TE increase, as shown in Figure 10a–d. In the four sample periods, the spatial tourism structure in the eastern region exhibited a continuous reduction effect (−16.94% → −43.70% → −63.42% → −65.01%), the central and western regions displayed a cumulative effect (22.58% → 42.03% → 68.14% → 26.57%, and 31.82% → 14.21% → 40.41% → 75.33%, respectively), and the effect of the northeast region was to increase first and then decrease (101.19% → 81.01% → −104.31% → −56.70%), showing a small overall reduction effect.

4.5.5. Energy Structure Effect

The energy structure effect signifies the influences of the proportion of the TC of the tourism sectors, respectively, in the total TC on tourism transportation, accommodation, and activities, respectively, thereby leading to the increase in TE. Tourism transportation has been established to be the vital tourism sector promoting TE [83,84], which aligns with our results. The national tourism transportation energy consumption accounted for 88.97% of the total energy consumption in the research period. The average proportion of TC from tourism transportation in the province’s total TC was >78%, the lowest was 78.02% in Yunnan, and the highest was 93.85% in Shanghai.
Table 5 shows that the energy structure decreases the national and regional TE increase during the entire study period. As shown in Figure 11a–d, the reduction effect of the energy structure of most provinces experienced a transition from a cumulative effect to a reduction effect. In a certain sample period, the proportion of some tourism subsector energy consumption ( ρ x t / ρ x 0 ) was >1; this tourism subsector energy consumption had a promoting effect on the TE increase. Then, the total size of TE generated by the tourism energy structure was determined by the sum of the total TE from the three tourism subsectors.
For example, during 2010–2014 (Figure 11c), the energy structure of Hebei, Jiangxi, and Yunnan exerted a positive impact because tourism activities and accommodation promoted the increase in TE more than the reduction in tourism transportation. During 2015–2019 (Figure 11d), Hubei was the only province with a small positive effect on tourism energy structure primarily because of the weakening of the reduction effect of tourism transportation. Hence, as the absolute amount of TE from tourism transportation was much more significant than that of tourism accommodation and activities, the smaller the ratio of tourism transportation energy consumption in the sample period was <1, the more significant the reduction effect of tourism energy structure was.
Furthermore, attention should also be paid to Jilin in Figure 11c and Anhui and Inner Mongolia in Figure 11d, as the phenomenon of “incremental falsehood” covering up the real decremental effect of tourism energy structure in these provinces.

5. Discussion

A series of emission reduction target setting policies, industrial policies, and energy policies have been implemented in China for addressing climate changes and promoting the low-carbon development in the last decade. In 2011 and 2016, the State Council initiated the implementation plan for controlling greenhouse gas emissions during the 12th Five Year Plan and the 13th Five Year Plan, respectively. In 2014, the national plan for addressing climate change (2014–2020) was issued, which has established a relatively complete target orientation, policy, and action system for national low-carbon development. In 2016, the Ministry of Industry and Information Technology issued the industrial green development plan (2016–2020), which requires that, by 2020, the promotion mechanism of industrial green development should be basically formed. In 2018, China’s national development and Reform Commission and the National Energy Administration issued the clean energy consumption action plan (2018–2020). In 2019, China began to implement the green building evaluation standard. Since the outbreak of the global COVID-19 in early 2020, China has adopted strict social control to cope with the spread of the epidemic, and the industrial economy has also been seriously affected. However, the epidemic has not affected the process of the Chinese government to promote low-carbon development. In 2020, General Secretary Xi put forward China’s “double carbon” goal at the UN General Assembly. In 2021, the State Council issued the comprehensive work plan for energy conservation and emission reduction in the 14th Five-Year Plan period. The national carbon emission trading market was officially launched in the same year. In June 2022, the Ministry of ecology and environment and other departments issued the national climate change adaptation strategy 2035, proposing that by 2035, the climate adaptive society will be basically completed.
Looking at the Climate Governance Practices in the past decade, China’s climate policy development has entered a sustained and powerful policy promotion stage, not even been impacted by the widespread of COVID-19. However, for the tourism industry, there are few specific policies to guide the low-carbon development. At the same time, there are also some problems in the policy synergy between the central government and local governments, as well as between provincial governments [85]. Therefore, an in-depth understanding of the spatiotemporal correlations and differences among tourism, CO2 emissions, and economy at the provincial, regional, and national scales is of great significance for proposing emission-reduction policies for tourism, eliminating administrative barriers to promote regional low-carbon coordinated development and effectively supporting the “double carbon” goal.
In this study, a bottom-up approach was used for the measurement of total amount of TE, which can calculate the direct CO2 emissions from tourism transportation, accommodation, and activities. From the national scale, during 2000–2019, China’s TE exhibited a rapid growth trend, from 3714.06 × 104 t to 19,396.00 × 104 t, with the annual growth rate of 9.32%, these data were close enough to the national TE and rising rate (see Tang et al. [86]), but considerably lower than the TE estimation based on tourism consumption stripping coefficient (see Pan and Liang [24]). In the three main tourism sectors, CO2 emissions from tourism transport dominated the total TE, which accounted for an average ratio of 81.13% in the total TE and corroborated by the findings of Tang et al. [15]. Based on changes of TE and tourism revenue, the TEI dynamics was obtained, which showed a rapid downward trend, from 47 to 9 g/RMB. The development trend of TEI in China was completely consistent with the findings by Wang et al. [31], but the specific value of TEI was slightly higher than their study.
Since 2020, the COVID-19 has spread all over the world. It is not difficult to understand its severe impact on the tourism industry, and some scholars believe that the spread of the epidemic has changed travel behavior [87,88]. For China, there is still great uncertainty about the impact of the COVID-19 on China’s inbound tourism in the subsequent stages. However, due to the strong resilience of the tourism industry, the fundamentals of China’s sustainable tourism economy have not changed, and the potential domestic tourism demand is still very strong [89]. It is foreseeable that China’s tourism industry will continue its pre-epidemic development trend in the post-epidemic era, and the corresponding energy consumption and carbon emissions will continue to grow. Therefore, China’s carbon emission reduction policy will not cease given the influence from the epidemic.
For tourism, tourism management departments should take essential countermeasures to manage the increasing TE under the framework of national carbon emission reduction policy. First, regarding the top-level design, the tourism management department should, along with the ecological environment department, revise various plannings and standard systems promptly, fully implement the concept of green development, and incorporate indicators, such as carbon emissions, carbon intensity, and clean energy use into the management and assessment of tourism subsectors, departments, and enterprises, and form targeted and actionable policy tools. Second, the TE statistics should be accelerated. In response to the increasing TE, Sweden and New Zealand have established a complete official TE statistics system. Australia, Spain, and other countries have TE statistics from an academic perspective [90]. Moreover, TE has been calculated in some provinces and entire China by Chinese scholars [5,6,14,15,32]. However, owing to the blurred boundary of TE, the Chinese government has not established a TE statistical system, and establishing a unified tourism satellite account is still in progress. Accordingly, the government can establish a research expert group on TE through policy and financial support, establish and unify the TE measurement method suitable for China, and regularly publish the results and forecasts of TE to decide for the government with a reliable data foundation.
Reportedly, the total amount of carbon emissions in a country or region depends on the total amount of the economy and carbon emission intensity [91]. For a country like China, which has both immediate economic development needs and vast emission sources, the vital task at present is to realize a continuous reduction in carbon emission intensity [63,86]. Although TEI has been established to decline markedly in this study, China’s tourism consumption demand is still strong, which requires comprehensive reform of the low-carbon product supply system in terms of tourism supply. Then, the top-level design must augment the comprehensive application of low-carbon technologies in supply-side tourism reform when framing tourism product policies or plans. Moreover, it is also possible to create low-carbon tourism products by creating a more operable certification system.
From the standpoint of regional and provincial scales, during 2000–2019, the increase in TE was in the same order as the growth rate, that is, the eastern, western, central, and northeastern regions. Among the regions, Guangdong, Beijing, and Shanghai in the east had the most significant increase in TE, which were 2261.88 × 104 t, 1946.39 × 104 t, and 1655.11 × 104 t, respectively. The TE amount of Beijing and Shanghai are highly consistent with the existing provincial TE results (see Han and Wu [92], Sun [93]). The decreasing rate and average annual decline rate of TEI are in the order of the central, western, northeastern, and eastern region. The spatial pattern of provinces with high TEI differ from agglomerative distribution in the north by western region to a scattered distribution in the eastern region. The provinces with low TEI have shifted from a scattered distribution in the eastern and central regions to an agglomerative distribution in the central and western regions, which can broaden our vision of the spatial change of provincial TEI in China [62]. During the entire study period, Ningxia in the west and Hainan in the east always belonged to the type of high TEI, and the type of TEI in Beijing, Shanghai, and Guangdong in the east changed from low to high. However, a conflict exists among tourism, the economy, and environment in these five provinces. Of these, this correlation warrants urgent improvement.
Based on the statistics mentioned above, as the eastern region with the strongest economic strength and the highest amount of TE in China, it has not only huge space for carbon emission reduction but also the largest responsibility and capacity for carbon emission reduction. Thus, it is recommended that the eastern region give full play to its comparative advantages in capital and technology, enhance policy and financial support for low-carbon technology R&D, and boost the design of low-carbon tourism products. The products or facilities provided by the industry should implement the access system, and products or facilities with low-carbon and ecological characteristics should be preferentially selected to hasten the transformation and upgrading of the pan-tourism industry.
Within the eastern region, especially Beijing, Shanghai, and Guangdong, immediate action must be taken to decrease TEI comprehensively, solidly, and operably in practice. First, it is essential to formulate low-carbon tourism policies and plans that fulfill the actual local conditions in advance. Hotels, scenic spots, resorts, and other tourist destinations and service places should be encouraged to actively use low-carbon technologies, measure and monitor TE, subsidize low-carbon construction and operating expenses, conduct low-carbon brand certification, and reward low-carbon brands. Second, low-carbon tourism routes and research products should be developed. The government offers subsidies and motivates travel agencies to develop, design, and popularize notable low-carbon tourism routes and products so that tourists can fully understand and enjoy low-carbon tourism experience.
The development of Hainan province in the eastern region is relatively unique. It has a low tourism income (ranked 29th in 2019) and the highest TEI (ranked 1 in 2019). Hainan has always had good policy supports, such as the construction strategy of the National Tourism Island and international tourism consumption center. Nevertheless, significant differences exist in tourism consumption between low and high seasons, the low share of inbound tourism reception has always existed, and tourism activities are agglomerated around Sanya, all of which need Hainan to break through the bottlenecks and vigorously promote the economic enhancement of tourism [94].
For the central, western, and northeastern regions, the growth rate of TE is lower than the decline in TEI. The pressure of emission reduction is usually smaller than that in the east, except for Ningxia in the west. Ningxia province has the lowest tourism income (ranked the 31st in 2019) and high TEI (ranked 4th in 2019). As Ningxia is in the northwest inland with a dry climate and the infrastructure construction is relatively under-developed, it is recommended that Ningxia continue to expand ecological protection and afforestation to enhance the carbon sequestration function of the local ecosystem [95]. Meanwhile, various types of public transport facilities should be increased and improved.
After the acquisition of the spatiotemporal changes of TE and TEI, we used Theil index and ESDA method to further study the spatial difference and correlation of TEI. During 2000–2019, the overall difference in China’s TEI exhibited a relatively apparent expansion trend, and the intra-regional difference always dominated the overall difference. During 2000–2013, China’s TEI also exhibited a significant global and local positive correlation, primarily showing the characteristics of H–H agglomeration in the western region and L–L agglomeration in most provinces, but the correlation gradually weakened. Since 2014, the TEI only has a local positive correlation, spreading with L–L agglomeration from the eastern region to the central and western regions. Meanwhile, TEI has not had a positive global correlation, which could be precisely led by the continuous expansion of all the internal differences in each region.
The abovementioned content has demonstrated the continuously increasing heterogeneity in the spatial distribution of China’s TEI. Since 2014, it has only agglomerated in certain places. Thus, we should strive to overcome administrative divisions’ barriers and play the leading role in low emission provinces. In the outline of “the National Fourteenth Five-Year Plan”, 19 urban agglomerations are established, which are gradually gathered per the natural development trajectory of the industries. Then, these urban agglomerations can start from the planning level and promote the complementarity of advantages between provinces and municipalities within the region to make low-carbon technologies, environment, and services and exert a significant spillover effect, thereby promoting the clustering development of low-carbon tourism industries.
Taking Jiangsu Province in the eastern region as an example, it is not only the only province that has always upheld a low-TEI type but also has always formed L–L aggregation with surrounding provinces. Jiangsu has a developed economy and a mature tourism industry, displaying the characteristics of intensive and low-carbon tourism development. For example, Zhenjiang city in Jiangsu assessed low-carbon scenic spots early and selected low-carbon tourist areas; Wuxi Taihu Yuantouzhu Scenic Area, Changzhou Chunqiu Yancheng Scenic Area, and many other scenic spots in Jiangsu were also rated as national low-carbon tourism demonstration areas. Moreover, the Yangtze River Delta urban agglomeration, where Jiangsu is located, can fully promote regional carbon emission reduction coordination and cooperation from the planning level. In 2021, “the ‘14th Five-Year’ Implementation Plan for the Integrated Development Plan of the Yangtze River Delta” (hereinafter the “Plan”) stipulated that “promoting qualified industries to take the lead in realizing the ‘carbon peak’” and “accelerating the construction of Shanghai’s national carbon emissions trading institution and explore the formation of a regionally integrated carbon trading market” and so on. Thus, all provinces (cities) should actively connect their regional tourism development planning with the “Plan.” Meanwhile, the surrounding provinces should also reinforce the exchange and cooperation of tourism economy, technology, and management experience with Jiangsu, enhance the competition–cooperation mechanism in the tourism industry, and maximize the spatial spillover effect of low-carbon tourism development.
From the spatial and temporal aspect, to further understand how tourism impacts TE, the LMDI method was applied to decompose TE to get the specific role of each factor. The scale of the tourism industry and industrial economy exert significant promoting effects on TE increase, and energy intensity and energy structure exert the crucial decremental effect, which coincided with other relevant studies [6,11,32]. Furthermore, it should be noted that the spatial structure decreased TE across the country but had different effects in the four regions, demonstrating that spatial scales will affect the role of tourism spatial structure in TE increase.
With the rapid growth of China’s economy and the progress of time, the people’s yearning for a better life has become increasingly stronger. As the first of the five happiness industries, tourism’s industrial scale and the industrial economy will continue to progress. Thus, it is not realistic to control TE from an economic standpoint. Regarding the tourism spatial structure, it has different effects in different regions due to the uneven spatial distribution of the tourism development. Top-level design and governments at all levels should strengthen policy support, fully tap local characteristics, develop tourism resources, promote the structural reform of the tourism supply side, and create a relatively balanced spatial distribution pattern of the tourism industry across the entire country. Hence, high priority should be given to energy intensity and energy structure for emission reduction owing to their consistency of effects at different spatial scales.
This study demonstrates that the more energy intensity decreases, the more significant the contribution to decreasing TE. Decreasing energy intensity can be attained by enhancing the efficiency of traditional energy utilization and developing clean energy methods. Of course, all these require the essential support of technological progress. China has long used coal as its primary energy source, and its energy intensity is 1.3 times the world average and has even become the world’s largest coal importer, requiring us to actively fortify international cooperation, learn from foreign advanced technology, update technical equipment, and optimize coal mining methods to promote Chinese enterprises to extend the coal industry chain and increase the comprehensive utilization rate of coal. Additionally, it should actively develop clean energy, such as solar energy and wind energy, to bolster the rapid expansion of photovoltaic and wind power industry technology. Undeniably, factors such as cost and technology might cause resistance to energy iteration. If so, the cost of using traditional energy can be increased by paying carbon taxes, thereby forcing companies to execute the green transformation of technology or energy.
Regarding the energy structure, as the energy consumption of tourism transportation is much greater than that of tourism accommodation and tourism activities, if the energy consumption of tourism transportation can be decreased, the reduction effect of the energy structure on TE would be highlighted significantly. Tourism transportation primarily includes four types, aviation, highway, railway, and water transportation, among which aviation and highway are the most crucial carbon sources. For long-distance travel, aviation remains the primary mode of transportation. Nevertheless, with the development of China’s high-speed railway network and technological progress, the widespread use of new energy vehicles and the construction of large-scale, high-quality roads can effectively divert some of the aviation passenger flow to fulfill the needs of tourists for convenience and fast passenger transportation. Moreover, the transportation network structure should be optimized within tourist destinations to facilitate the use of public transportation for tourists to travel. Regarding public and scenic transportation, the use of new energy vehicles is mandatory to promote the low-carbon transformation of tourism transportation. Although the proportion of tourism accommodation and activities in tourism energy consumption is relatively low, ample space remains for energy conservation and emission reduction. Additionally, we lack relevant standards and plans for low-carbon hotels and low-carbon scenic spots. We can articulate relevant mandatory standards and promote their implementation around carbon emission reduction goals. Furthermore, tourists constitute the main body of tourism activities, whose behavior should also fulfill the requirements of low-carbon tourism. Through diversified and continuous institutional guidance, ever more tourists will form the concept and habits of low-carbon tourism.
There are limitations to this study. First, compared with other calculation methods of TE, many model parameters of tourism transportation, accommodation and activities needed to be estimated when applying the bottom-up approach. The parameters settled in this paper were based on many studies at home and abroad. However, the differences of tourism transportation, accommodation, and activities among various provinces of China were not taken into account in the parameters, which may lead to the simplification of the model and widen the gap between the results and the real situation. Second, the statistical yearbooks of various provinces in China do not include all the data that may be needed for the study, such as the proportion of different types of tourism activities. This may lead us to underestimate the differences in carbon emissions from tourism activities among various provinces. In future research, on the one hand, the model parameters can be further modified to make the results more accurate; on the other hand, more methods could be applied to calculate Chinese TE from different spatial scales, and then the rationality of the methods can be better justified by comparing the research results. Nevertheless, there may be many deficiencies in the calculation method and parameters in this paper; it is still of great significance to understand the complex correlation among Chinese tourism, CO2 emissions, and economic growth arising from spatiotemporal changes.

6. Conclusions

This study comprehensively used the bottom-up approach, Theil index, ESDA, and LMDI methods from the management, physics, spatial econometrics, and energy economics to evaluate TE and TEI at different spatial scales, that is, 31 provinces, four regions, and the whole country, during 2000–2019. Based on the evolution dynamics of TE and TEI, we further examined the spatial heterogeneity of TEI and investigated the spatiotemporal effects of tourism industry scale, industrial economy, energy intensity, spatial structure, and energy structure on TE change. We found that, from 2000 to 2019, China’s TE increased from 3714.06×104 t to 19,396.00×104 t, the TEI declined from 47 to 9 g/RMB, and the high-TEI provinces varied from agglomerative distribution in the north by western region to scattered distribution in the eastern region. China’s TEI exhibited increasing spatial differences, primarily within regions during 2000–2009, which also distributed with both the global and local agglomeration in space before 2014, and since then, only the local agglomeration enhanced and characterized by diffusing L–L agglomeration from the east to the central and west regions. In China, the tourism industrial scale and the industrial economy exerted cumulative effects on TE increment, and the energy intensity and energy structure exerted reduction effects. The spatial structure played different roles on TE among the regions. All these led to policy suggestions for tourism industry responding to “double carbon” goals in China.

Author Contributions

L.C. and L.Y. conceived and designed the research; L.C., L.Y. and H.Y. collected data and analyzed the data; L.C. and R.C. contributed to progress of research idea and wrote the paper. All authors have read and agreed to the published version of the manuscript.

Funding

This work was supported by the Humanities and Social Sciences Research Project of the Ministry of Education (Grant Number 18YJCZH012), Young and Middle-aged Academic Leaders of “Blue Project” in Jiangsu Universities (2022–2025), Academic Top Talent Training Project of Jinling Institute of Technology(2020–2023), National Natural Science Foundation of China (Grant Number 41971335 and 51978144), the Science and Technology Innovation Project of Jiangsu Provincial Department of Natural Resources (Grant Number 2022004), and the Special Project of Carbon Neutralization Institute of China Coal Geology Administration (Grant Number ZMKJ-2021-ZX02).

Institutional Review Board Statement

Not applicable.

Informed Consent Statement

Not applicable.

Data Availability Statement

Not applicable.

Acknowledgments

The valuable comments from the anonymous reviewers were much appreciated and enhanced the overall paper.

Conflicts of Interest

The authors declare no conflict of interest.

References

  1. UNWTO-UNEP-WMO. Climate Change and Tourism: Responding to Global Challenge; The World Tourism Organization and The United Nations Environment Programme: Madrid, Spain, 2008. [Google Scholar]
  2. Xu, B.; Lin, B. How industrialization and urbanization process impacts on CO2 emissions in China: Evidence from nonparametric additive regression models. Energy Econ. 2015, 48, 188–202. [Google Scholar] [CrossRef]
  3. IEA. Data and Statistics. Available online: https://www.iea.org/data-and-statistics/data-browser?country=CHINAREG&fuel=CO2%20emissions&indicator=CO2BySource (accessed on 16 August 2021).
  4. The Petroleum Corporation of BP. Statistical Review of World Energy, 70th ed.; 2021; Available online: https://www.bp.com/content/dam/bp/business-sites/en/global/corporate/pdfs/energy-economics/statistical-review/bp-stats-review-2021-full-report.pdf (accessed on 17 August 2021).
  5. Liu, J.; Feng, T.T.; Yang, X. The energy requirements and carbon dioxide emissions of tourism industry of western China: A case Chengdu city. Renew. Sust. Energ. Rev. 2011, 15, 2887–2894. [Google Scholar] [CrossRef]
  6. Chen, L.L.; Thapa, B.; Yan, W. The relationship between tourism, carbon dioxide emissions, and economic growth in the Yangtze River, China. Sustainability 2018, 10, 2118. [Google Scholar] [CrossRef] [Green Version]
  7. Jones, C.; Munday, M. Exploring the environmental consequences of tourism: A satellite account approach. J. Travel. Res. 2007, 46, 164–172. [Google Scholar] [CrossRef]
  8. Kuo, N.W.; Chen, P.H. Quantifying energy use, carbon dioxide emission, and other environmental loads from island tourism based on a life cycle assessment approach. J. Clean. Prod. 2009, 17, 1324–1330. [Google Scholar] [CrossRef]
  9. Tao, Y.G.; Huang, Z.F.; Shi, C.Y. Carbon dioxide emissions from regional tourism transport: A substitutional bottom-up analysis. Acta Ecol. Sinica 2015, 35, 4224–4233. [Google Scholar] [CrossRef] [Green Version]
  10. Yorucu, V. Growth impact of CO2 emissions caused by tourist arrivals in Turkey: An econometric approach. Int. J. Clim. Chang. Str. 2016, 8, 19–37. [Google Scholar] [CrossRef]
  11. Ma, H.Q.; Liu, J.L.; Xi, J.C. Decoupling and decomposition analysis of carbon emissions in Beijing’s tourism traffic. Environ. Dev. Sustain. 2022, 24, 5258–5274. [Google Scholar] [CrossRef]
  12. Achour, H.; Belloumi, M. Decomposing the influencing factors of energy consumption in Tunisian transportation sector using the LMDI method. Transp. Policy 2016, 52, 64–71. [Google Scholar] [CrossRef]
  13. Chen, J.; Zhao, A.; Zhao, Q.; Song, M.; Baležentis, T.; Streimikiene, D. Estimation and factor decomposition of carbon emissions in China’s tourism sector. Probl. Ekorozw. 2018, 13, 91–101. [Google Scholar]
  14. Sun, Y.Y. Decomposition of tourism greenhouse gas emissions: Revealing the dynamics between tourism economic growth, technological efficiency, and carbon emissions. Tour. Manag. 2016, 55, 326–336. [Google Scholar] [CrossRef]
  15. Tang, Z.; Jie, S.; Shi, C.; Liu, Z.; Bi, K. Decoupling indicators of CO2 emissions from the tourism industry in China: 1990–2012. Ecol. Indic. 2014, 46, 390–397. [Google Scholar] [CrossRef]
  16. Qiang, W.; Rongrong, L.; Rui, J. Decoupling and decomposition analysis of carbon emissions from industry: A case study of China. Sustainability 2016, 8, 1059–1076. [Google Scholar] [CrossRef] [Green Version]
  17. Zi, T.; Bai, S.; Shi, C.; Liu, L.; Li, X. Tourism-related CO2 emission and its decoupling effects in China: A spatiotemporal perspective. Adv. Meteorol. 2018, 2018, 1473184. [Google Scholar] [CrossRef] [Green Version]
  18. Gössling, S.; Peeters, P.; Ceron, J.P.; Dubois, G.; Patterson, T.; Richardson, R.B. The eco-efficiency of tourism. Ecol. Econ. 2005, 54, 417–434. [Google Scholar] [CrossRef]
  19. Sun, H.X.; Su, N.N. Analysis on spatio-temporal difference of tourism carbon emissions in northwest China. Hubei Agr. Sci. 2021, 2, 35–43. [Google Scholar] [CrossRef]
  20. Gössling, S.; Scott, D.; Hall, C.M. Challenges of tourism in a low-carbon economy. Clim. Chang. 2013, 4, 525–538. [Google Scholar] [CrossRef]
  21. Zaman, K.; Moemen, M.A.; Islam, T. Dynamic linkages between tourism transportation expenditures, carbon dioxide emission, energy consumption and growth factors: Evidence from the transition economics. Curr. Issues Tour. 2017, 20, 1720–1735. [Google Scholar] [CrossRef]
  22. Paramati, S.R.; Alam, M.S.; Lau, C.K.M. The effect of tourism investment on tourism development of CO2 emissions: Empirical evidence from the EU nations. J. Sustain. Tour. 2018, 26, 1587–1607. [Google Scholar] [CrossRef]
  23. The Fourteenth Five-Year Plan for National Economic and Social Development of the People’s Republic of China and the Outline of Long-Term Objectives for 2035. Available online: http://www.gov.cn/xinwen/2021-03/13/content_5592681.htm (accessed on 13 March 2021).
  24. Pan, Z.Q.; Liang, B.E. Research on space-time heterogeneity of tourism industry carbon emission intensity distribution and influencing factors: Analysis of panel data from 30 provinces (cities and districts) from 2005–2014. Human Geogr. 2016, 6, 152–158. [Google Scholar] [CrossRef]
  25. Zha, J.P.; Shu, H.Y.; He, L.M. A research on tourism industrial carbon emissions and its influential factors in China: Evidences from Chinese Provincial Panel Data (2005–2015). Tour. Sci. 2017, 31, 1–16. [Google Scholar] [CrossRef]
  26. Wang, J.B.; An, B.C.; Ma, G.C.; Lv, X.Q. Research on carbon emission intensity calculation and influencing factors of Provincial Tourism. Stats. Decision. 2019, 18, 99–102. [Google Scholar] [CrossRef]
  27. Chen, J.; Gao, M.; Cheng, S.; Hou, W.X.; Song, M.L.; Liu, X.; Liu, Y.; Shan, Y.L. County-level CO2 emissions and sequestration in China during 1997–2017. Sci. Data 2020, 7, 391–402. [Google Scholar] [CrossRef] [PubMed]
  28. Yang, Y.; Liu, Y. Study on China’s energy efficiency and its spatio-temporal variation from 1990 to 2010 based on DEA-ESDA. J. Nat. Res. 2014, 29, 1815–1825. [Google Scholar] [CrossRef]
  29. Liu, Y.; Yang, Z.; Wu, W. Assessing the impact of population, income and technology on energy consumption and industrial pollutant emissions in China. Appl. Energy 2015, 155, 904–917. [Google Scholar] [CrossRef]
  30. Yang, Z.; Liu, Y.S. Does population have a larger impact on carbon dioxide emissions than income? Evidence from a cross regional panel analysis in China. Appl. Energy 2016, 180, 800–809. [Google Scholar] [CrossRef]
  31. Wang, K.; Xiao, Y.; Li, Z.M.; Liu, H.L. Spatial analysis for regional difference of tourism carbon emissions in China. China Pop. Res. Environ. 2016, 26, 83–90. [Google Scholar] [CrossRef]
  32. Zhang, W.; Li, K.; Zhou, D.Q.; Zhang, W.R.; Gao, H. Decomposition of intensity of energy-related CO2 emission in Chinese provinces using the LMDI method. Energy Policy 2016, 92, 369–381. [Google Scholar] [CrossRef]
  33. Tang, C.C.; Zhong, L.S.; Ng, P. Factors that influence the tourism industry’s carbon emissions: A tourism area life cycle model perspective. Energy Policy 2017, 109, 704–718. [Google Scholar] [CrossRef]
  34. Stefănică, M.; Sandu, C.B.; Butnaru, G.I.; Haller, A.P. The nexus between tourism activities and environmental degradation: Romanian tourists’ opinions. Sustainability 2021, 13, 9210. [Google Scholar] [CrossRef]
  35. Lee, J.W.; Brahmasrene, T. Investigating the influence of tourism on economic growth and carbon emissions: Evidence from panel analysis of the European Union. Tour. Manag. 2013, 38, 69–76. [Google Scholar] [CrossRef]
  36. Katircioglu, S.T. Testing the tourism-induced EKC hypothesis: The case of Singapore. Econ. Model. 2014, 41, 383–391. [Google Scholar] [CrossRef]
  37. Paramati, S.R.; Alam, M.S.; Chen, C.F. The effects of tourism on economic growth and CO2 emissions: A comparison between developed and developing economies. J. Travel Res. 2017, 56, 712–724. [Google Scholar] [CrossRef] [Green Version]
  38. Paramati, S.R.; Shahbaz, M.; Alam, M.S. Does tourism degrade environmental quality? A comparative study of Eastern and Western European Union. Transp. Res. Part D Transp. Environ. 2017, 50, 1–13. [Google Scholar] [CrossRef]
  39. Katircioglu, S.T.; Feridun, M.; Kilinc, C. Estimating tourism-induced energy consumption and CO2 emissions: The case of Cyprus. Renew. Sustain. Energy Rev. 2014, 29, 634–640. [Google Scholar] [CrossRef]
  40. Gössling, S.; Lund-Durlacher, D. Tourist accommodation, climate change and mitigation: An assessment for Austria. J. Outdoor Recreat. Tour. 2021, 34, 100367. [Google Scholar] [CrossRef]
  41. Neger, C.; Prettenthaler, F.; Gössling, S.; Damm, A. Carbon intensity of tourism in Austria: Estimates and policy implications. J. Outdoor Recreat. Tour. 2021, 33, 100331. [Google Scholar] [CrossRef]
  42. Li, L.; Li, J.; Tang, L.; Wang, S. Balancing tourism’s economic benefit and CO2 emissions: An insight from input–output and tourism satellite account analysis. Sustainability 2019, 11, 1052. [Google Scholar] [CrossRef] [Green Version]
  43. Nagaj, R.; Žuromskaite, B. Tourism in the era of COVID-19 and its impact on the environment. Energies 2021, 14, 2000. [Google Scholar] [CrossRef]
  44. Lenzen, M.; Sun, Y.Y.; Faturay, F.; Ting, Y.P.; Geschke, A.; Malik, A. The carbon footprint of global tourism. Nature Climate Change 2018, 8, 522–528. [Google Scholar] [CrossRef]
  45. Gössling, S. National emissions from tourism: An overlooked policy challenge? Energy Policy 2013, 59, 433–442. [Google Scholar] [CrossRef]
  46. Zha, J.P.; Tan, T.; Yuan, W.W.; Yang, X.J.; Zhu, Y. Decomposition analysis of tourism CO2 emissions for sustainable development: A case study of China. Sustain. Dev. 2020, 28, 169–186. [Google Scholar] [CrossRef]
  47. Gössling, S. Global environmental consequences of tourism. Global Environ. Chang. 2002, 12, 283–302. [Google Scholar] [CrossRef]
  48. Gössling, S.; Peeters, P. Assessing tourism’s global environmental impact 1900–2050. J. Sustain. Tour. 2015, 23, 639–659. [Google Scholar] [CrossRef]
  49. Dubois, G.; Ceron, J.P. Tourism/Leisure Greenhouse Gas Emissions Forecasts for 2050: Factors for change in France. J. Sustain. Tour. 2006, 14, 172–191. [Google Scholar] [CrossRef]
  50. Robaina-Alves, M.; Moutinho, V.; Costa, R. Change in energy-related CO2 (carbon dioxide) emissions in Portuguese tourism: A decomposition analysis from 2000 to 2008. J. Clean. Prod. 2016, 111, 520–528. [Google Scholar] [CrossRef]
  51. Wang, J.C.; Wang, Y.C.; Li, K.; Wang, J.H. Greenhouse gas emissions of amusement parks in Taiwan. Renew. Sust. Energ. Rev. 2017, 74, 581–589. [Google Scholar] [CrossRef]
  52. Kelly, J.; Williams, P.W. Tourism destination energy consumption and greenhouse gas emissions: Whistler, British Columbia, Canada. Sustain. Tour. 2007, 15, 67–90. [Google Scholar] [CrossRef]
  53. Dwyer, L.; Forsyth, P.; Spurr, R.; Hoque, S. Estimating the carbon footprint of Australian tourism. J. Sustain. Tour. 2010, 18, 355–376. [Google Scholar] [CrossRef]
  54. Wu, P.; Shi, P.H. An estimation of energy consumption and CO2 emissions in tourism sector of China. J. Geogr. Sci. 2011, 21, 733–745. [Google Scholar] [CrossRef]
  55. Camelia, S.; Razva, S.M.; Breda, Z.; Ana-Irina, D. An Input-Output approach of CO2 emissions in tourism sector in Post-Communist Romania. Procedia Econ. Financ. 2012, 3, 987–992. [Google Scholar] [CrossRef]
  56. Zhong, Y.D.; Shi, S.Y.; Li, S.H.; Luo, F.; Luo, W.L. Empirical research on measurement framework construction for tourist industry carbon emission in China: A perspective of input-output. J. Cent. South Univ. Forest. Technol. 2015, 35, 132–139. [Google Scholar] [CrossRef]
  57. Munday, M.; Turner, K.; Jones, C. Accounting for the carbon associated with regional tourism consumption. Tour. Manag. 2013, 36, 35–44. [Google Scholar] [CrossRef]
  58. Becken, S.; Patterson, M. Measuring national carbon dioxide emissions from tourism as a key step towards achieving sustainable tourism. Tour. Manag. 2006, 31, 285–290. [Google Scholar] [CrossRef]
  59. Jones, C. Scenarios for greenhouse gas emissions reduction from tourism: An extended tourism satellite account approach in a regional setting. J. Sustain. Tour. 2012, 21, 458–472. [Google Scholar] [CrossRef]
  60. Meng, W.Q.; Xu, L.Y.; Hu, B.B. Quantifying direct and indirect carbon dioxide emissions of the Chinese tourism industry. J. Clean. Prod. 2016, 126, 586–594. [Google Scholar] [CrossRef]
  61. Perch-Nielsen, S.; Sesartic, A.; Stucki, M. The greenhouse gas intensity of the tourism sector: The case of Switzerland. Environ. Sci. Policy 2010, 13, 131–140. [Google Scholar] [CrossRef]
  62. Yao, D.; Ren, L.Y.; Ma, R.F.; Li, Z.K.; Wang, C.J. Analysis of spatial pattern and influencing factors of carbon emissions intensity of tourism industry in Yangtze River Delta. Ecol. Sci. 2021, 40, 89–98. [Google Scholar] [CrossRef]
  63. Wang, K.; Zhang, J.J.; Geng, Y.H.; Xiao, L.X.; Xu, Z.; Rao, Y.H.; Zhou, X.L. Differential spatial-temporal responses of carbon dioxide emissions to economic development: Empirical evidence based on spatial analysis. Mitig. Adapt. Strat. Gl. 2020, 25, 237–260. [Google Scholar] [CrossRef]
  64. Wang, R.; Xia, B.; Dong, S.; Li, Y.; Li, Z.; Ba, D.; Zhang, W. Research on the Spatial Differentiation and Driving Forces of Eco-Efficiency of Regional Tourism in China. Sustainability 2021, 13, 280. [Google Scholar] [CrossRef]
  65. Geng, Y.; Zhao, H.Y.; Liu, Z.; Xue, B.; Fujita, T.; Xi, F.M. Exploring driving factors of energy related CO2 emissions in Chinese provinces: A case of Liaoning. Energy Policy 2013, 60, 820–826. [Google Scholar] [CrossRef]
  66. Ang, B.W.; Zhang, F.Q. A survey of index decomposition analysis in energy and environmental studies. Energy 2000, 25, 1149–1176. [Google Scholar] [CrossRef]
  67. Ang, B. Decomposition analysis for policy making in energy: Which is the preferred method. Energy Policy 2004, 32, 1131–1139. [Google Scholar] [CrossRef]
  68. Liu, J.; Chen, X.P.; Zhang, Z.L. Features and factors decomposition of carbon dioxide emissions of China’s tourism industry. Res. Indus. 2017, 19, 67–76. [Google Scholar] [CrossRef]
  69. Luo, F.; Moyle, B.D.; Moyle, C.J.; Zhong, Y.D.; Shi, S.Y. Drivers of carbon emissions in China’s tourism industry. J. Sustain. Tour. 2020, 28, 747–770. [Google Scholar] [CrossRef]
  70. Liu, Z.L.; Lu, C.P.; Mao, J.H.; Sun, D.Q.; Li, H.J.; Lu, C.Y. Spatial-temporal heterogeneity and the related influencing factors of tourism efficiency in China. Sustainability 2021, 13, 5825. [Google Scholar] [CrossRef]
  71. Patterson, M.; McDonald, G. How Clean and Green Is New Zealand Tourism; Lincoln: Manaki, Whenua, 2004; pp. 56–59. [Google Scholar]
  72. Carlsson-Kanyama, A.; Lindén, A.L. Travel patterns and environmental effects now and in the future: Implications of differences in energy consumption among socio-economic groups. Ecol. Econ. 1999, 30, 405–417. [Google Scholar] [CrossRef]
  73. Peeters, P.; Dubois, G. Tourism travel under climate change mitigation constraints. J. Transp. Geog. 2010, 18, 131–140. [Google Scholar] [CrossRef]
  74. Theil, H. Economics and Information Theory; North Holland Publishing Company: Amsterdam, The Netherlands, 1967. [Google Scholar]
  75. Zhang, W.; Bao, S. Created unequal: China’s regional pay inequality and its relationship with mega-trend urbanization. Appl. Geog. 2015, 61, 81–93. [Google Scholar] [CrossRef]
  76. Zhang, S.X.; Ning, Y.D. An Analysis on the Differences of Regional Energy Efficiency in China—The Empirical Study Based on Theil Index. Adv. Mat. Res. 2014, 830, 392–397. [Google Scholar] [CrossRef]
  77. Anselin, L. The Local Indicators of Spatial Association—LISA. Geogr. Anal. 1995, 27, 93–115. [Google Scholar] [CrossRef]
  78. Kaya, Y. Impact of Carbon Dioxide Emission on GNP Growth: Interpretation of Proposed Scenarios. Presentation to the Energy and Industry Subgroup; Response Strategies Working Group, IPCC: Geneva, Switzerland, 1989. [Google Scholar]
  79. Ang, B.W.; Zhang, F.Q.; Choi, K.H. Factorizing changes in energy and environmental indicators through decomposition. Energy 1998, 23, 489–495. [Google Scholar] [CrossRef]
  80. Ang, B.W.; Liu, F.L.; Chew, E.P. Perfect decomposition techniques in energy and environmental analysis. Energy Policy 2003, 31, 1561–1566. [Google Scholar] [CrossRef]
  81. National Tourism Administration of the People’s Republic of China. The Yearbook of China Tourism Statistics 2005; China Travel & Tourism Press: Beijing, China, 2005. [Google Scholar]
  82. Wang, Q.; Wu, S.D.; Li, T.T. Spatio-temporal characteristics of energy consumption and carbon emissions in industry sector during the period of economic transition in China. Scientia Geogr. Sin. 2011, 31, 36–41. [Google Scholar] [CrossRef]
  83. Gössling, S.; Scott, D.C.; Hall, M. Inter-market variability in CO2 emission-intensities in tourism: Implications for destination marketing and carbon management. Tour. Manag. 2015, 46, 203–212. [Google Scholar] [CrossRef]
  84. Gühnemann, A.; Kurzweil, A.; Mailer, M. Tourism mobility and climate change—A review of the situation in Austria. J. Outdoor Recreat. Tour. 2021, 34, 100382. [Google Scholar] [CrossRef]
  85. Fu, L.; Cao, Y.; Guo, H.; Kuang, S.Y. China’s Low-Carbon Development Progress and Policy Evaluation Since the 12th Five-Year Plan Period. Chin. J. Environ. Manag. 2021, 13, 16–24. [Google Scholar] [CrossRef]
  86. Tang, C.C.; Zha, J.P.; Zhang, J.K.; Tao, Y.G.; Wang, L.G.; Wang, L.; Han, Y. Dual-cabon goal of China’s tourism industry under high-quality development: Evaluation & prediction, major challenges and realization path. J. Chin. Ecotour. 2021, 11, 471–497. [Google Scholar] [CrossRef]
  87. Barbosa, R.B.; Costa, J.H.; Korstanje, M.E. The effect of COVID-19 in the tourist society: An anthropological insight of the trivialisation of death and life. Int. J. Tour. Anthrop. 2021, 8, 179–192. [Google Scholar] [CrossRef]
  88. Andrews, H. Tourism and COVID-19: Intimacy transformed or intimacy interrupted? Anthrop. Action 2020, 27, 93–100. [Google Scholar] [CrossRef]
  89. Huang, Y.T. Analysis of the impact of COVID-19 epidemic on tourism industry volatility under the background of big data. Front. Econ. Manag. 2020, 1, 189–193. [Google Scholar] [CrossRef]
  90. Sun, Y.Y.; Higham, J. Overcoming information asymmetry in tourism carbon management: The application of a new reporting architecture to Aotearoa New Zealand. Tour. Manag. 2021, 83, 104231. [Google Scholar] [CrossRef] [PubMed]
  91. Liu, W.D.; Tang, Z.P.; Xia, Y.; Jiang, W. Identifying the key factors influencing Chinese carbon intensity using machine learning, the random forest algorithm and evolutionary analysis. Acta Geogr. Sin. 2019, 74, 2592–2603. [Google Scholar]
  92. Han, Y.J.; Wu, P. The measurement and comparative study of carbon dioxide emissions from tourism industry of Beijing-Tianjin-Hebei. Human Geogr. 2016, 4, 127–134. [Google Scholar] [CrossRef]
  93. Sun, Y.Y. Estimation of CO2 emission and its effect decomposition in tourism sector of Shanghai city. Areal Res. Dev. 2020, 39, 122–126. [Google Scholar] [CrossRef]
  94. Xie, Y.J.; Wei, Y.D.; Hu, Y.C.; Wang, D.P.; Chen, F. Exploring the construction of Hainan International Tourism Consumption Center from the perspective of the integration of culture and tourism. Tour. Trib. 2019, 34, 12–22. [Google Scholar] [CrossRef]
  95. Wang, Z.; Cheng, J.H.; Cheng, Z.H. Regional differences and influencing factors of tourism carbon equilibrium in China. Acta Ecol. Sin. 2021, 41, 8063–8075. [Google Scholar] [CrossRef]
Figure 1. Research framework.
Sustainability 14 08373 g001
Figure 2. Changes in TE and annual growth rate during 2000–2019.
Sustainability 14 08373 g002
Figure 3. Spatial evolution of TE in China during 2000–2019.
Sustainability 14 08373 g003
Figure 4. TEI changes during 2000–2019.
Sustainability 14 08373 g004
Figure 5. Spatial pattern evolution of TEI types in China during 2000–2019.
Sustainability 14 08373 g005
Figure 6. Spatial clustering changes of TEI.
Sustainability 14 08373 g006
Figure 7. The spatiotemporal effect of industrial scale on TE increment.
Sustainability 14 08373 g007
Figure 8. The spatiotemporal effect of industrial economy on TE increase.
Sustainability 14 08373 g008
Figure 9. The spatiotemporal effect of energy intensity on TE increase.
Sustainability 14 08373 g009
Figure 10. Spatiotemporal effects of spatial structure on the TE increment.
Sustainability 14 08373 g010
Figure 11. The spatiotemporal effect of energy structure on the TE increment.
Sustainability 14 08373 g011
Table 1. Parameters defined in Equations (3)–(8).
ParametersExplanationValue
j Transport modes, namely airlines, highways, railways, and waterways
T i j t Passenger   turnover   volume   for   transport   mode   j   of   province   i   in   the   t yearFrom the Statistical Yearbooks of various provinces in China (2001–2020)
P j Proportion   of   tourists   as   passengers   for   each   transport   mode   j 64.7%, 13.8%, 31.6%, 10.6% for each transport mode, respectively [6,15]
δ j Energy   consumption   per   unit   for   transport   mode   j 2, 1.8, 1, 0.9 MJ/pkm for each transport mode, respectively [6,72]
θ j Carbon   emissions   per   unit   for   transport   mode   j 137, 133, 27, and 106 g/pkm for each transport mode, respectively [54,73]
B i t Total   number   of   beds   in   hotels   of   province   i   in   the   t yearFrom the Statistical Yearbooks of provinces in China (2001–2020)
L i t Annual   letting   rate   of   province   i   in   the   t yearFrom the Statistical Yearbooks of provinces in China (2001–2020)
ϑ Energy consumption per bed night155 MJ per bed night [47,54]
Carbon emissions per bed night43.2 g C/MJ per bed night [15]
q Activity types, namely sightseeing, leisure vacations, business conferences, visiting relatives/friends, and others
N i t Tourist   number   of   province   i   in   the   t yearFrom the Statistical Yearbooks of provinces in China (2001–2020)
A q t Proportion   of   tourists   choosing   an   activity   type   q   in   the   t yearFrom the Inbound Tourist Sampling Survey Data (2001–2008), Sample survey data of domestic tourism in China (2001–2008), and Tourism Sampling Survey Data (2009–2020)
q Energy   consumption   per   unit   for   activity   type   q 8.5 ,   26.5 ,   16 ,   12 ,   and   3.5   MJ / visitor   for   each   type   q , respectively [6,18]
q Carbon   emissions   per   unit   for   activity   type   q 417 ,   1670 ,   786 ,   591 ,   and   172   g / visitor   for   each   type   q , respectively [6,18]
Table 2. The Theil index of TEI in China during 2000–2019.
Year T T B R T W R Inter-Regional Contribution Rate (%)Intra-Regional Contribution Rate (%)
20000.11980.0384 0.0814 32.03 67.97
20010.1145 0.0112 0.1033 9.77 90.23
20020.1056 0.0089 0.0968 8.39 91.61
20030.1037 0.0086 0.0951 8.31 91.69
20040.0745 0.0061 0.0684 8.18 91.82
20050.0775 0.0048 0.0727 6.25 93.75
20060.0859 0.0046 0.0812 5.41 94.59
20070.0947 0.0066 0.0881 6.98 93.02
20080.1287 0.0102 0.1185 7.91 92.09
20090.1312 0.0141 0.1171 10.75 89.25
20100.1331 0.0180 0.1151 13.55 86.45
20110.1334 0.0162 0.1171 12.18 87.82
20120.1270 0.0186 0.1083 14.66 85.34
20130.1716 0.0291 0.1425 16.97 83.03
20140.1773 0.0277 0.1495 15.65 84.35
20150.1884 0.0273 0.1611 14.50 85.50
20160.2449 0.0463 0.1986 18.90 81.10
20170.2774 0.0640 0.2134 23.08 76.92
20180.3072 0.0795 0.2277 25.87 74.13
20190.3323 0.0939 0.2384 28.27 71.73
Table 3. Theil index of TEI in each region during 2000–2019.
YearEastern RegionCentral RegionWestern RegionNortheastern Region
20000.05710.0069 0.0163 0.0012
20010.0476 0.0078 0.0474 0.0005
20020.0541 0.0056 0.0364 0.0006
20030.0568 0.0035 0.0342 0.0006
20040.0448 0.0026 0.0203 0.0007
20050.0510 0.0028 0.0169 0.0020
20060.0597 0.0028 0.0163 0.0024
20070.0652 0.0040 0.0154 0.0035
20080.0925 0.0034 0.0196 0.0030
20090.0866 0.0028 0.0227 0.0050
20100.0901 0.0023 0.0186 0.0041
20110.0951 0.0022 0.0158 0.0051
20120.0886 0.0012 0.0132 0.0053
20130.1190 0.0022 0.0134 0.0079
20140.1224 0.0021 0.0114 0.0087
20150.1393 0.0031 0.0097 0.0094
20160.1678 0.0035 0.0132 0.0121
20170.1782 0.0038 0.0193 0.0124
20180.1906 0.0040 0.0205 0.0126
20190.1985 0.0045 0.0234 0.0129
Table 4. Moran’s I value of China’s TEI during 2000–2019.
YearMoran’s IZ 1pYearMoran’s IZ 1p
20000.2652.5800.01220100.1982.2330.029
20010.2522.5760.01120110.1942.2670.023
20020.2482.4900.01320120.1972.4370.021
20030.2472.8800.00620130.1391.9480.044
20040.2062.0070.03320140.1041.5140.074
20050.2452.3450.02320150.0560.9840.155
20060.1871.9830.0420160.0621.1170.127
20070.1591.7740.05320170.0591.0330.147
20080.1541.9050.04420180.0701.1540.127
20090.1631.8490.04920190.0701.1250.131
1 Note: When the Z-value is >2.58, it passes the 1% significance level test; when the Z-value is >1.96, it passes the 5% significance level test; when the Z-value is >1.65, it passes the 10% significance level test.
Table 5. Decomposition results of TE in China and four regions, 2000–2019.
Factors F u F ρ F σ F τ F φ F
RegionsContribution
(104 t)
Rate
(%)
Contribution
(104 t)
Rate
(%)
Contribution
(104 t)
Rate
(%)
Contribution
(104 t)
Rate
(%)
Contribution
(104 t)
Rate
(%)
Contribution
(104 t)
Rate
(%)
China167.811.07−570.88−3.64−12,602.17−80.36−1249.08−7.975563.6735.4824,372.58155.42
East51.420.54−378.44−3.97−3618.72−37.94−3433.86−36.003144.3132.9613,774.18144.40
Central13.990.82−9.36−0.55−2979.61−174.29595.3834.83759.9744.453329.16194.74
West43.281.16−100.76−2.69−4869.52−129.981599.0042.681314.7535.105759.50153.74
Northeast 59.128.60−82.32−11.98−1134.31−165.05−9.60−1.40344.6450.151509.74219.67
Publisher’s Note: MDPI stays neutral with regard to jurisdictional claims in published maps and institutional affiliations.

