
Is ESG Relevant to Electricity Companies during Pandemics? A Case Study on European Firms during COVID-19

 ,
,
Abstract
:1. Introduction
2. Literature Review
3. Data and Methodology
4. Results
4.1. Event Study Analysis
4.2. Cross-Sectional Analysis
4.3. Moderation Effects of EGS Factors
5. Discussion and Conclusions
Author Contributions
Funding
Institutional Review Board Statement
Informed Consent Statement
Data Availability Statement
Conflicts of Interest
References
- Del Giudice, A.; Paltrinieri, A. The impact of the Arab Spring and the Ebola outbreak on African equity mutual fund investor decisions. Res. Int. Bus. Financ. 2017, 41, 600–612. [Google Scholar] [CrossRef]
- Siddique, A.; Shahzad, A.; Lawler, J.; Mahmoud, K.A.; Lee, D.S.; Ali, N.; Bilal, M.; Rasool, K. Unprecedented environmental and energy impacts and challenges of COVID-19 pandemic. Environ. Res. 2021, 193, 110443. [Google Scholar] [CrossRef] [PubMed]
- Schell, D.; Wang, M.; Huynh, T.L.D. This time is indeed different: A study on global market reactions to public health crisis. J. Behav. Exp. Financ. 2020, 27, 100349. [Google Scholar] [CrossRef] [PubMed]
- Albulescu, C.T. COVID-19 and the United States financial markets’ volatility. Financ. Res. Lett. 2021, 38, 101699. [Google Scholar] [CrossRef] [PubMed]
- He, P.; Sun, Y.; Zhang, Y.; Li, T. COVID–19’s Impact on Stock Prices Across Different Sectors—An Event Study Based on the Chinese Stock Market. Emerg. Mark. Financ. Trade 2020, 56, 2198–2212. [Google Scholar] [CrossRef]
- Ambros, M.; Frenkel, M.; Huynh, T.L.D.; Kilinc, M. COVID-19 pandemic news and stock market reaction during the onset of the crisis: Evidence from high-frequency data. Appl. Econ. Lett. 2020, 28, 1686–1689. [Google Scholar] [CrossRef]
- Niţoi, M.; Pochea, M.M. Time-varying dependence in European equity markets: A contagion and investor sentiment driven analysis. Econ. Model. 2020, 86, 133–147. [Google Scholar] [CrossRef]
- Rizwan, M.S.; Ahmad, G.; Ashraf, D. Systemic risk: The impact of COVID-19. Financ. Res. Lett. 2020, 36, 101682. [Google Scholar] [CrossRef] [PubMed]
- Saadat, S.; Rawtani, D.; Hussain, C.M. Environmental perspective of COVID-19. Sci. Total Environ. 2020, 728, 138870. [Google Scholar] [CrossRef] [PubMed]
- Campra, M.; Esposito, P.; Brescia, V. State of the Art of COVID-19 and Business, Management, and Accounting Sector. A Bibliometrix Analysis. Int. J. Bus. Manag. 2020, 16, 35–52. [Google Scholar] [CrossRef]
- Secinaro, S.; Calandra, D.; Biancone, P.P. Reflection on Coronavirus Accounting Impact on Small and Medium Sized Enterprises (SMEs) in Europe. Int. J. Bus. Manag. 2020, 15, 48. [Google Scholar] [CrossRef]
- Sheehy, B. Defining CSR: Problems and Solutions. J. Bus. Ethic 2015, 131, 625–648. [Google Scholar] [CrossRef]
- Broadstock, D.C.; Chan, K.; Cheng, L.T.; Wang, X. The role of ESG performance during times of financial crisis: Evidence from COVID-19 in China. Financ. Res. Lett. 2021, 38, 101716. [Google Scholar] [CrossRef] [PubMed]
- Demers, E.; Hendrikse, J.; Joos, P.; Lev, B. ESG did not immunize stocks during the COVID-19 crisis, but investments in intangible assets did. J. Bus. Financ. Account. 2021, 48, 433–462. [Google Scholar] [CrossRef]
- Ionescu, G.H.; Firoiu, D.; Pirvu, R.; Vilag, R.D. The impact of esg factors on market value of companies from travel and tourism industry. Technol. Econ. Dev. Econ. 2019, 25, 820–849. [Google Scholar] [CrossRef]
- Clark, J.; Mauck, N.; Pruitt, S.W. The financial impact of COVID-19: Evidence from an event study of global hospitality firms. Res. Int. Bus. Financ. 2021, 58, 101452. [Google Scholar] [CrossRef]
- Amer, E. The Penalization of Non-Communicating UN Global Compact’s Companies by Investors and Its Implications for This Initiative’s Effectiveness. Bus. Soc. 2015, 57, 255–291. [Google Scholar] [CrossRef]
- Willis, C.A.A. The Role of the Global Reporting Initiative’s Sustainability Reporting Guidelines in the Social Screening of Investments. J. Bus. Ethic 2003, 43, 233–237. [Google Scholar] [CrossRef]
- Lee, Y.-J.; Zhang, X.T. AI-Generated Corporate Environmental Data: An Event Study with Predictive Power. Int. Financ. Rev. 2019, 20, 65–83. [Google Scholar] [CrossRef]
- Cheng, B.; Ioannou, I.; Serafeim, G. Corporate social responsibility and access to finance. Strateg. Manag. J. 2014, 35, 1–23. [Google Scholar] [CrossRef]
- Khan, M.; Serafeim, G.; Yoon, A. Corporate Sustainability: First Evidence on Materiality. Account. Rev. 2016, 91, 1697–1724. [Google Scholar] [CrossRef] [Green Version]
- Capelle-Blancard, G.; Petit, A. The Weighting of CSR Dimensions: One Size Does Not Fit All. Bus. Soc. 2015, 56, 919–943. [Google Scholar] [CrossRef]
- Orlitzky, M. Corporate Social Responsibility, Noise, and Stock Market Volatility. Acad. Manag. Perspect. 2013, 27, 238–254. [Google Scholar] [CrossRef] [Green Version]
- Sabbaghi, O.; Xu, M. ROE and Corporate Social Responsibility: Is There a Return On Ethics? J. Account. Financ. 2013, 13, 82–95. [Google Scholar]
- Mitsuyama, N.; Shimizutani, S. Stock market reaction to ESG-oriented management: An event study analysis on a disclosing policy in Japan. Econ. Bull. 2015, 35, 1098–1108. [Google Scholar]
- Sassen, R.; Hinze, A.-K.; Hardeck, I. Impact of ESG factors on firm risk in Europe. Z. Betr. 2016, 86, 867–904. [Google Scholar] [CrossRef]
- Amel-Zadeh, A.; Serafeim, G. Why and How Investors Use ESG Information: Evidence from a Global Survey. Financ. Anal. J. 2018, 74, 87–103. [Google Scholar] [CrossRef] [Green Version]
- Krüger, P. Corporate goodness and shareholder wealth. J. Financ. Econ. 2015, 115, 304–329. [Google Scholar] [CrossRef]
- Ferriani, F.; Natoli, F. ESG risks in times of Covid-19. Appl. Econ. Lett. 2020, 28, 1–5. [Google Scholar] [CrossRef]
- Pavlova, I.; de Boyrie, M.E. ESG ETFs and the COVID-19 stock market crash of 2020: Did clean funds fare better? Financ. Res. Lett. 2021, 102051. [Google Scholar] [CrossRef]
- Mukanjari, S.; Sterner, T. Charting a “Green Path” for Recovery from COVID-19. Environ. Resour. Econ. 2020, 76, 825–853. [Google Scholar] [CrossRef] [PubMed]
- Peña-Ramos, J.A.; Bagus, P.; Amirov-Belova, D. The North Caucasus Region as a Blind Spot in the “European Green Deal”: Energy Supply Security and Energy Superpower Russia. Energies 2020, 14, 17. [Google Scholar] [CrossRef]
- Zhang, D.; Cao, H.; Dickinson, D.G.; Kutan, A.M. Free cash flows and overinvestment: Further evidence from Chinese energy firms. Energy Econ. 2016, 58, 116–124. [Google Scholar] [CrossRef]
- Gugler, K.; Rammerstorfer, M.; Schmitt, S. Ownership unbundling and investment in electricity markets—A cross country study. Energy Econ. 2013, 40, 702–713. [Google Scholar] [CrossRef]
- Zhang, D.; Cao, H.; Zou, P. Exuberance in China’s renewable energy investment: Rationality, capital structure and implications with firm level evidence. Energy Policy 2016, 95, 468–478. [Google Scholar] [CrossRef] [Green Version]
- Huynh, T.L.D.; Foglia, M.; Doukas, J.A. COVID-19 and Tail-event Driven Network Risk in the Eurozone. Financ. Res. Lett. 2021, 44, 102070. [Google Scholar] [CrossRef]
- Ball, R.; Brown, P. An Empirical Evaluation of Accounting Income Numbers. J. Account. Res. 1968, 6, 159. [Google Scholar] [CrossRef] [Green Version]
- Fama, E.F.; Fisher, L.; Jensen, M.C.; Roll, R. The Adjustment of Stock Prices to New Information. Int. Econ. Rev. 1969, 10. [Google Scholar] [CrossRef]
- Wang, Y.-H.; Yang, F.-J.; Chen, L.-J. An investor’s perspective on infectious diseases and their influence on market behavior. J. Bus. Econ. Manag. 2013, 14, S112–S127. [Google Scholar] [CrossRef] [Green Version]
- Kuo, H.-I.; Chen, C.-C.; Tseng, W.-C.; Ju, L.-F.; Huang, B.-W. Assessing impacts of SARS and Avian Flu on international tourism demand to Asia. Tour. Manag. 2008, 29, 917–928. [Google Scholar] [CrossRef] [PubMed]
- Keogh-Brown, M.R.; Smith, R. The economic impact of SARS: How does the reality match the predictions? Health Policy 2008, 88, 110–120. [Google Scholar] [CrossRef] [PubMed]
- Page, S.; Yeoman, I.; Munro, C.; Connell, J.; Walker, L. A case study of best practice—Visit Scotland’s prepared response to an influenza pandemic. Tour. Manag. 2006, 27, 361–393. [Google Scholar] [CrossRef]
- Chen, M.-H. The response of hotel performance to international tourism development and crisis events. Int. J. Hosp. Manag. 2011, 30, 200–212. [Google Scholar] [CrossRef]
- Chen, M.-H.; Kim, W.G.; Kim, H.J. The impact of macroeconomic and non-macroeconomic forces on hotel stock returns. Int. J. Hosp. Manag. 2005, 24, 243–258. [Google Scholar] [CrossRef]
- Shaikh, I.; Huynh, T.L.D. Does disease outbreak news impact equity, commodity and foreign exchange market? Investors’ fear of the pandemic COVID-19. J. Econ. Stud. 2021, in press. [Google Scholar] [CrossRef]
- Dai, P.-F.; Xiong, X.; Liu, Z.; Huynh, T.L.D.; Sun, J. Preventing crash in stock market: The role of economic policy uncertainty during COVID-19. Financ. Innov. 2021, 7, 1–15. [Google Scholar] [CrossRef]
- Huynh, T.L.D.; Foglia, M.; Nasir, M.A.; Angelini, E. Feverish sentiment and global equity markets during the COVID-19 pandemic. J. Econ. Behav. Organ. 2021, 188, 1088–1108. [Google Scholar] [CrossRef]
- Mazur, M.; Dang, M.; Vega, M. COVID-19 and the march 2020 stock market crash. Evidence from S&P1500. Financ. Res. Lett. 2020, 38, 101690. [Google Scholar] [CrossRef] [PubMed]
- Goodell, J.W. COVID-19 and finance: Agendas for future research. Financ. Res. Lett. 2020, 35, 101512. [Google Scholar] [CrossRef] [PubMed]
- Anh, D.L.T.; Gan, C. The impact of the COVID-19 lockdown on stock market performance: Evidence from Vietnam. J. Econ. Stud. 2021, 48, 836–851. [Google Scholar] [CrossRef]
- Zoungrana, T.D.; Toé, D.L.T.; Toé, M. Covid-19 outbreak and stocks return on the West African Economic and Monetary Union’s stock market: An empirical analysis of the relationship through the event study approach. Int. J. Financ. Econ. 2021. [Google Scholar] [CrossRef]
- Ramelli, S.; Wagner, A.F. Feverish Stock Price Reactions to the Novel Coronavirus. SSRN Electron. J. 2020. [Google Scholar] [CrossRef]
- Shahzad, S.J.H.; Bouri, E.; Kristoufek, L.; Saeed, T. Impact of the COVID-19 outbreak on the US equity sectors: Evidence from quantile return spillovers. Financ. Innov. 2021, 7, 1–23. [Google Scholar] [CrossRef]
- Lin, B.; Su, T. Does COVID-19 open a Pandora’s box of changing the connectedness in energy commodities? Res. Int. Bus. Financ. 2021, 56, 101360. [Google Scholar] [CrossRef]
- Chiaramonti, D.; Maniatis, K. Security of supply, strategic storage and Covid19: Which lessons learnt for renewable and recycled carbon fuels, and their future role in decarbonizing transport? Appl. Energy 2020, 271, 115216. [Google Scholar] [CrossRef]
- Kanda, W.; Kivimaa, P. What opportunities could the COVID-19 outbreak offer for sustainability transitions research on electricity and mobility? Energy Res. Soc. Sci. 2020, 68, 101666. [Google Scholar] [CrossRef]
- Klemeš, J.J.; Van Fan, Y.; Jiang, P. COVID -19 pandemic facilitating energy transition opportunities. Int. J. Energy Res. 2021, 45, 3457–3463. [Google Scholar] [CrossRef] [PubMed]
- Werth, A.; Gravino, P.; Prevedello, G. Impact analysis of COVID-19 responses on energy grid dynamics in Europe. Appl. Energy 2021, 281, 116045. [Google Scholar] [CrossRef]
- Peter, J.; Wagner, J. Optimal Allocation of Variable Renewable Energy Considering Contributions to Security of Supply. Energy J. 2021, 42. [Google Scholar] [CrossRef]
- Ye, S.; Dai, P.-F.; Nguyen, H.T.; Huynh, N.Q.A. Is the cross-correlation of EU carbon market price with policy uncertainty really being? A multiscale multifractal perspective. J. Environ. Manag. 2021, 298, 113490. [Google Scholar] [CrossRef]
- Dai, P.-F.; Xiong, X.; Huynh, T.L.D.; Wang, J. The impact of economic policy uncertainties on the volatility of European carbon market. J. Commod. Mark. 2021, 100208. [Google Scholar] [CrossRef]
- Wang, J.; Gu, F.; Liu, Y.; Fan, Y.; Guo, J. An Endowment Effect Study in the European Union Emission Trading Market based on Trading Price and Price Fluctuation. Int. J. Environ. Res. Public Health 2020, 17, 3343. [Google Scholar] [CrossRef] [PubMed]
- Heffron, R.J.; Körner, M.-F.; Schöpf, M.; Wagner, J.; Weibelzahl, M. The role of flexibility in the light of the COVID-19 pandemic and beyond: Contributing to a sustainable and resilient energy future in Europe. Renew. Sustain. Energy Rev. 2021, 140, 110743. [Google Scholar] [CrossRef] [PubMed]
- Zappa, W.; Junginger, M.; Broek, M.V.D. Can liberalised electricity markets support decarbonised portfolios in line with the Paris Agreement? A case study of Central Western Europe. Energy Policy 2021, 149, 111987. [Google Scholar] [CrossRef]
- Petitet, M.; Finon, D.; Janssen, T. Capacity adequacy in power markets facing energy transition: A comparison of scarcity pricing and capacity mechanism. Energy Policy 2017, 103, 30–46. [Google Scholar] [CrossRef]
- Gaddy, B.E.; Sivaram, V.; Jones, T.B.; Wayman, L. Venture Capital and Cleantech: The wrong model for energy innovation. Energy Policy 2017, 102, 385–395. [Google Scholar] [CrossRef] [Green Version]
- Hain, M.; Schermeyer, H.; Uhrig-Homburg, M.; Fichtner, W. Managing renewable energy production risk. J. Bank. Financ. 2018, 97, 1–19. [Google Scholar] [CrossRef]
- Grewal, J.; Riedl, E.J.; Serafeim, G. Market Reaction to Mandatory Nonfinancial Disclosure. Manag. Sci. 2019, 65, 3061–3084. [Google Scholar] [CrossRef] [Green Version]
- Porter, M.E.; Kramer, M.R. Creating Shared Value. Harv. Bus Rev. 2011, 89, 62–77. [Google Scholar]
- Lundgren, T.; Olsson, R. How bad is bad news? Assessing the effects of environmental incidents on firm value. Am. J. Financ. Account. 2009, 1, 376. [Google Scholar] [CrossRef] [Green Version]
- Cellier, A.; Chollet, P. The Impact of Corporate Social Responsibility Rating Announcement on Stock Prices: An Event Study on European Markets. Int. J. Bus. Soc. Sci. 2011, 11, 33. [Google Scholar]
- Albuquerque, R.; Koskinen, Y.; Yang, S.; Zhang, C. Resiliency of Environmental and Social Stocks: An Analysis of the Exogenous COVID-19 Market Crash. Rev. Corp. Financ. Stud. 2020, 9, 593–621. [Google Scholar] [CrossRef]
- Tampakoudis, I.; Noulas, A.; Kiosses, N.; Drogalas, G. The effect of ESG on value creation from mergers and acquisitions. What changed during the COVID-19 pandemic? Corp. Gov. Int. J. Bus. Soc. 2021, 21, 6. [Google Scholar] [CrossRef]
- Dziadkowiec, A.; Daszynska-Zygadlo, K. Disclosures of ESG Misconducts and Market Valuations: Evidence from DAX Companies. Eng. Econ. 2021, 32, 95–103. [Google Scholar] [CrossRef]
- Ahmar, A.S.; del Val, E.B. SutteARIMA: Short-term forecasting method, a case: Covid-19 and stock market in Spain. Sci. Total Environ. 2020, 729, 138883. [Google Scholar] [CrossRef] [PubMed]
- Phan, D.H.B.; Narayan, P.K. Country Responses and the Reaction of the Stock Market to COVID-19—A Preliminary Exposition. Emerg. Mark. Financ. Trade 2020, 56, 2138–2150. [Google Scholar] [CrossRef]
- Goodell, J.W.; Huynh, T.L.D. Did Congress trade ahead? Considering the reaction of US industries to COVID-19. Financ. Res. Lett. 2020, 36, 101578. [Google Scholar] [CrossRef] [PubMed]
- Sandler, D.H.; Sandler, R. Multiple event studies in public finance and labor economics: A simulation study with applications. J. Econ. Soc. Meas. 2014, 39, 31–57. [Google Scholar] [CrossRef]
- Fama, E.F.; French, K.R. Common risk factors in the returns on stocks and bonds. J. Financ. Econ. 1993, 33, 3–56. [Google Scholar] [CrossRef]
- Liu, H.; Wang, Y.; He, D.; Wang, C. Short term response of Chinese stock markets to the outbreak of COVID-19. Appl. Econ. 2020, 52, 5859–5872. [Google Scholar] [CrossRef]
- Liu, J.; Stambaugh, R.F.; Yuan, Y. Size and value in China. J. Financ. Econ. 2019, 134, 48–69. [Google Scholar] [CrossRef]
- Takahashi, H.; Yamada, K. When the Japanese stock market meets COVID-19: Impact of ownership, China and US exposure, and ESG channels. Int. Rev. Financ. Anal. 2021, 74, 101670. [Google Scholar] [CrossRef]
- González-Cruz, T.; Clemente-Almendros, J.A.; Puig-Denia, A. Family governance systems: The complementary role of constitutions and councils. Econ. Res. Ekon. Istraž. 2021, 1–25. [Google Scholar] [CrossRef]
- Jiménez-Zarco, A.I.; Clemente-Almendros, J.A.; González-González, I.; Aracil-Jordà, J. Female Micro-Entrepreneurs and Social Networks: Diagnostic Analysis of the Influence of Social-Media Marketing Strategies on Brand Financial Performance. Front. Psychol. 2021, 12. [Google Scholar] [CrossRef] [PubMed]
- Pérez-Luño, A.; Bojica, A.M.; Golapakrishnan, S. When more is less: The role of cross-functional. Int. J. Oper. Prod. Manag. 2019, 39, 94–115. [Google Scholar] [CrossRef]
- Dawson, J.F.; Richter, A.W. Probing three-way interactions in moderated multiple regression: Development and application of a slope difference test. J. Appl. Psychol. 2006, 91, 917–926. [Google Scholar] [CrossRef] [PubMed]
- Heavey, C.; Simsek, Z. Transactive Memory Systems and Firm Performance: An Upper Echelons Perspective. Organ. Sci. 2015, 26, 941–959. [Google Scholar] [CrossRef]
- Hwang, J.; Kim, H.; Jung, D. The Effect of ESG Activities on Financial Performance during the COVID-19 Pandemic—Evidence from Korea. Sustainability 2021, 13, 11362. [Google Scholar] [CrossRef]
- Garel, A.; Petit-Romec, A. The Resilience of French Companies to the COVID-19 Crisis. Finance 2021, 42, 99–137. [Google Scholar] [CrossRef]
- Yen, T.-Y.; André, P. Market reaction to the effect of corporate social responsibility on mergers and acquisitions: Evidence on emerging markets. Q. Rev. Econ. Financ. 2019, 71, 114–131. [Google Scholar] [CrossRef]

| Variables | Unit | N | Mean | SD | Min | Max |
|---|---|---|---|---|---|---|
| CAR (−5,0) | % | 98 | −26.52 | 13.57 | −57.47 | 5.84 |
| CAR (−3,0) | % | 98 | −21.81 | 12.02 | −50.32 | 6.04 |
| CAR (−2,2) | % | 98 | −19.97 | 10.63 | −51.08 | 9.61 |
| CAR (−1,1) | % | 98 | −12.64 | 7.69 | −33.35 | 9.49 |
| CAR (0,3) | % | 98 | −14.83 | 8.94 | −34.20 | 9.59 |
| CAR (0,5) | % | 98 | −15.28 | 12.50 | −53.12 | 22.64 |
| Environmental pillar score | number | 37 | 56.96 | 25.78 | 2.65 | 92.60 |
| Social pillar score | number | 37 | 57.53 | 23.39 | 4.12 | 93.76 |
| Governance pillar score | number | 40 | 51.61 | 20.05 | 15.93 | 89.52 |
| Total debt to total equity | % | 92 | 173.69 | 271.57 | 0.00 | 1546.43 |
| Beta | number | 95 | 0.65 | 0.41 | −0.54 | 2.17 |
| Current ratio | number | 97 | 1.52 | 1.81 | 0.07 | 16.48 |
| ln market cap | number | 96 | 20.18 | 2.60 | 15.12 | 25.15 |
| ln total revenue | number | 96 | 20.41 | 2.03 | 14.23 | 25.19 |
| Traditional | number | 98 | 0.81 | 0.40 | 0.00 | 1.00 |
| Electricity Sector | Traditional Sector | Renewable Sector | |
|---|---|---|---|
| Event window | CAAR | CAAR | CAAR |
| (−10,0) | −30.43% *** | −29.77% *** | −32.04% *** |
| (−5,0) | −28.82% *** | −27.25% *** | −34.08% *** |
| (0,0) | −11.91% *** | −11.15% *** | −15.11% *** |
| (0,5) | −14.20% *** | −13.39% *** | −17.73% *** |
| (0,10) | −5.09% *** | −5.03% *** | −5.46% *** |
| CAR (−5,0) | CAR (−3,0) | CAR (−2,2) | CAR (−1,1) | CAR (0,3) | CAR (0,5) | |
|---|---|---|---|---|---|---|
| Beta | 0.0220 | 0.0315 | 0.0686 * | 0.0595* | 0.0458 *** | 0.0346 |
| (0.0347) | (0.0282) | (0.0235) | (0.0200) | (0.0244) | (0.0360) | |
| Total debt to total equity | −0.0015 | −0.0005 | −0.0006 | −0.0047 | 0.0008 | 0.0057 |
| (0.0053) | (0.0056) | (0.0029) | (0.0030) | (0.0031) | (0.0047) | |
| Current ratio | 0.0015 | 0.0034 | 0.0072 *** | 0.0005 | 0.0087 ** | 0.0111 ** |
| (0.0021) | (0.0020) | (0.0035) | (0.0026) | (0.0037) | (0.0040) | |
| lnmarketcap | 0.0261 ** | 0.0187 *** | 0.0078 | 0.0114 | 0.0019 | 0.0091 |
| (0.0106) | (0.0089) | (0.0084) | (0.0067) | (0.0075) | (0.0072) | |
| lntotalrevenue | −0.0418 * | −0.0306 ** | −0.0195 *** | −0.0184 *** | −0.0068 | −0.0071 |
| (0.0137) | (0.0116) | (0.0111) | (0.0104) | (0.0100) | (0.0083) | |
| Traditional | 0.1140 * | 0.1035 * | 0.0585 | 0.0610 ** | 0.0252 | 0.0522 *** |
| (0.0393) | (0.0346) | (0.0345) | (0.0270) | (0.0265) | (0.0280) | |
| Constant | −0.0403 | −0.0728 | −0.0542 | −0.0573 | −0.1154 | −0.2873 *** |
| (0.1117) | (0.1079) | (0.0836) | (0.0786) | (0.1219) | (0.1388) | |
| Observations | 88 | 88 | 88 | 88 | 88 | 88 |
| R2 | 0.118 | 0.109 | 0.161 | 0.238 | 0.089 | 0.067 |
| CAR (−5,0) | CAR (−3,0) | CAR (−2,2) | CAR (−1,1) | CAR (0,3) | CAR (0,5) | |
|---|---|---|---|---|---|---|
| Beta | −0.1554 ** | −0.1133 *** | −0.0705 | −0.1108 * | 0.0087 | 0.0333 |
| (0.0593) | (0.0538) | (0.0431) | (0.0323) | (0.0766) | (0.1254) | |
| Total Debt to Total Equity | 0.0115 | 0.0116 | 0.0013 | 0.0118 * | 0.0049 | −0.0032 |
| (0.0107) | (0.0090) | (0.0061) | (0.0037) | (0.0084) | (0.0126) | |
| Current ratio | 0.0046 | 0.0042 | 0.0136 | 0.0147 * | −0.0055 | −0.0350 |
| (0.0207) | (0.0175) | (0.0129) | (0.0029) | (0.0157) | (0.0201) | |
| lnmarketcap | −0.0573 * | −0.0417 ** | −0.0165 | −0.0088 | −0.0081 | −0.0100 |
| (0.0161) | (0.0141) | (0.0156) | (0.0068) | (0.0167) | (0.0180) | |
| lntotalrevenue | 0.0314 ** | 0.0235 ** | 0.0018 | 0.0058 | −0.0015 | −0.0177 |
| (0.0120) | (0.0091) | (0.0131) | (0.0088) | (0.0177) | (0.0304) | |
| Environmental Pillar Score | 0.0008 | 0.0005 | 0.0003 | 0.0010 *** | −0.0004 | −0.0022 |
| (0.0010) | (0.0010) | (0.0009) | (0.0005) | (0.0010) | (0.0015) | |
| Social Pillar Score | −0.0020 | −0.0016 | −0.0004 | −0.0004 | 0.0002 | 0.0004 |
| (0.0016) | (0.0015) | (0.0011) | (0.0005) | (0.0012) | (0.0014) | |
| Governance Pillar Score | −0.0003 | −0.0004 | 0.0002 | −0.0004 | 0.0014 | 0.0021 |
| (0.0009) | (0.0007) | (0.0008) | (0.0004) | (0.0011) | (0.0017) | |
| Traditional | 0.0872 | 0.0908 | 0.0888 | 0.0599 *** | 0.0601 | 0.1748 *** |
| (0.0650) | (0.0559) | (0.0508) | (0.0317) | (0.0717) | (0.0903) | |
| Constant | 0.3807 | 0.2188 | 0.0606 | −0.0895 | −0.0343 | 0.3609 |
| (0.3197) | (0.2575) | (0.2747) | (0.1743) | (0.3535) | (0.5920) | |
| Observations | 37 | 37 | 37 | 37 | 37 | 37 |
| R2 | 0.474 | 0.462 | 0.314 | 0.567 | 0.215 | 0.360 |
| CAR (−5,0) | CAR (−3,0) | CAR (−2,2) | CAR (−1,1) | CAR (0,3) | CAR (0,5) | |
|---|---|---|---|---|---|---|
| Beta | −0.1849 * | −0.1455 * | −0.0976 ** | −0.1213 * | −0.0133 | 0.0101 |
| (0.0492) | (0.0477) | (0.0415) | (0.0346) | (0.0772) | (0.1495) | |
| Total Debt to Total Equity | 0.0089 | 0.0104 | −0.0026 | 0.0110 * | 0.0032 | −0.0046 |
| (0.0094) | (0.0084) | (0.0034) | (0.0032) | (0.0075) | (0.0177) | |
| Current ratio | 0.0067 | 0.0046 | 0.0161 | 0.0157 * | −0.0044 | −0.0346 ** |
| (0.0194) | (0.0156) | (0.0102) | (0.0035) | (0.0136) | (0.0158) | |
| lnmarketcap | −0.0533 ** | −0.0406 * | −0.0208 | −0.0040 | −0.0077 | −0.0133 |
| (0.0186) | (0.0134) | (0.0188) | (0.0099) | (0.0192) | (0.0240) | |
| lntotalrevenue | 0.0263 | 0.0209 *** | 0.0021 | 0.0017 | −0.0033 | −0.0169 |
| (0.0150) | (0.0110) | (0.0155) | (0.0102) | (0.0172) | (0.0323) | |
| Traditional | 0.3084 * | 0.2863 * | 0.1606 *** | 0.1936 ** | 0.1841 * | 0.2488 *** |
| (0.0577) | (0.0522) | (0.0767) | (0.0737) | (0.0581) | (0.1213) | |
| Environmental Pillar Score | 0.0060 * | 0.0047 * | 0.0041 * | 0.0035 * | 0.0028 | 0.0002 |
| (0.0007) | (0.0006) | (0.0008) | (0.0011) | (0.0017) | (0.0023) | |
| Traditional x Environmental Pillar Score | −0.0060 * | −0.0047 * | −0.0044 * | −0.0029 ** | −0.0037 *** | −0.0027 |
| (0.0016) | (0.0014) | (0.0013) | (0.0012) | (0.0018) | (0.0031) | |
| Social Pillar Score | 0.0008 | 0.0018 | 0.0024 *** | 0.0004 | 0.0025 *** | 0.0029 |
| (0.0016) | (0.0012) | (0.0011) | (0.0014) | (0.0013) | (0.0031) | |
| Traditional x Social Pillar Score | −0.0029 | −0.0037 | −0.0026 | −0.0009 | −0.0024 | −0.0027 |
| (0.0029) | (0.0024) | (0.0018) | (0.0016) | (0.0015) | (0.0042) | |
| Governance Pillar Score | −0.0051 ** | −0.0052 * | −0.0051 * | −0.0019 | −0.0022 | −0.0016 |
| (0.0020) | (0.0015) | (0.0010) | (0.0013) | (0.0013) | (0.0026) | |
| Traditional x Governance Pillar Score | 0.0053 ** | 0.0052 * | 0.0061 * | 0.0016 | 0.0040 ** | 0.0043 |
| (0.0019) | (0.0015) | (0.0016) | (0.0014) | (0.0018) | (0.0029) | |
| Constant | 0.2351 | 0.1115 | 0.0799 | −0.2053 | −0.0959 | 0.3613 |
| (0.3088) | (0.2347) | (0.2700) | (0.1801) | (0.4051) | (0.6975) | |
| Observations | 37 | 37 | 37 | 37 | 37 | 37 |
| R2 | 0.667 | 0.698 | 0.603 | 0.728 | 0.389 | 0.403 |
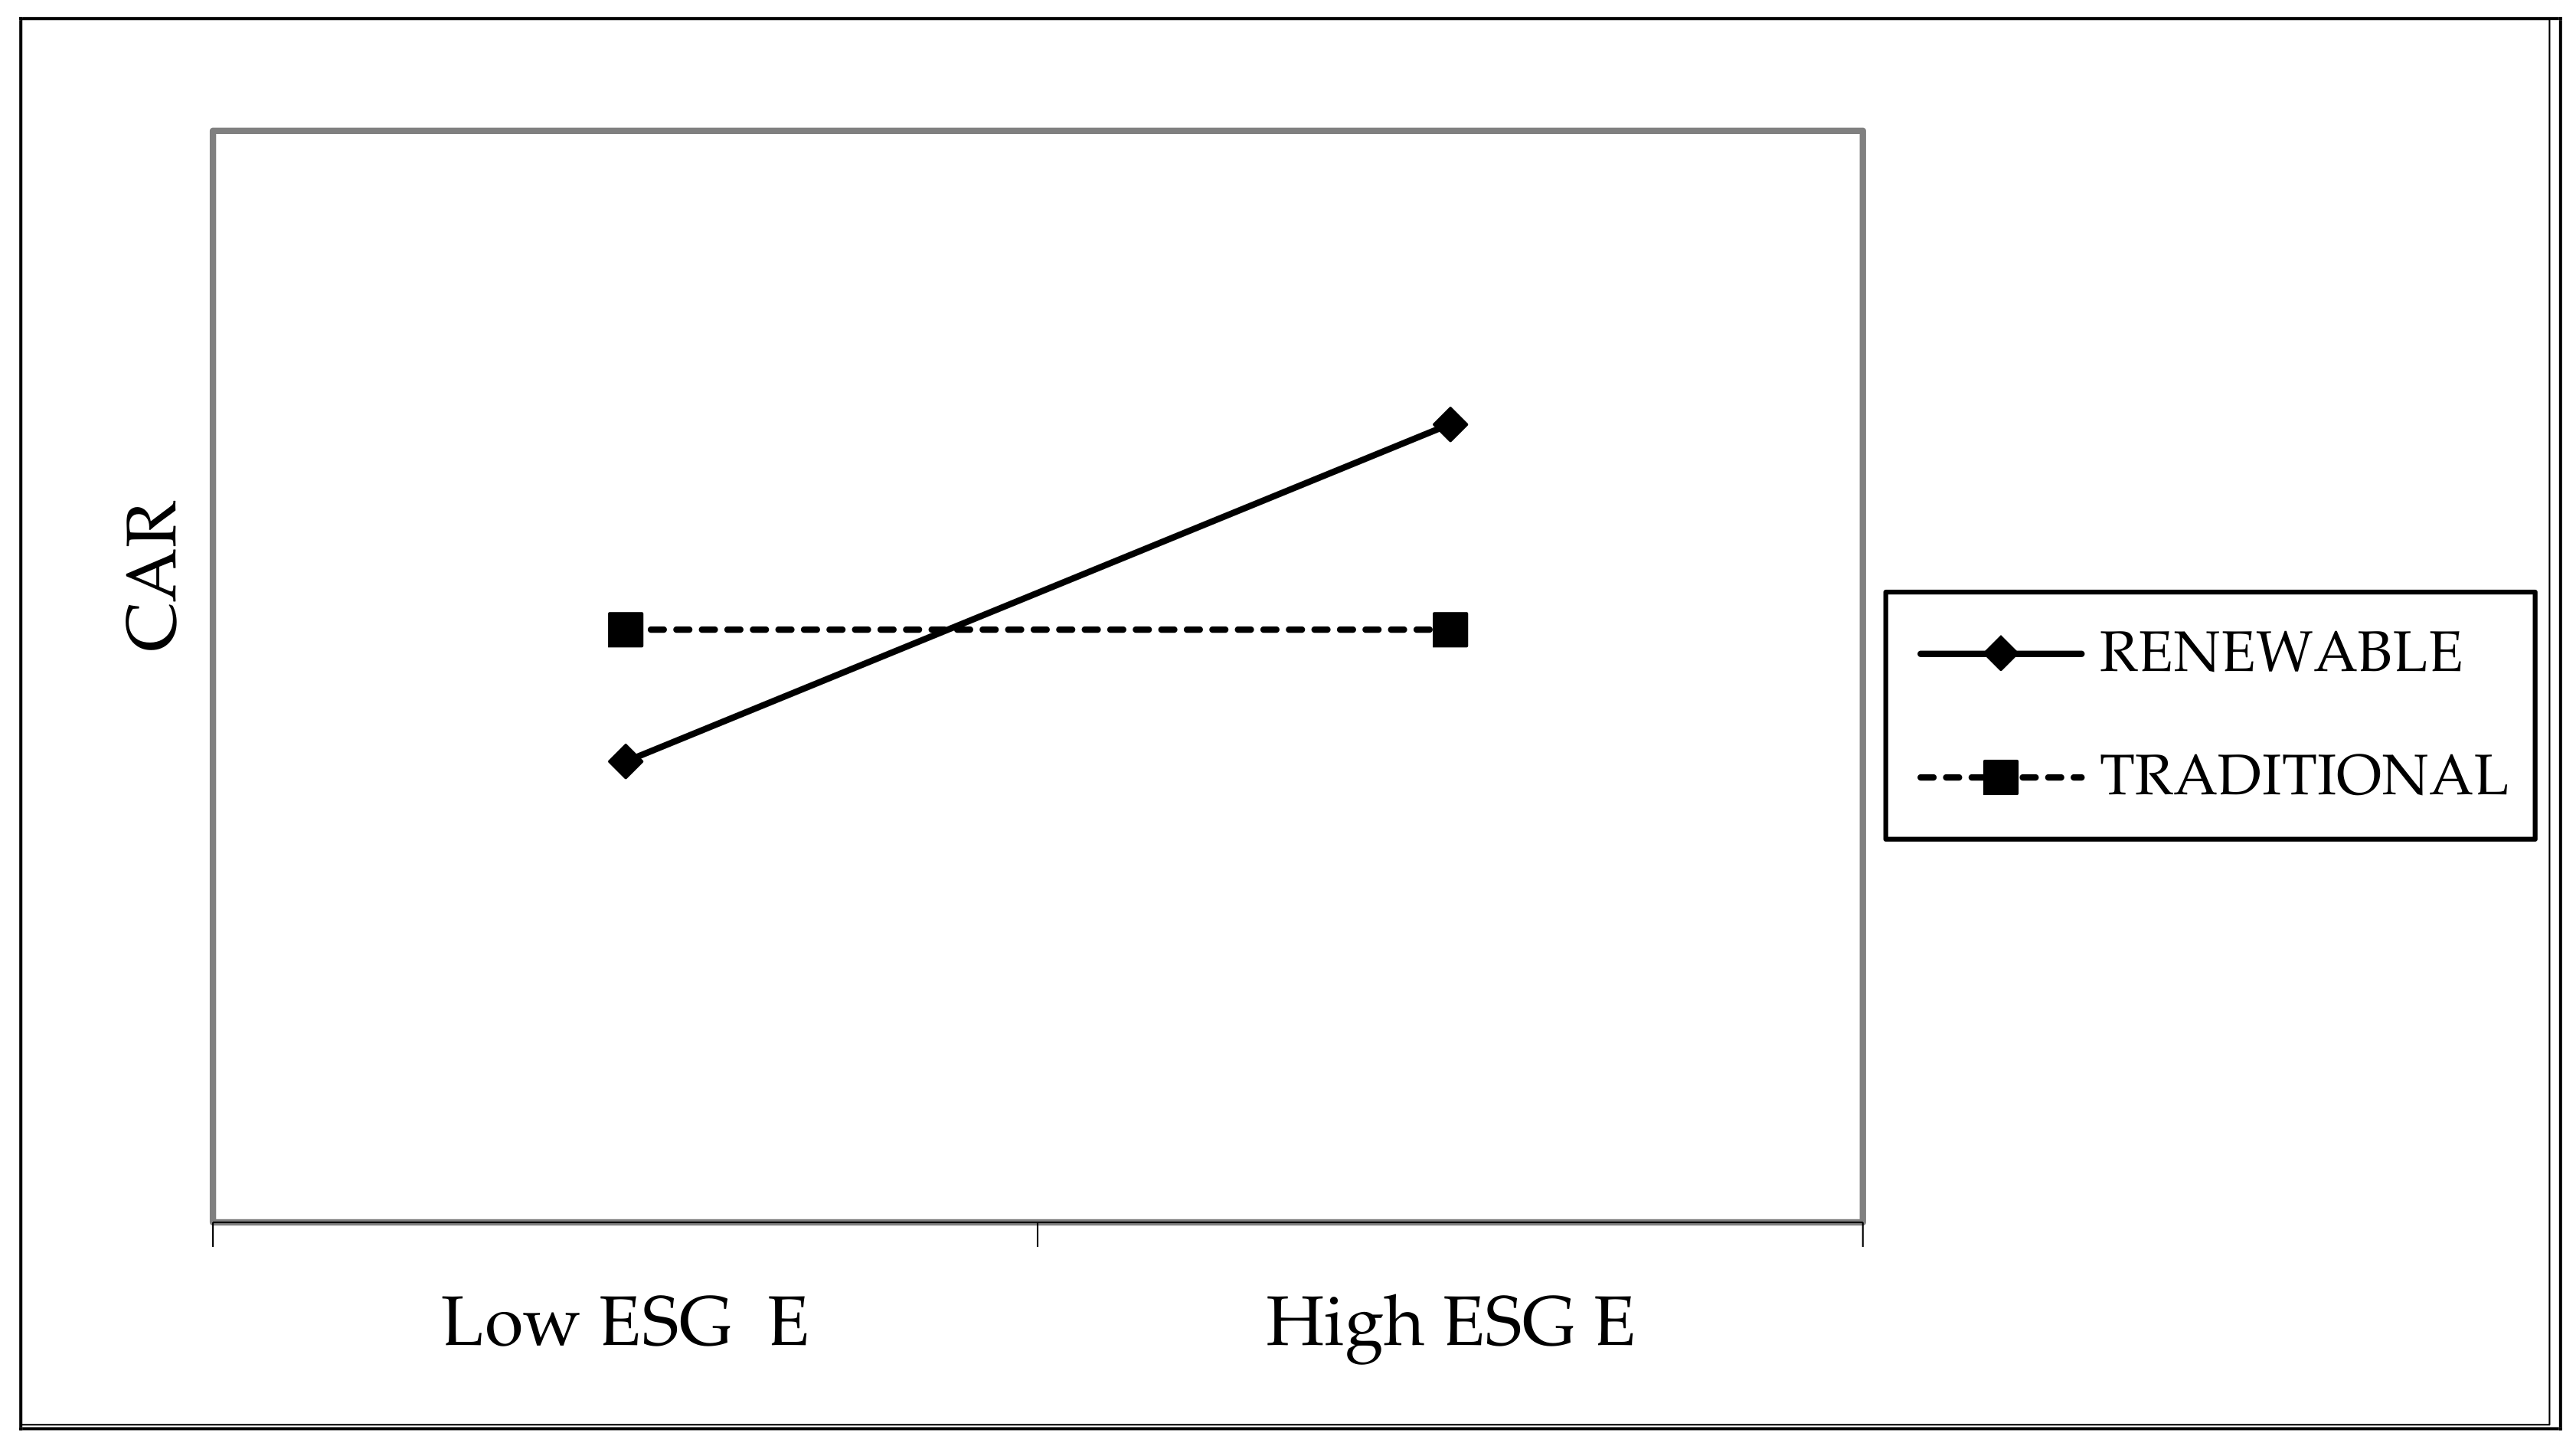
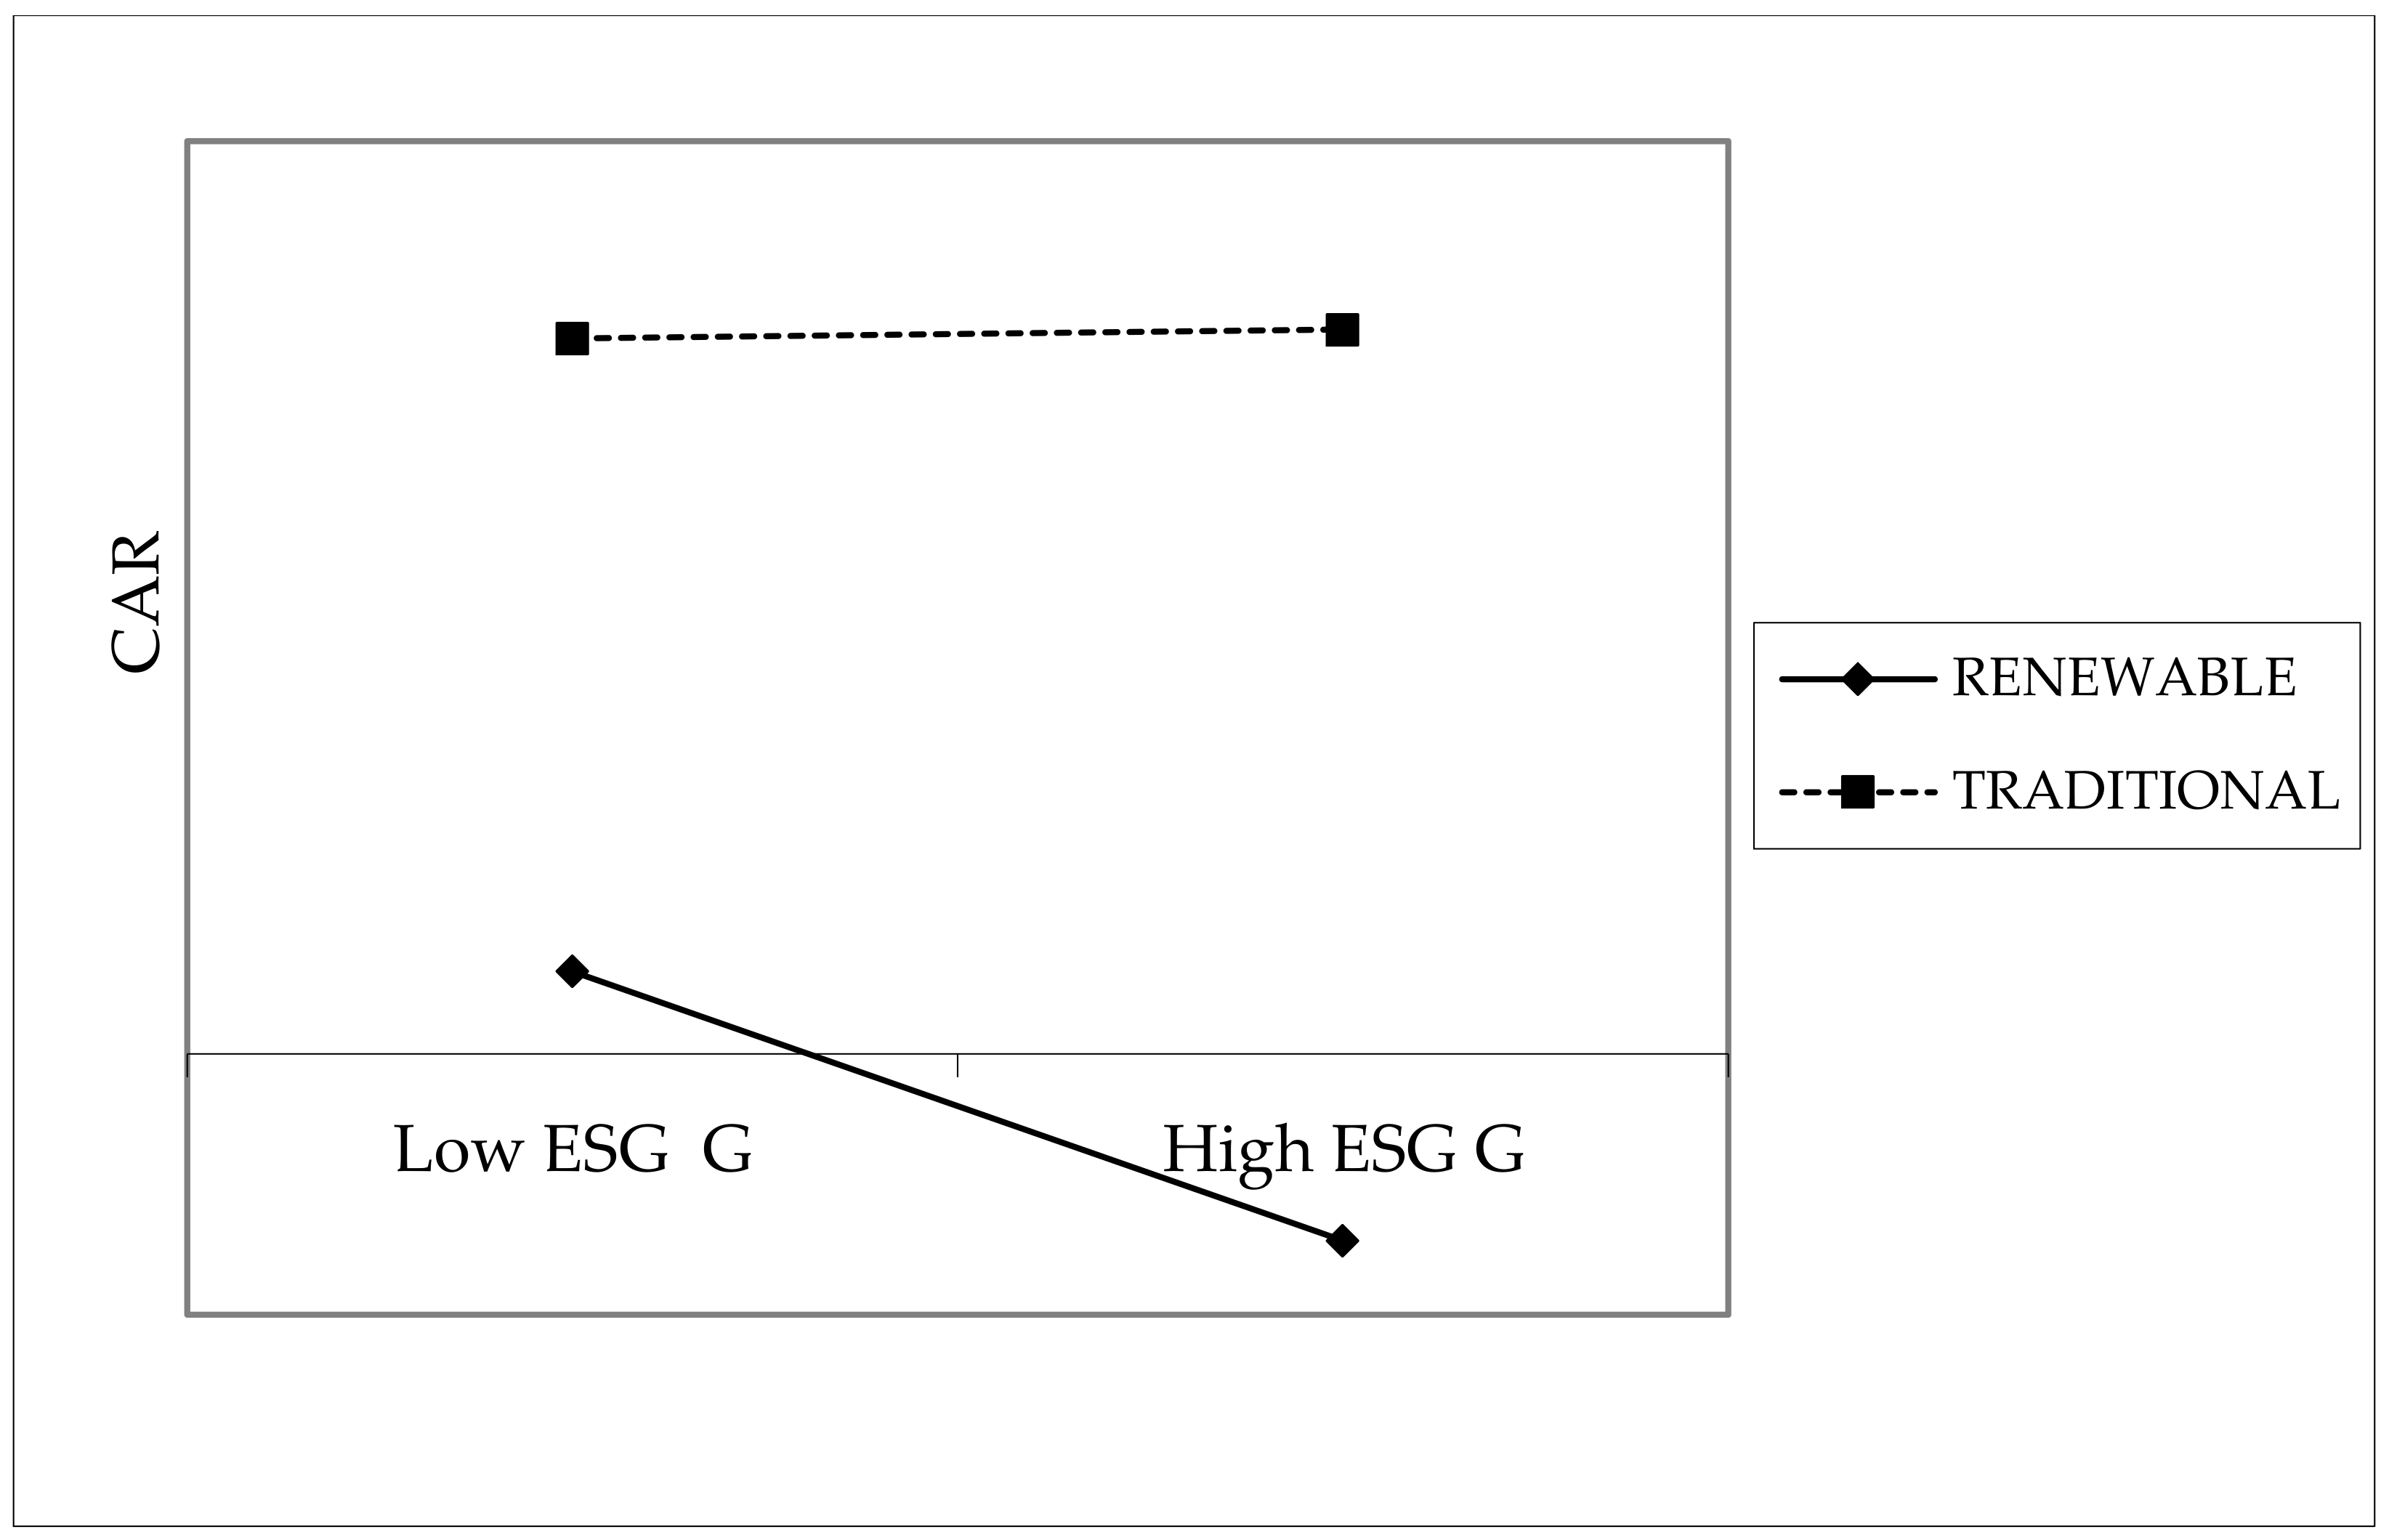
| Low E for Traditional | Low E for Renewable | Low S for Traditional | Low S for Renewable | Low G for Traditional | Low G for Renewable | |
|---|---|---|---|---|---|---|
| High E for Traditional | 0.0606 *** | |||||
| High E for Renewable | −0.1083 *** | |||||
| High E for Traditional | 0.0557 *** | |||||
| High S for Renewable | −0.0223 ** | |||||
| High G for Traditional | −0.0008 | |||||
| High G for Renewable | 0.0197 *** |
Publisher’s Note: MDPI stays neutral with regard to jurisdictional claims in published maps and institutional affiliations. |
© 2022 by the authors. Licensee MDPI, Basel, Switzerland. This article is an open access article distributed under the terms and conditions of the Creative Commons Attribution (CC BY) license (https://creativecommons.org/licenses/by/4.0/).
Share and Cite
Boldeanu, F.T.; Clemente-Almendros, J.A.; Tache, I.; Seguí-Amortegui, L.A. Is ESG Relevant to Electricity Companies during Pandemics? A Case Study on European Firms during COVID-19. Sustainability 2022, 14, 852. https://doi.org/10.3390/su14020852
Boldeanu FT, Clemente-Almendros JA, Tache I, Seguí-Amortegui LA. Is ESG Relevant to Electricity Companies during Pandemics? A Case Study on European Firms during COVID-19. Sustainability. 2022; 14(2):852. https://doi.org/10.3390/su14020852
Chicago/Turabian StyleBoldeanu, Florin Teodor, José Antonio Clemente-Almendros, Ileana Tache, and Luis Alberto Seguí-Amortegui. 2022. "Is ESG Relevant to Electricity Companies during Pandemics? A Case Study on European Firms during COVID-19" Sustainability 14, no. 2: 852. https://doi.org/10.3390/su14020852
APA StyleBoldeanu, F. T., Clemente-Almendros, J. A., Tache, I., & Seguí-Amortegui, L. A. (2022). Is ESG Relevant to Electricity Companies during Pandemics? A Case Study on European Firms during COVID-19. Sustainability, 14(2), 852. https://doi.org/10.3390/su14020852