Article

Seismic Fragility Evaluation of Main Steam Piping of Isolated APR1400 NPP Considering the Actual Failure Mode

1
Seismic Research and Test Center, Pusan National University, Yangsan-si 50612, Korea
2
Advanced Structures and Seismic Safety Research Division, Korea Atomic Energy Research Institute, Daejeon 37224, Korea
3
Department of Convergence & Fusion System Engineering, Kyungpook National University, Sangju 41566, Korea
*
Authors to whom correspondence should be addressed.
Sustainability 2022, 14(14), 8315; https://doi.org/10.3390/su14148315
Submission received: 18 May 2022 / Revised: 28 June 2022 / Accepted: 30 June 2022 / Published: 7 July 2022

Abstract

:
An isolation system installed in a nuclear power plant (NPP) could increase seismic safety during seismic events. On the other hand, a more significant relative displacement may occur due to the isolation system. The seismic risk could be increased in the case of an interface piping system that connects isolated and nonisolated structures. Therefore, it is necessary to consider the piping systems when evaluating the safety of isolated-NPPs. This study performed seismic fragility analysis with isolated APR1400 nuclear power plants with the main steam piping. The main steam piping is the interface pipe connecting the isolated auxiliary building and the turbine building. The failure mode for seismic fragility analysis was defined as cracks caused by leakage. The experimental and numerical analysis results quantified the leak-through crack point as a damage index. The seismic fragility curves are suggested based on peak ground acceleration and the relative displacement between the isolated and nonisolated buildings.

1. Introduction

Seismic events can cause severe damage to a nuclear power plant (NPP). Therefore, the seismic safety of NPPs must be guaranteed. Isolation systems are widely used to secure the seismic safety of infrastructure, such as bridges and buildings. France introduced isolation systems in the 1980s to secure the seismic safety of NPPs, and they have been operating commercially in NPPs, such as Koeberg NPP and Cruas NPP. In Japan, after the Fukushima NPP incident, ongoing research is being conducted to install isolation systems in NPPs, and performance evaluation tests and seismic fragility analyses of the full-scale isolation system have been conducted. The United States conducted research to prepare guidelines related to isolation systems. Studies have also been conducted in Korea to evaluate the mechanical properties of isolation systems to considering the install them in NPPs [1].
The application of an isolation system can improve the seismic safety of NPPs, but the relative displacement between the isolated and nonisolated structures will be increased significantly. Therefore, the safety of some facilities due to the increased relative displacement must be evaluated. In particular, the crossover piping system that connects isolated and nonisolated structures must be able to encounter large relative displacements [2,3,4].
Research on the safety of crossover piping systems has been conducted. Shaking table tests [5] and seismic response analyses were performed to evaluate the seismic safety of the crossover piping system. They confirmed that the crossover piping system has a significantly larger relative displacement compared to the case of a general piping system. Therefore, the stress responses of the crossover piping system could exceed the allowable stress during ground motions that are dominant with long-period components [6]. Leakage due to cracks in NPP piping is the actual failure that could cause serious accidents. Therefore, an experimental study was conducted to express the leakage of the pipe under seismic loads. The elbow is a representative seismic vulnerability component. Cyclic loading tests were performed for the estimation of the seismic capacity of piping elbows. At this time, the nonlinear behavior of the elbow and the damage index analysis based on low-cycle fatigue (LCF) were performed [7,8]. In addition, seismic fragility analysis of the crossover piping system was performed based on the damage index, which can represent leak-through cracks as a failure criterion [9]. Furthermore, seismic fragility analysis of the crossover piping system was performed using NRC-BNL benchmark model no. 4 [10]. On the other hand, this model was briefly applied to the design of nuclear power plants. Moreover, it is difficult to represent structures and piping systems with complex support conditions and shapes, which are different in Korean nuclear power plants. A simplified model was selected to prove the proposed methodology. A simplified seismic fragility analysis was performed for input ground motion considering the unidirectional (horizontal).
This study examined APR1400 (Advanced Power Reactor 1400), which is a representative Korean standard NPP. A nonlinear isolation system was applied to the lower part of the nuclear island. A finite element analysis was prepared for the main steam engine. A representative pipe connecting the isolated and nonisolated structures was evaluated, and seismic fragility analysis was performed. Thirty sets of input ground motion (bi-directional) were considered. Leak-through cracks, which are actual failures that can cause serviceability issues and serious accidents in the piping system, were defined as the failure modes. The damage index for leak-through cracks was used as a failure criterion for seismic fragility analysis. The seismic intensity of the seismic fragility curve used the peak ground acceleration (PGA) and MRD (relative displacement between the ground and the isolated floor).

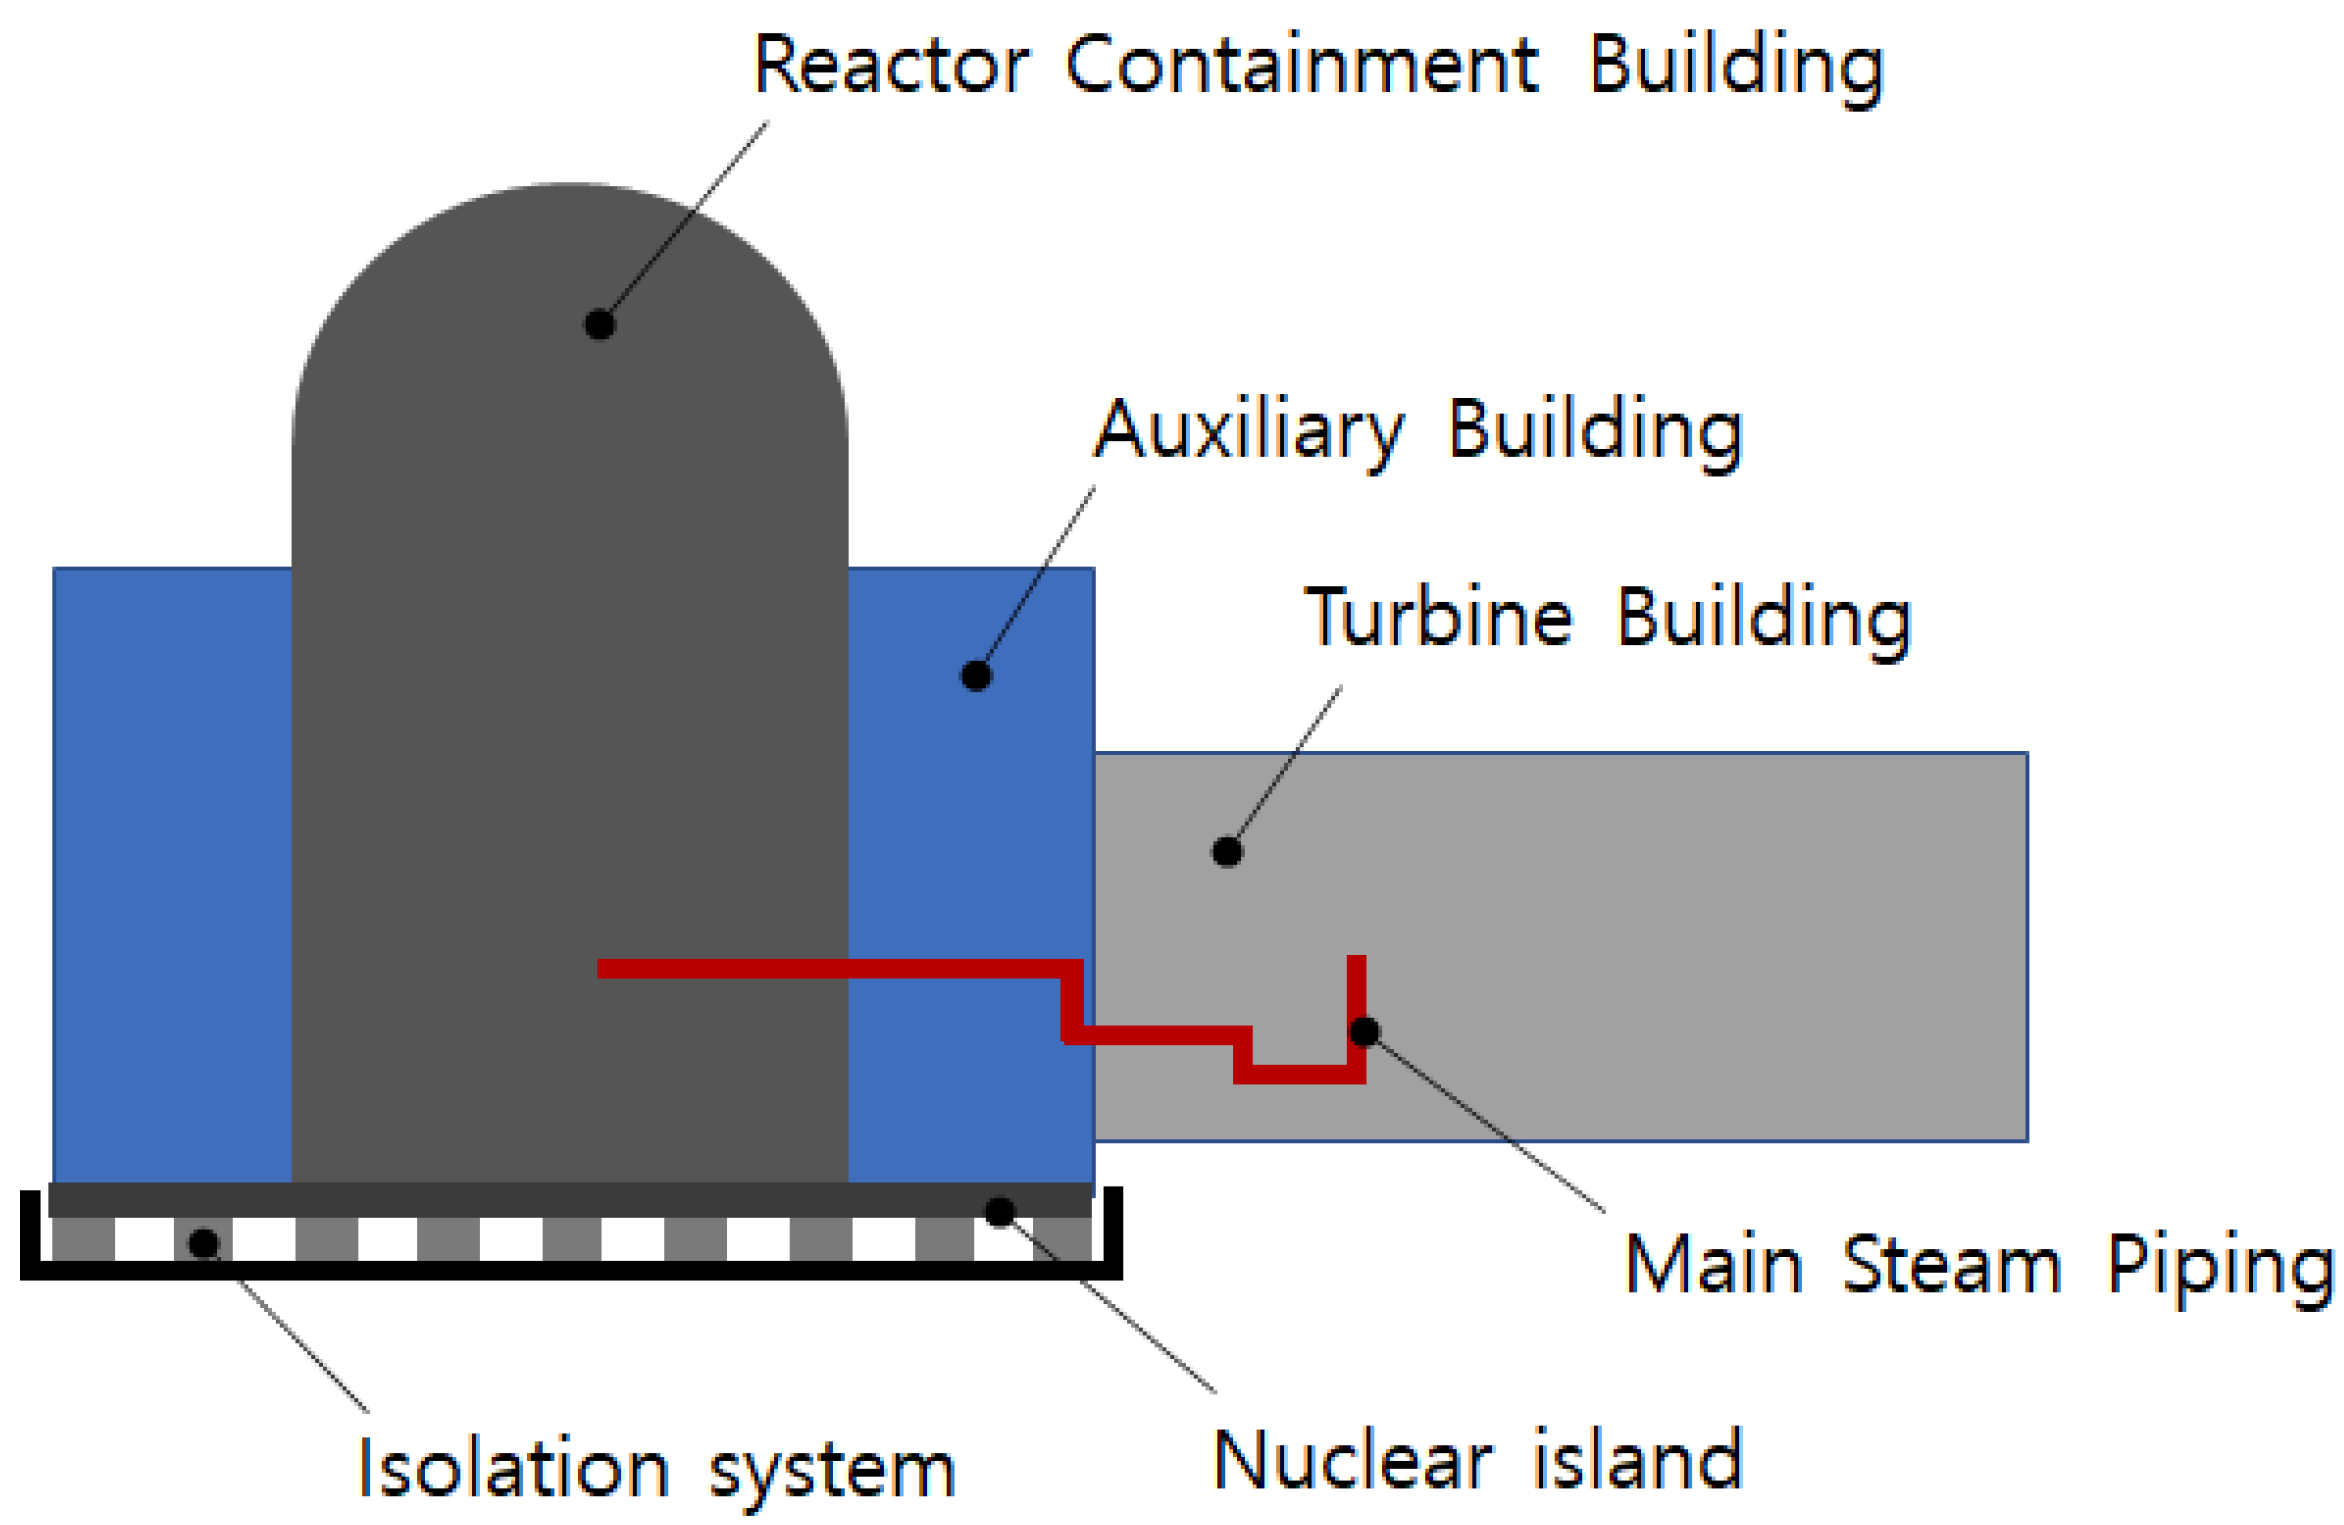
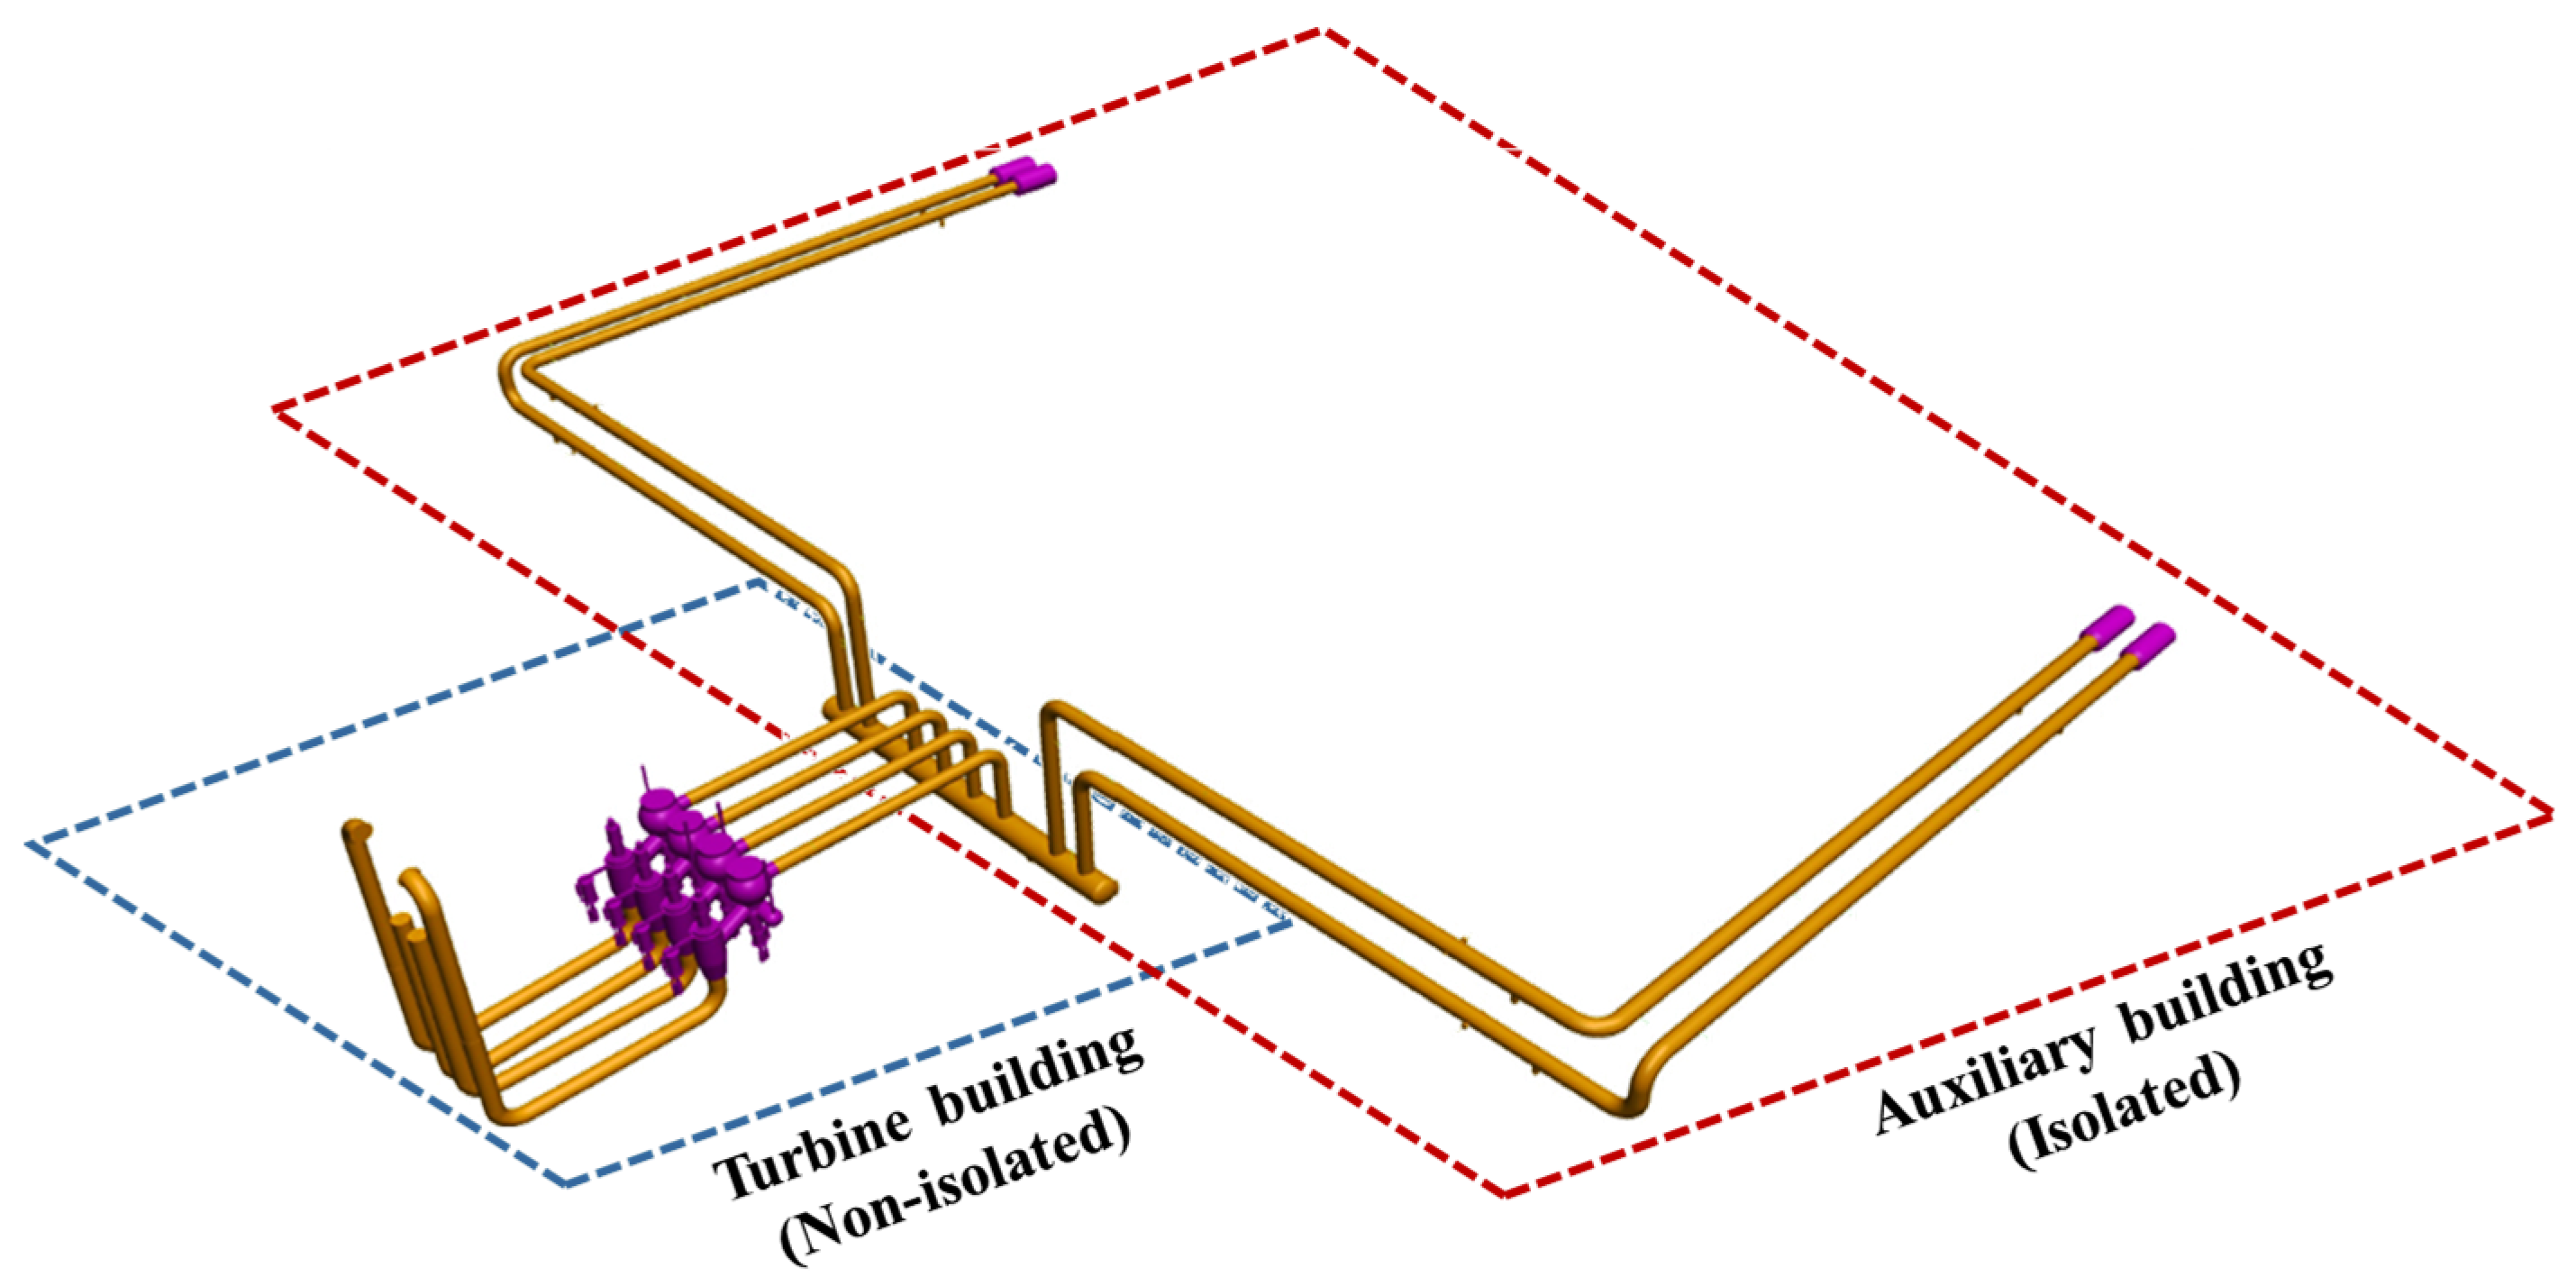
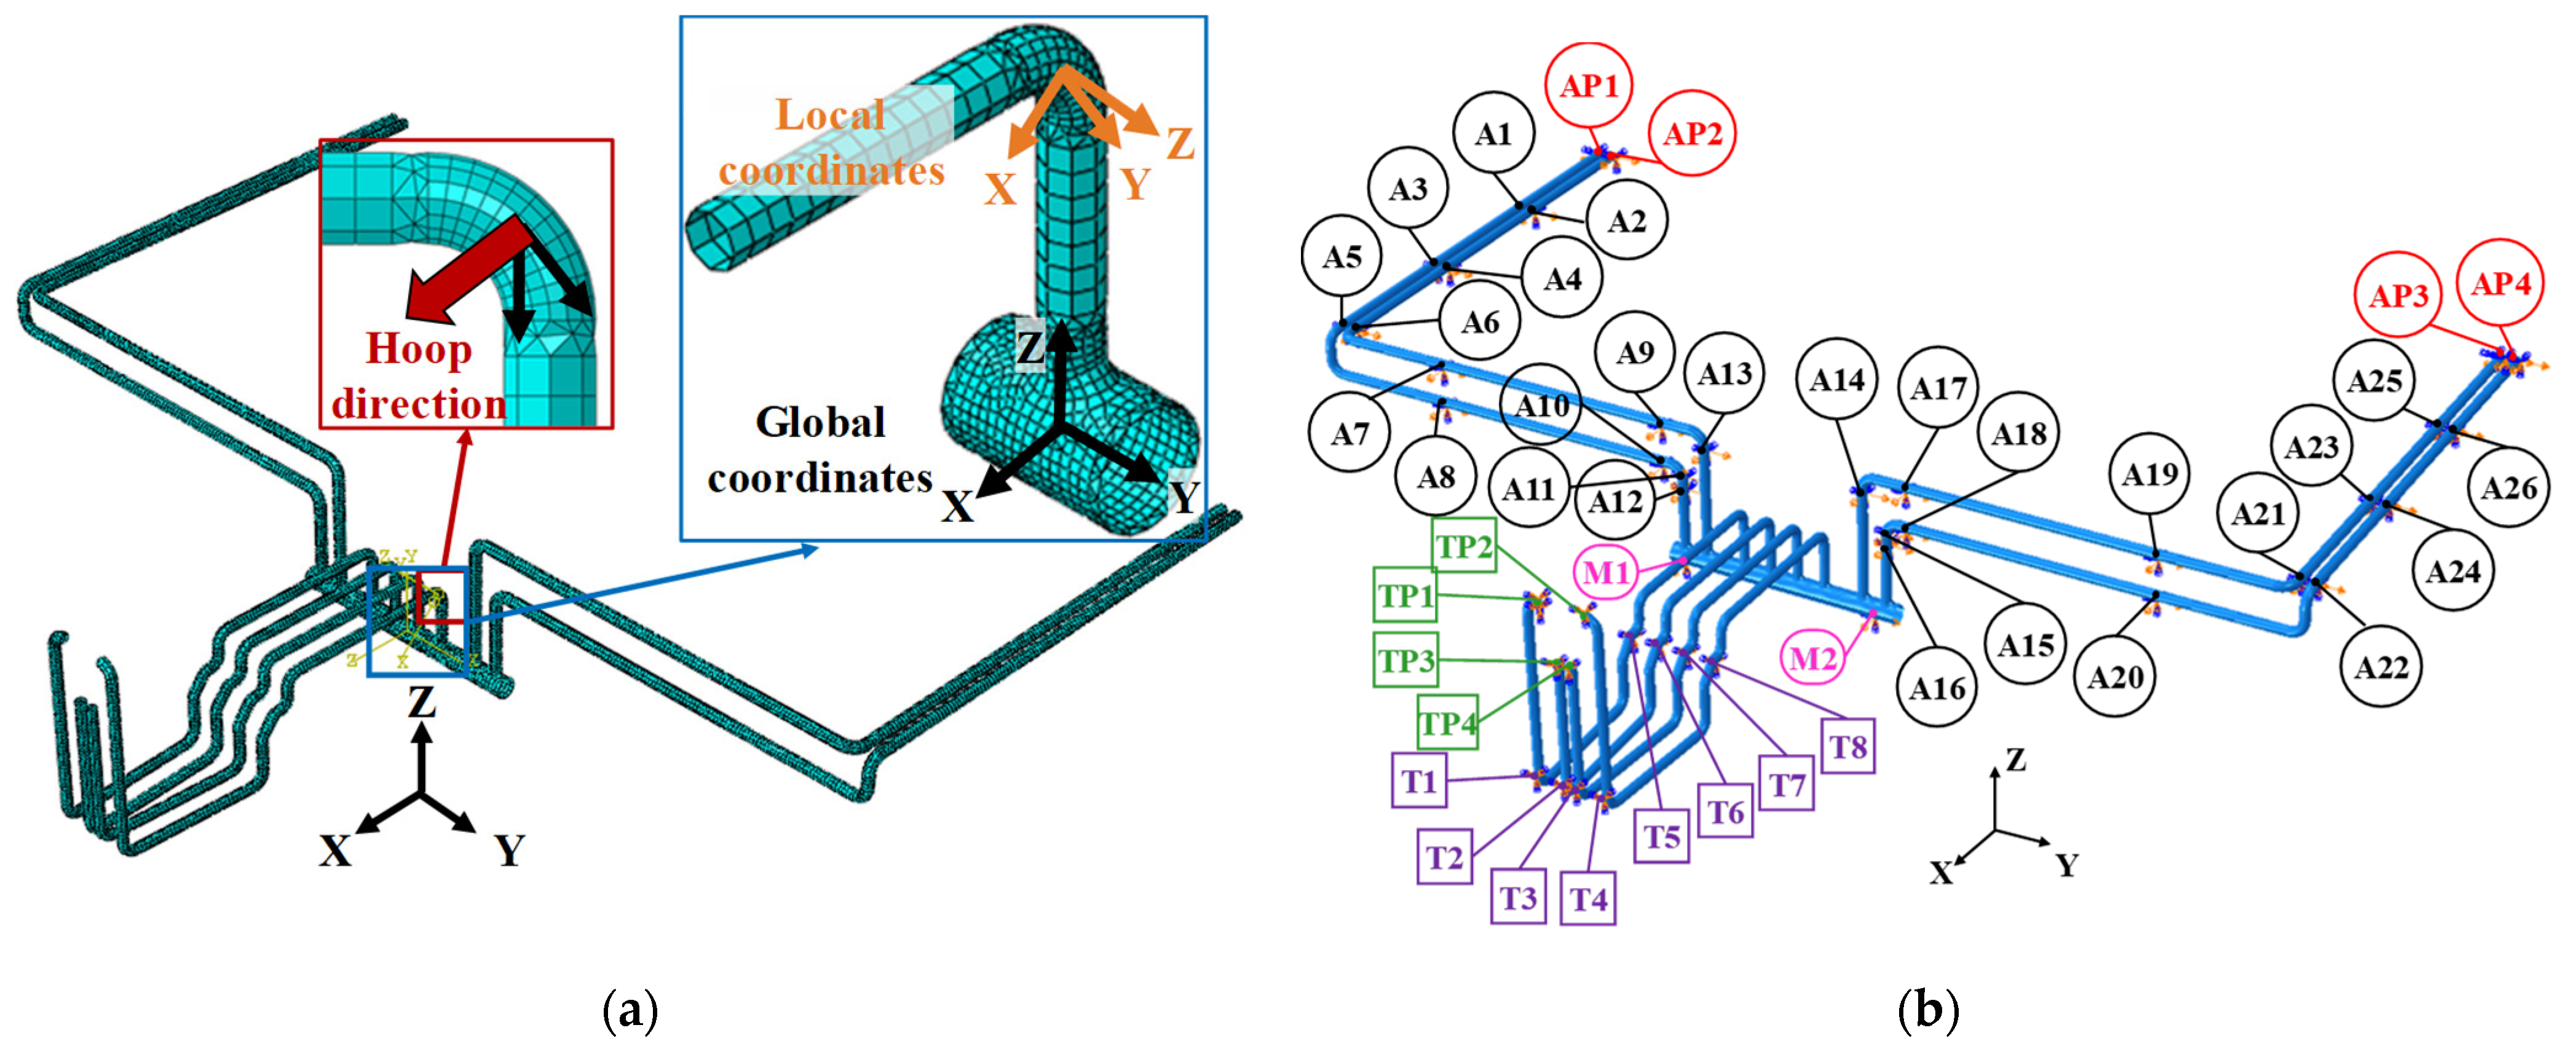
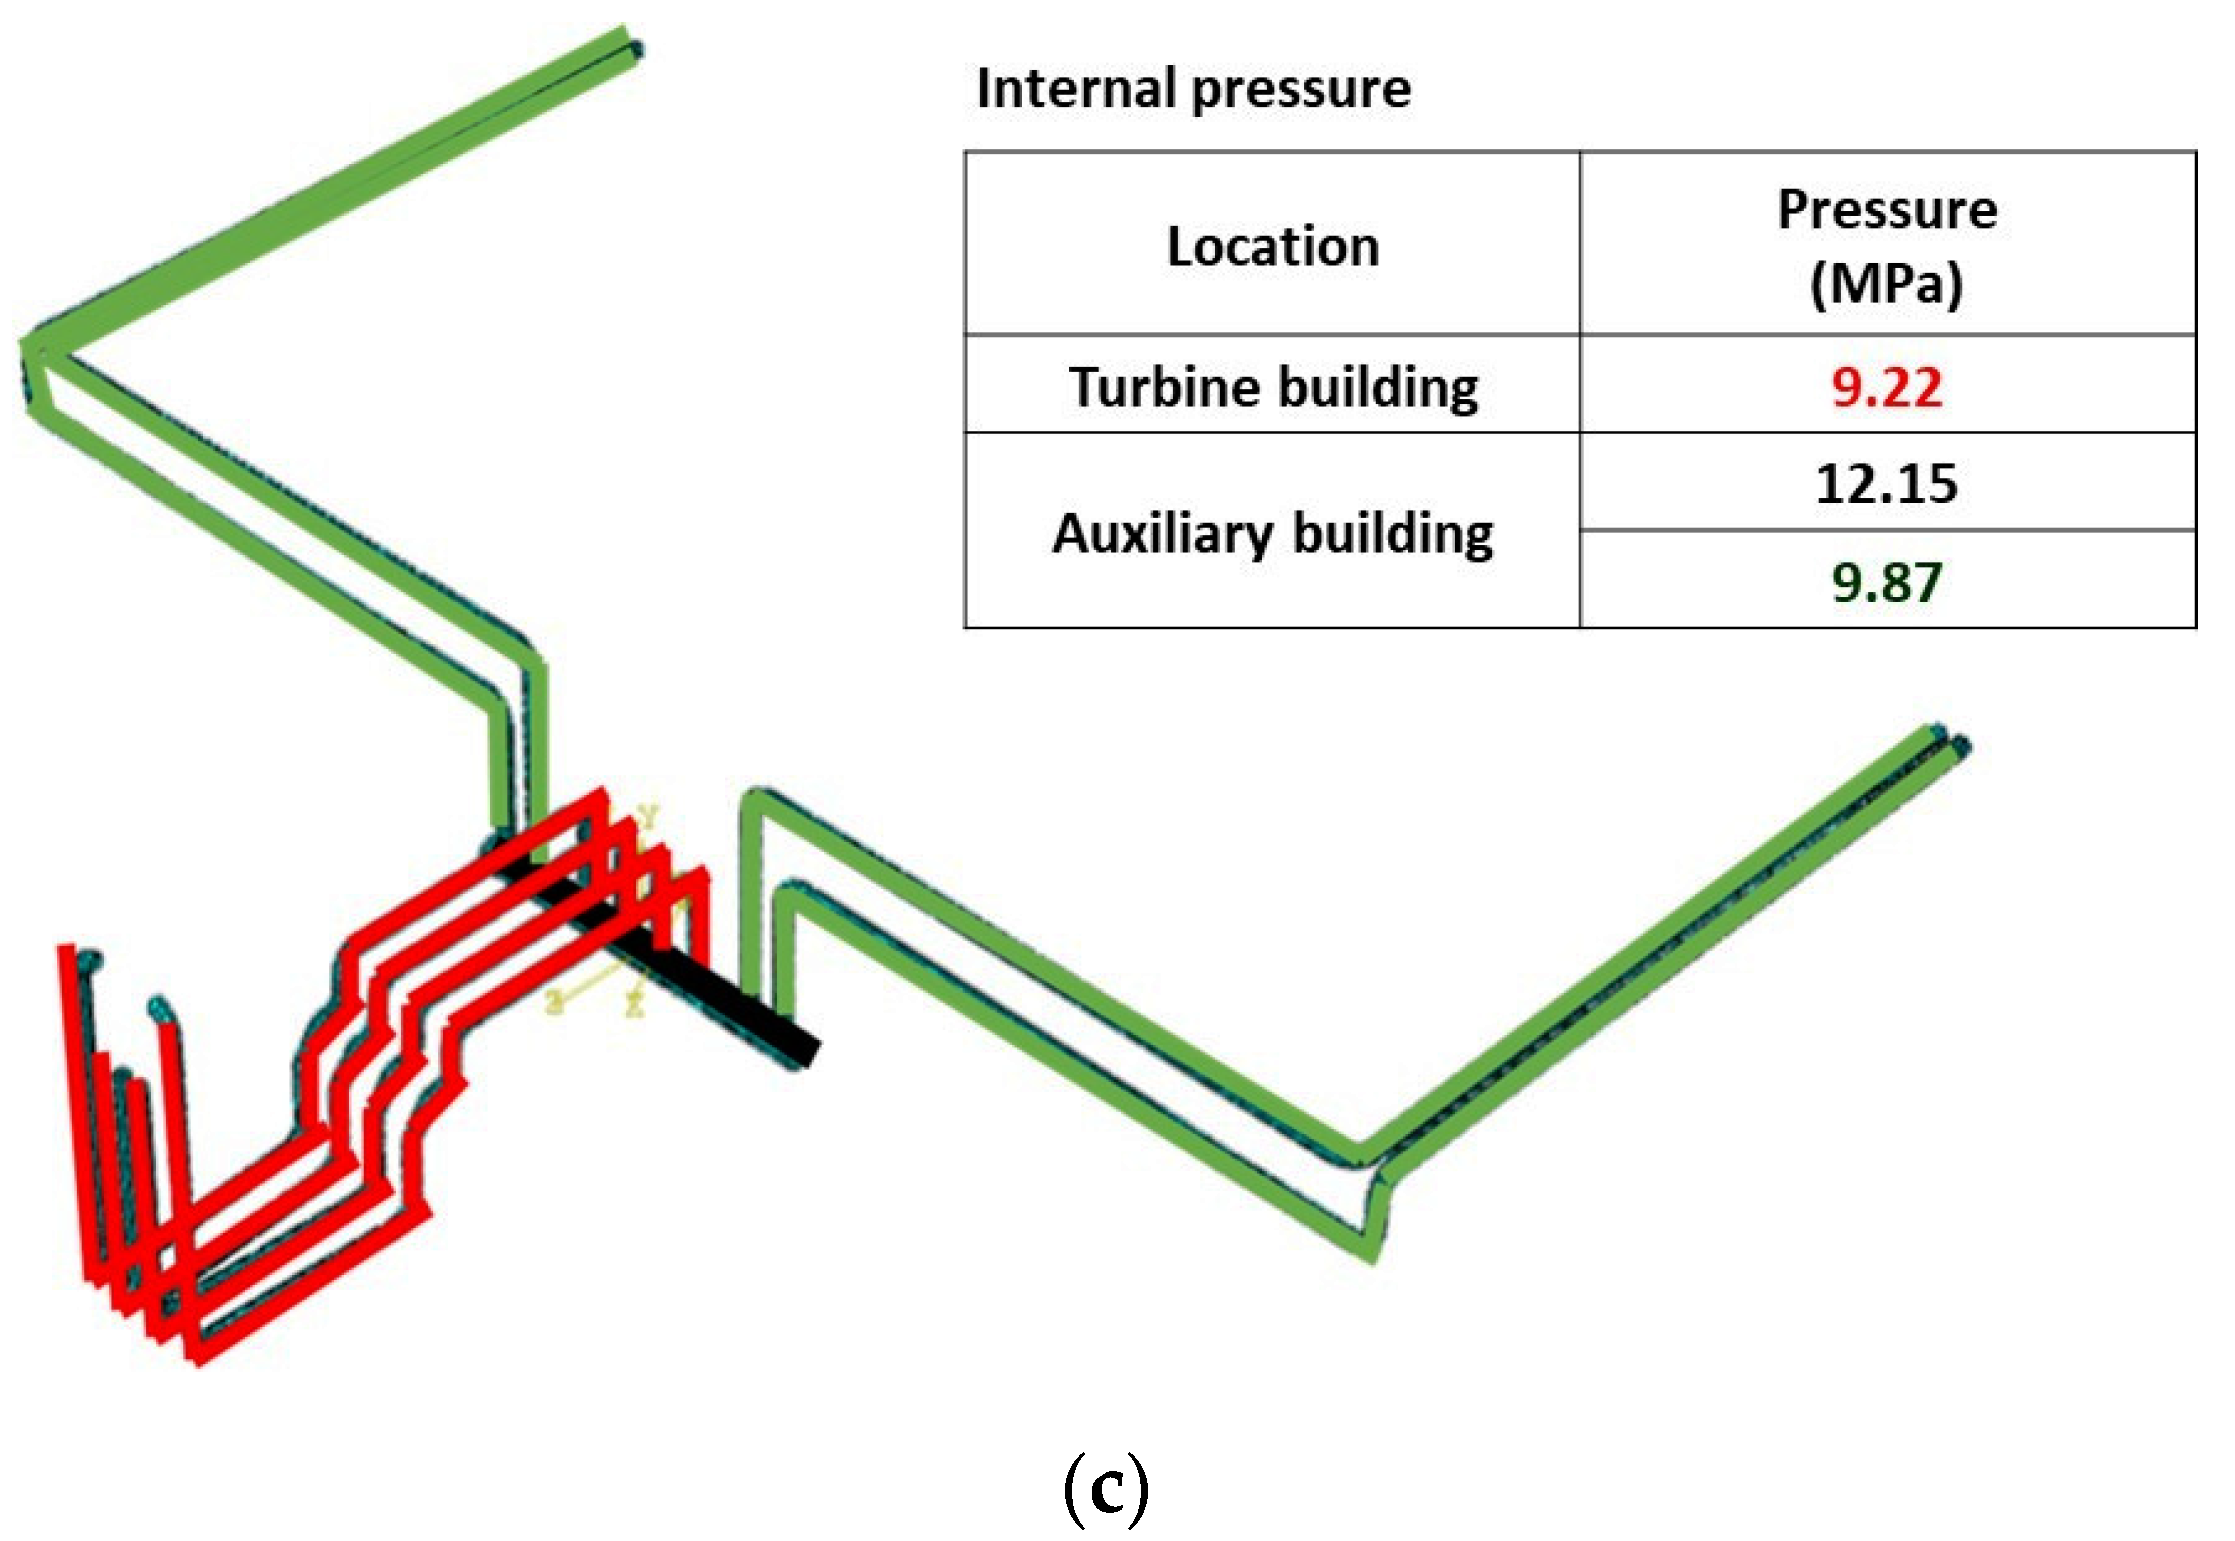
2. Main Steam Piping of Isolated APR1400 NPP

The relative displacement could damage the crossover piping system that connects isolated and nonisolated structures. Therefore, a seismic response analysis of the isolated structure and relative displacement was conducted. The seismic responses of the isolated structure are dominated by isolative behavior. Therefore, an upper structure was simplified to a point-mass with two degrees of freedom in two directions ( x , y ). Seismic response analyses were performed using the Opensees program [11].
The target NPP was APR1400 [12,13], a Korean standard NPP. Figure 1 presents the concept of the APR1400 nuclear power plant with an isolation system. The isolation system was applied to a nuclear island, which is the foundation of the containment and auxiliary buildings. The upper structure, including the nuclear island, weighs 464,500 tons, and its size is 140 m × 103 m [14]. The isolation system was assumed to have bilinear characteristics, as shown in Figure 2, and it was designed with reference to ASCE 7 [15] and FEMA451 [16]. The isolation system had an effective period of 2.5 sec and a damping ratio of 20% for a PGA of 0.5 g as the design levels. Table 1 lists the parameters for the isolation system.
Input earthquakes were modified to satisfy the response spectrum of Reg. Guide 1.60 [17] using the RSPmatch program, with the seismic records provided by the Pacific Earthquake Engineering Research Center (PEER). The input earthquake was composed of 30 sets from EQ1 to EQ30 in horizontal bidirections ( x , y ) and artificial earthquakes were generated in units of 0.5 g from 1.0 g to 3.0 g with the PGA level. The response spectrum is represented by a geometric mean. Hence, the directional uncertainty was applied by referring to ASCE4 [18]. Figure 3 shows a response spectrum for each direction of the generated input earthquake. The time history of the relative displacement between the isolated structure and the ground was derived by performing a seismic response analysis using the Opensees program for the target structure and the input earthquake. The PGA of the Great East Japan Earthquake was approximately 2.75 g, and the maximum ground acceleration measured in Shiogama, Hitachi, and Sendai also exceeded 1.53 g [19].
In this study, the crossover piping system is the main steam piping with multiple supported and arranged by an auxiliary building on the isolated APR1400 NPP nuclear island and a turbine building, which is a nonisolated structure. A finite element model of the piping system was modeled using ABAQUS 6.14. Figure 4 and Table 2 present the main steam piping and its specifications, respectively.
The material was assumed to be carbon steel SA106 and Grade B [20] of ASME B36.10M, which are commonly used in NPPs. The nonlinear material properties were derived from the material tensile test and defined as a bilinear type, as shown in Figure 5 and Table 3 [21].
The finite element model of the piping using the beam element can simulate the test result well [22]. On the other hand, it is difficult to consider the activation of pipes caused by an excessive external force. Therefore, the finite element model of connection pipes was modeled using the shell element (S4R) of ABAQUS 6.14 to consider the effect of the elliptical deformation of pipes. Figure 6 shows a finite element model of the main steam piping. The total number of elements used is 17,168, and the number of nodes used is 17,052.
The finite element model of the pipe system is shown in Figure 6a. The boundary conditions were assumed, as shown in Table 4 and Figure 6b. The internal pressure of the pipe was calculated using Equation (1) [23]. The design temperature of the APR 1400 main steam piping was 299 °C [24], and the σ d e s i g n of Equation (1) was 115.9 MPa [25]. This was the same for SA-106 Gr.b pipe when the design temperature was 371 °C or less. Therefore, the internal pressure was calculated using Equation (1), as shown in Figure 6c. In Equation (1), I P is internal design pressure; t , d and σ d e s i g n are the thickness, internal diameter, and design stress of the tube, respectively.
t = I P d σ d e s i g n 0.5 I P
Table 5 and Figure 7 present the main mode and mode shapes of the main steam piping of the finite element model.

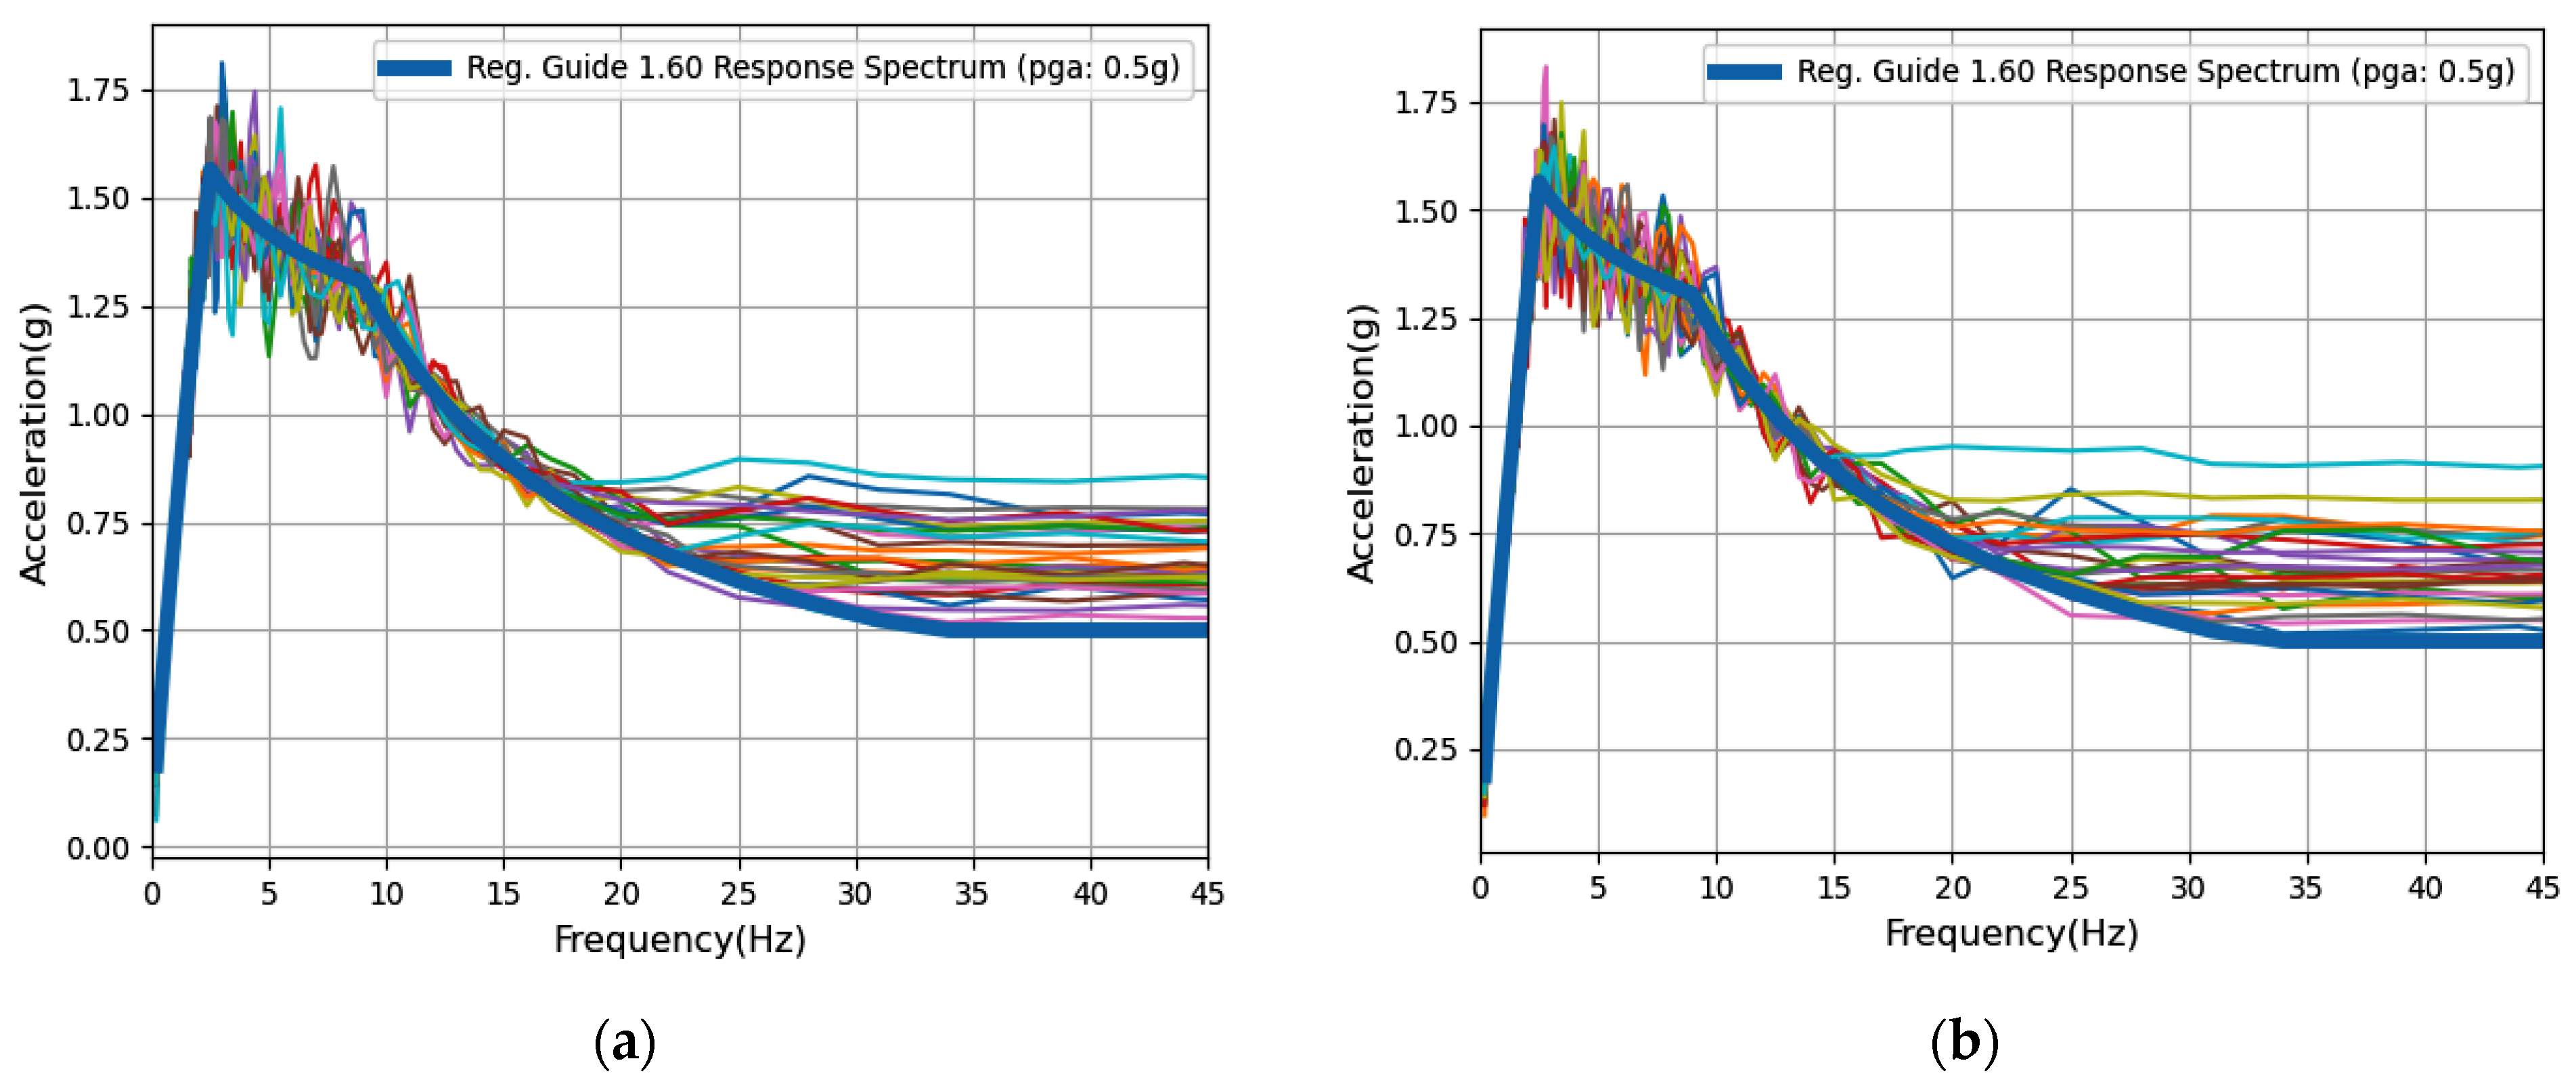
3. Results of Seismic Response Analysis

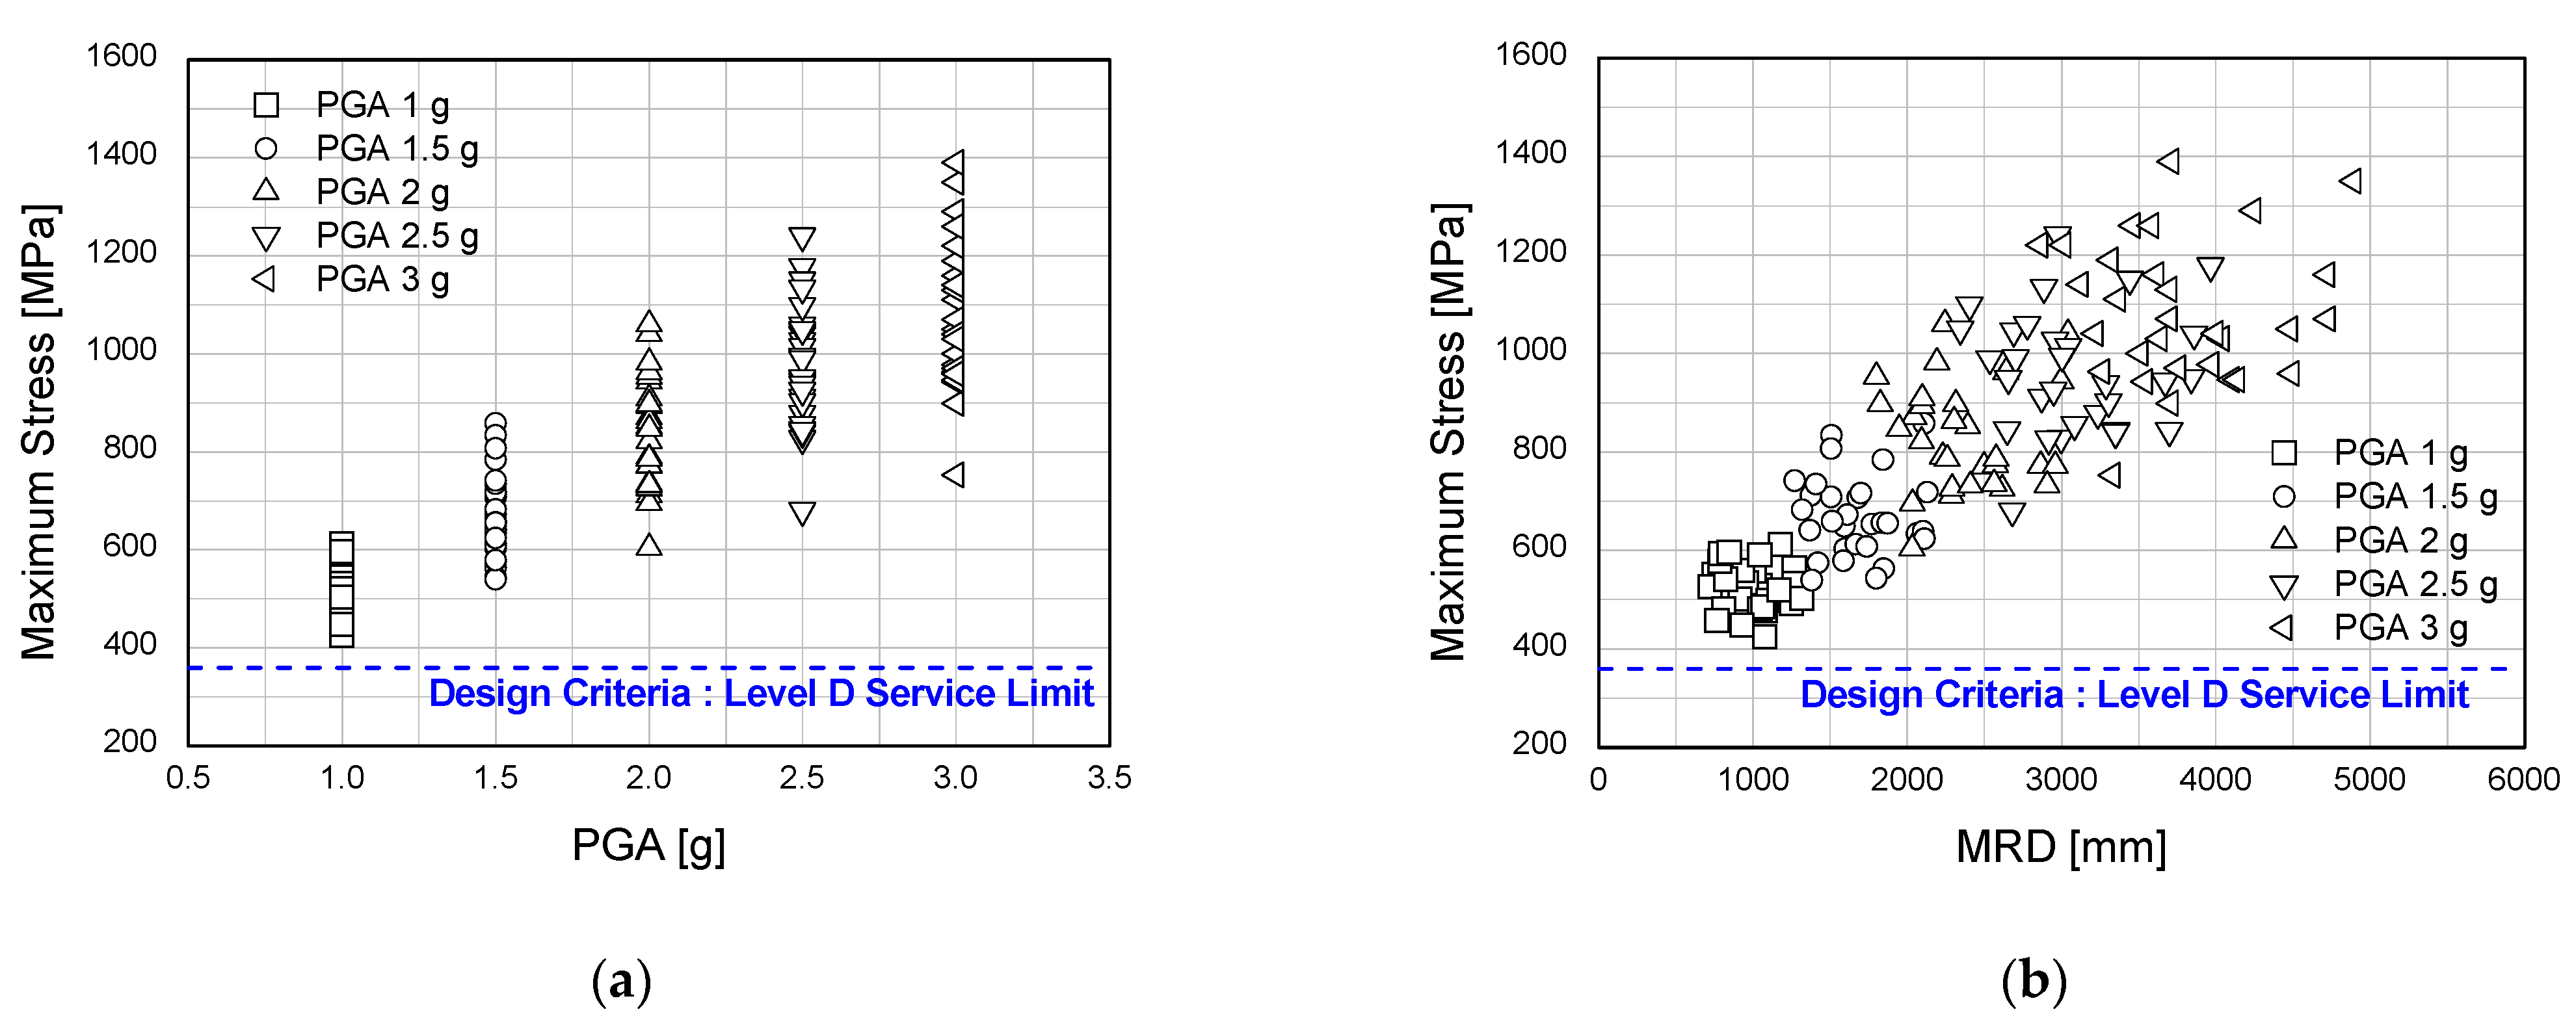
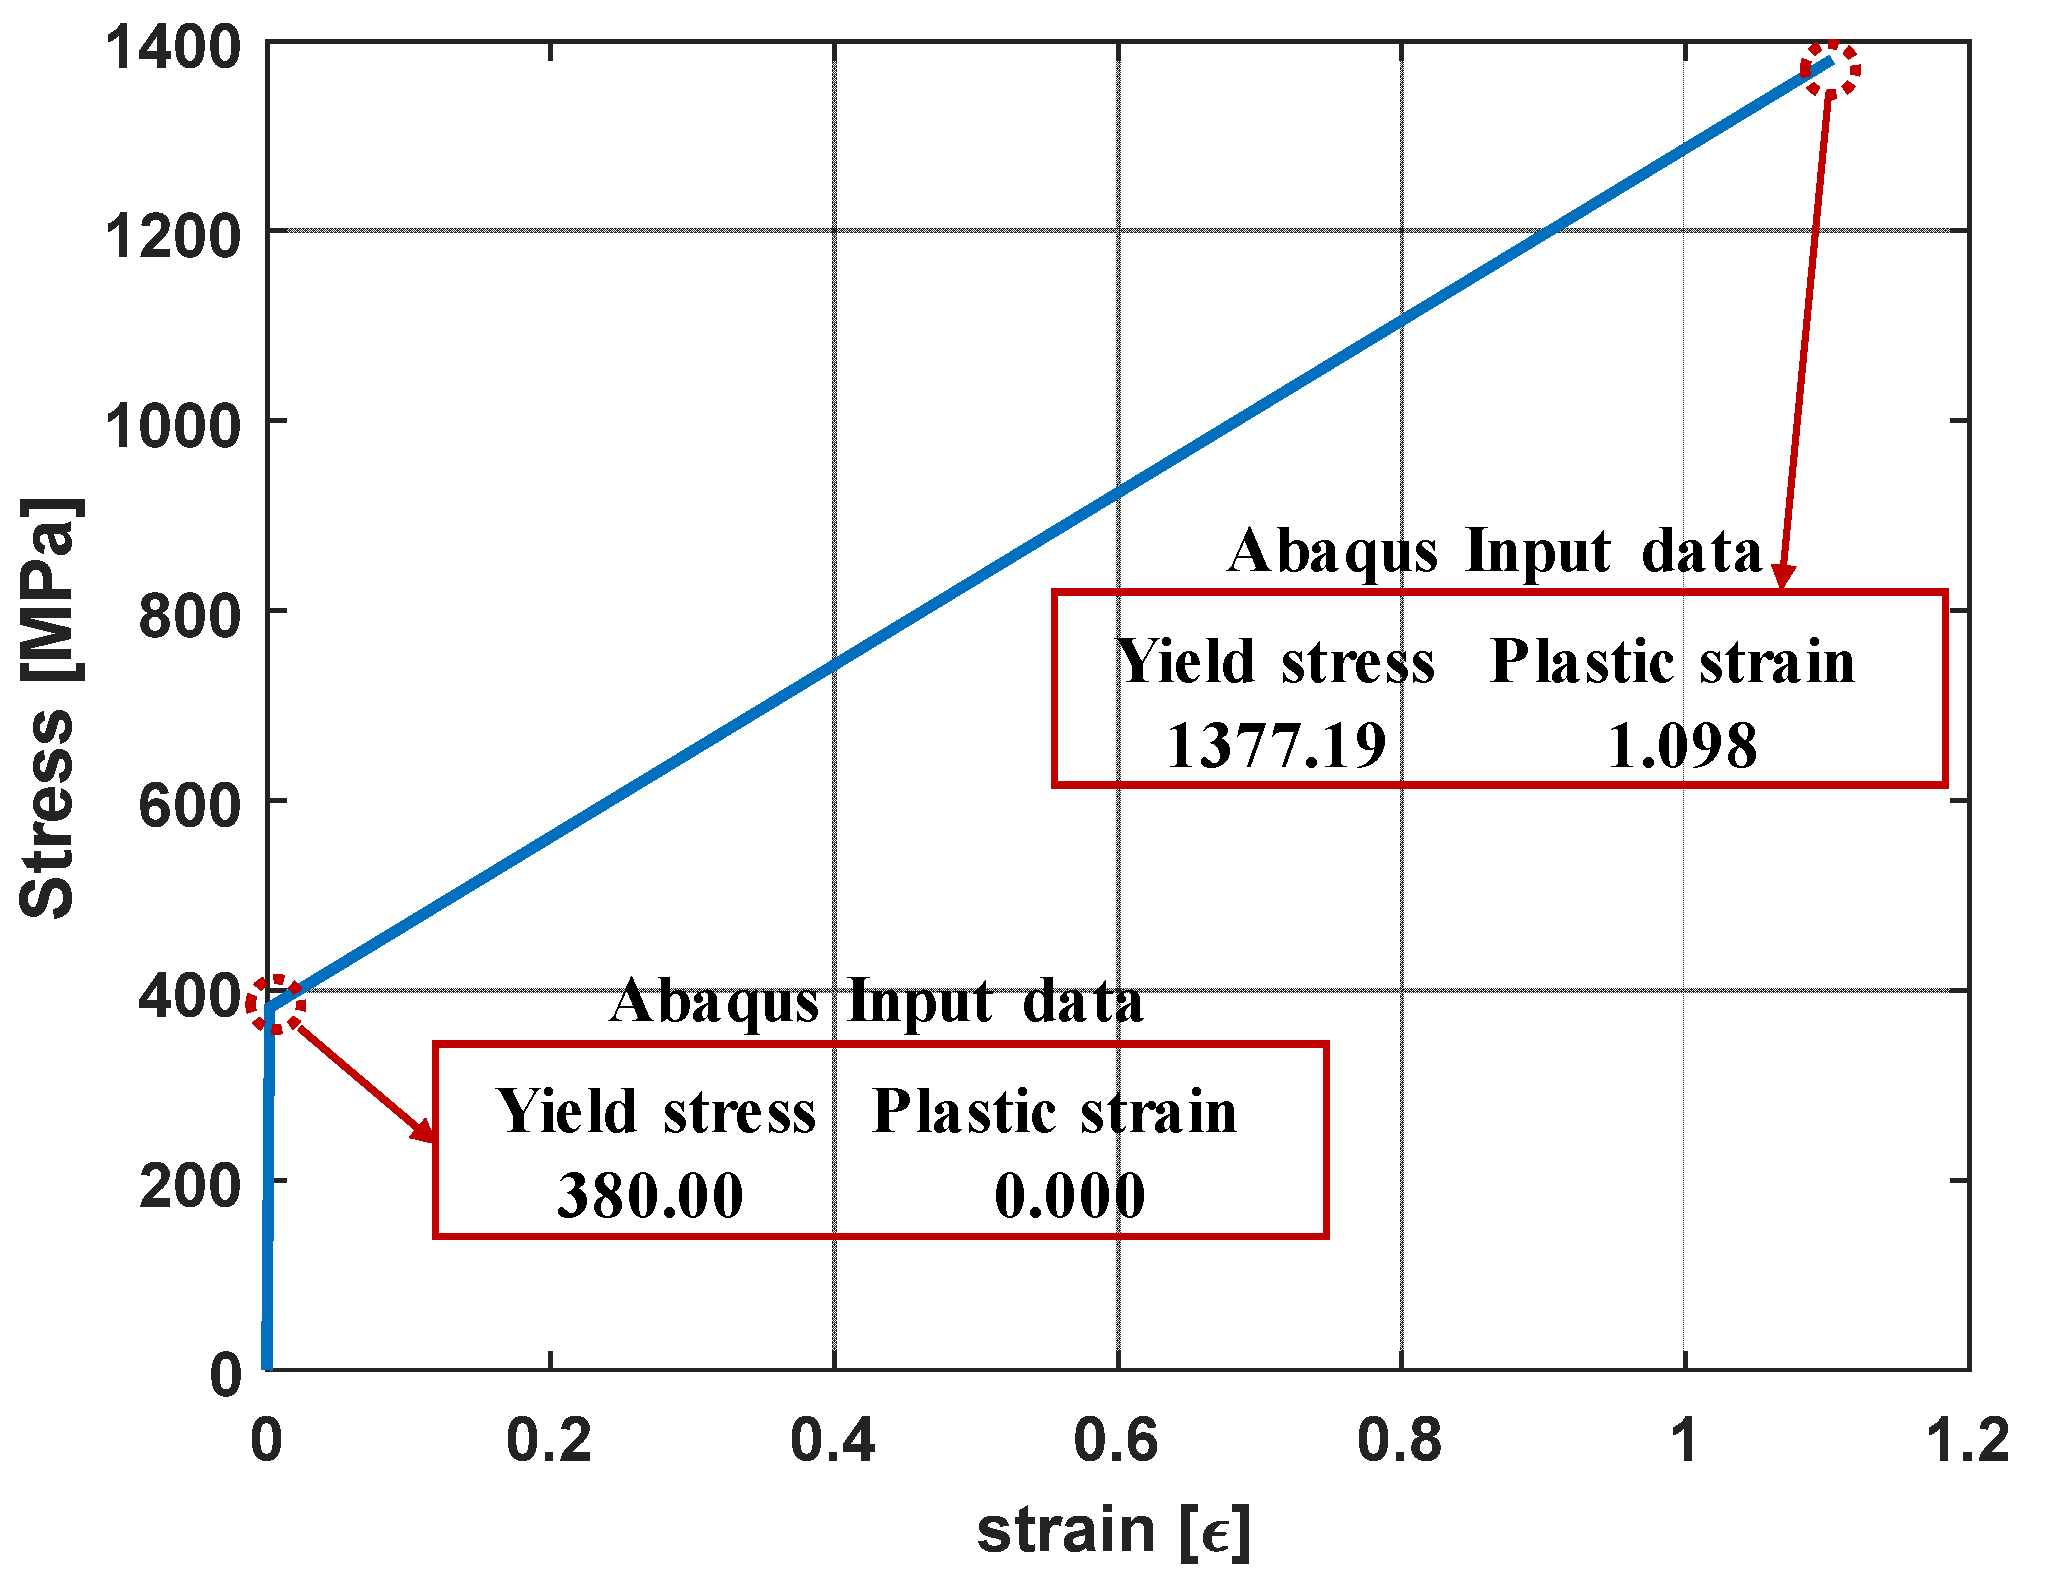
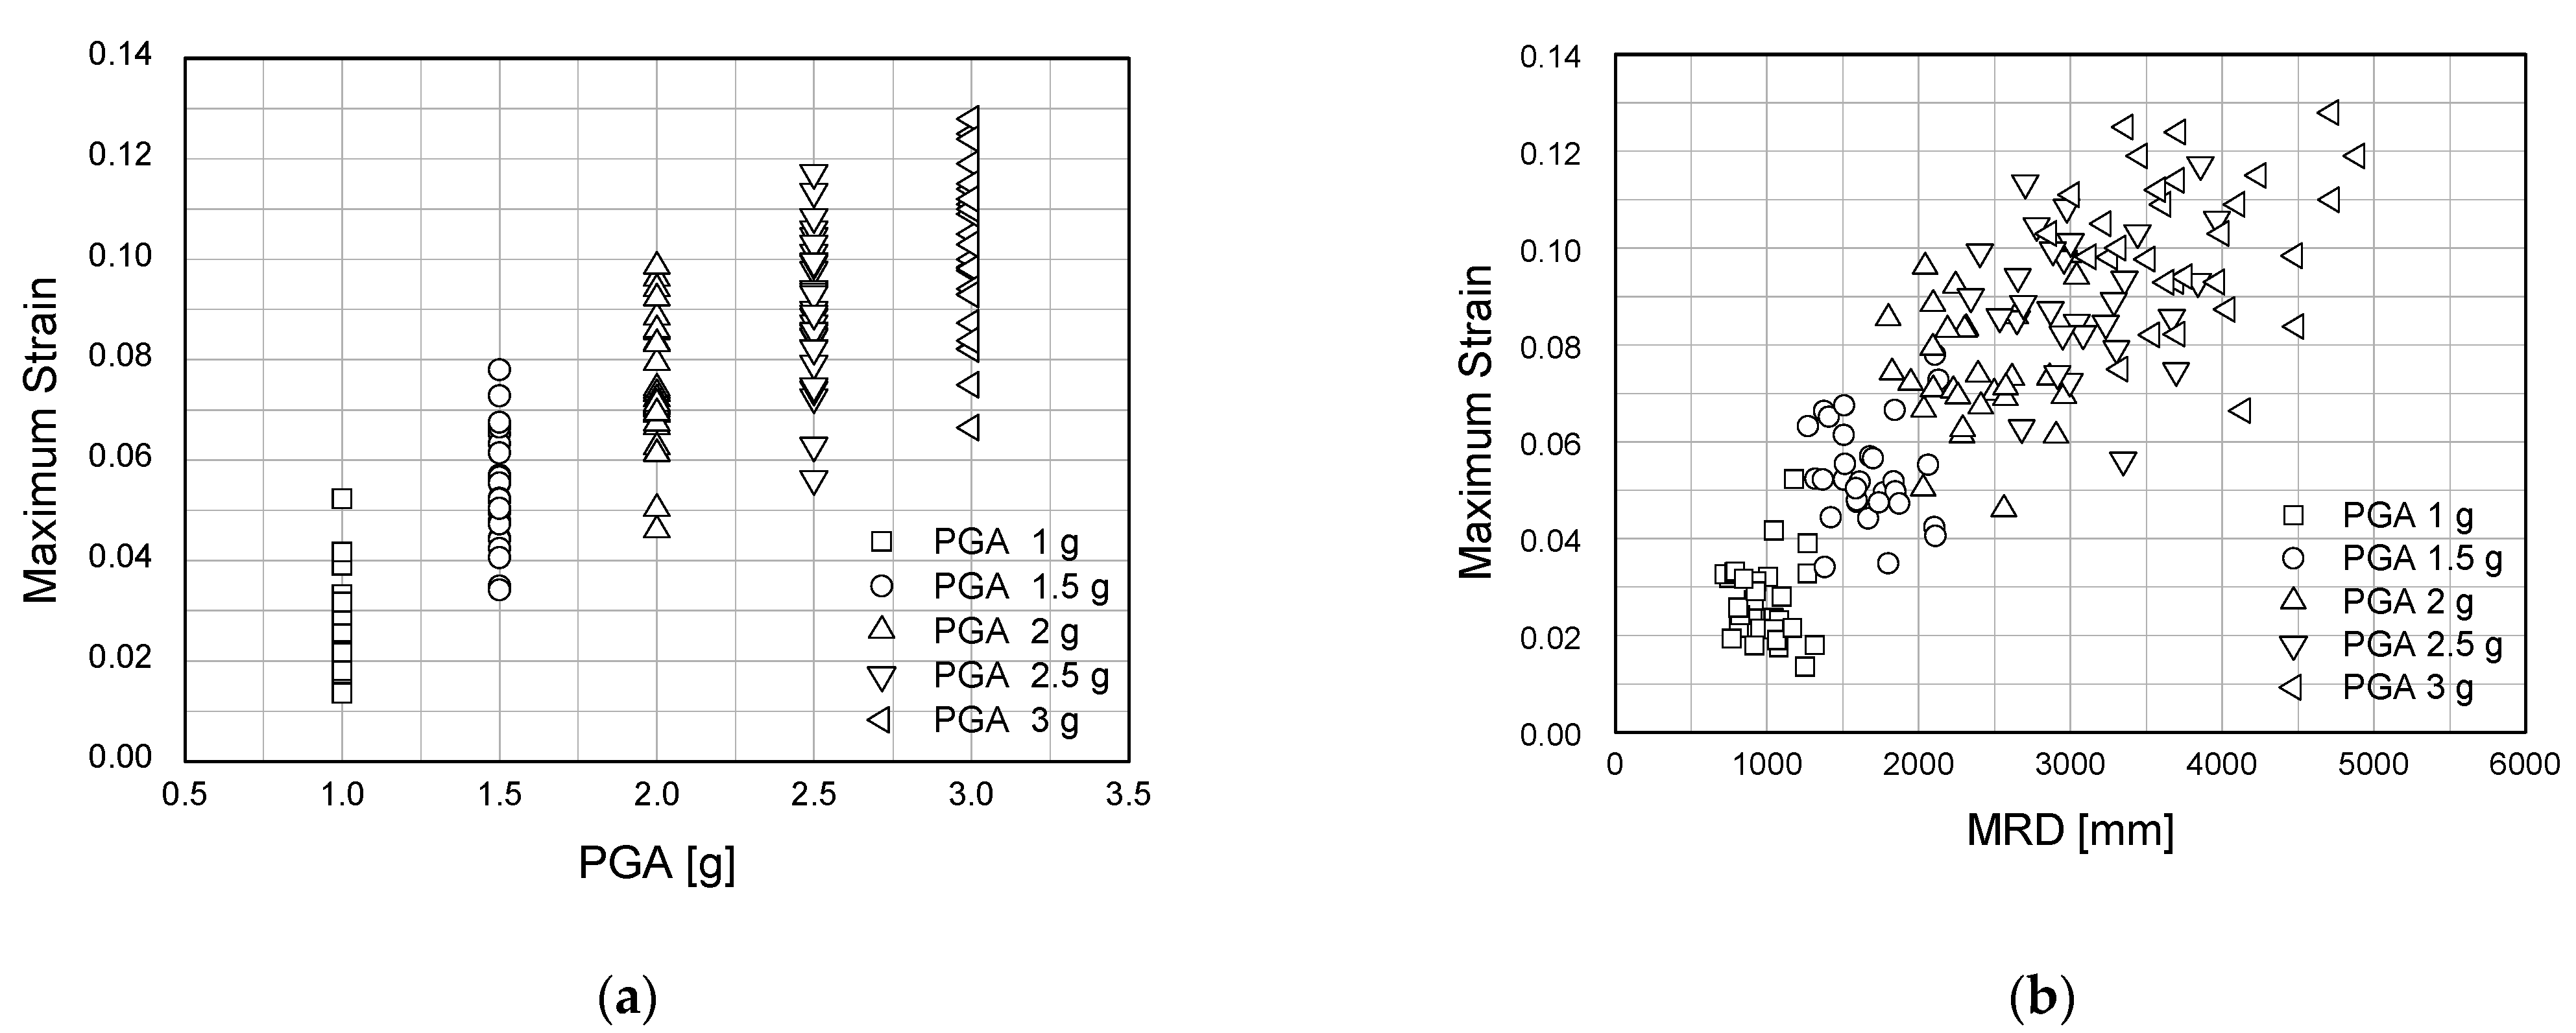
3.1. Maximum Stress and Strain
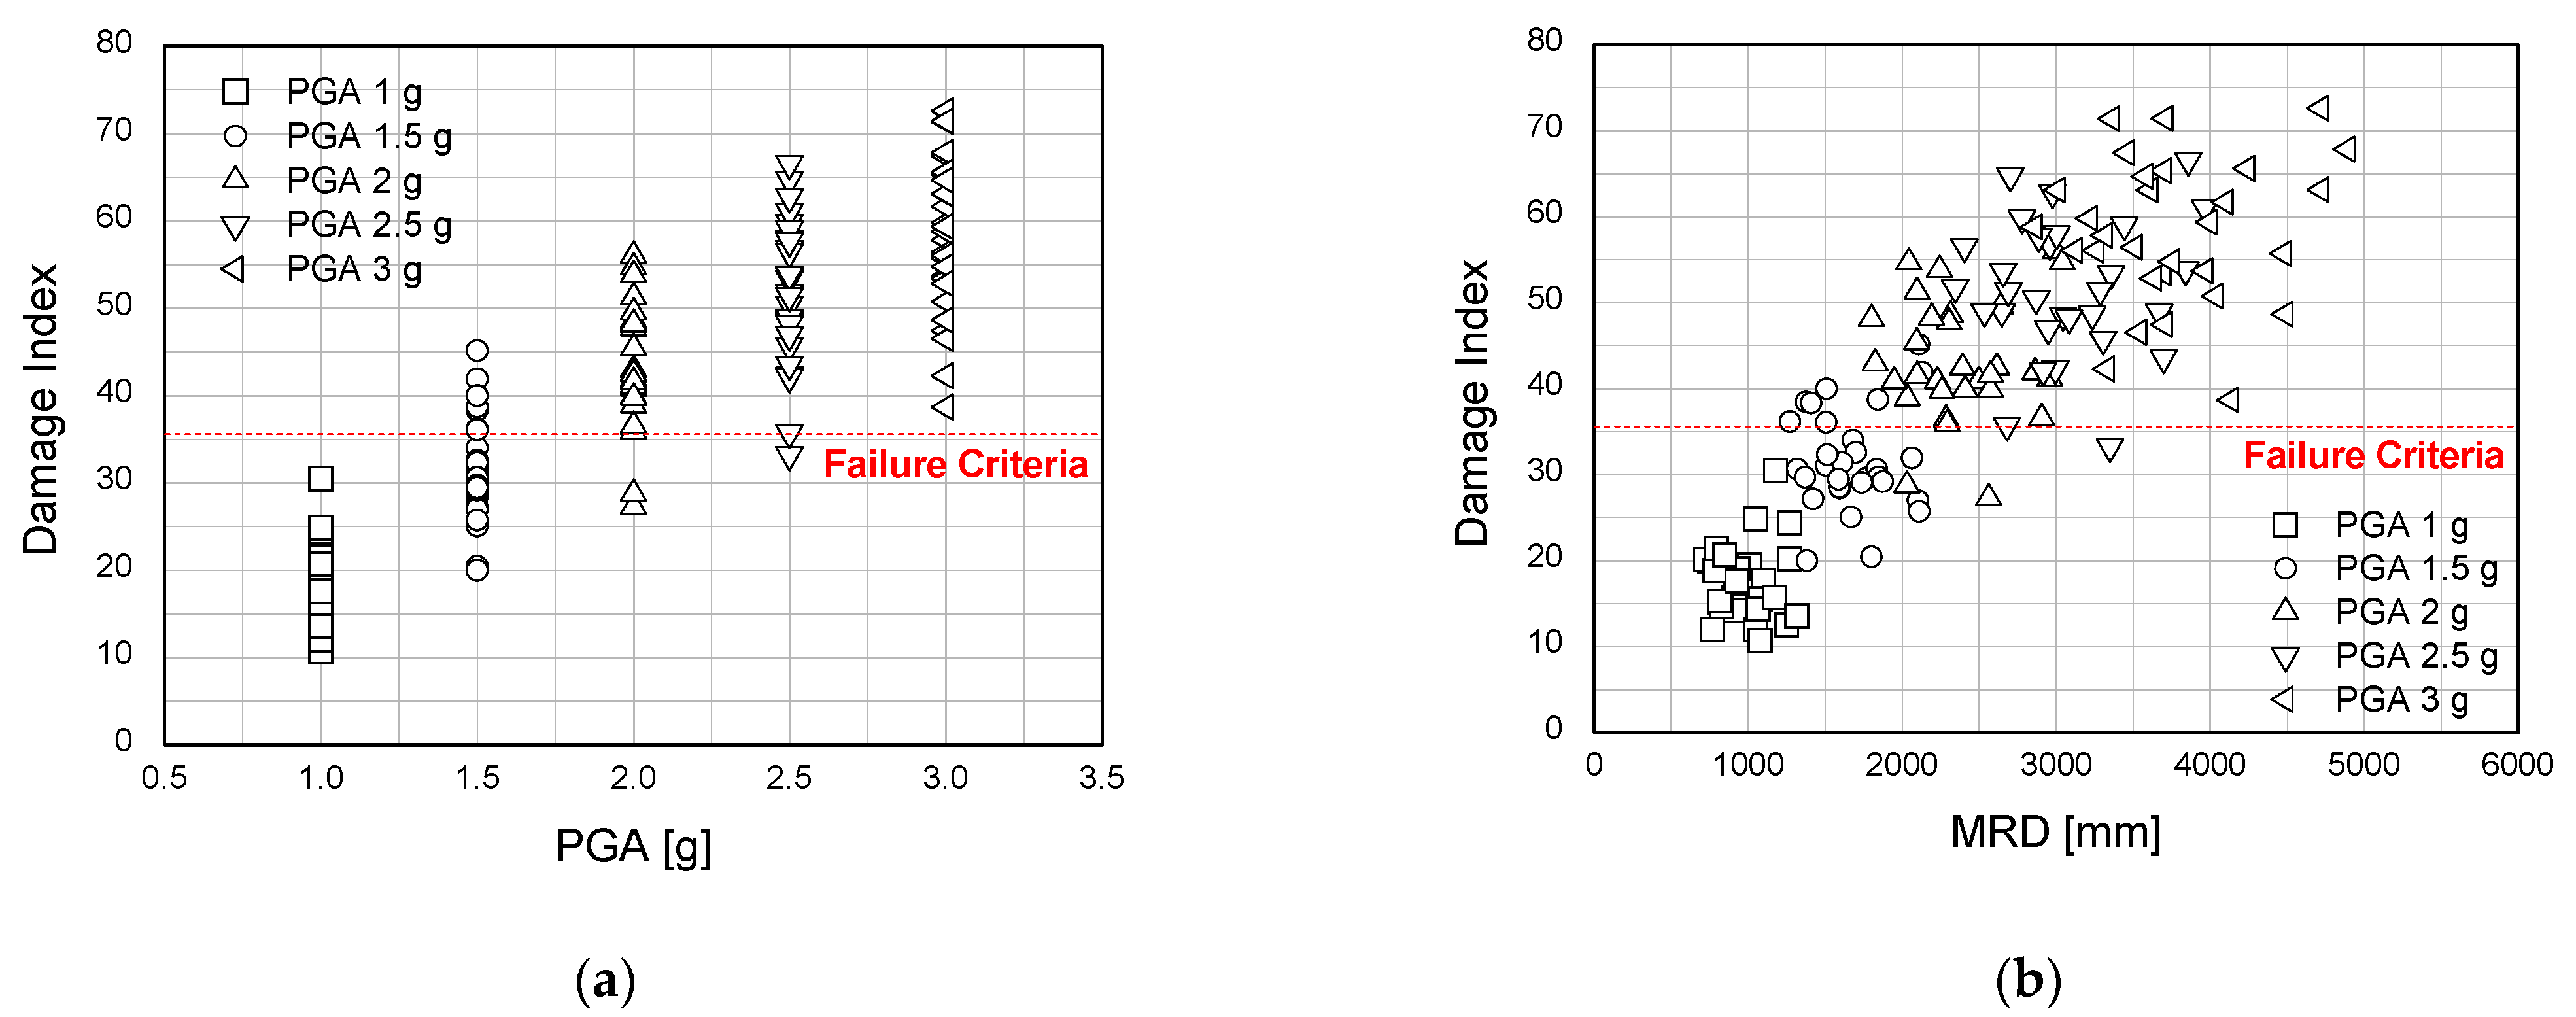
Nonlinear seismic response analysis was performed using the direct integration method while applying pressure inside the piping system and maintaining the stress caused by the internal pressure. Considering the reliability and convergence of the analysis, the input earthquake was used as the input displacement, and the stress and strain in the circumferential direction were obtained from the elbow crown, which is shown in Figure 6a. The input ground motion was considered for the horizontal bidirection. Table 6 lists the maximum relative displacement and MRD in each axial direction for the PGA size of the input ground motion. Here, MRD is the maximum value among the maximum relative displacement of the y - and x -directions. The MRD is at least 723 mm and a maximum of 1316 mm when the size of the PGA of the input earthquake is 1.0 g. Kim et al. [26] reported that the limit displacement under 2D horizontal input motion was 1120 mm for the lead rubber bearing (LRB) of the NPPs with an external diameter of 1520 mm; the total height of the rubber was 224 mm. Therefore, damage can occur when the size of the PGA is 1 g if the isolation system applied to the nuclear power plant is the LRB. In addition, damage to the isolation system was not included in the damage to the piping system. The nonlinear seismic response analysis showed that the elbow located at the boundary between seismic isolation and nonisolated structures was the most fatal factor, as shown in Figure 6. Therefore, Figure 8 and Figure 9 show the maximum stress and strain obtained from the elbow in Figure 6, respectively. Here, the seismic intensity is defined by the PGA and MRD.
Figure 8 and Figure 9 show the maximum strain rate and stress, respectively. The average value of the maximum strain is 0.02696 when the PGA of the input ground motions is 1 g. The minimum and maximum values are 0.0135 and 0.0523, respectively. The average, minimum, and maximum stresses are 522.8 MPa, 424.6 MPa, and 612.29 MPa, respectively. The allowable stress was approximately 118 MPa at the design temperature of 343 °C or less in the ASME Boiler and Pressure Vessel Code [23], and the level D service limit was approximately 354 MPa because it is less than three times the allowable stress [25]. Therefore, in the case of earthquakes of 1 g or more, all input earthquakes exceeded the level D service limit, which is the design standard based on allowable stress. As shown in Table 7, a larger PGA indicates a greater standard deviation of the maximum strain and maximum stress.

3.2. Damage Index

The actual damage to the pipe observed by the test is leakage-through cracks. Therefore, in this paper, leakage-through cracks, which can cause severe damage, such as loss of function of pipes and radiation leakage, were defined as failures. In general, damage to pipe elements under repeated dynamic loading, such as a seismic load, is fatigue failure [27,28]. In the case of pipes connecting the isolated structure and the general structure, large relative displacement can occur, even with a small number of repeated loadings, leading to failure. Therefore, low cycle fatigue should be considered a failure by the seismic load of the crossover piping system. The leakage-through cracks of pipes due to low cycle fatigue can be quantified using the damage index of Banon based on the relationship of stress-strain in Equation (2). The average damage index for the leakage-through crack of a three-inch SA106 SCH40 90° elbow was 35.25. Therefore, in this study, the 35.25 damage index was used as a failure criterion for the seismic fragility analysis of the main steam piping. In Equation (2), σ y and ε y are the yield stress and yield strain, respectively; ε i and E i are the strain and dissipation energy of the i t h cycle, respectively; c and d are the constants with corresponding values of 3.5 and 0.3 [9].
D = ( m a x ( ε i ε y 1 ) ) 2 + ( i = 1 N c ( 2 E i σ y ε y ) d ) 2  
Figure 10 and Table 8 show the damage index calculated using Equation (2) from finite element analysis. In Figure 10a, when the PGA is 1.5 g or more, the average damage index was 31.61, and the median value was 30.62. The minimum and maximum values were 20.00 and 45.12, respectively. Therefore, if the size of the PGA in the input ground motion is more than 1.5 g, it can cause serious damage, such as radiation leakage. In addition, all damage indices exceeded the failure criteria when they were 3.0 g or more. In Figure 9, the maximum stress responses of the seismic response analysis exceeded all of the design criteria, Level D service limit, when the PGA of the input ground motion was 1 g. Therefore, there is a large difference between the design criteria of the pipe and the actual failure subjected to a seismic load.
As shown in Figure 10a, when the PGA is set to the seismic intensity, 30 responses were obtained at each PGA level. A higher PGA means a greater standard deviation between the response and damage index (Table 8). This is similar to the case of maximum stress and maximum strain. Artificial earthquakes for seismic safety evaluation are mostly prepared based on acceleration. Therefore, most displacements from artificial earthquakes with the same PGA size are different. In particular, as shown in this study, the sizes of the relative displacement of isolated structures and nonisolated structures were determined by the characteristics of the isolation system by applying it to the lower part of the structure were greatly different. Therefore, when MRD is used as the seismic intensity, the maximum response is dispersed according to the size of MRD of each input ground motion, as shown in Figure 10b. A larger PGA indicates a broader distribution of the MRD and a higher damage index. In particular, even if the size of the PGA is small, the size of the MRD and the value of the damage index may be larger.
To design an isolation system for NPP, it is necessary to calculate the probability of failure of the crossover piping system. The seismic fragility curve of the crossover piping system should consider MRD, the one-way maximum relative displacement acting on the isolation system. The fragility curve of pipes with the PGA as the seismic intensity could not propose acceptable displacement and the probability of failure for the design of the isolation system. On the other hand, for the probabilistic safety assessment (PSA) of nuclear power plants, it is necessary to perform seismic fragility analysis according to the PGA. Therefore, this paper prepared seismic fragility curves for the main steam piping of an isolated APR1400 NPP with the PGA and MRD as the seismic intensity. The probability of failure was 5% when the PGA was 1.25 g or the MRD was 1156 mm, and 50% when the PGA was 1.65 g and the MRD was 1800 mm.

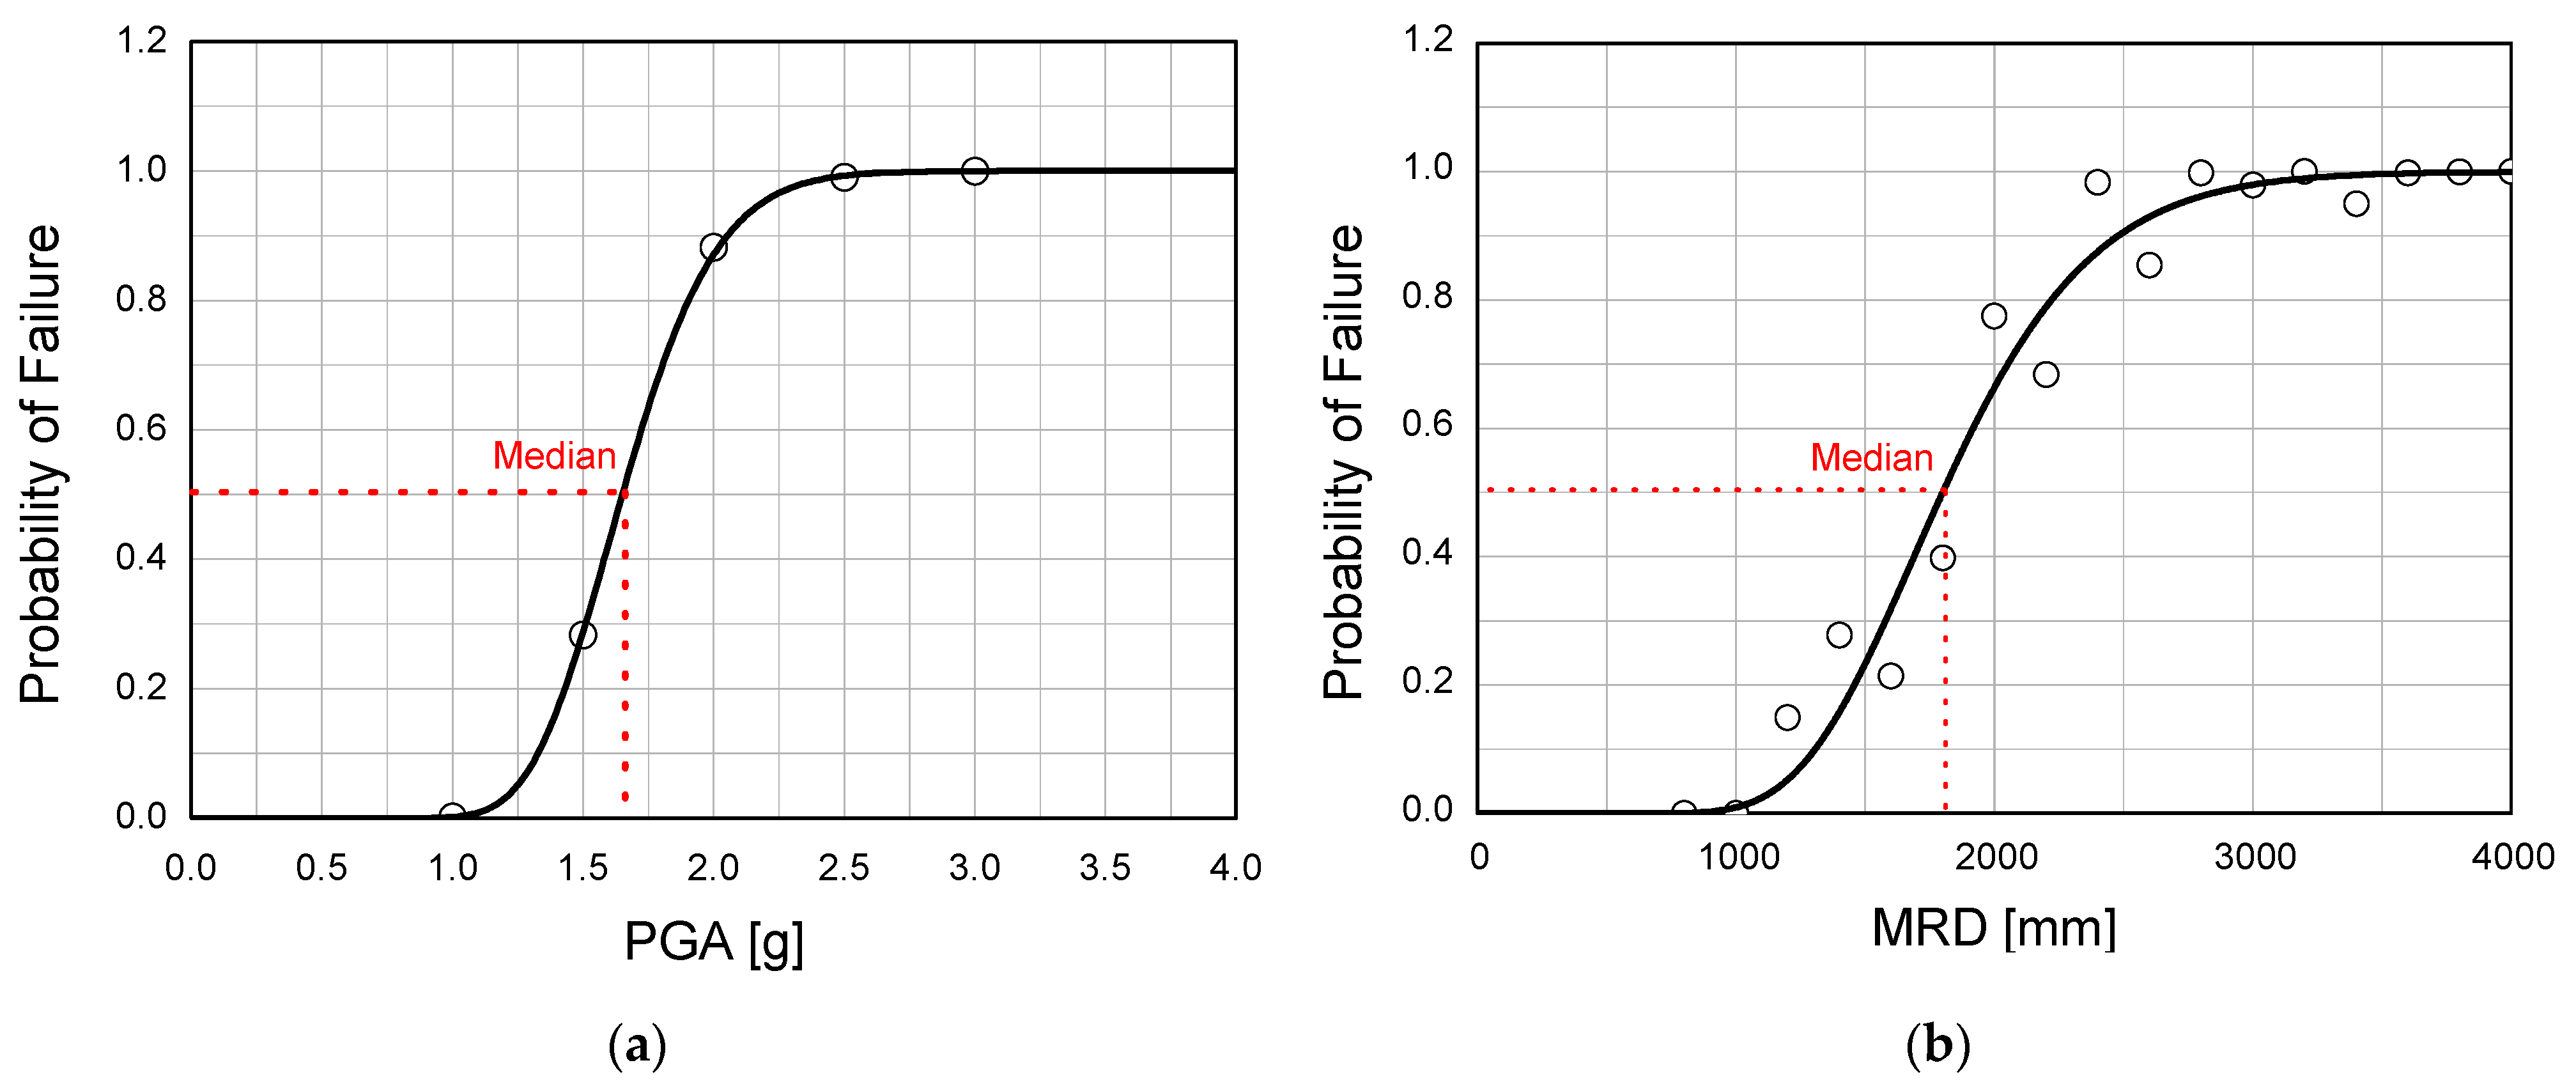
4. Seismic Fragility Analysis

The seismic fragility curve is in the form of a lognormal distribution function [29]. The median value and the logarithmic standard deviation are two important variables in the seismic fragility comprising the bivariate lognormal distribution. In general, the probability of failure of a structure is defined when an arbitrary seismic load a is applied, as shown in Equation (3). In Equation (3), p R is the probability density function of the response, and p C is the probability density function of the internal force.
P f ( a ) = 0 p R ( a ,   x R ) [ 0 x R p C ( x ) d x ] d x R
Equation (3) can be expressed as Equation (4), considering the internal force and uncertainty in response. Here, C m is the median internal force; R m is the median structural response; Φ ( · ) is the cumulative probability distribution of the standard normal distribution function; β C is the logarithmic standard deviation of the compound probability variable.
P f ( a ) = 1 Φ [ l n C m l n R m ( a ) β C ]  
β C in Equation (4), can be expressed as the square root of the sum of squares of the logarithmic standard deviation β R of the probability variable considering randomness and the algebraic standard deviation β R , which means uncertainty, as shown in Equation (5).
β C = β R 2 + β U 2
In this paper, 0.033 was used as the logarithmic standard deviation β U of the damage index obtained from the element test and finite element analysis of a carbon steel plate elbow conducted in a previous study [9]. The logarithmic standard deviation β R of randomness is the randomness of the response induced by the results of nonlinear seismic response analysis. The input ground motion showed less variability because the seismic wave suitable for the design response spectrum was input. It would be reasonable to use the seismic wave suitable for the design response spectrum to review the structure’s performance. In addition, the coefficient of variation was applied with the logarithmic standard deviation because it was assumed that the distribution of responses follows the lognormal distribution. A seismic fragility curve was prepared using the failure probability calculated using Equation (3), as shown in Figure 11.
Figure 11a is a seismic fragility curve prepared using the PGA as a seismic intensity. The PGA, which has a 5% probability of failure, is 1.25 g, and the median is 1.65 g. It is necessary to consider the probability of pipe damage to the relative displacement when designing an isolation system for an NPP with a pipe connecting the isolated-non isolated section. The relative displacement of the isolation system corresponding to the probability of failure of the pipe was not identified when the PGA was set as seismic intensity, as shown in Figure 11a. When MRD is used as the seismic intensity, the damage index is dispersed, as shown in Figure 10b. Therefore, in this study, the probability of failure was calculated by dividing the size of MRD per 200 mm intervals. Figure 11b shows the fragility curve prepared using MRD as the seismic intensity. The MRD with a 5% probability of failure is 1156 mm, and the median of the seismic fragility curve is 1800 mm. Table 9 lists the probability of failure in Figure 11.

5. Summaries and Conclusions

This paper performed seismic fragility analysis targeting the main steam piping and a crossover piping system of a Korean standard nuclear power plant with an isolation system. The fragility criteria for seismic fragility analysis were defined as leakage-through cracks that can cause serious damage, such as loss of function of pipes and radiation leakage. A nonlinear seismic response analysis was performed by adjusting the acceleration of 30 sets of horizontal bidirectional artificial earthquakes. As a result, the most dangerous component in the crossover piping system is the elbow.
In the case of the main steam piping of an isolated APR1400 NPP, which is assumed to support conditions. When the PGA of the input ground motion is 1 g, the maximum stress response at the crown of the pipe elbow exceeds the Level D service load. However, no leakage-through cracks occur. On the other hand, if the level of the PGA in the input ground motion is more than 1.5 g, it can exceed the damage index for failure, which can cause serious damage, such as radiation leakage. Therefore, for accurate seismic fragility analysis, the damage index for leakage-through cracks, which is an actual failure, was used as the fragility criterion.
Results of nonlinear seismic response analysis showed that a higher PGA level indicated a higher standard deviation of the maximum stress, maximum strain, MRD, and damage index. Since the input ground motion was prepared based on the PGA, when the maximum response values of the nonlinear seismic response analysis are arranged according to each level of the PGA, one set of maximum response values is arranged in the PGA of a specific level. However, when MRD is used as the seismic intensity, the maximum responses are dispersed. Additionally, even if the size of the PGA is small, the size of the MRD and the damage index can be larger. The same trend appears in the case of the damage index.
The seismic fragility curve of the crossover piping system using the PGA and MRD may be a parameter that can be considered when designing an isolation system. In this paper, seismic fragility analysis was performed using the seismic intensity of PGA and MRD. When the PGA is 1.25 g or the MRD is 1156 mm, the failure probability is 5%. When the PGA is 1.65 g and the MRD is 1800 mm, the damage probability is 50%.
As a further study, research on adjustable joints and flexible pipes is in progress to reduce the damage to the pipe passing through the interface of the seismic isolation system.

Author Contributions

Conceptualization, S.E.; Formal analysis, S.-W.K. and D.-W.Y.; Investigation, D.H.; Writing—original draft, B.-G.J.; Writing—review & editing, S.E. All authors have read and agreed to the published version of the manuscript.

Funding

This research was supported by the Korea Agency for Infrastructure Technology Advancement (KAIA) grant funded by the Ministry of Land, Infrastructure and Transport of Korean government (No. 22CTAP-C164263-02).

Institutional Review Board Statement

Not applicable.

Informed Consent Statement

Not applicable.

Conflicts of Interest

The authors declare no conflict of interest.

References

  1. Jang, K.S.; Chnag, H.P.; Lee, H.P. Influence evaluation of the multi-lead rubber bearing due to the compressive stress for nuclear power plant. J. Korean Soc. Adv. Compos. Struct. 2016, 7, 55–64. [Google Scholar] [CrossRef]
  2. Kammerer, A.M.; Whittaker, A.S.; Constantinou, M.C. Technical Considerations for Seismic Isolation of Nuclear Facilities (NUREG/CR- 7253); U.S. Nuclear Regulatory Commission: Washington, DC, USA, 2019.
  3. Vailati, M.; Monti, G.; Bianco, V. Integrated solution-base isolation and repositioning-for the seismic rehabilitation of a preserved strategic building. Buildings 2021, 11, 164. [Google Scholar] [CrossRef]
  4. Monti, G.; Vailati, M.; Marnetto, R. Base Isolation and Translation of a Strategic Building Under a Preservation Order. In Earthquakes and Their Impact on Society; Springer: Cham, Switzerland, 2016; pp. 433–447. [Google Scholar]
  5. Cheung, J.H.; Gae, M.S.; Seo, Y.D.; Choi, H.S.; Kim, M.K. Seismic capacity test of nuclear piping system using multi-platform shake table. J. Earthq. Eng. Soc. Korea 2013, 17, 21–31. [Google Scholar] [CrossRef] [Green Version]
  6. Hahm, D.G.; Park, J.H.; Choi, I.K. Seismic performance evaluation of piping system crossing the isolation interface in seismically isolated NPP. J. Earthq. Eng. Soc. Korea 2014, 18, 141–150. [Google Scholar] [CrossRef]
  7. Jeon, B.G.; Kim, S.W.; Choi, H.S.; Park, D.U.; Kim, N.S. A failure estimation method of steel pipe elbows under in-plane cyclic loading. Nucl. Eng. Technol. 2017, 49, 245–253. [Google Scholar] [CrossRef] [Green Version]
  8. Kim, S.W.; Chang, S.J.; Park, D.U.; Jeon, B.G. Failure criteria of a carbon steel pipe elbow for low-cycle fatigue using the damage index. Thin-Walled Struct. 2020, 153, 106800. [Google Scholar] [CrossRef]
  9. Kim, S.W.; Jeon, B.G.; Hahm, D.G.; Kim, M.K. Seismic fragility evaluation of the base-isolated nuclear power plant piping system using the failure criterion based on stress-strain. Nucl. Eng. Technol. 2019, 51, 561–572. [Google Scholar] [CrossRef]
  10. Xu, J.; DeGrassi, G.; Chokshi, N. A NRC-BNL benchmark evaluation of seismic analysis methods for non-classically damped coupled systems. Nucl. Eng. Des. 2004, 228, 345–366. [Google Scholar] [CrossRef]
  11. Eem, S.H.; Choi, I.K.; Cha, S.L.; Kwag, S.Y. Seismic response correlation coefficient for the structures, systems and components of the Korean nuclear power plant for seismic probabilistic safety assessment. Ann. Nucl. Energy 2021, 150, 107759. [Google Scholar] [CrossRef]
  12. Eem, S.H. Seismic Fragility Assessment of Isolated Structures Based on Stochastic Response Database. Ph. D. Thesis, Korean Advanced Institute for Science and Technology, Daejeon, Korea, 2014. [Google Scholar]
  13. Eem, S.H.; Jung, H.J. Seismic response distribution estimation for isolated structures using stochastic response database. Earthq. Struct. 2015, 9, 937–956. [Google Scholar] [CrossRef]
  14. Eem, S.H.; Jung, H.J. Seismic fragility assessment of isolated structures by using stochastic response database. Earthq. Struct. 2018, 14, 389–398. [Google Scholar]
  15. American Society of Civil Engineers. Minimum Design Loads for Buildings and Other Structures (ASCE/SEI 7-05); American Society of Civil Engineers: New York, NY, USA, 2005. [Google Scholar]
  16. Federal Emergency Management Agency. NEHRP Recommended Provisions: Design Examples (FEMA-451); Federal Emergency Management Agency: Washington, DC, USA, 2006.
  17. United States Nuclear Regulatory Commission. Design Response Spectra for Seismic Design of Nuclear Power Plants (Regulatory Guide 1.60); United States Nuclear Regulatory Commission: Washington, DC, USA, 2014.
  18. American Society of Civil Engineers. Seismic Analysis of Safety-Related Nuclear Structures (ASCE/SEI 4-16); American Society of Civil Engineers: New York, NY, USA, 2016. [Google Scholar]
  19. Ohno, S. Strong-motion characteristics during the 2011 Tohoku earthquake. J. Jpn. Landslide Soc. 2013, 50, 75–82. [Google Scholar] [CrossRef] [Green Version]
  20. The American Society of Mechanical Engineers. Welded and Seamless Wrought Steel Pipe (ASME B36.10M); The American Society of Mechanical Engineers: New York, NY, USA, 2015. [Google Scholar]
  21. Jeon, B.G.; Kim, S.W.; Yun, D.W.; Hahm, D.G. A Quantitative Limit State of the Carbon Steel Pipe Tee in the Nuclear Power Plants Under In-Plane Cyclic Loading. In Proceedings of the 25th International Conference in Structural Mechanics in Reactor Technology (SMiRT-25), Charlotte, NC, USA, 4–9 August 2019. [Google Scholar]
  22. Kwag, S.Y.; Eem, S.H.; Kwak, J.S.; Oh, J.H. Evaluation model of seismic response behavior and performance of nuclear plant piping systems. J. Korean Soc. Adv. Compos. Struct. 2020, 11, 54–62. [Google Scholar] [CrossRef]
  23. American Society of Mechanical Engineers. Section III, Rules for Construction of Nuclear Facility Components. In ASME Boiler and Pressure Vessel Code; American Society of Mechanical Engineers: New York, NY, USA, 2015. [Google Scholar]
  24. Korea Electric Power Corporation Engineering & Construction. SKN 3 & 4 Safety Related-Plant Manual-Main Stem System (MS); Korea Electric Power Corporation Engineering & Construction: Yongin, Korea, 2011. [Google Scholar]
  25. American Society of Mechanical Engineers. Section II, Part D, Properties (Customary). In ASME Boiler and Pressure Vessel Code; American Society of Mechanical Engineers: New York, NY, USA, 2015. [Google Scholar]
  26. Kim, J.H.; Kim, M.K.; Choi, I.K. Experimental study on seismic behavior of lead-rubber bearing considering bi-directional horizontal input motions. Eng. Struct. 2019, 198, 109529. [Google Scholar] [CrossRef]
  27. Zhang, T.; Brust, F.W.; Willkowski, G.; Shim, D.J.; Nie, J.; Hofmayer, C.H.; Ali, S.A. Analysis of JNES Seismic Tests on Degraded Piping. In Proceedings of the ASME 2010 Pressure Vessels & Piping Division/K-PVP Conference, Washington, DC, USA, 18–22 July 2010. [Google Scholar]
  28. Electric Power Research Institute. Piping and Fitting Dynamic Reliability Program (EPRI TR-102792-V1 through V5); Electric Power Research Institute: Palo Alto, CA, USA, 1994. [Google Scholar]
  29. Shinozuka, M.; Feng, M.Q.; Kim, H.K.; Kim, S.H. Nonlinear static procedure for fragility curve development. J. Eng. Mech. 2000, 126, 1287–1296. [Google Scholar] [CrossRef] [Green Version]
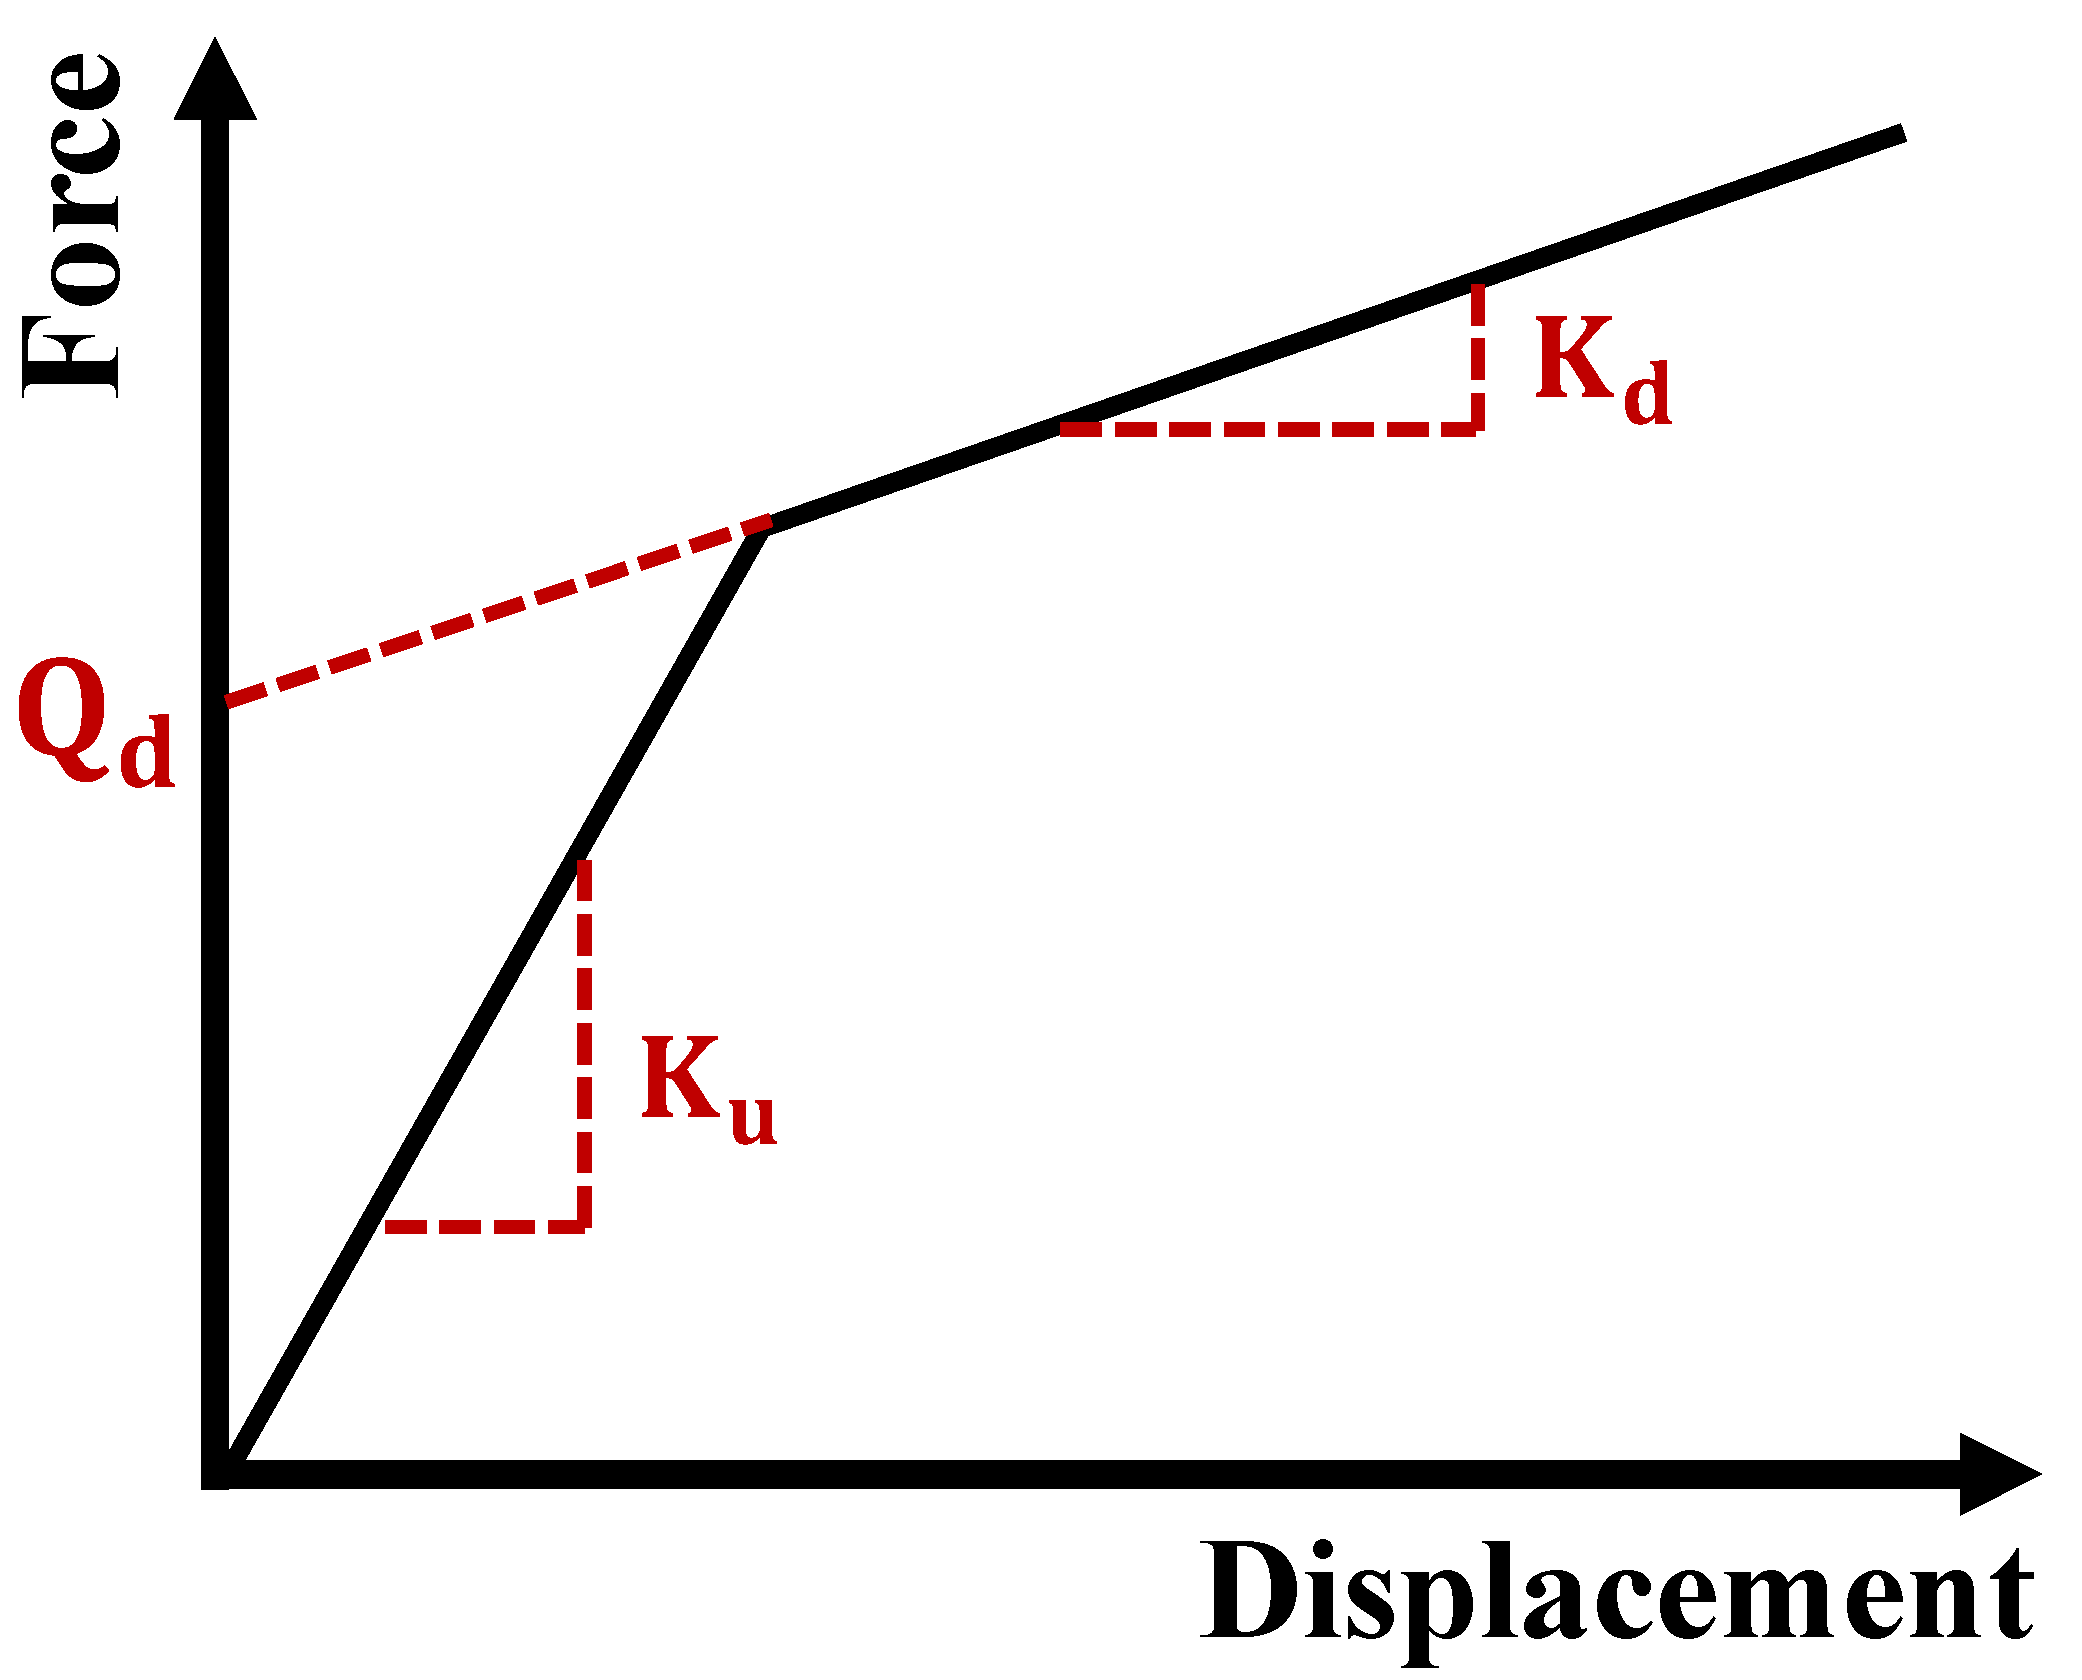
Figure 1. Concept of base-isolated APR 1400 [12,13].
Sustainability 14 08315 g001
Figure 2. Mechanical properties of the isolation system.
Sustainability 14 08315 g002
Figure 3. Response spectrum [13,14]: (a) x-directional; (b) y-directional.
Sustainability 14 08315 g003
Figure 4. Main steam piping of isolated APR 1400.
Sustainability 14 08315 g004
Figure 5. Material properties of the pipe.
Sustainability 14 08315 g005
Figure 6. Finite element model of main steam piping: (a) Finite element model; (b) Boundary condition; (c) Internal pressure.
Sustainability 14 08315 g006aSustainability 14 08315 g006b
Figure 7. Mode shape of the piping system: (a) undeformed shape (b) 1st mode (8.69 Hz); (c) 2nd mode (9.15 Hz); (d) 3rd mode (14.43 Hz).
Sustainability 14 08315 g007
Figure 8. Maximum strain responses: (a) Maximum strain response according to the PGA; (b) Maximum strain response according to the MRD.
Sustainability 14 08315 g008
Figure 9. Maximum stress responses: (a) Maximum stress response according to the PGA; (b) Maximum stress response according to the MRD.
Sustainability 14 08315 g009
Figure 10. Damage indices: (a) Damage indices according to the PGA; (b) Damage indices according to the MRD.
Sustainability 14 08315 g010
Figure 11. Fragility curves for main steam piping of isolated NPP: (a) PGA-based fragility curve; (b) MRD-based fragility curve.
Sustainability 14 08315 g011
Table 1. Parameters for the isolation system.
ParametersValues
K e f f 2939.72 MN/m
K u 19,620.51 MN/m
K d 1962.05 MN/m
Q d 329.43 MN
Table 2. Specifications of the piping system.
LocationD [mm]t [mm]D/t
Turbine building705.7927.0026.14
Auxiliary building764.7238.1020.07
1458.1159.5424.49
Table 3. Material properties of the pipes.
Density [N/mm3]E [MPa]Poisson’s Ratio
7.85 × 10−9205,0000.3
Table 4. Boundary conditions.
Support IDLocation
BuildingElevation [mm]Constrained Directions
A1~A7, A9, A17, A19, A21~A26auxiliary42,589X, Y
AP1~AP4pedestal42,589X, Y, Z
A13, A14auxiliary41,067X, Z
A8, A10, A18, A20auxiliary39,446Y
A11, A15auxiliary38,417Z
A12, A16auxiliary37,427X
M1, M2auxiliary32,309Y
TP1, TP2pedestal45,415X, Y, Z
TP3, TP4pedestal41,300X, Y, Z
T1~T4turbine32,181X, Z
T5~T8turbine35,929Y, Z
Table 5. Natural frequency and participation factors.
Model No.Natural Frequency
[Hz]
Participation FactorsMass Participation Ratio
XYZXYZ
18.961.898000.088750.029981.000000.002190.00025
29.150.003430.984960.297880.001211.000000.09146
314.43−0.00173−0.673001.477000.000000.207921.00000
Table 6. Maximum relative displacements between the isolation-non isolation building.
PGA LevelRelative Displacement [mm]
1 g1.5 g2 g2.5 g3 g
EQDirectionMRDDirectionMRDDirectionMRDDirectionMRDDirectionMRD
XYXYXYXYXY
1711749749137612891376204218382042270423632704336628883366
2905745905159513171595228718882287299624722996370530563705
312686381268213211432132299716482997385921663859472226844722
410426961042177012541770249718122497323423553234397028983970
512666771266206411672064286216562862367221433672448126524481
663110461046102716791679146623152315198329572957250236123612
7736814814126914211421180320322032232826482648285432633263
8916800916150614161506209620372096269126772691328633183318
978010091009142717001700207523922392272630453045337636983698
10612958958109815931593165822302230221928702870278135103510
11600917917106416111611153223052305199030033003244837013701
12723575723140910481409209715252097277820162778346125083461
13934845934151414091514209419782094265625442656321831093218
14811824824131912921319182717661827234322422343286027332860
1510987261098183512191835257317792573330523363305403728934037
1668010811081125918471847183826142614242333583358300941024102
17790811811136913191369194818271948253523392535312128513121
1886310451045141616681668196922912291252029152915307235403540
1969310791079117118011801165225632563212533503350259941384138
20785726785127111591271179916691799240521832405301026973010
2167110651065111317381738157224112411205130833083253137563756
221179524117921109002110304212823042396716603967489220384892
2360712521252103821032103146829582958188938413841231047244724
24654766766112913831383160720312031210126802680259533303330
25102811691169165418721872228425752575290232863286352039983998
26914928928158715111587226020942260294826632948363632373636
275881316131697521112111136229062906177936993699221044924492
281045543104518438911843264113052641344217573442424222114242
2979244679215108731510224313012243297717372977371121763711
30846635846150711711507219217552192288623142886358028723580
Avg.839847988144514301675205920262371268126233071330432233773
Table 7. Maximum responses according to the PGA level of input motions.
EQPGA Level
1 g1.5 g2 g2.5 g3 g
Max .   ε Max .   σ
[MPa]
Max .   ε Max .   σ
[MPa]
Max .   ε Max .   σ
[MPa]
Max .   ε Max .   σ
[MPa]
Max .   ε Max .   σ
[MPa]
10.03550.750.0664711.480.0961870.490.1134991.020.12501110.00
20.0241473.840.0476603.620.0613710.840.0725827.940.0822898.60
30.0390564.210.0728717.940.0986943.650.11721039.390.12801160.00
40.0237516.190.0495653.650.0701770.990.0844878.130.0930977.13
50.0328532.610.0552633.950.0733772.270.0857943.790.09841050.00
60.0235528.600.0570707.020.0834896.990.09791026.970.10901160.00
70.0215514.080.0444575.310.0666694.870.0854845.660.0981963.46
80.0272545.960.0522708.620.0708893.280.08851045.780.10001190.00
90.0321558.560.0566716.420.0738851.590.08471014.360.09311130.00
100.0214534.420.0479648.520.0706790.210.0873911.170.09771000.00
110.0179500.820.0517672.700.0832862.860.1014994.630.11401070.00
120.0326525.930.0652734.280.0884909.070.10461058.890.11901260.00
130.0311559.350.0554658.960.0794821.870.0941949.250.10501040.00
140.0241540.950.0523682.400.0743897.190.08991050.040.10301220.00
150.0280497.820.0518656.300.0690772.710.0792901.870.08731030.00
160.0231476.430.0498562.930.0732725.000.0935843.180.1090946.92
170.0257481.170.0522641.040.0722846.910.0857989.360.09821140.00
180.0212481.140.0442613.060.0626726.230.0740826.340.0821943.18
190.0175424.610.0349543.660.0461735.270.0562838.780.0664947.06
200.0330577.350.0632741.930.0855952.980.09921098.690.11101220.00
210.0190485.540.0475608.220.0673731.170.0823855.760.0941970.46
220.0523612.290.0779857.980.09411040.000.10601177.690.11901350.00
230.0135492.470.0424638.730.0694772.570.0931951.040.11001070.00
240.0193458.060.0341539.530.0503603.930.0629680.280.0750752.40
250.0215520.170.0473654.960.0712786.300.0892938.280.10301040.00
260.0291447.910.0504578.940.0693785.870.0822925.350.09291030.00
270.0180502.630.0406623.510.0612731.840.0747843.050.0838959.56
280.0417590.340.0666784.370.0859962.380.10321150.480.11501290.00
290.0332593.920.0675833.630.09221060.000.10841240.920.12401390.00
300.0317595.840.0614807.100.0831982.210.09961133.770.1121260.00
Avg.0.0270522.800.0535670.360.0748830.050.0899965.730.10161085.63
Median0.0249523.050.0520655.630.0727806.040.0889950.150.10151060.00
Min.0.0135424.610.0341539.530.0461603.930.0562680.280.0664752.40
Max.0.0523612.290.0779857.980.09861060.000.11721240.920.12801390.00
Stdev. 0.008246.830.010581.410.0126108.450.0140124.170.0151144.88
Table 8. Damage indices of nonlinear analysis.
EQPGA Level
1 g1.5 g2 g2.5 g3 g
119.9438.4354.6764.7271.35
215.6828.4236.4142.3247.44
324.3541.9156.0466.5572.57
415.1029.6140.8648.6553.67
520.1531.9441.9148.8955.71
616.9034.0148.5556.7663.05
715.1127.1938.8448.9456.08
817.8131.0241.5251.4057.81
919.4932.5542.4748.5353.42
1014.6928.5140.8150.4356.41
1114.1731.4047.7158.0165.31
1220.1338.3251.2759.8167.41
1318.9832.3145.4153.6359.80
1414.5830.6442.9651.7558.80
1517.6330.5939.8945.7450.78
1615.5429.7442.4453.3561.69
1715.2929.6940.8548.9856.05
1811.9825.0735.8842.1246.54
1910.6820.4427.2833.2438.66
2018.8236.1448.1256.4763.07
2114.3229.0739.8348.1954.75
2230.4445.1254.6761.0567.83
2312.5027.0041.1553.8063.10
2412.0120.0028.7535.7442.27
2515.7129.2141.5451.4359.33
2617.5829.4739.7546.9552.80
2713.5525.7436.5543.5948.66
2824.8638.7249.5559.0265.56
2921.4539.9953.8262.7371.43
3020.6536.0848.2657.6664.67
Avg.17.3431.6143.2651.6858.20
Median16.3130.6241.7351.4258.31
Max.30.4445.1256.0466.5572.57
Min.10.6820.0027.2833.2438.66
Stdev.4.295.807.047.908.52
Table 9. Seismic performance of main steam piping of isolated NPP.
Probability of FailureSeismic Intensity
PGA [g]MRD [mm]
5%1.251156
50%1.651800
Publisher’s Note: MDPI stays neutral with regard to jurisdictional claims in published maps and institutional affiliations.

