Spatiotemporal Variations of Extreme Precipitation in Wuling Mountain Area (China) and Their Connection to Potential Driving Factors
Abstract
:1. Introduction
2. Study Area and Data
2.1. Study Area
2.2. Data
2.2.1. Precipitation and Geographic Factors
2.2.2. Extreme Precipitation Indices
2.2.3. Global Warming and Local Temperature
2.2.4. Climate Indices
3. Methodology
3.1. Mann-Kendall Trend Test
3.2. Pettit Abrupt Test
3.3. Pearson’s Correlation Analysis
4. Results
4.1. Spatial and Temporal Variations of Extreme Precipitation
4.1.1. Trends in Extreme Precipitation Indices
4.1.2. Abrupt Changes in Extreme Precipitation Indices
4.2. Correlation with Potential Factors
4.2.1. Correlation between Extreme Precipitation Indices
4.2.2. Correlation with Geographic Factors
4.2.3. Correlation with Global Warming and Local Temperature
4.2.4. Correlation with Climate Indices
5. Discussion
6. Conclusions
- (1)
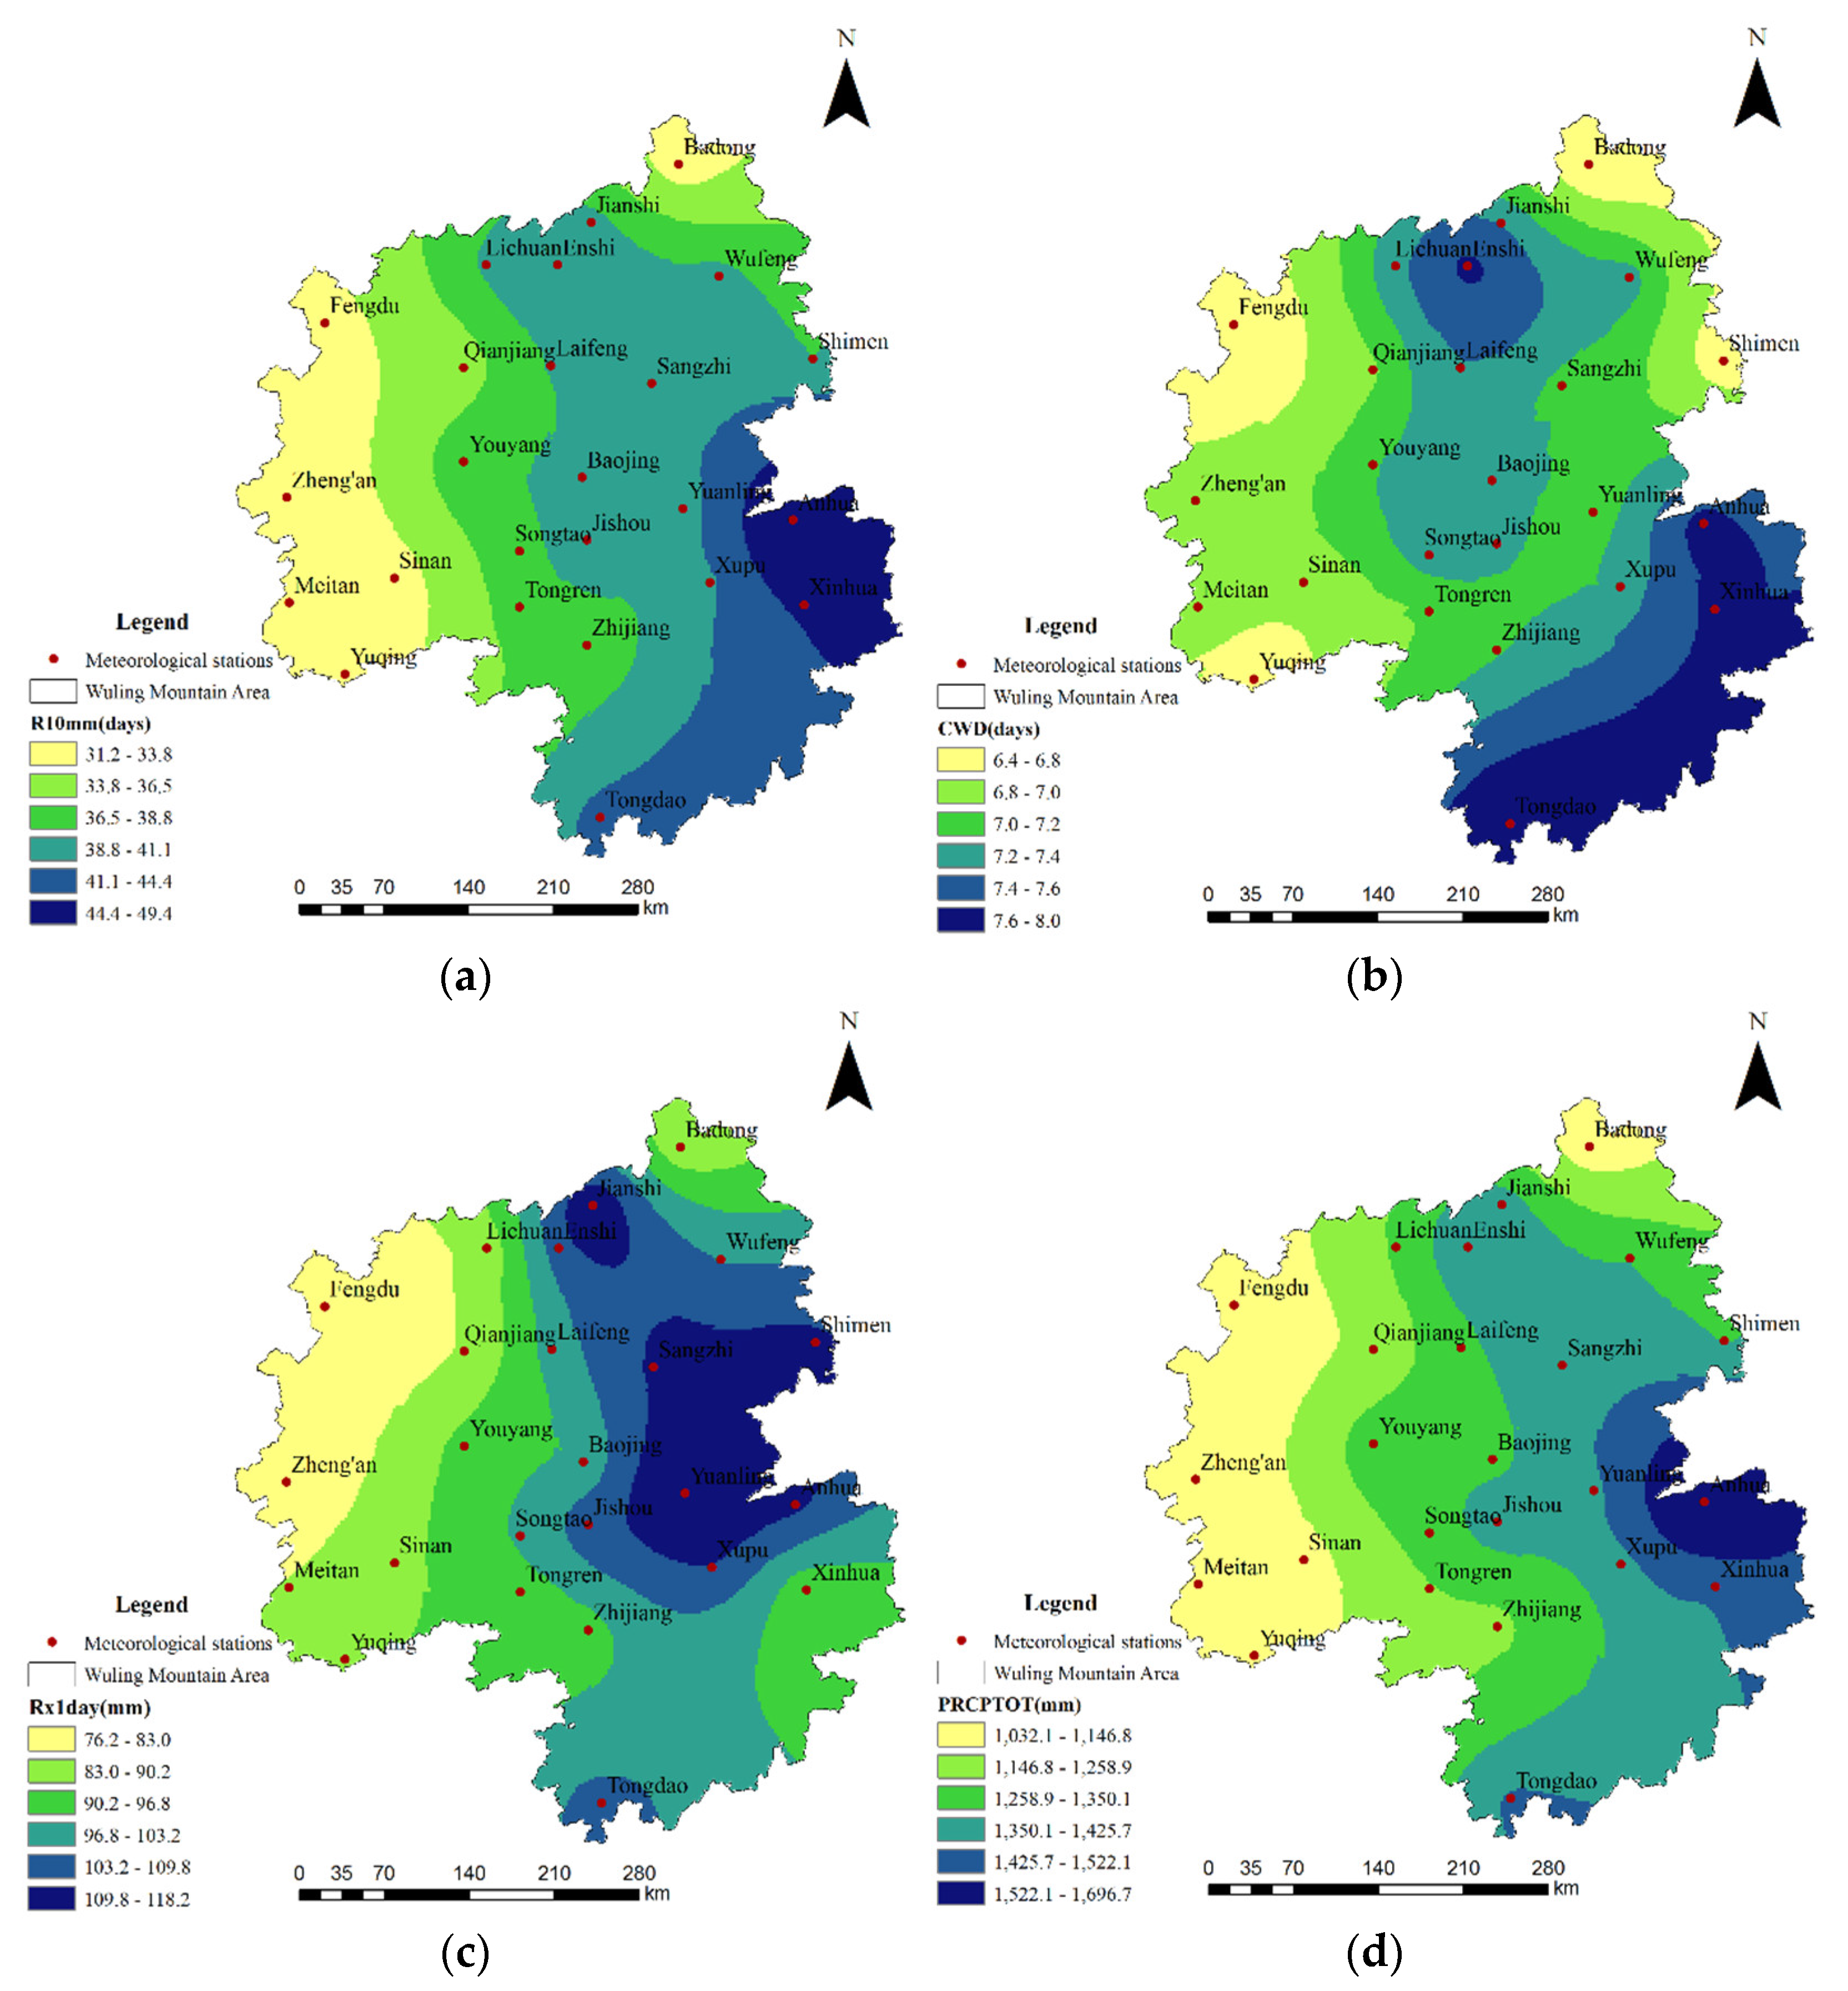
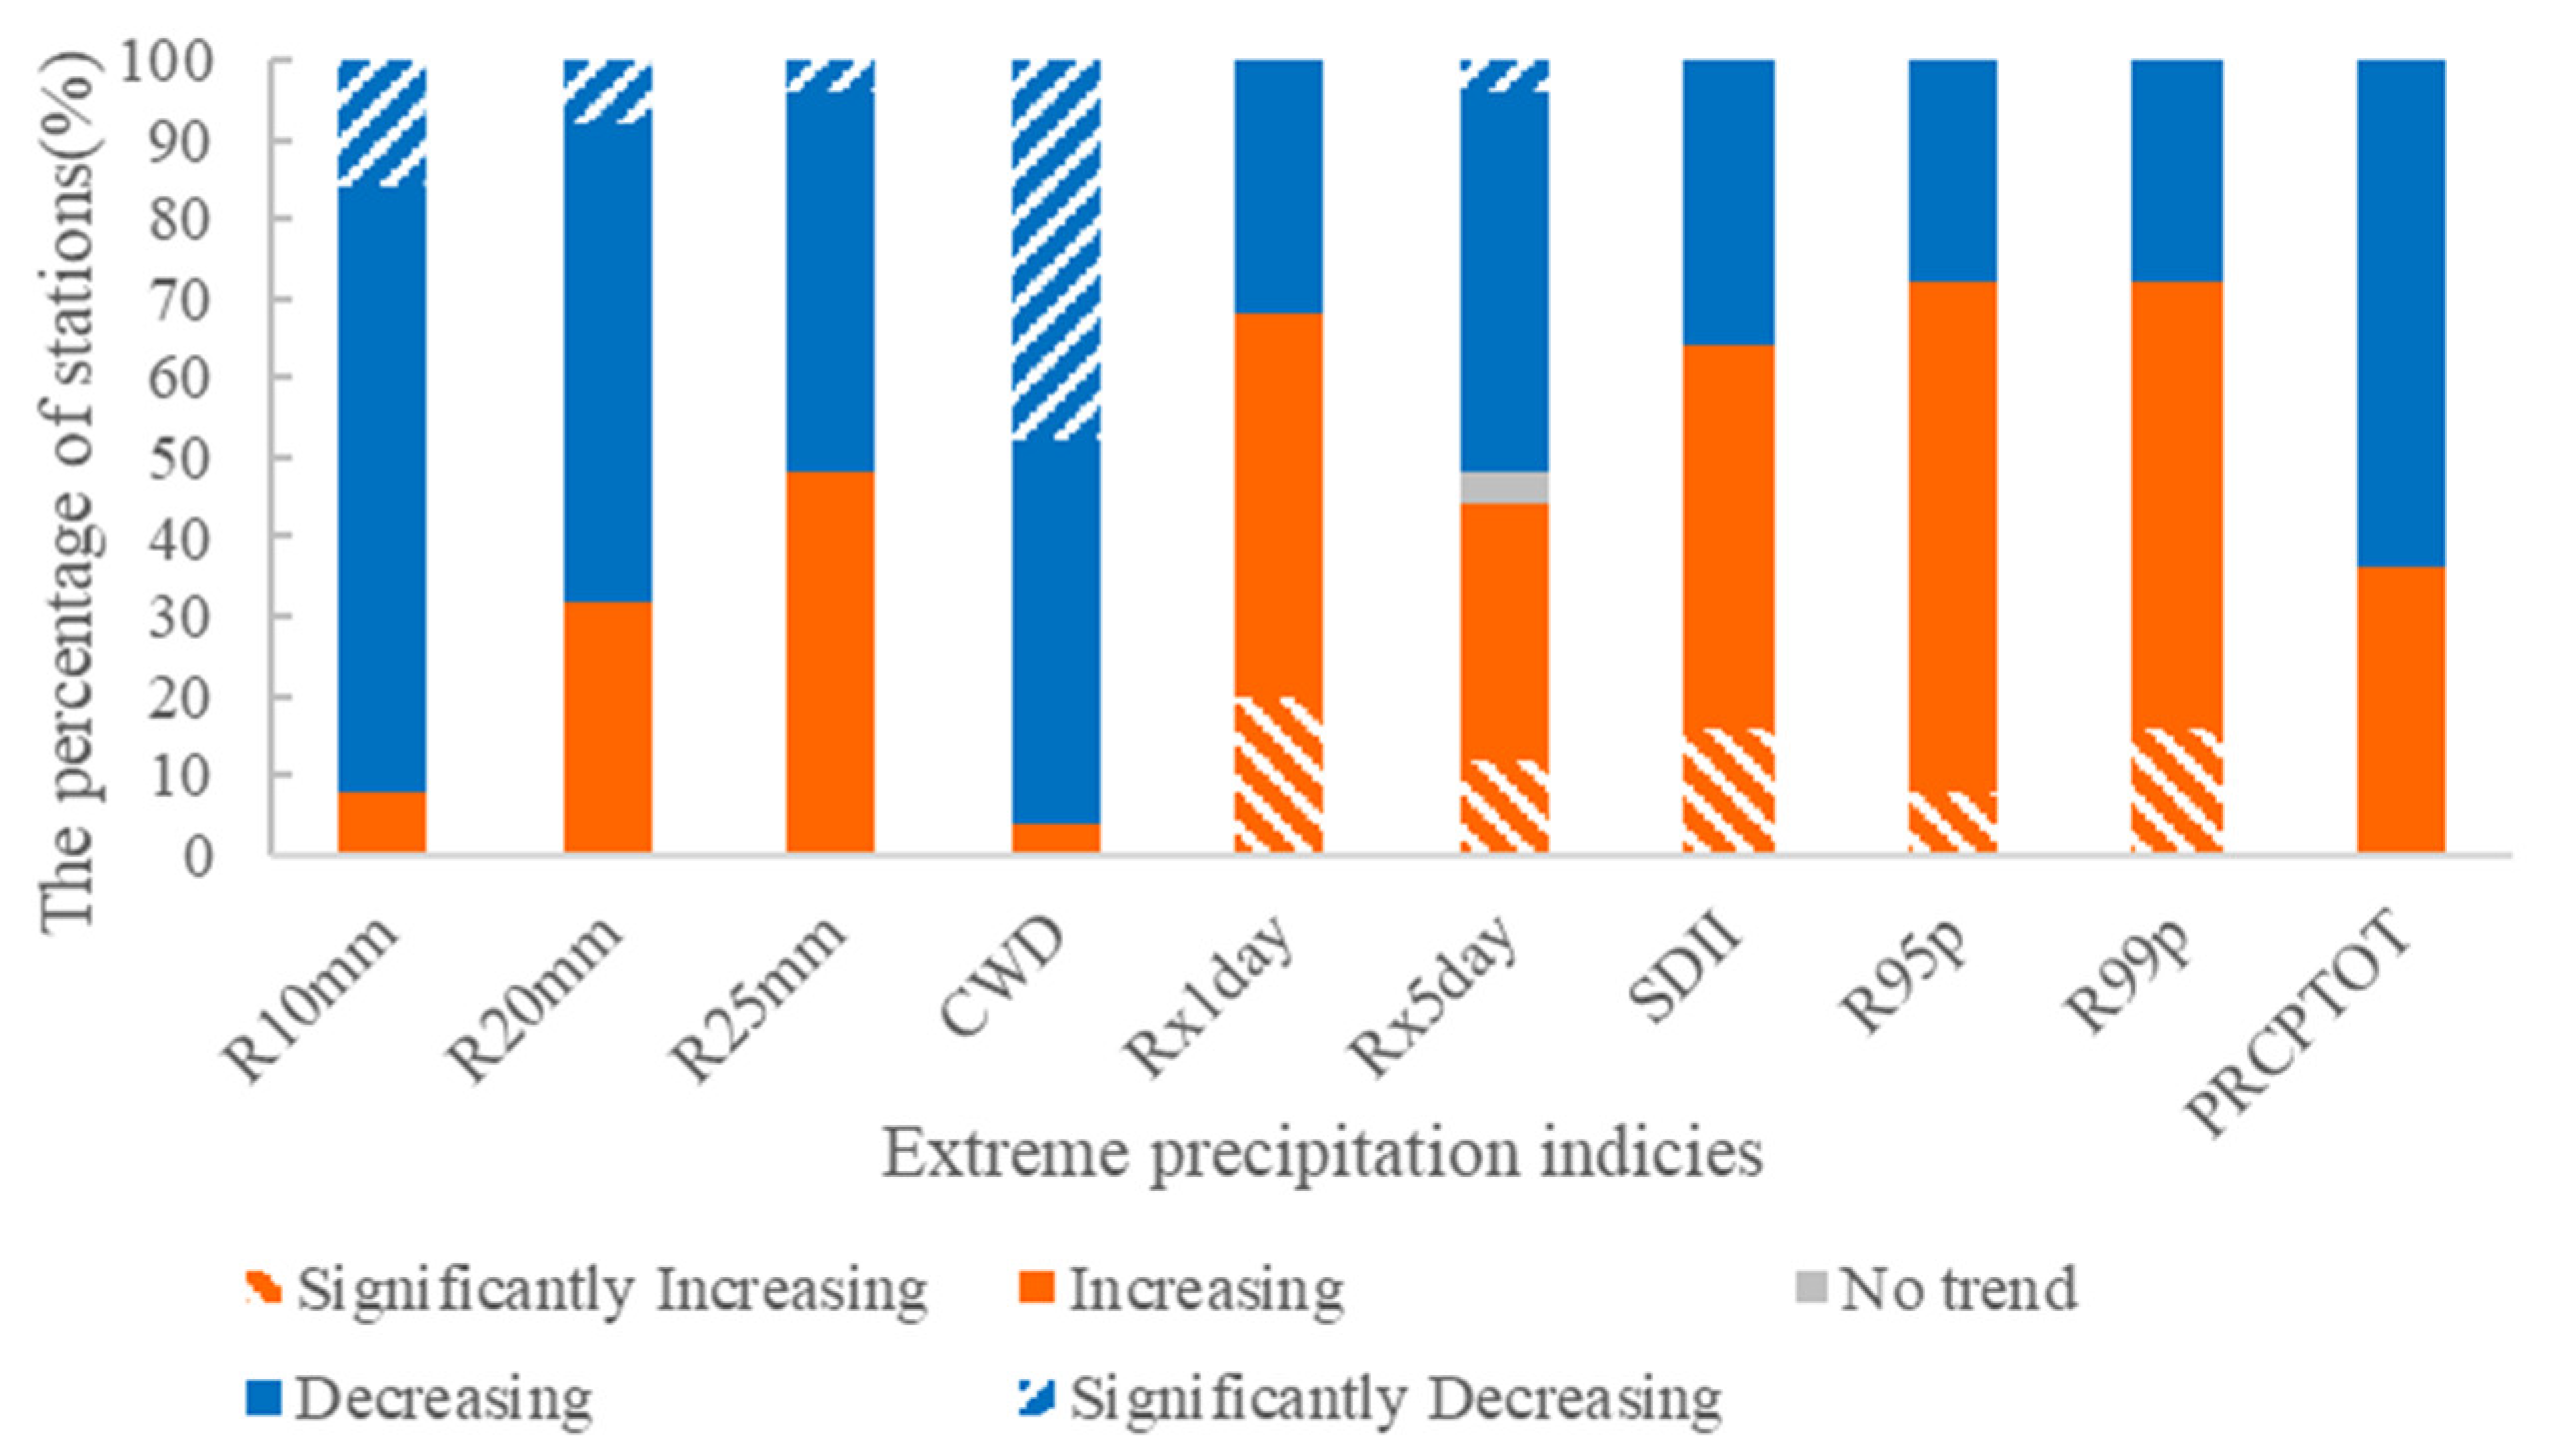
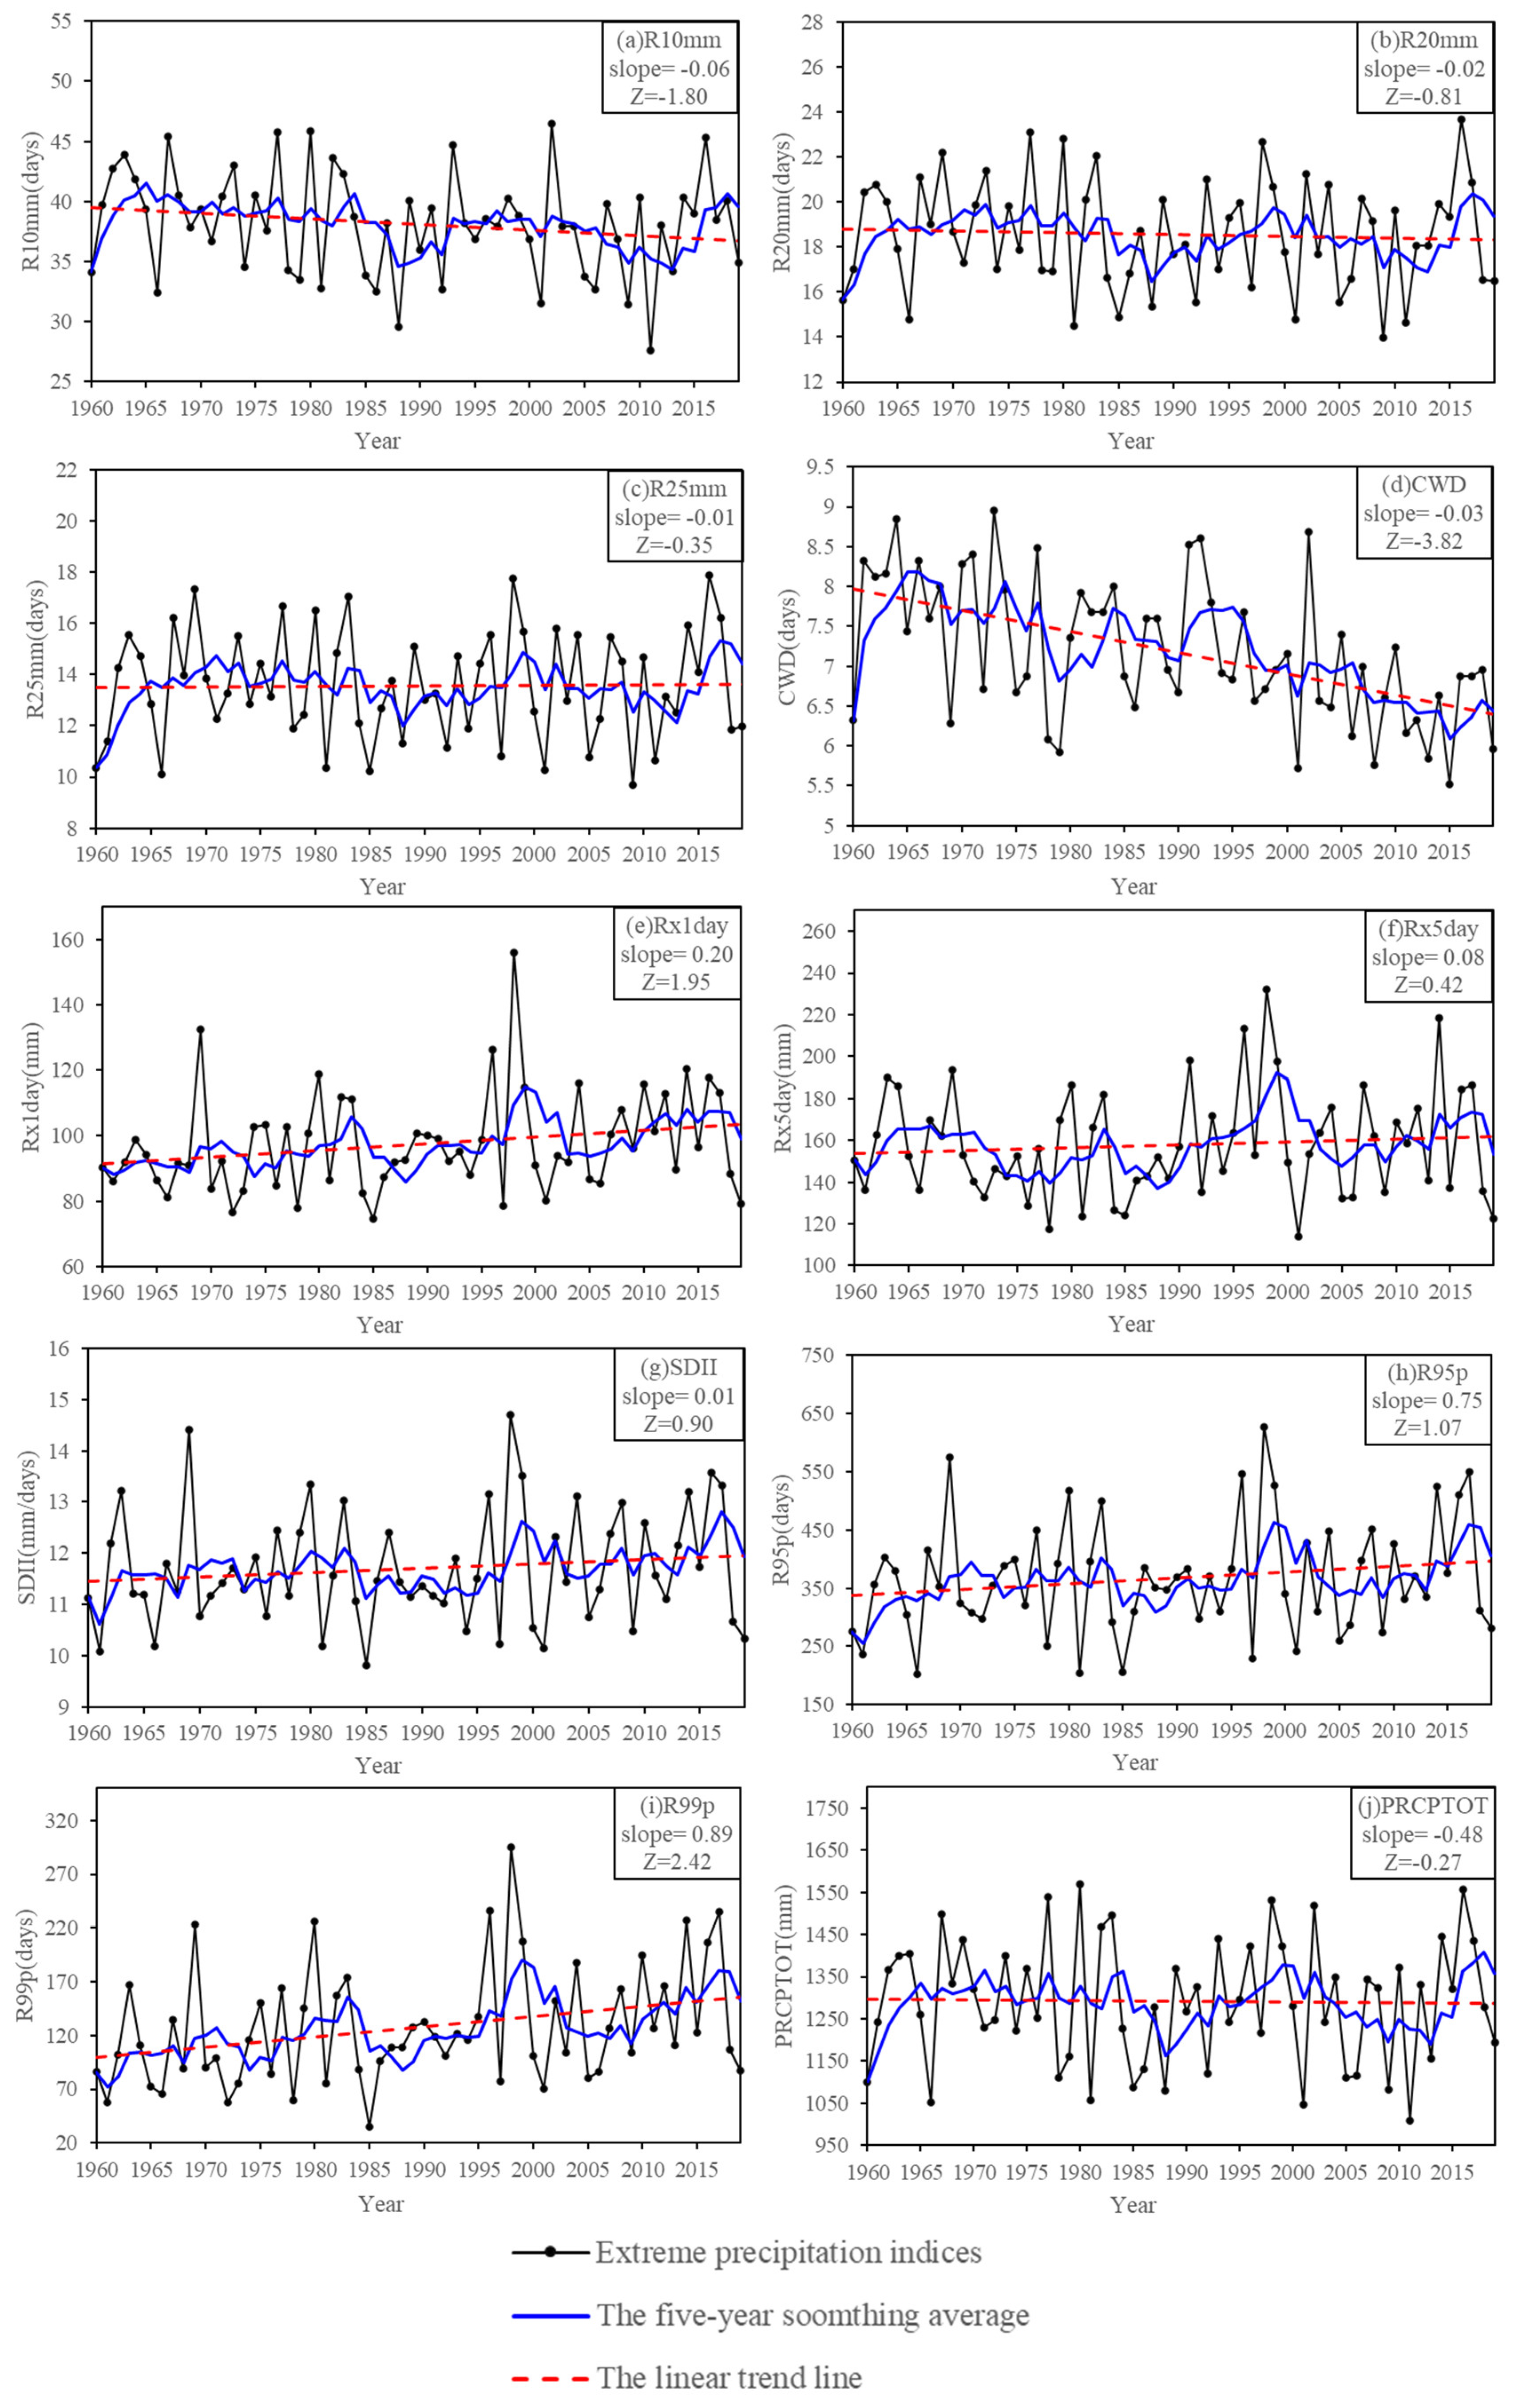
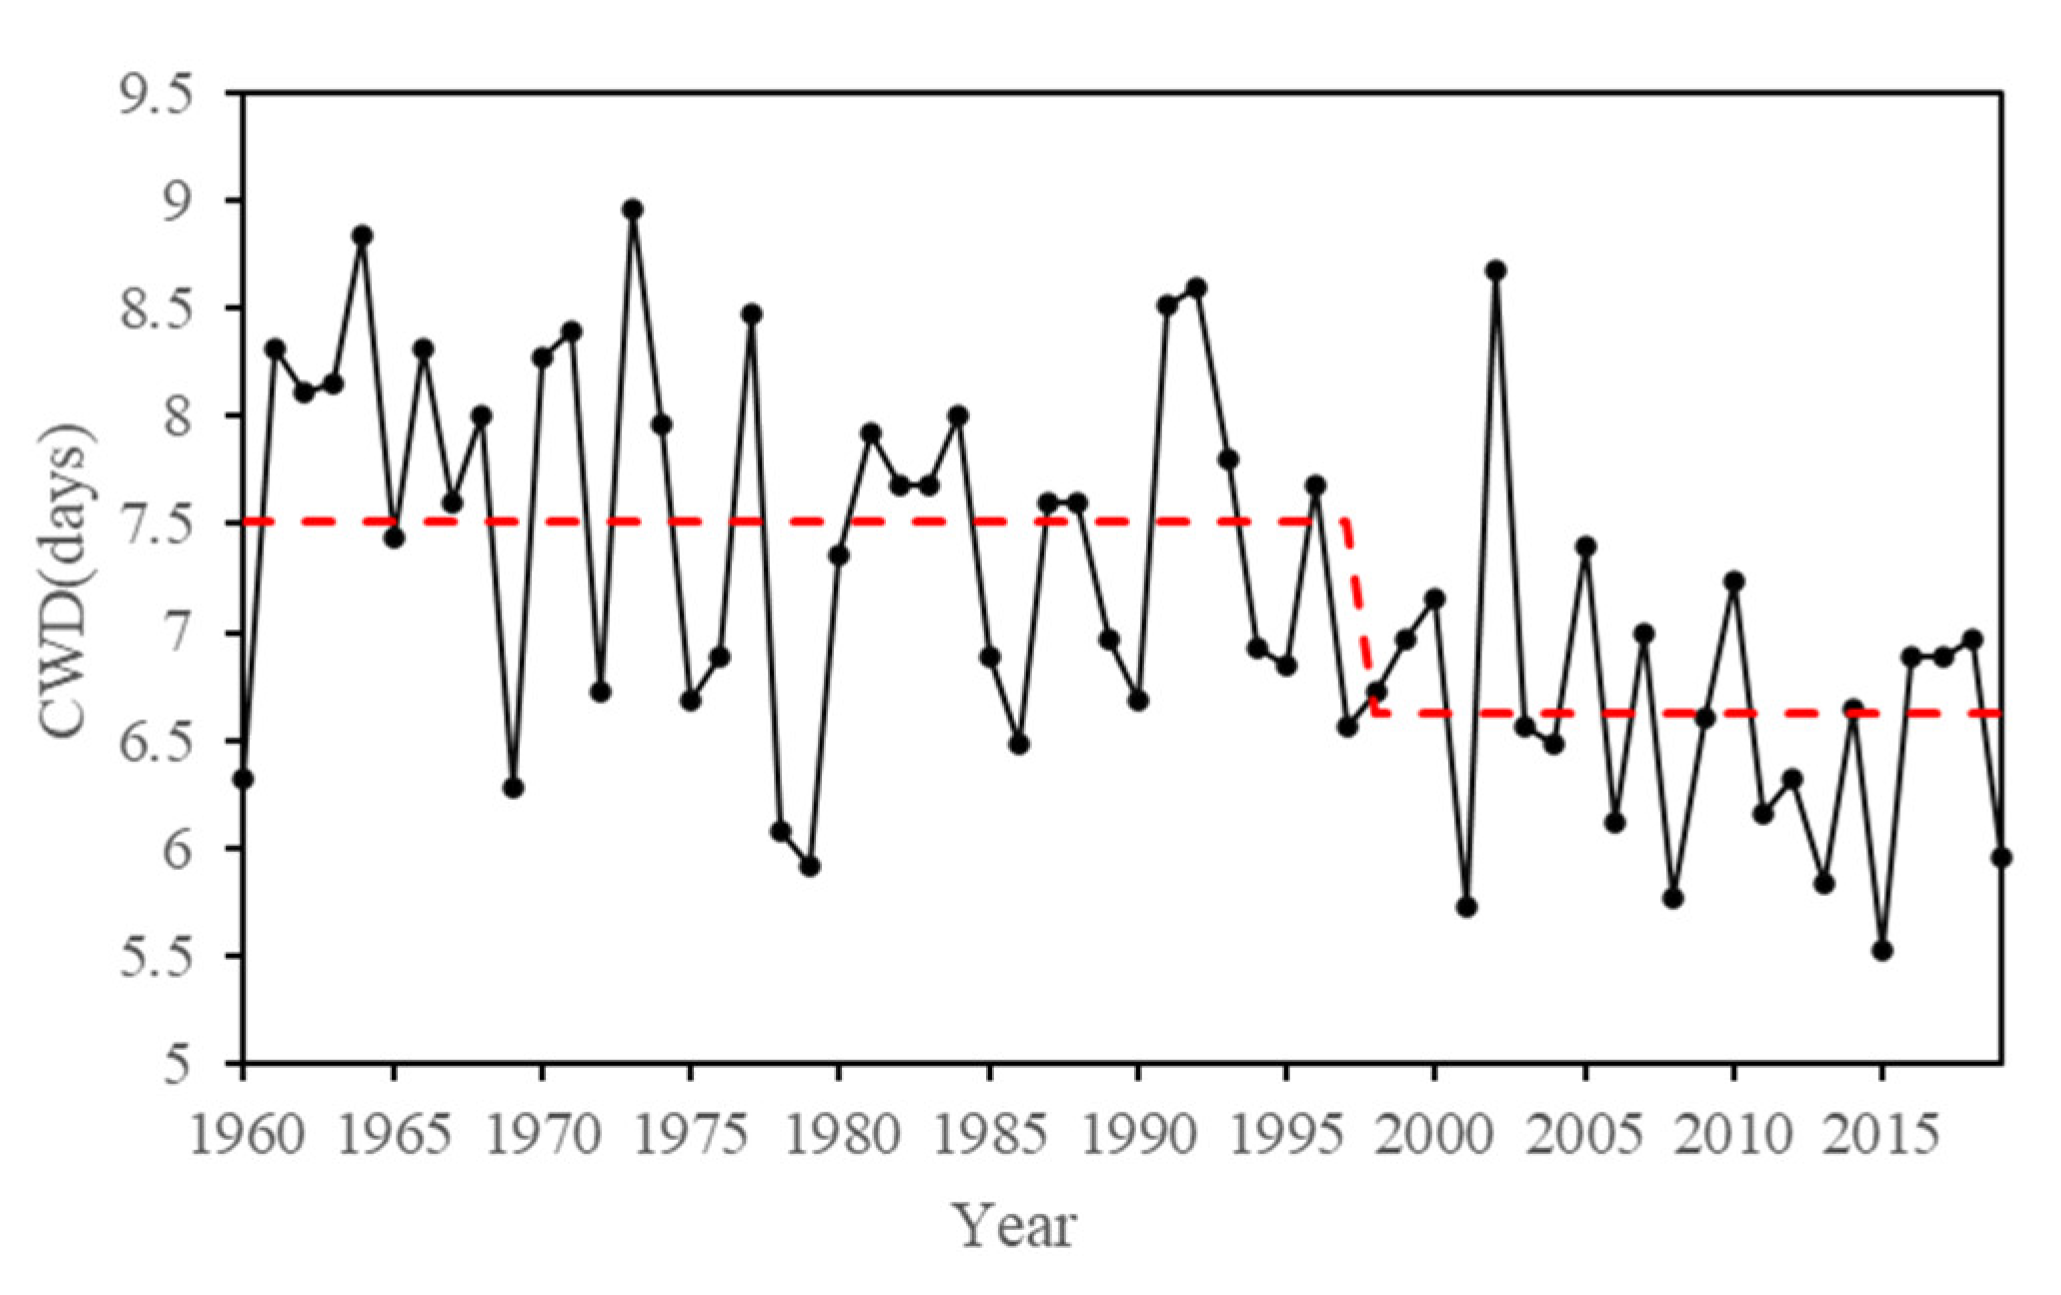
- The results show that extreme precipitation intensities (Rx1day, R95p, and R99p) and average precipitation intensity (SDII) increased significantly in WMA during 1960–2019. On the contrary, the maximum duration of wet days (CWD) decreases obviously during the same period. Frequency-based precipitation indices (R10mm, R20mm, R25mm) reduce at most stations, while increasing trends of frequency-based precipitation indices display on the average regional scale. These indicate extreme precipitation with shorter duration and stronger intensity in WMA, which might increase the risk of floods and the resulting landslides and debris flows over WMA, especially in the middle and east part of WMA, where the elevation is relatively low, but where the intensity and frequency of precipitation extremes tend to increase;
- (2)
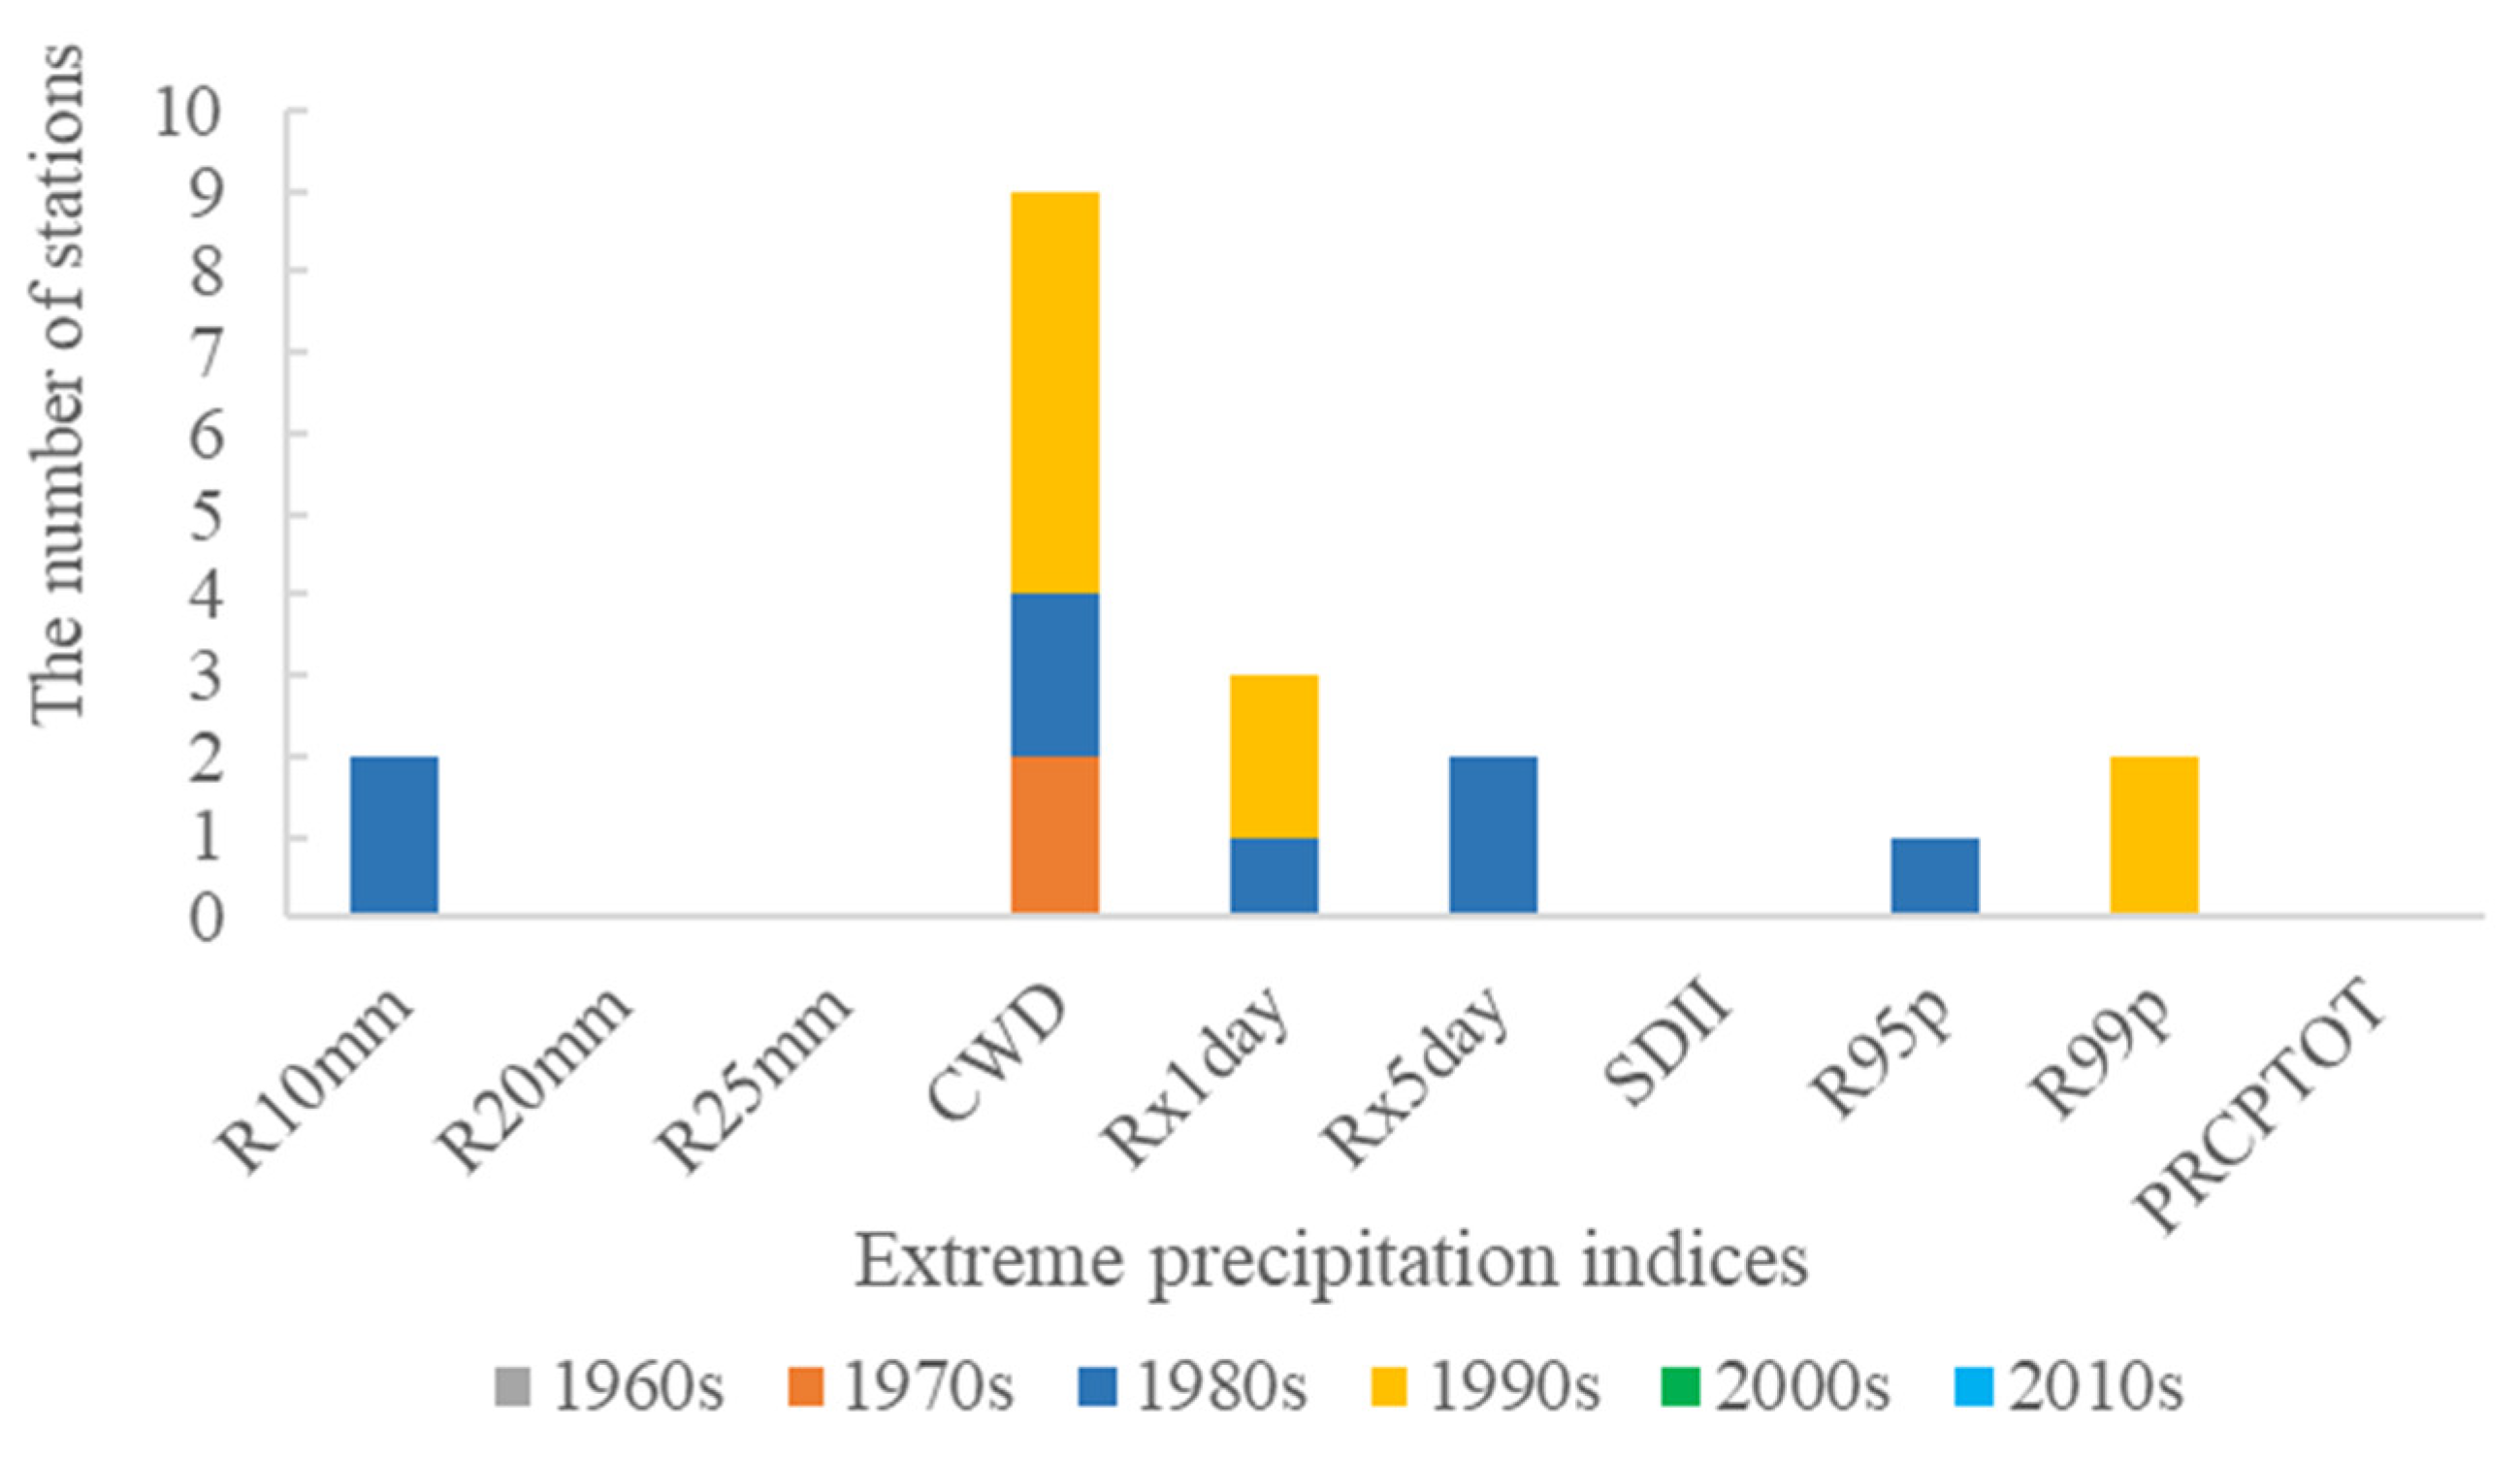
- There is no significant abrupt examined for R20mm, R25mm, SDII, or PCRPTOT in WMA during 1960–2019. Significant abrupt changes for other extreme precipitation indices mainly occurred in the 1980s–1990s, and there was an abrupt detected at Qianjiang and Sinan for CWD in the 1970s. The stations with obvious abrupt changes in Rx1day, Rx5day, and R99p are located in the high-value area of extreme precipitation in WMA; yet, sites with a significant abrupt of CWD was mainly distributed in the middle region of WMA;
- (3)
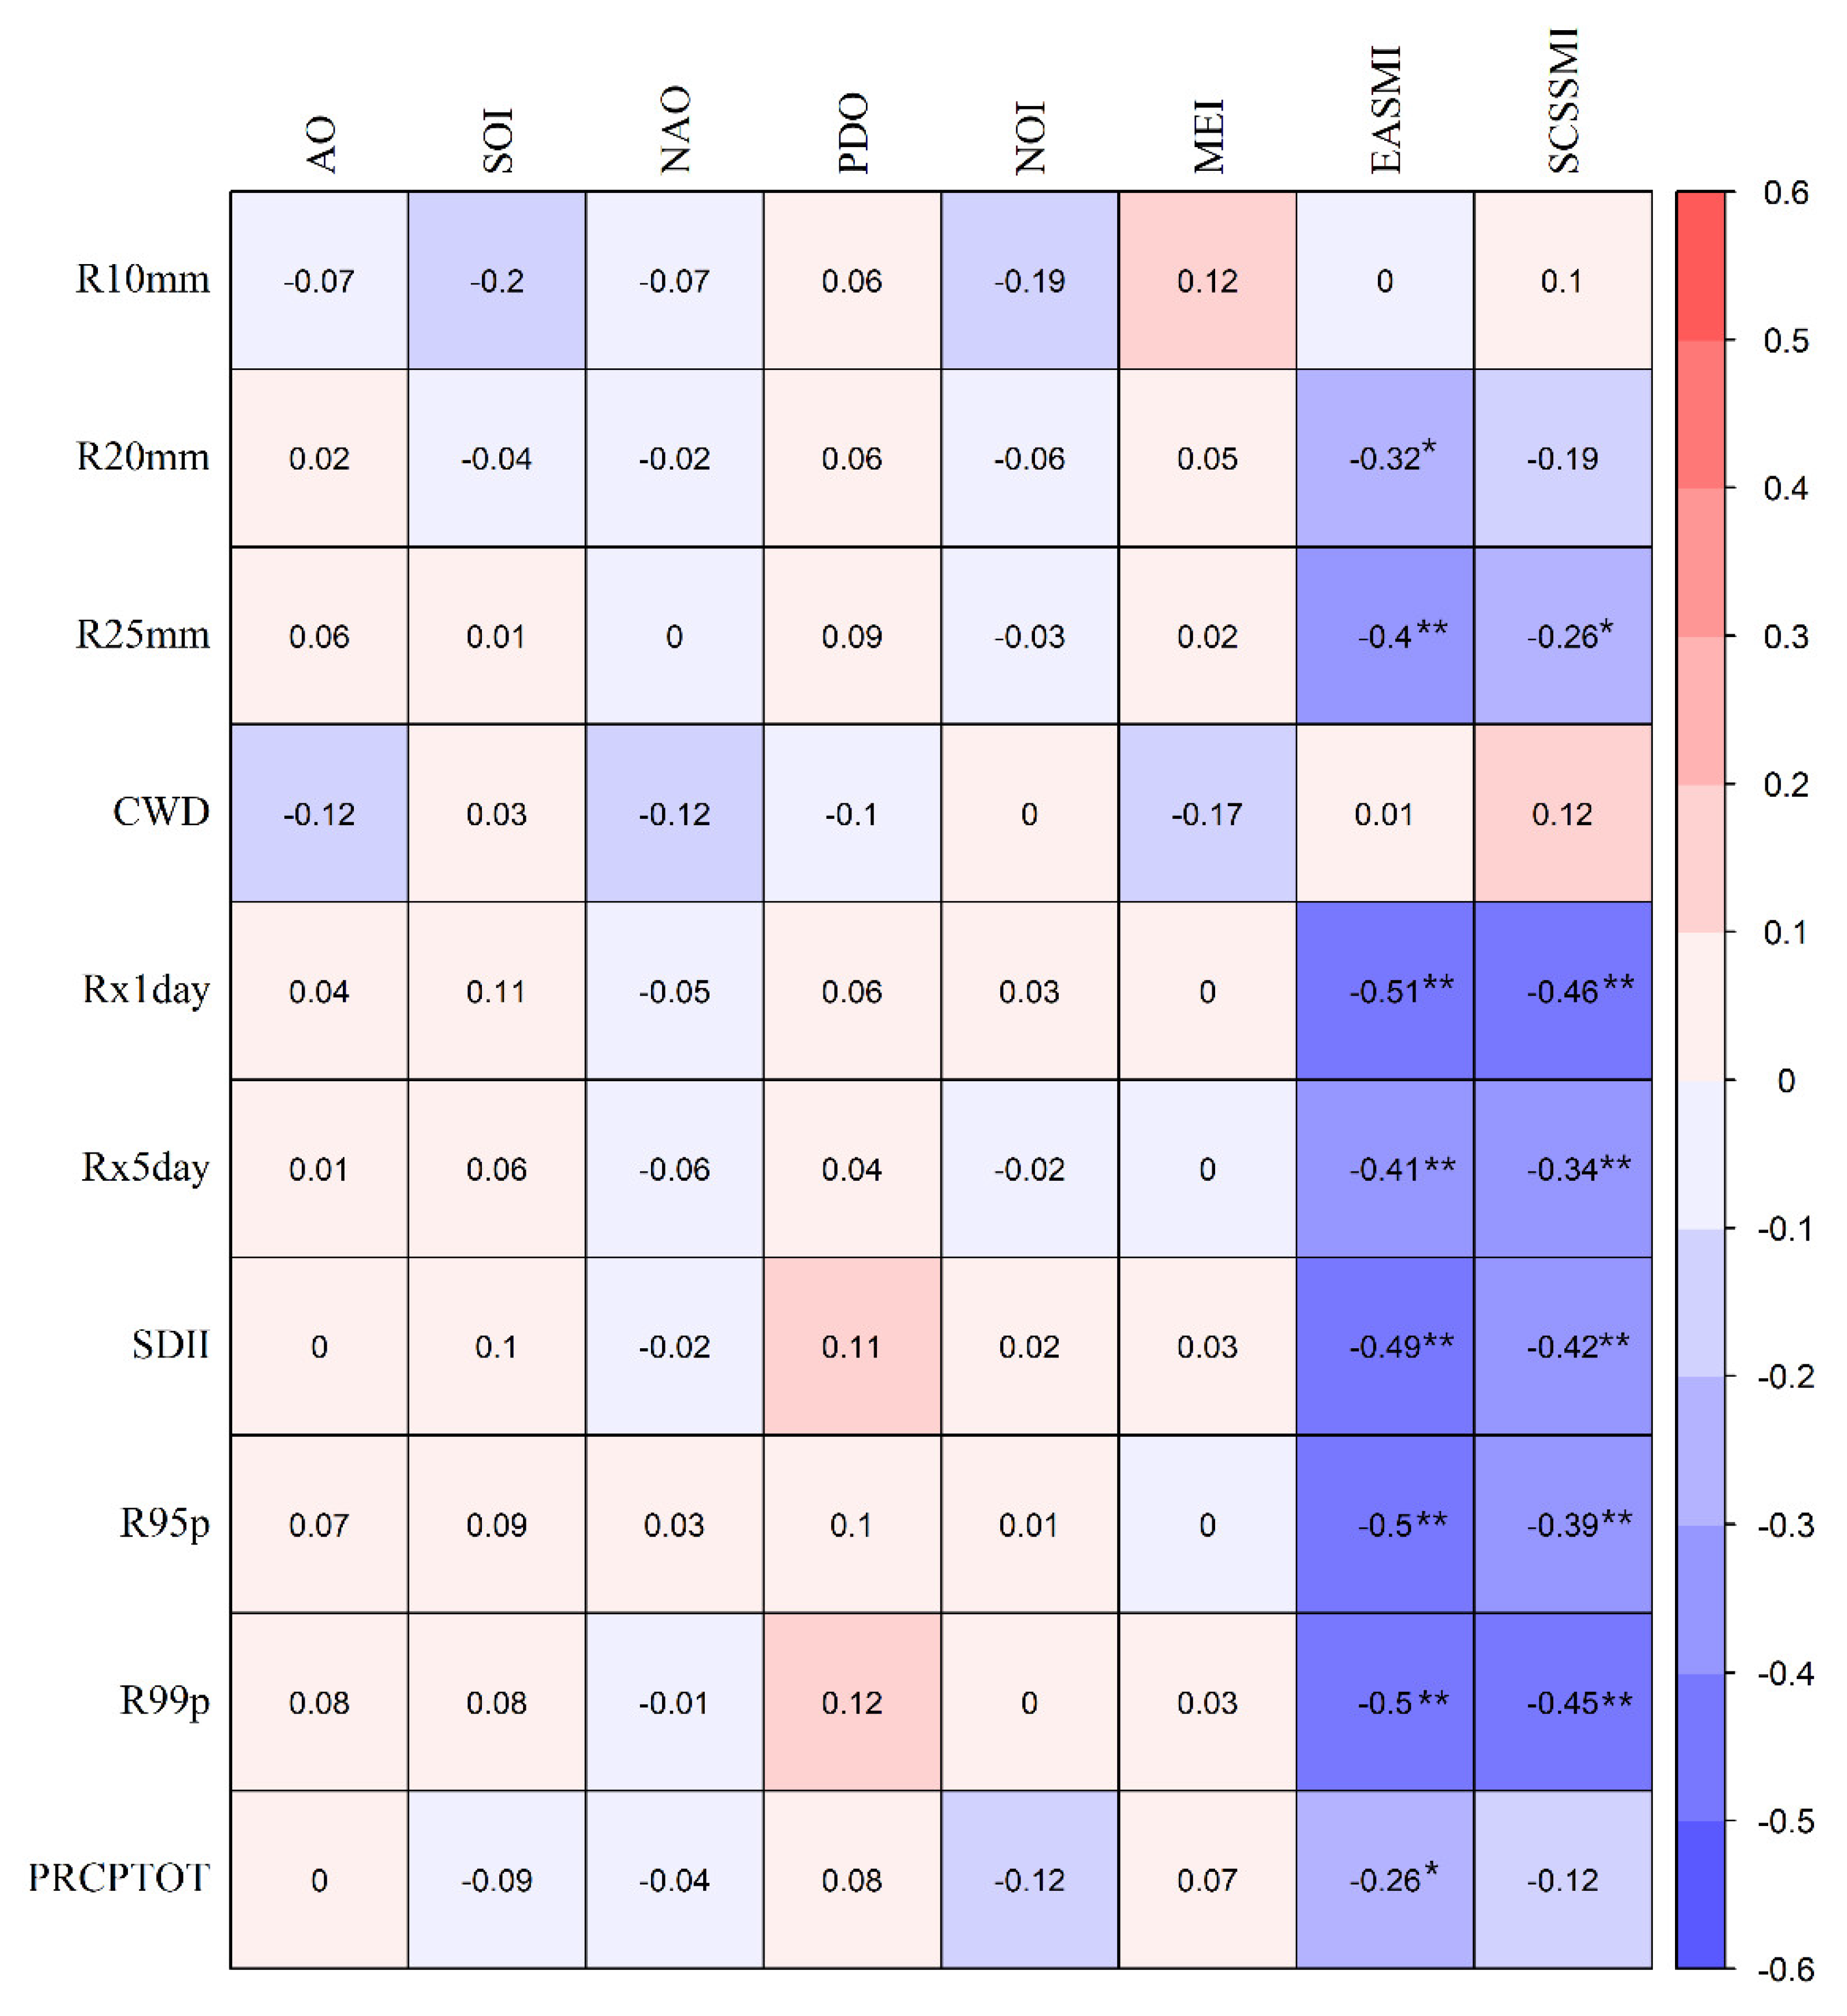
- Extreme precipitation indices except CWD are significantly positively correlated with annual total precipitation, and CWD is weakly associated with other extreme precipitation indicators except R10mm. Geographic factors, longitude, and elevation instead of latitude markedly affect extreme precipitation indices, except for CWD, in WMA. Precipitation extremes tend to decrease from east to west. Meanwhile, the extreme precipitation decreases with an increase in elevation. These results are correspondent with spatial patterns of average annual extreme precipitation indices over WMA. Global warming has a tendency to increase the intensities (Rx1day, Rx5day, R95p, R99p, and SDII) of extreme precipitation and decrease the maximum consecutive wet days (CWD) across WMA. Besides, climate warming tends to raise the frequency of precipitation in the east of WMA, but reduces the frequency of precipitation in the west of WMA. The effects of local warming on extreme precipitation are not exactly the same as that of global warming on precipitation extremes. Local warming is likely to decrease the frequency of extreme precipitation, the maximum length of wet days, annual total precipitation, and very wet days precipitation. However, the opposite effects of local temperature may occur on maximum one-day precipitation, extremely very wet days precipitation, and precipitation intensity. Different climate factors exert different effects on precipitation extremes. The influence of AO, SOI, NAO, PDO, NOI, and MEI on extreme precipitation is relatively weak in WMA. Compared with these climate variability indices, summer monsoon indices, such as EASMI and SCSSMI, have the most obvious impact on the extreme precipitation in WMA during 1960–2019. The weakening of these summer monsoon indices tends to bring the stronger intensity of extreme precipitation. The findings of this study highlight that it is essential to systematically explore the possible driving factors of variations in precipitation extremes in WMA, which is critical and helpful for natural disaster prevention and reduction and adaptive management in this region.
Supplementary Materials
Author Contributions
Funding
Institutional Review Board Statement
Informed Consent Statement
Data Availability Statement
Acknowledgments
Conflicts of Interest
References
- Madakumbura, G.D.; Thackeray, C.W.; Norris, J.; Goldenson, N.; Hall, A. Anthropogenic influence on extreme precipitation over global land areas seen in multiple observational datasets. Nat. Commun. 2021, 12, 3944. [Google Scholar] [CrossRef] [PubMed]
- Khaing, Z.M.; Zhang, K.; Sawano, H.; Shrestha, B.; Sayama, T.; Nakamura, K. Flood hazard mapping and assessment in data-scarce Nyaungdon area, Myanmar. PLoS ONE 2019, 14, e0224558. [Google Scholar] [CrossRef] [PubMed] [Green Version]
- Liu, S.; Huang, S.; Xie, Y.; Leng, G.; Huang, Q.; Wang, L.; Xue, Q. Spatial-temporal changes of rainfall erosivity in the Loess Plateau, China: Changing patterns, causes and implications. Catena 2018, 166, 279–289. [Google Scholar] [CrossRef]
- Wang, S.; Zhang, K.; van Beek, L.P.; Tian, X.; Bogaard, T.A. Physically-based landslide prediction over a large region: Scaling low-resolution hydrological model results for high resolution slope stability assessment. Environ. Modell. Softw. 2020, 124, 104607. [Google Scholar] [CrossRef]
- Shao, Y.; Mu, X.; He, Y.; Sun, W.; Zhao, G.; Gao, P. Spatiotemporal variations of extreme precipitation events at multi-time scales in the Qinling-Daba mountains region, China. Quat. Int. 2019, 525, 89–102. [Google Scholar] [CrossRef]
- Morrison, A.; Villarini, G.; Zhang, W.; Scoccimarro, E. Projected changes in extreme precipitation at sub-daily and daily time scales. Glob. Planet. Chang. 2019, 182, 103004. [Google Scholar] [CrossRef] [Green Version]
- Cardell, M.F.; Amengual, A.; Romero, R.; Ramis, C. Future extremes of temperature and precipitation in Europe derived from a combination of dynamical and statistical approaches. Int. J. Climatol. 2020, 40, 4800–4827. [Google Scholar] [CrossRef]
- Donat, M.G.; Lowry, A.L.; Alexander, L.V.; O’Gorman, P.A.; Maher, N. More extreme precipitation in the world’s dry and wet regions. Nat. Clim. Chang. 2016, 6, 508–513. [Google Scholar] [CrossRef]
- Zhou, B.; Xu, Y.; Wu, J.; Dong, S.; Shi, Y. Changes in temperature and precipitation extreme indices over China: Analysis of a high-resolution grid dataset. Int. J. Climatol. 2016, 36, 1051–1066. [Google Scholar] [CrossRef]
- Alexander, L.V.; Zhang, X.; Peterson, T.C.; Caesar, J.; Gleason, B.; Tank, A.M.G.K.; Haylock, M.; Collins, D.; Trewin, B.; Rahimzadeh, F.; et al. Global observed changes in daily climate extremes of temperature and precipitation. J. Geophys. Res. Atmos. 2006, 111, 1042–1063. [Google Scholar] [CrossRef] [Green Version]
- Fang, J.; Yang, W.; Luan, Y.; Du, J.; Lin, A.; Zhao, L. Evaluation of the TRMM 3B42 and GPM IMERG products for extreme precipitation analysis over China. Atmos. Res. 2019, 223, 24–38. [Google Scholar] [CrossRef]
- Guan, Y.; Zheng, F.; Zhang, X.; Wang, B. Trends and variability of daily precipitation and extremes during 1960–2012 in the Yangtze River Basin, China. Int. J. Climatol. 2017, 37, 1282–1298. [Google Scholar] [CrossRef]
- Gao, T.; Wang, H. Trends in precipitation extremes over the Yellow River basin in North China: Changing properties and causes. Hydrol. Processes 2017, 31, 2412–2428. [Google Scholar] [CrossRef]
- Mei, C.; Liu, J.; Chen, M.T.; Wang, H.; Li, M.; Yu, Y. Multi-decadal spatial and temporal changes of extreme precipitation patterns in northern China (Jing-Jin-Ji district, 1960–2013). Quat. Int. 2018, 476, 1–13. [Google Scholar] [CrossRef]
- Wentz, F.J.; Ricciardulli, L.; Hilburn, K.; Mears, C. How much more rain will global warming bring? Science 2007, 317, 233–235. [Google Scholar] [CrossRef]
- Allan, R.P.; Soden, B.J. Atmospheric warming and the amplification of precipitation extremes. Science 2008, 321, 1481–1484. [Google Scholar] [CrossRef] [Green Version]
- Alexander, L.V.; Uotila, P.; Nicholls, N. Influence of sea surface temperature variability on global temperature and precipitation extremes. J. Geophys. Res. Atmos. 2009, 114, D18116. [Google Scholar] [CrossRef]
- Wang, L.; Chen, S.; Zhu, W.; Ren, H.; Zhang, L.; Zhu, L. Spatiotemporal variations of extreme precipitation and its potential driving factors in China’s North-South Transition Zone during 1960–2017. Atmos. Res. 2021, 252, 105429. [Google Scholar] [CrossRef]
- IPCC. 2021: Summary for Policymakers. In Climate Change 2021: The Physical Science Basis. Contribution of Working Group I to the Sixth Assessment Report of the Intergovernmental Panel on Climate Change; Masson-Delmotte, V.P., Zhai, A., Pirani, S.L., Connors, C., Péan, S., Berger, N., Caud, Y., Chen, L., Goldfarb, M.I., Gomis, M., et al., Eds.; Cambridge University Press: Cambridge, UK, 2021; in press. [Google Scholar]
- Otto, F.E.L.; van Oldenborgh, G.J.; Eden, J.; Stott, P.A.; Karoly, D.J.; Allen, M.R. The attribution question. Nat. Clim. Chang. 2016, 6, 813–816. [Google Scholar]
- Perlwitz, J.; Knutson, T.; Kossin, J. Large-scale circulation and climate variability. In Climate Science Special Report: Fourth National Climate Assessment; Wuebbles, D.J., Fahey, D.W., Hibbard, K.A., Dokken, D.J., Stewart, B.C., Maycock, T.K., Eds.; U.S. Global Change Research Program: Washington, DC, USA, 2017; Volume I, pp. 161–184. [Google Scholar] [CrossRef]
- Mondal, A.; Mujumdar, P.P. Modeling non-stationarity in intensity, duration and frequency of extreme rainfall over India. J. Hydrol. 2015, 521, 217–231. [Google Scholar] [CrossRef]
- Li, X.; Zhang, K.; Gu, P.R.; Feng, H.T.; Yin, Y.F.; Chen, W.; Cheng, B.C. Changes in precipitation extremes in the Yangtze River Basin during 1960–2019 and the association with global warming, ENSO, and local effects. Sci. Total Environ. 2021, 760, 144244. [Google Scholar] [CrossRef]
- Papalexiou, S.M.; Montanari, A. Global and regional increase of precipitation extremes under global warming. Water Resour. Res. 2019, 55, 4901–4914. [Google Scholar] [CrossRef]
- Su, B.D.; Gemmer, M.; Jiang, T. Spatial and temporal variation of extreme precipitation over the Yangtze River Basin. Quat. Int. 2008, 186, 22–31. [Google Scholar] [CrossRef]
- Nie, C.; Li, H.; Yang, L.; Ye, B.; Dai, E.; Wu, S.; Liu, Y.; Liao, Y. Spatial and temporal changes in extreme temperature and extreme precipitation in Guangxi. Quat. Int. 2012, 263, 162–171. [Google Scholar] [CrossRef]
- Zhang, K.X.; Pan, S.; Cao, L.; Wang, Y.; Zhao, Y.; Zhang, W. Spatial distribution and temporal trends in precipitation extremes over the Hengduan Mountains region, China, from 1961 to 2012. Quat. Int. 2014, 349, 346–356. [Google Scholar] [CrossRef]
- Zhang, X.; Chen, Y.; Fang, G.; Li, Y.; Li, Z.; Wang, F.; Xia, Z. Observed changes in extreme precipitation over the Tienshan Mountains and associated large-scale climate teleconnections. J. Hydrol. 2022, 606, 127457. [Google Scholar] [CrossRef]
- Shang, Z.K.; Shao, K. Natural disasters in Wuling Mountainous Area. Minzu Trib. 2020, 2, 59–66. (In Chinese) [Google Scholar]
- Li, P.; Yu, Z.; Jiang, P.; Wu, C. Spatiotemporal characteristics of regional extreme precipitation in Yangtze River Basin. J. Hydrol. 2021, 603, 126910. [Google Scholar] [CrossRef]
- Lv, M.; Wu, S.J.; Chen, J.; Chen, C.; Wen, Z.; Huang, Y. Changes in extreme precipitation in the Yangtze River basin and its association with global mean temperature and ENSO. Int. J. Climatol. 2018, 38, 1989–2005. [Google Scholar]
- Miao, C.; Duan, Q.; Sun, Q.; Lei, X.; Li, H. Non-uniform changes in different categories of precipitation intensity across China and the associated large-scale circulations. Environ. Res. Lett. 2019, 14, 025004. [Google Scholar] [CrossRef]
- Gao, T.; Zhang, Q.; Luo, M. Intensifying effects of El Niño events on winter precipitation extremes in southeastern China. Clim. Dyn. 2020, 54, 631–648. [Google Scholar] [CrossRef]
- Yu, H.; Wang, L.; Yang, R.; Yang, M.; Gao, R. Temporal and spatial variation of precipitation in the Hengduan Mountains region in China and its relationship with elevation and latitude. Atmos. Res. 2018, 213, 1–16. [Google Scholar] [CrossRef]
- Croitoru, A.E.; Piticar, A.; Burada, D.C. Changes in precipitation extremes in Romania. Quat. Int. 2016, 415, 325–335. [Google Scholar] [CrossRef]
- You, Q.L.; Kang, S.C.; Aguilar, E.; Pepin, N.; Fluegel, W.A.; Yan, Y.P.; Xu, Y.W.; Zhang, Y.J.; Huang, J. Changes in daily climate extremes in China and their connection to the large scale climate variability during 1961–2003. Clim. Dyn. 2011, 36, 2399–2417. [Google Scholar] [CrossRef]
- Hu, W.; Yao, J.; He, Q.; Chen, J. Changes in precipitation amounts and extremes across Xinjiang (northwest China) and their connection to climate indices. PeerJ 2021, 9, e10792. [Google Scholar] [CrossRef]
- Du, H.; Xia, J.; Zeng, S.D. Regional frequency analysis of extreme precipitation and its spatio-temporal characteristics in the Huai River Basin, China. Nat. Hazards 2014, 70, 195–215. [Google Scholar] [CrossRef]
- Song, X.M.; Zhang, J.Y.; Zou, X.; Zhang, C.; AghaKouchak, A.; Kong, F. Changes in precipitation extremes in the Beijing metropolitan area during 1960–2012. Atmos. Res. 2019, 222, 134–153. [Google Scholar] [CrossRef]
- Yue, S.; Pilon, P.; Phinney, B.; Cavadias, G. The influence of autocorrelation on the ability to detect trend in hydrological series. Hydrol. Process. 2002, 16, 1807–1829. [Google Scholar] [CrossRef]
- Liu, S.Y.; Huang, S.; Huang, Q.; Xie, Y.; Leng, G.; Luan, J.; Song, X.; Wei, X.; Li, X. Identification of the non-stationarity of extreme precipitation events and correlations with large-scale ocean-climate variability patterns: A case study in the Wei River Basin, China. J. Hydrol. 2017, 548, 184–195. [Google Scholar] [CrossRef]
- Mann, H.B. Nonparametric tests against trend. Econometrica 1945, 13, 245–259. [Google Scholar] [CrossRef]
- Kendall, M.G. Rank Correlation Methods; Griffin: London, UK, 1975. [Google Scholar]
- Gu, X.H.; Zhang, Q.; Li, J.F.; Singh, V.P.; Sun, P. Impact of urbanization on nonstationarity of annual and seasonal precipitation extremes in China. J. Hydrol. 2019, 575, 638–655. [Google Scholar] [CrossRef]
- Zhang, Y.; Li, C.B.; Wang, L.M. Application and comparison of several test methods for changepoints diagnosis in streamflow variations. Water Resour. Hydro. Eng. 2020, 51, 38–47. [Google Scholar]
- Pettitt, A.N. A non-parametric approach to the change-point problem. Appl. Stat. 1979, 28, 126–135. [Google Scholar] [CrossRef]
- Sun, L. Drought Monitoring and Early Warning in Mountain and Hilly Area—A Case of Wuling Mountain Area. Ph.D. Dissertation, China Agricultural University, Beijing, China, 2014. [Google Scholar]
- Wotling, G.; Bouvier, C.; Danloux, J.; Fritsch, J.M. Regionalization of extreme precipitation distribution using the principal components of the topographical environment. J. Hydrol. 2000, 233, 86–101. [Google Scholar] [CrossRef]
- Zhang, Q.; Li, J.F.; Chen, X.H.; Bai, Y.G. Spatial variability of probability distribution of extreme precipitation in Xinjiang. Acta Geogr. Sin. 2011, 66, 3–12. [Google Scholar]
- Ahmed, K.; Shahid, S.; Chung, E.S.; Wang, X.J.; Bin Harun, S. Climate change uncertainties in seasonal drought severity-area-frequency curves: Case of arid region of Pakistan. J. Hydrol. 2019, 570, 473–485. [Google Scholar] [CrossRef]
- Gao, T.; Xie, L. Study on Progress of the Trends and Physical causes of Extreme Precipitation in China during the Last 50 Years. Adv. Earth Sci. 2014, 29, 577–589. [Google Scholar]
- Long, Y.Y.; Fan, G.Z.; Duan, L.; Feng, W.; Wang, Q.; Li, F.; Zhang, Y. A Study on the Characteristics of Summertime Extreme Precipitation Events over China in Recent 54 Years. Clim. Environ. Res. 2016, 21, 429–438. (In Chinese) [Google Scholar]
- Wang, J.; Jiang, Z.H.; Yan, M.L.; Zhang, J.L. Trends of extreme precipitation indices in the mid-lower Yangtze River valley of China during 1960-2005. Sci. Meteorol. Sin. 2008, 28, 384–388. (In Chinese) [Google Scholar]
- Liu, H.W.; Zhou, T.J.; Zhu, Y.X.; Lin, Y. The strengthening East Asia summer monsoon since the early 1990s. Chin. Sci. Bull. 2012, 57, 1553–1558. [Google Scholar] [CrossRef] [Green Version]
- Chen, D.; Zhou, F.; Dong, Z.; Zeng, A.Y.; Ou, T.; Fang, K. A tree-ring δ18O based reconstruction of East Asia summer monsoon over the past two centuries. PLoS ONE 2020, 15, e0234421. [Google Scholar] [CrossRef]
- Ding, Y.; Wang, Z.; Sun, Y. Inter-decadal variation of the summer precipitation in east China and its association with decreasing Asian summer monsoon. Part I: Observed evidences. Int. J. Climatol. 2007, 28, 1139–1161. [Google Scholar] [CrossRef]
- Trenberth, K.E. Changes in precipitation with climate change. Clim. Res. 2011, 47, 123–138. [Google Scholar] [CrossRef] [Green Version]
- Sharma, A.; Wasko, C.; Lettenmaier, D.P. If precipitation extremes are increasing, why aren’t floods? Water Resour. Res. 2018, 54, 8545–8551. [Google Scholar] [CrossRef]
- Tandon, N.F.; Zhang, X.; Sobel, A.H. Understanding the dynamics of future changes in extreme precipitation intensity. Geophys. Res. Lett. 2018, 45, 2870–2878. [Google Scholar] [CrossRef]
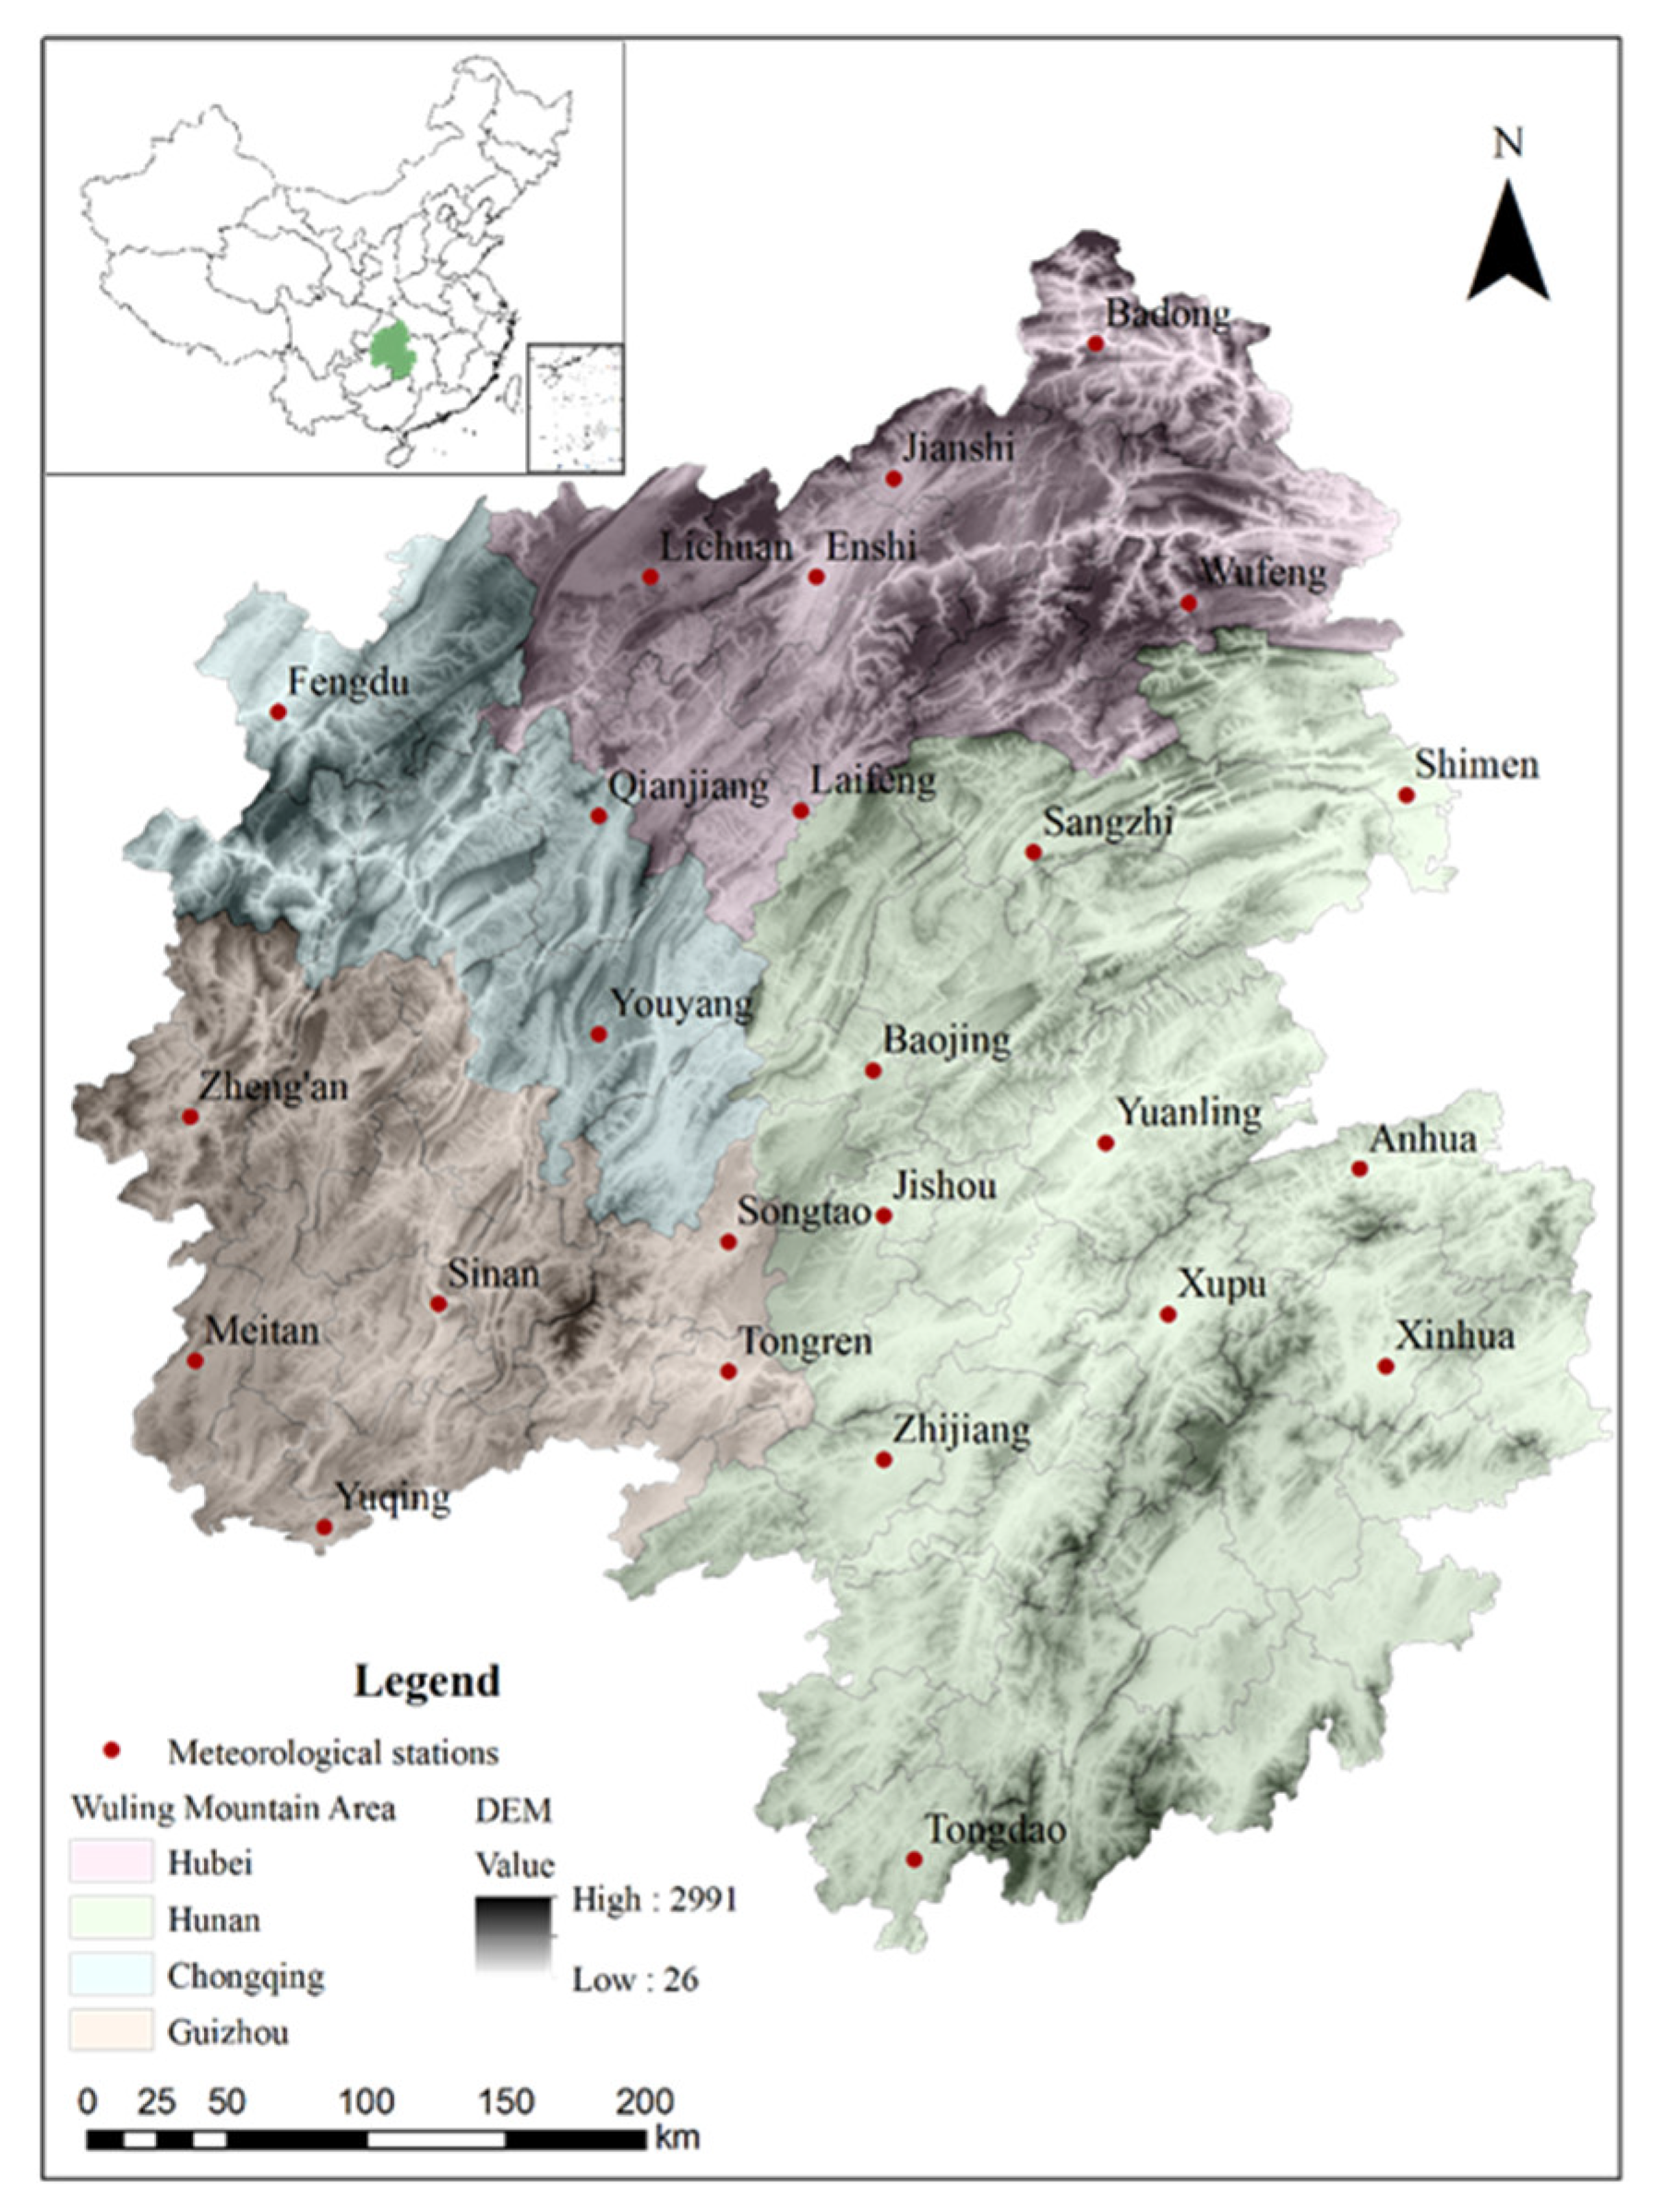




| ID | Station Name | Province | Latitude (°N) | Longitude (°E) | Elevation (m) |
|---|---|---|---|---|---|
| 1 | Fengdu | Chongqing | 29.85 | 107.73 | 290.5 |
| 2 | Qianjiang | Chongqing | 29.52 | 108.77 | 786.9 |
| 3 | Youyang | Chongqing | 28.82 | 108.77 | 826.5 |
| 4 | Meitan | Guizhou | 27.77 | 107.47 | 792.2 |
| 5 | Tongren | Guizhou | 27.73 | 109.18 | 353.2 |
| 6 | Sinan | Guizhou | 27.95 | 108.25 | 416.8 |
| 7 | Songtao | Guizhou | 28.15 | 109.18 | 406.1 |
| 8 | Yuqing | Guizhou | 27.23 | 107.88 | 622.1 |
| 9 | Zheng’an | Guizhou | 28.55 | 107.45 | 679.7 |
| 10 | Badong | Hubei | 31.03 | 110.37 | 334.0 |
| 11 | Enshi | Hubei | 30.28 | 109.47 | 457.1 |
| 12 | Jianshi | Hubei | 30.60 | 109.72 | 609.2 |
| 13 | Laifeng | Hubei | 29.53 | 109.42 | 502.8 |
| 14 | Lichuan | Hubei | 30.28 | 108.93 | 1074.1 |
| 15 | Wufeng | Hubei | 30.20 | 110.67 | 619.9 |
| 16 | Anhua | Hunan | 28.38 | 111.22 | 128.3 |
| 17 | Baojing | Hunan | 28.70 | 109.65 | 325.3 |
| 18 | Jishou | Hunan | 28.23 | 109.68 | 254.6 |
| 19 | Sangzhi | Hunan | 29.40 | 110.17 | 322.2 |
| 20 | Shimen | Hunan | 29.58 | 111.37 | 116.9 |
| 21 | Tongdao | Hunan | 26.17 | 109.78 | 397.5 |
| 22 | Xinhua | Hunan | 27.75 | 111.30 | 211.9 |
| 23 | Xupu | Hunan | 27.92 | 110.60 | 204.0 |
| 24 | Yuanling | Hunan | 28.47 | 110.40 | 151.6 |
| 25 | Zhijiang | Hunan | 27.45 | 109.68 | 272.2 |
| Indices Categories | Indices Abbreviation | Name | Definition | Unit |
|---|---|---|---|---|
| Frequency-based indices | R10mm | Days of heavy precipitation | Annual total days when precipitation ≥ 10 mm | days |
| R20mm | Days of very heavy precipitation | Annual total days when precipitation ≥ 20 mm | days | |
| R25mm | Days of extremely heavy precipitation | Annual total days when precipitation ≥ 25 mm | days | |
| Duration-based indices | CWD | Consecutive wet days | Maximum length of consecutive wet days (daily precipitation ≥ 1 mm) | days |
| Intensity-based indices | Rx1day | Maximum 1-day precipitation | Annual maximum 1-day precipitation | mm |
| Rx5day | Maximum 5-day precipitation | Annual maximum consecutive 5-day precipitation | mm | |
| SDII | Simple daily intensity index | Annual total wet-day precipitation divided by the number of wet days | mm/day | |
| R95p | Precipitation in very wet days | Annual total precipitation when daily precipitation > 95th percentile | mm | |
| R99p | Precipitation in extremely wet days | Annual total precipitation when daily precipitation > 99th percentile | mm | |
| PRCPTOT | Annual total wet day precipitation | Annual total precipitation on wet days | mm |
| R10mm | R20mm | R25mm | CWD | Rx1day | Rx5day | SDII | R95p | R99p | PRCPTOT | |
|---|---|---|---|---|---|---|---|---|---|---|
| R10mm | 1.00 | 0.84 ** | 0.77 ** | 0.42 ** | 0.30 * | 0.46 ** | 0.44 ** | 0.50 ** | 0.39 ** | 0.91 ** |
| R20mm | 1.00 | 0.97 ** | 0.18 | 0.61 ** | 0.66 ** | 0.78 ** | 0.81 ** | 0.69 | 0.95 ** | |
| R25mm | 1.00 | 0.14 | 0.70 ** | 0.73 ** | 0.84 ** | 0.89 ** | 0.77 ** | 0.94 ** | ||
| CWD | 1.00 | −0.11 | 0.09 | −0.09 | −0.02 | −0.11 | 0.28 * | |||
| Rx1day | 1.00 | 0.83 ** | 0.83 ** | 0.89 ** | 0.95 ** | 0.63 ** | ||||
| Rx5day | 1.00 | 0.78 ** | 0.85 ** | 0.84 ** | 0.70 ** | |||||
| SDII | 1.00 | 0.93 ** | 0.88 ** | 0.69 ** | ||||||
| R95p | 1.00 | 0.94 ** | 0.80 ** | |||||||
| R99p | 1.00 | 0.71 ** | ||||||||
| PRCPTOT | 1.00 |
| Extreme Precipitation Indices | Longitude | Latitude | Altitude |
|---|---|---|---|
| R10mm | 0.76 ** | −0.07 | −0.39 |
| R20mm | 0.80 ** | 0.00 | −0.42 * |
| R25mm | 0.80 ** | 0.00 | −0.45 * |
| CWD | 0.30 | −0.20 | 0.06 |
| Rx1day | 0.70 ** | 0.02 | −0.49 * |
| Rx5day | 0.76 ** | −0.03 | −0.46 * |
| SDII | 0.90 ** | 0.16 | −0.63 ** |
| R95p | 0.69 ** | −0.19 | −0.45 * |
| R99p | 0.53 ** | −0.33 | −0.42 * |
| PRCPTOT | 0.76 ** | −0.05 | −0.39 |
| Extreme Precipitation Indices | Global Temperature |
|---|---|
| R10mm | −0.10 |
| R20mm | 0.02 |
| R25mm | 0.08 |
| CWD | −0.48 ** |
| Rx1day | 0.26 * |
| Rx5day | 0.13 |
| SDII | 0.20 |
| R95p | 0.21 |
| R99p | 0.34 ** |
| PRCPTOT | 0.05 |
Publisher’s Note: MDPI stays neutral with regard to jurisdictional claims in published maps and institutional affiliations. |
© 2022 by the authors. Licensee MDPI, Basel, Switzerland. This article is an open access article distributed under the terms and conditions of the Creative Commons Attribution (CC BY) license (https://creativecommons.org/licenses/by/4.0/).
Share and Cite
Du, H.; Xia, J.; Yan, Y.; Lu, Y.; Li, J. Spatiotemporal Variations of Extreme Precipitation in Wuling Mountain Area (China) and Their Connection to Potential Driving Factors. Sustainability 2022, 14, 8312. https://doi.org/10.3390/su14148312
Du H, Xia J, Yan Y, Lu Y, Li J. Spatiotemporal Variations of Extreme Precipitation in Wuling Mountain Area (China) and Their Connection to Potential Driving Factors. Sustainability. 2022; 14(14):8312. https://doi.org/10.3390/su14148312
Chicago/Turabian StyleDu, Hong, Jun Xia, Yi Yan, Yumeng Lu, and Jinhua Li. 2022. "Spatiotemporal Variations of Extreme Precipitation in Wuling Mountain Area (China) and Their Connection to Potential Driving Factors" Sustainability 14, no. 14: 8312. https://doi.org/10.3390/su14148312
APA StyleDu, H., Xia, J., Yan, Y., Lu, Y., & Li, J. (2022). Spatiotemporal Variations of Extreme Precipitation in Wuling Mountain Area (China) and Their Connection to Potential Driving Factors. Sustainability, 14(14), 8312. https://doi.org/10.3390/su14148312


