1. Introduction
Currently, CO
2 emissions from the worldwide operation and construction of buildings account for around 37% of the total CO
2 emissions [
1]. In a highly dynamic built environment, as in China, the proportion of the building-related greenhouse gas emissions in all of the life cycle processes to the national total is even higher (up to 51% in 2018 [
2]). With the ever stricter standards for energy conservation and emissions reduction in the building sector, the relative proportion of the embodied energy and environmental impacts of buildings’ components and materials has also increased [
3]. At the same time, technical measures for green buildings may increase the cost of initial construction. The economic benefits of building construction should be examined from a long-term perspective. The application of the life cycle assessment (LCA) and life cycle cost (LCC) methods in the built environment have gained significant traction as essential methods for building sustainability assessment following the publication of ISO 14040 [
4] and ISO 21929 [
5].
There are often differences between a green building’s life cycle environmental and economic benefits [
6]. Previous studies have shown that there is a tradeoff relationship between a building’s operational and embodied energy [
7], and between its investment cost and LCC. Therefore, an optimization subjected to LCA and LCC, taking the life cycle environmental impacts and cost as the coupling objectives, can improve a green building’s overall performance by maintaining balance between the objectives.
Decisions in the early stage of the architectural design process are crucial to reducing a building’s life cycle impacts, because 70% of the decisions related to the project’s sustainability are made at this stage [
8]. Traditional building performance simulation lags behind this stage, and it is not easy to perform comprehensive simulations on various parameter combinations. Meanwhile, the integrated LCA method is generally not applied to help architects to select design solutions at the early design stage because it is time and information consuming [
9]. The information integration function of building information modelling (BIM) software helps to conduct LCA and LCC analysis, such as One Click LCA [
10] for the early comparison and selection of the design schemes, and the Revit Plugin program Tally [
11], which can assist in the selection of building material solutions in a BIM model, and conduct a complete building LCA. However, due to the limitation of manual variable settings, it is difficult to support the automatic feedback of calculation results and the screening of a large number of design parameter combinations. The parametric design platform can support the automatic generation of design variables and the linkage to the life cycle inventory (LCI) data and to the energy simulation program [
12]. It can significantly improve the efficiency and accuracy of performance optimization through the combination with the optimization algorithm.
Although a number of studies on parametric LCA have considered both environmental impacts and cost, the design diversity has not been fully taken into account with the consideration of both the design parameters and processes [
13]. This study links components/materials’ LCI and cost data with the building’s geometric model based on the parametric design platform, assisting architects (decision-makers) to select the optimal solutions in the early design stage.
2. Literature Review
Decisions in the early design stage are essential to reducing buildings’ life cycle environmental impacts and cost [
14]. The studies reviewed are all concerned with multi-objective optimization processes that target building performance in the early design stage. In terms of summarizing the variables, the varieties of the material variables are not analyzed because building performance design based on LCA/LCC methods necessarily involves material selection. In this stage, geometric design parameters are the most intuitive elements to consider, and it is found through the review that studies with life cycle impacts or cost as targets tend to consider the geometric variables in a simple way, while studies that consider building form diversity as an innovative point often do not include the target of calculating life cycle performance (
Table 1). The studies reviewed are grouped into two categories. The first category focuses on the generation of geometric forms. The second category focuses on the design process of the project.
Table 1.
Review of the literature on classification based on design diversity and LCA relevance.
Table 1.
Review of the literature on classification based on design diversity and LCA relevance.
| Category | Year | Authors | Geometric Variables | Life Cycle Objectives |
|---|
| Basics | Characteristics | Operational Energy | Embodied Energy | Economy | Others |
|---|
| Orientation | Plan | wwr |
|---|
| Geometry: free-form | 2019 | Si et al. [15] | | | | Eave depth by 10 variables | √ a | | | predicted percentage dissatisfied |
| 2015 | Negendahl et al. [16] | | | | Amplitude of façade fold | √ | | cost | daylight |
| 2014 | Jin et al. [17] | | | | Free-form mass controled by 5 variables | √ | | | |
| 2009 | Yi et al. [18] | | | | Controlling points of surface | √ | | | |
| Geometry: mass-box | 2020 | Harter et al. [19] | √ | √ | | 7 different plans | √ | primary energy | | |
| 2019 | Shadram et al. [20] | √ | √ | √ | | √ | embodied energy | | |
| 2017 | Yang et al. [21] | | | √ | Sunshade board length | √ | | envelope construction cost | |
| 2016 | Brunelli et al. [22] | | | | Building footprint | √ | CO2 emission | net present value of the investment | comfort level |
| 2013 | Basbagill et al. [9] | | √ | √ | Number of buildings, number of floors | √ | CO2 emission | | |
Design
process | 2021 | Abbasi et al. [23] | | | | | √ | embodied energy, renewable energy | operation cost, embodied cost | |
| 2019 | Ascione et al. [24] | √ | | | | √ | primary energy, CO2 emission | global cost | |
| 2019 | Li et al. [25] | √ | | √ | | √ | primary energy | global cost, investment cost | |
| 2018 | Shadram et al. [7] | | | | | √ | primary energy | | |
| 2017 | Ascione et al. [26] | | | √ | Overhang projection ratio | √ | | LCC | |
| 2016 | Hollberg et al. [12] | | | | | | non-renewable primary energy | | |
2.1. Geometric Variables Focused
The studies reviewed in
Section 2.1.1 are cases with unique form generation logic (free-form) due to the uniqueness of the solutions, and some of these studies do not include life cycle objectives. In
Section 2.1.2, the form generation logic is weaker than that described in
Section 2.1.1. The geometric models are based on operational energy consumption calculation zones (mass-box). Life cycle performance is considered in all of the studies in the second part.
2.1.1. Free-Form Geometry
The geometric design parameters of a building have a significant effect on its appearance and performance. To support the diversity of architectural design, while considering the concision of the model required for the energy simulation and the optimization process, some researchers have studied the parametric definition of the geometric model in the early design stage.
Jin et al. [
17] defined the shape of the building as a polygon, controlling the shape by changing the polygonal shape and twisting angle of the upper and lower bottom surfaces; Si et al. [
15] controlled the generation of the roof using the degree of deviation of ten points of the irregular polygonal roof from the center coordinates, in order to affect the indoor environment objectives. Negendahl et al. [
16] investigated the relationship between the number and amplitude variables of façade folds and building energy consumption. Yi et al. [
18] controlled building forms by defining the hierarchical relationship between geometry points to explore the building geometry without being restricted to a box or simple form.
2.1.2. Mass-Box Geometry
The above studies used specific geometric variables to study specific building models without LCA- or LCC-related objectives. In studies involving LCA, the formulation of geometric variables is often simplified from “free-form” to “mass-box”.
Basbagill et al. [
9] took an H-shaped plane as a prototype and generated building plans with different proportions and shapes by adjusting each side’s parameters. The geometric parameters of this plan’s outer contour and the envelope structure’s construction layers and their thickness were used as variables that were subjected to a sensitivity study. Shadram et al. [
20] classified the plan shapes of typical residential buildings into six types (“□”, “U”, “H”, “L”, “T”, “×”), the geometric variables of the outer contour and the inner contour were set for each basic shape, and optimization was carried out with the objectives of building’s operational and embodied energy consumption. Harter et al. [
19] investigated the uncertainty of variables regarding the life cycle total energy under seven plan shapes (“□”, “+”, “L”, “U”, “H”, “T”, “□ with basement”). Yang et al. [
21] set the windows’ number, unit width, unit length and sunshade board length as geometric variables to optimize the envelope construction cost and thermal energy demand. Brunelli et al. [
22] studied a case with alternative building footprints to optimize thermal energy demand, and net present value of the investment and CO
2 emissions.
The above studies set the building plan’s geometric variables, elevation, or spatial position relationship based on the “mass-box” model and obtained a more diverse early design stage simplified model. This way of defining geometric variables appears in a large number of studies involving building performance. Some of them also added variables such as the shape of shading components and the verandas that do not change the main form of the building. Because the “mass-box” modelling approach is commonly used, this study only exemplifies studies that involve life-cycle impacts or cost in the objective.
2.2. Design Process Focused Life Cycle Performance Optimization
Due to the large decision space formed by the variables and objectives, searching for the best solution is inefficient and complicated for architects. Because of the complexity of the LCA and LCC methods, improvement of the design process is a more important part of the optimization. Geometric forms are not the focus in these following studies.
Hollberg and Ruth [
12] designed a single-objective optimization process with the objective of non-renewable primary energy consumption by using the parametric platform Grasshopper (GH) and the optimization plug-in Goat. Several plans pre-set by the architects were analyzed and compared, and then insulation material, thickness, and external window alternatives were set as variables to be automatically optimized. The authors pointed out that the current LCA calculation is a time-consuming task, and architects usually did not have relevant knowledge and experience. Meanwhile, the information about the materials, the structures, and the service system required for LCA is often not available in the early design stages.
Shadram et al. [
7] combined the comprehensive advantages of building information in the BIM platform with the mature energy analysis tool and the optimization capabilities of the parametric platform to study a small apartment building in one country under four different climate zones. This process used gbxml format files to transfer geometric information, using the MySQL database to transfer material information, linking BIM software and the multi-objective optimization module in GH to achieve a fully automatic optimization process. This method required a higher level of development (LOD) of the model, and the geometric parameters such as building shapes were not set as variables. It was more suitable for the later stages of the design process.
Abbasi et al. [
23] also combined BIM and parametric platforms. The building was originally developed in Revit, containing geometric component information. The geometrical data and amount of materials were extracted as input data in the Athena software to calculate embodied energy, renewable energy consumption, and other LCA indicators such as GWP. The three-dimensional model was introduced into GH to regenerate the model for operational energy optimization of the building, using Ladybug and Honeybee plugins. The optimized results were then added to Navisworks, another BIM platform, in the format of database information to create a higher LOD model. In the above-mentioned workflows, the geometric parameters were defined in the original Revit model. The overall design process enhanced the model’s information, but the method was unidirectional and could not reverse the early concept of the project. The optimization focused on materials and equipment rather than aesthetic design.
The studies mentioned above adopted the idea of optimizing building performance in one step. Ascione et al. [
26] performed the optimization in stages. In the first stage, the objectives of optimization were the minimization of thermal energy needs for space heating and cooling. In the second stage, an intelligent search strategy was carried out to identify the robust cost-optimal retrofit solutions of the whole building system. Finally, a careful decision-making process was performed to find a recommended retrofit package among the 12 cost-optimal solutions found in stage two. This approach was applied to the design of a building energy retrofit. The variables were limited to material and equipment.
Another study from Ascione et al. [
24] presented a three-phase framework for multi-objective optimization. Phase One was a three-objective (annual thermal energy demand for space conditioning, annual electrical energy demand for artificial lighting, annual percentage of discomfort hours) Pareto optimization of building geometry, HVAC operation, and the envelope. Phase Two was a smart exhaustive sampling running within Pareto solutions provided by Phase One with another three objectives (primary energy consumption, global cost, investment cost). Phase Three selected the design solutions provided by decision-makers according to the optimal solution sets as well as the other performance indicators. Due to the calculation of objectives in phases, the optimal solutions in each phase were not global. The building geometric variables considered in the study were not as detailed as the HVAC or material ones.
Li et al. [
25] proposed a coordinated optimal design method. An iterative approach was adopted to coordinate multi-stage optimizations of the building envelope and the energy systems. The envelope design and the energy system design were optimized iteratively using the updated design of each other until the coordinating design variables converged. A zero-carbon building was tested and the objectives’ results were better compared with existing multi-stage design methods. The premise of this method was that there existed a clear trade-off relationship between the objectives in the different steps of the optimization process.
3. Methodology
The proposed literature review shows that the multi-objective optimization process for building performance involving LCA/LCC is complex. There are issues such as geometric form, materials, equipment, as well as optimization algorithms and design processes to be considered. Previous studies have not wholly addressed the aspects of free-form-based project models, comprehensive performance objectives, and design process combining multi-objective optimization in the early stages of building design. Simplification of any aspect at the early design stage may have impacts on the final solution. Moreover, there is a nonlinear relationship between buildings’ environmental and economic performance. Therefore, setting optimizing variables based only on the project model at a certain stage of the design process, or optimizing the layout, shape, material, structure and equipment parameters separately according to the general design process step by step, may not be able to obtain the overall optimal solution, nor to the environmental impacts and cost targets.
This study establishes an adaptive geometric variable definition method based on its functional space requirements and site conditions. It compensates for the neglect and simplification of the geometric diversity for the optimization process from the LCA/LCC perspective in the early design stage.
This study also compares the optimal solution sets and corresponding building performance of a case project under three different workflows as part of the design process. On this basis, the appropriate workflow could be proposed for optimizing the life cycle performance of a building in the early design process.
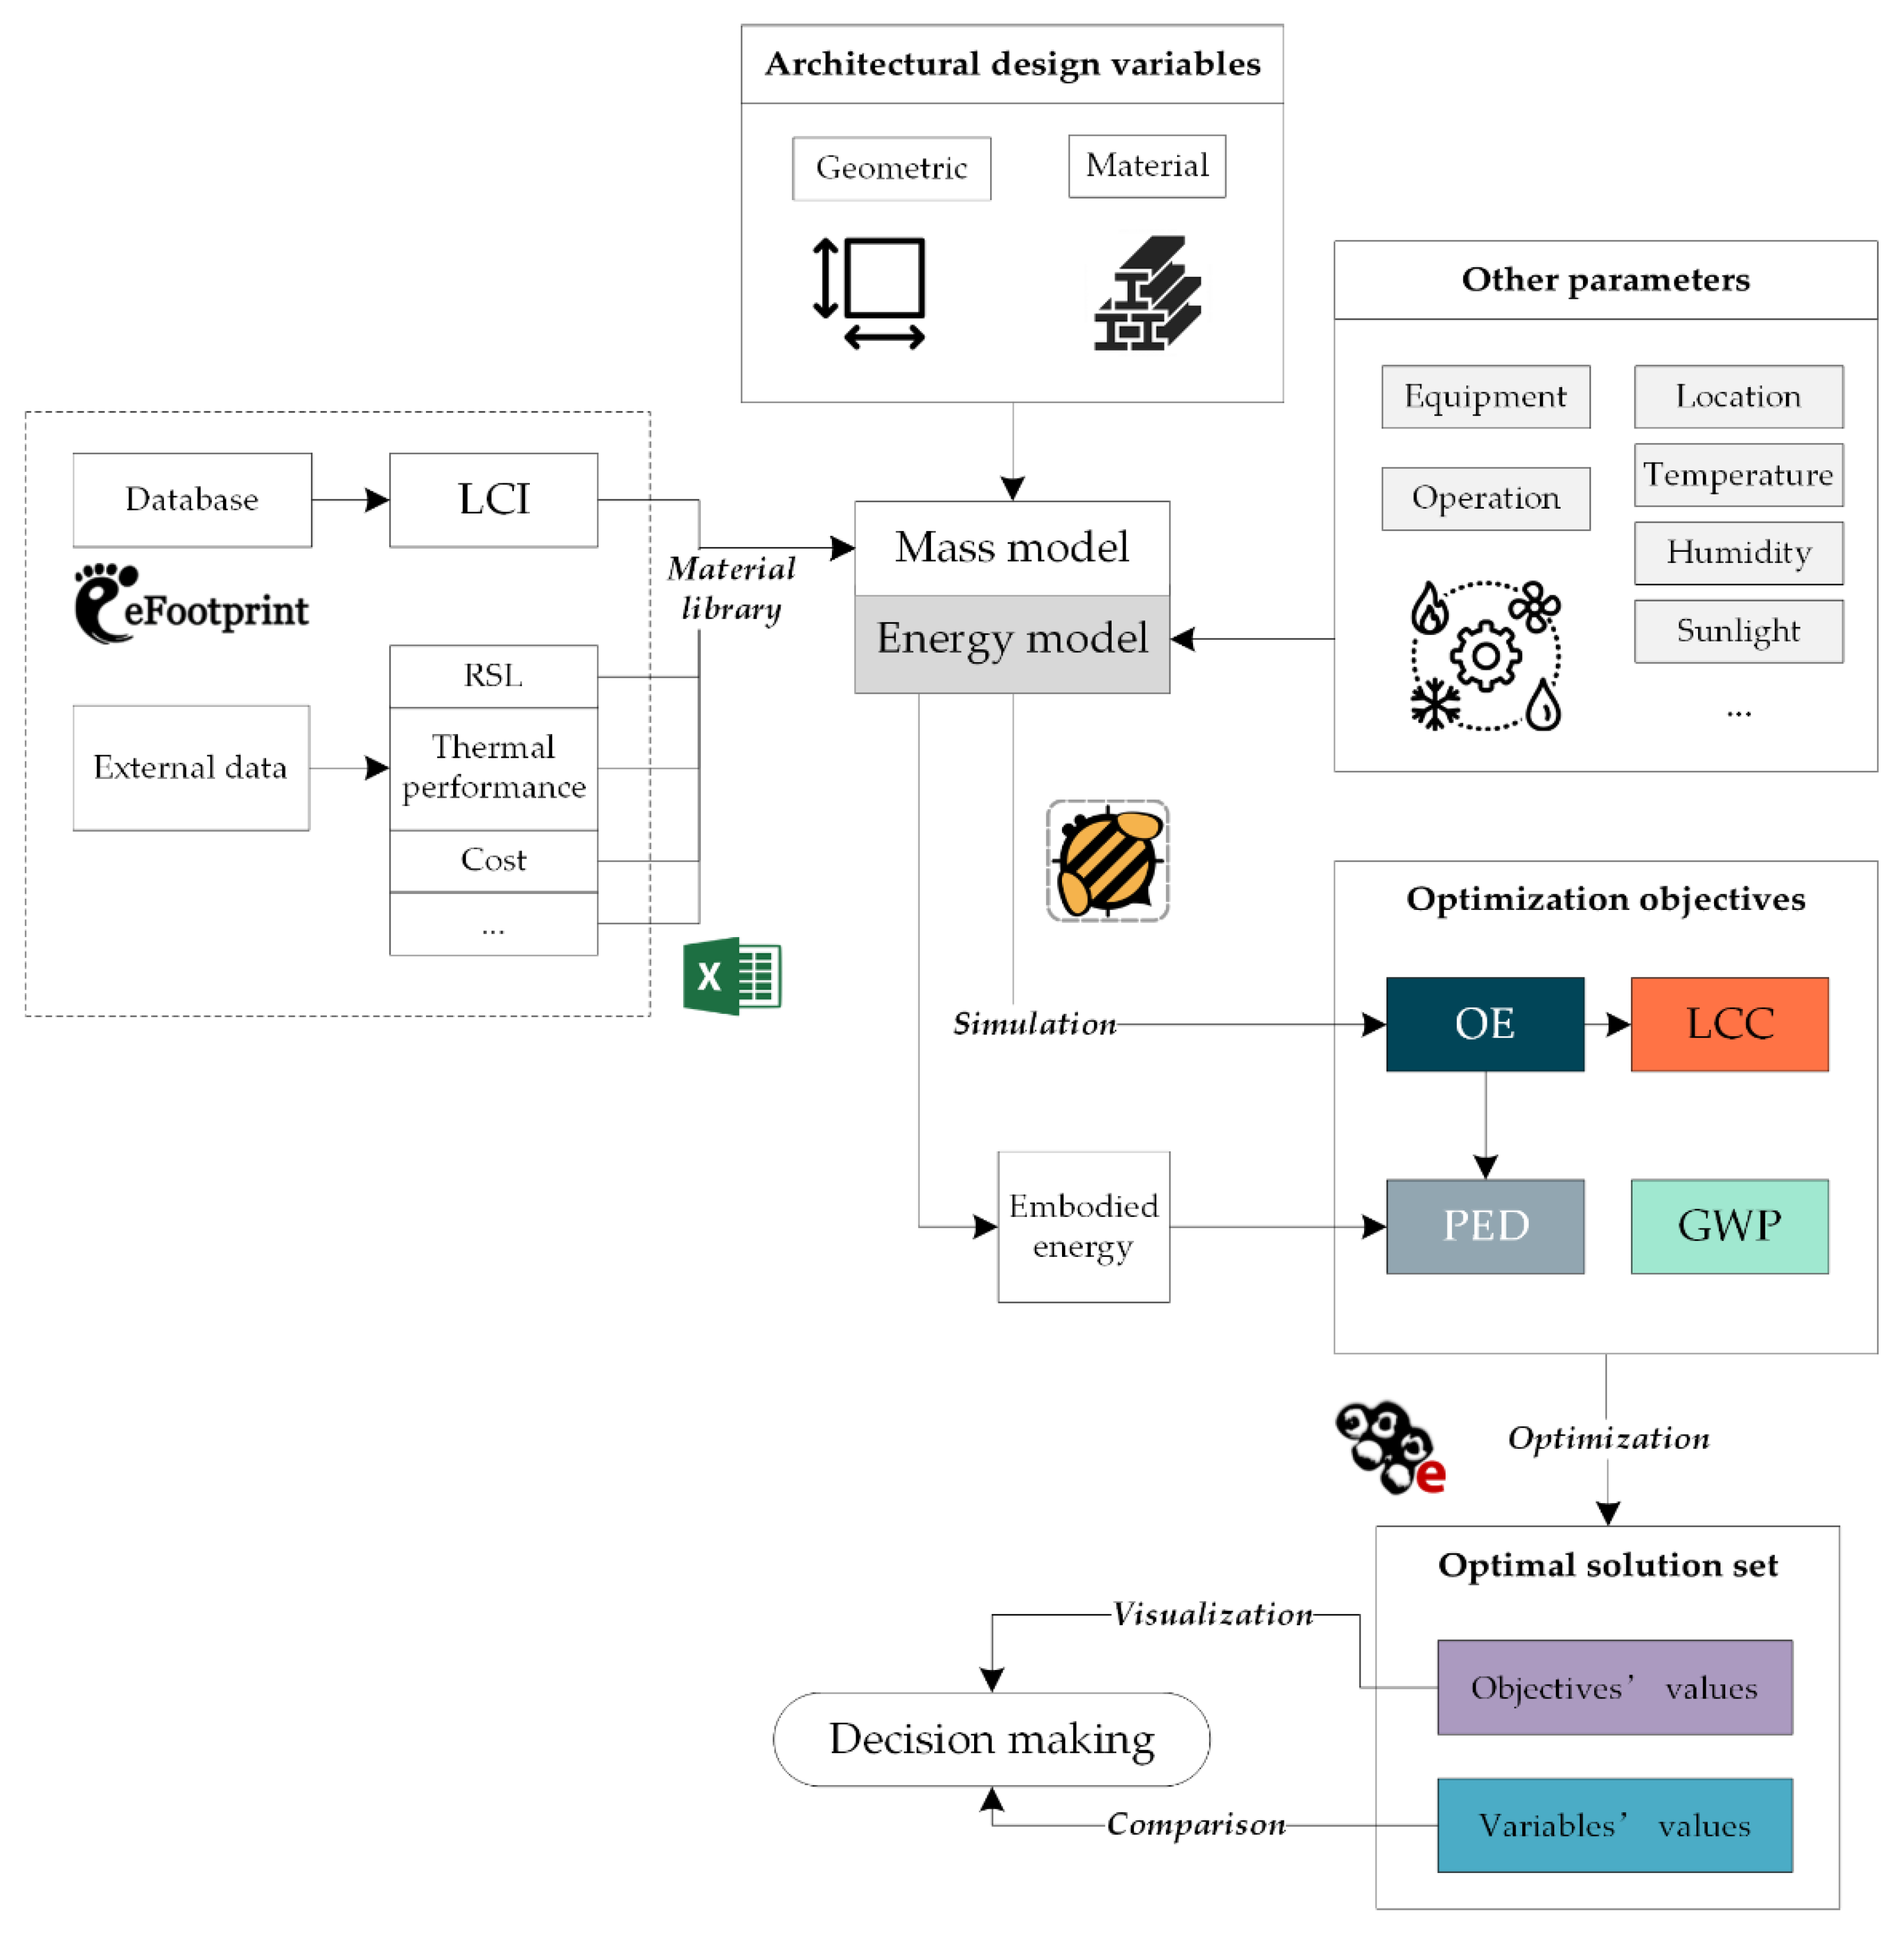
Figure 1 shows the proposed framework of the study, which comprises the following steps: variables setting, objectives setting, database importing, optimization, and decision-making.
3.1. Parametric Model with Variables
A building’s performance simulation in the early design stage is usually based on a simplified geometric model representing the building’s shape and space, in which each mass represents a single functional zone, and different geometric masses need to be calculated separately. However, in this study, the geometric variables adopt the modelling logic of linkage between masses: the model is divided into multiple zones according to their functions while the total area and the area of each zone are fixed.
The material variables include the window types, thickness, and building envelope’s insulation. As for the other parameters, the commonly used HVAC equipment system templates are often chosen as default values in the early design stage. Therefore, the influence of the equipment system parameters on operational and embodied energy is relatively fixed, so these parameters are not set as variables in this study.
3.2. Objectives Setting
According to the authors’ previous study [
27], the life cycle performance optimization objectives selected in this study include primary energy demand (PED, in kWh/m
2/a), global warming potential (GWP, expressed in CO
2 equivalent, in kg CO
2-e/m
2/a) a), life cycle cost (LCC, in yuan/m
2), and operational energy (OE, in kWh/m
2/a).
Since the existing norms have not yet set the above indicators’ benchmark values, this study seeks to obtain the solution set with the minimum value of each indicator.
Since operational energy has the largest impact on the energy consumption and carbon emissions of a building’s life cycle, it is another optimization objective to constrain the design process and optimization results. The Standard for Energy Consumption of Buildings [
28] (GB/T51161-2016) stipulates the constraint and guide values for the three types of public buildings’ operational energy, not including exhibition buildings. Taking the office buildings of category B for party and government agencies as an example, the constraint value in cold areas is 70 kWh/m
2/a, and the guide value is 50 kWh/m
2/a, including HVAC systems, lighting, hot water, elevators, etc.
The Design Standard for Energy Efficiency of Public Buildings [
29] (GB50189-2015) and corresponding local standards provide a series of regulations for building thermal design parameters, providing a reference for the value range of variables for this study.
3.3. Database Importing
The LCI data of building components and materials also influence the LCA results [
30]. Commonly used international LCI databases in building LCA include the Ecoinvent [
31] database developed in Switzerland, the Gabi [
32] and ÖKOBAUDAT [
33] databases in Germany, the IMPACT [
34] database in the UK, etc. This study mainly uses the CLCD database (accessed through Efootprint [
35]) developed in China, and in the case of missing data we refer to the international Ecoinvent and ÖKOBAUDAT databases (
Appendix B).
3.4. Workflow
Firstly, the LCI information of materials are collected from the database and imported into GH as an Excel file. Then, the data are linked to a parametric geometric model to generate the building model containing the complete information. Next, the Honeybee [
36] component is used after completing the geographical location, equipment, running time, and other information of the model to calculate the building’s operational energy consumption. The environmental impacts and LCC of the project are estimated by pairing the material quantity and energy consumption with the LCI data. Finally, the objectives are optimized by the genetic algorithm through the Octopus [
37] component to obtain the optimal solution set. The combinations of variables’ and objectives’ values can be exported to Design Explorer [
38] for results visualization. A final decision can be made from the perspective of variety and performance (
Figure 1).
4. Case Study
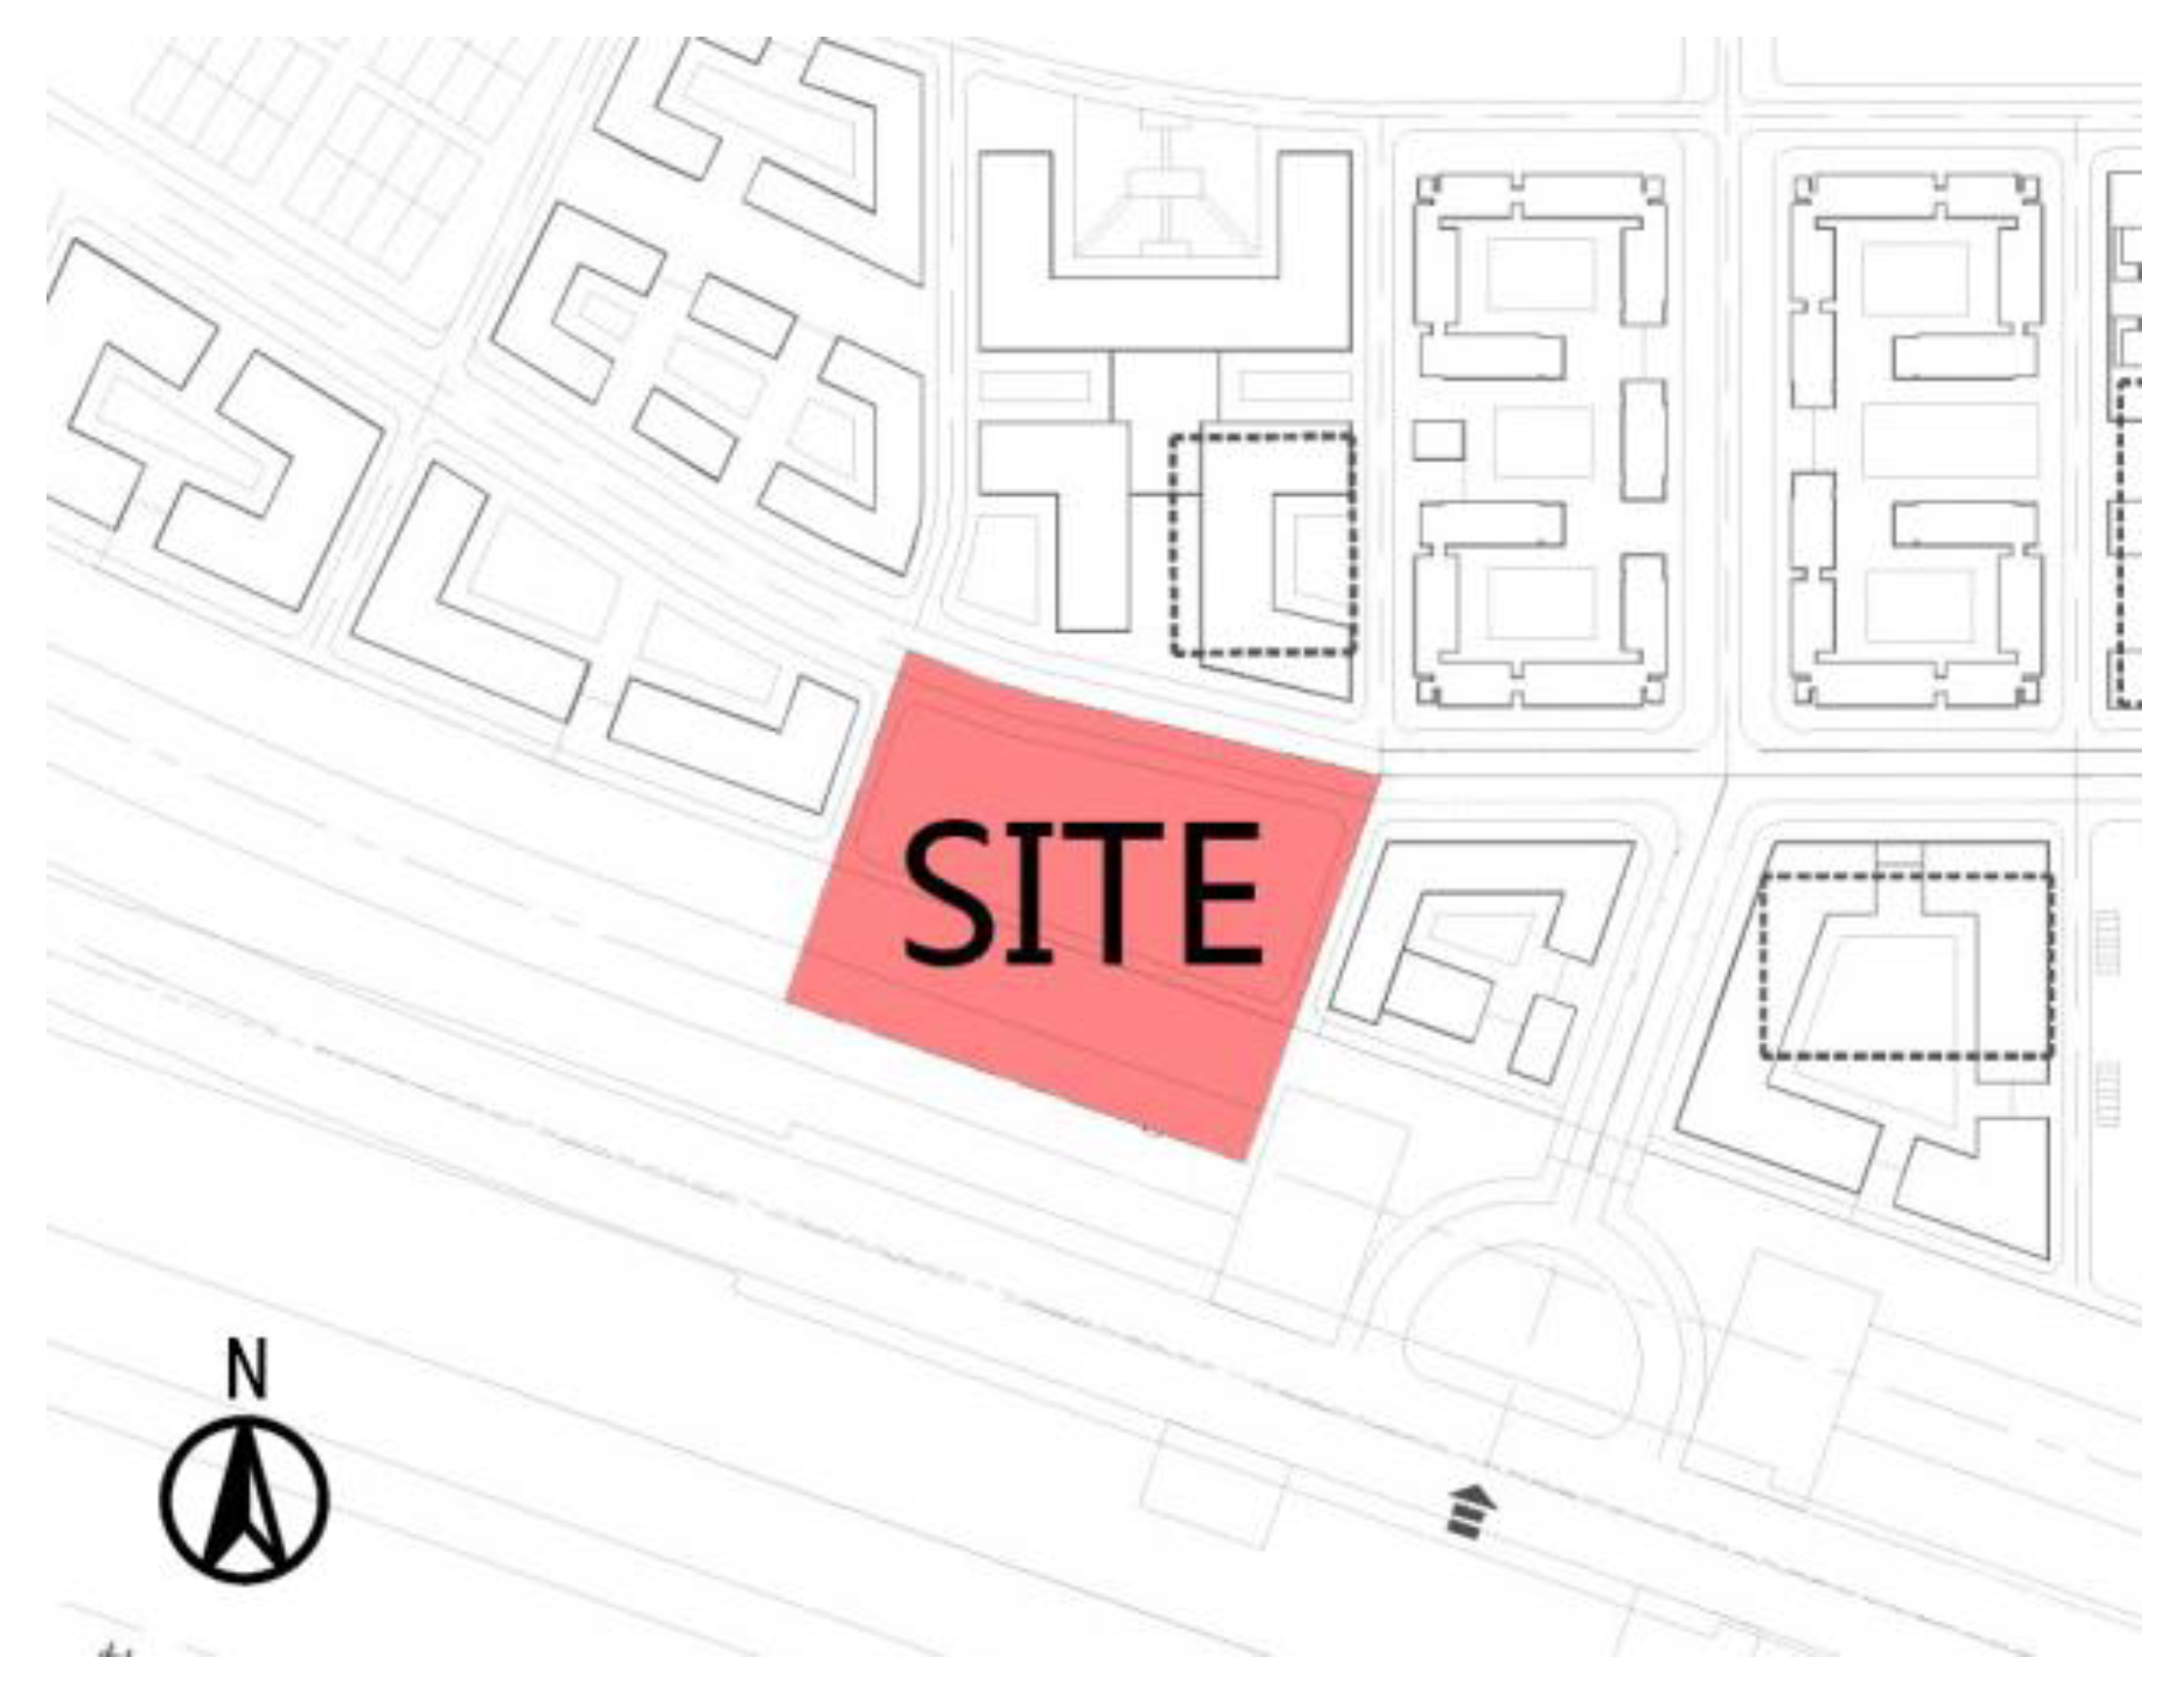
An exhibition hall’s design process is studied. The case is located in Tianjin (39° N), a northern city in China’s cold region. This hall is used to display a dinosaur skeleton donated by alumni of a university (building plans are shown in
Appendix A). The basic information of the building is shown in
Table 2.
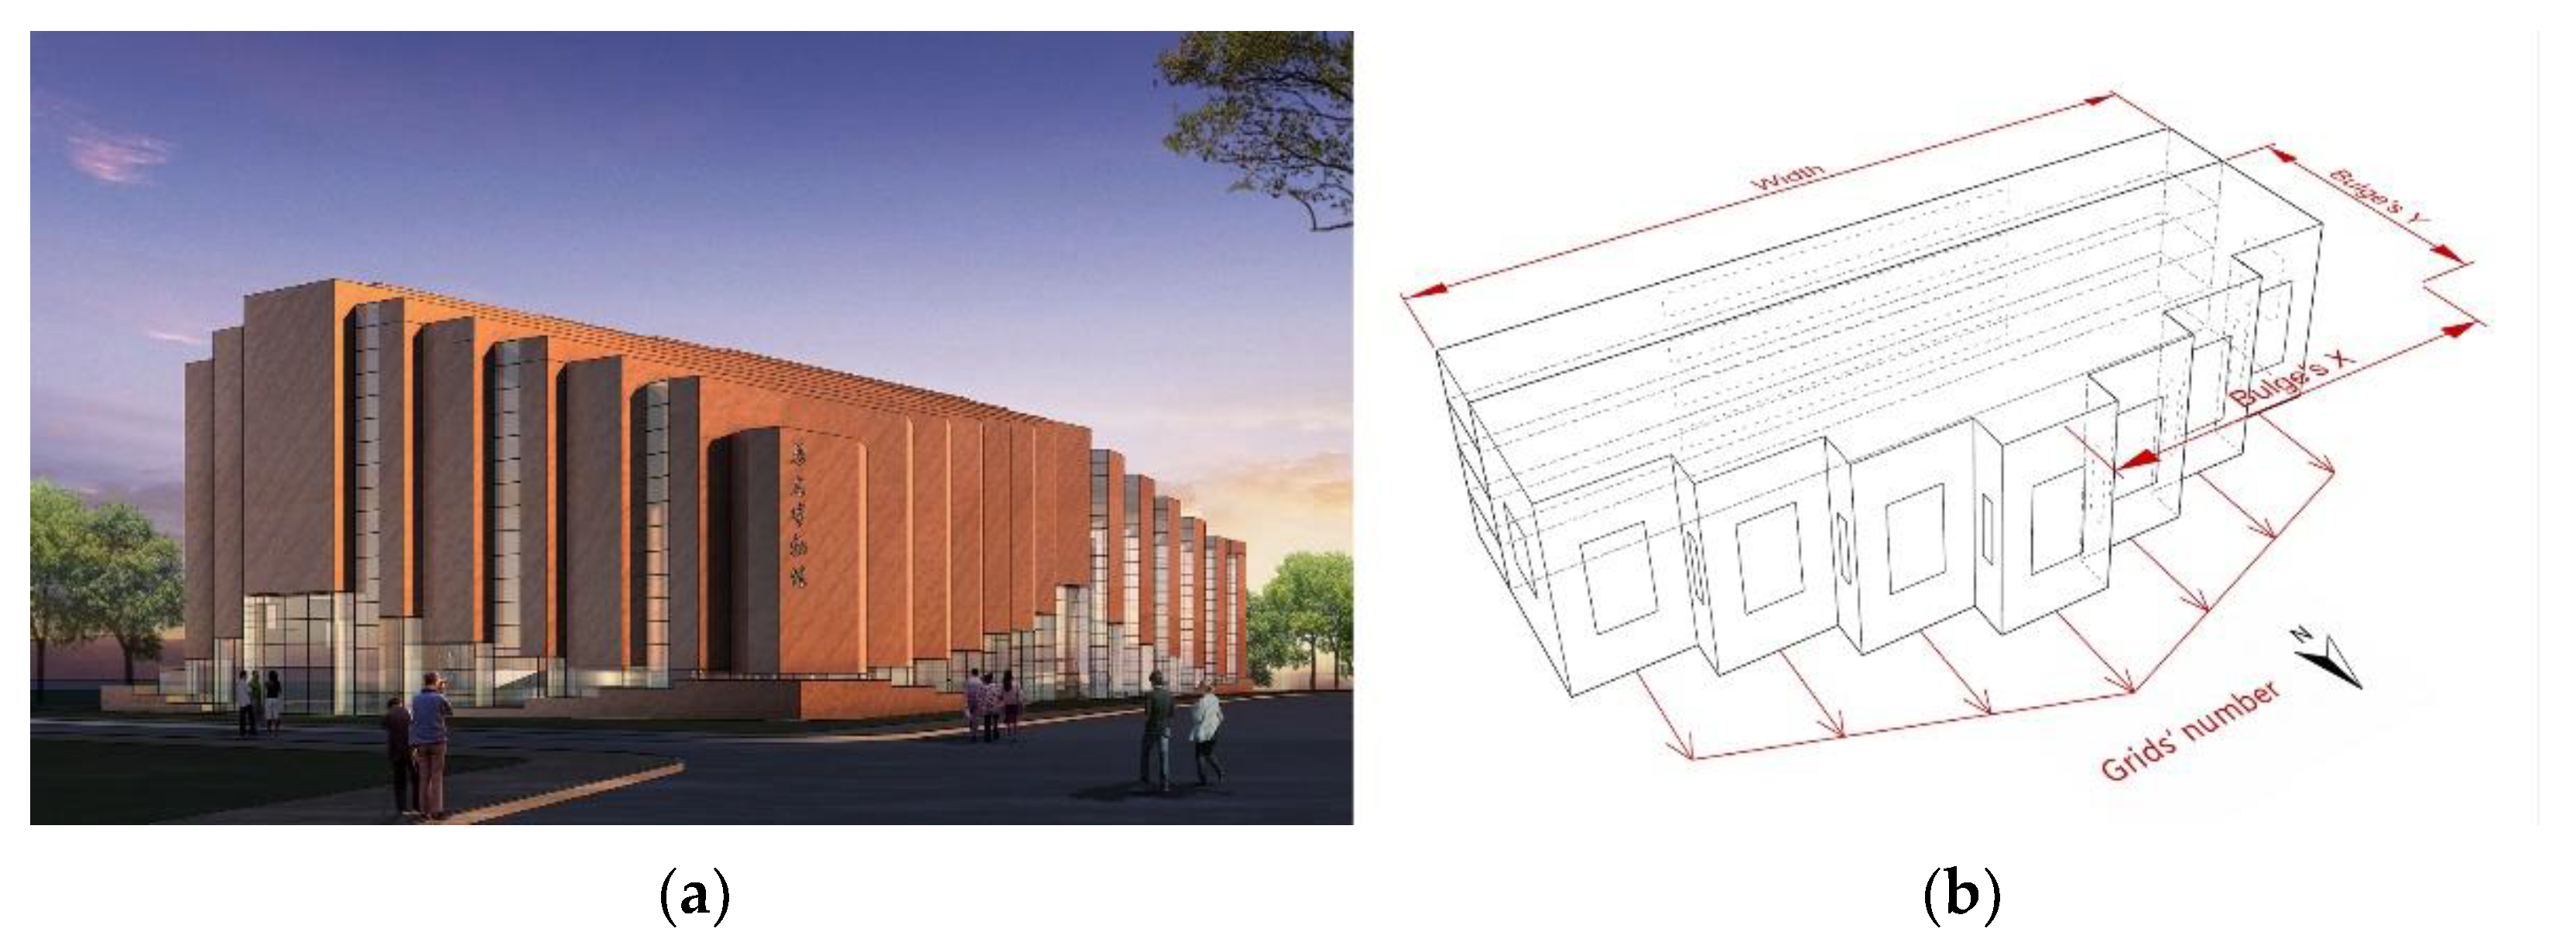
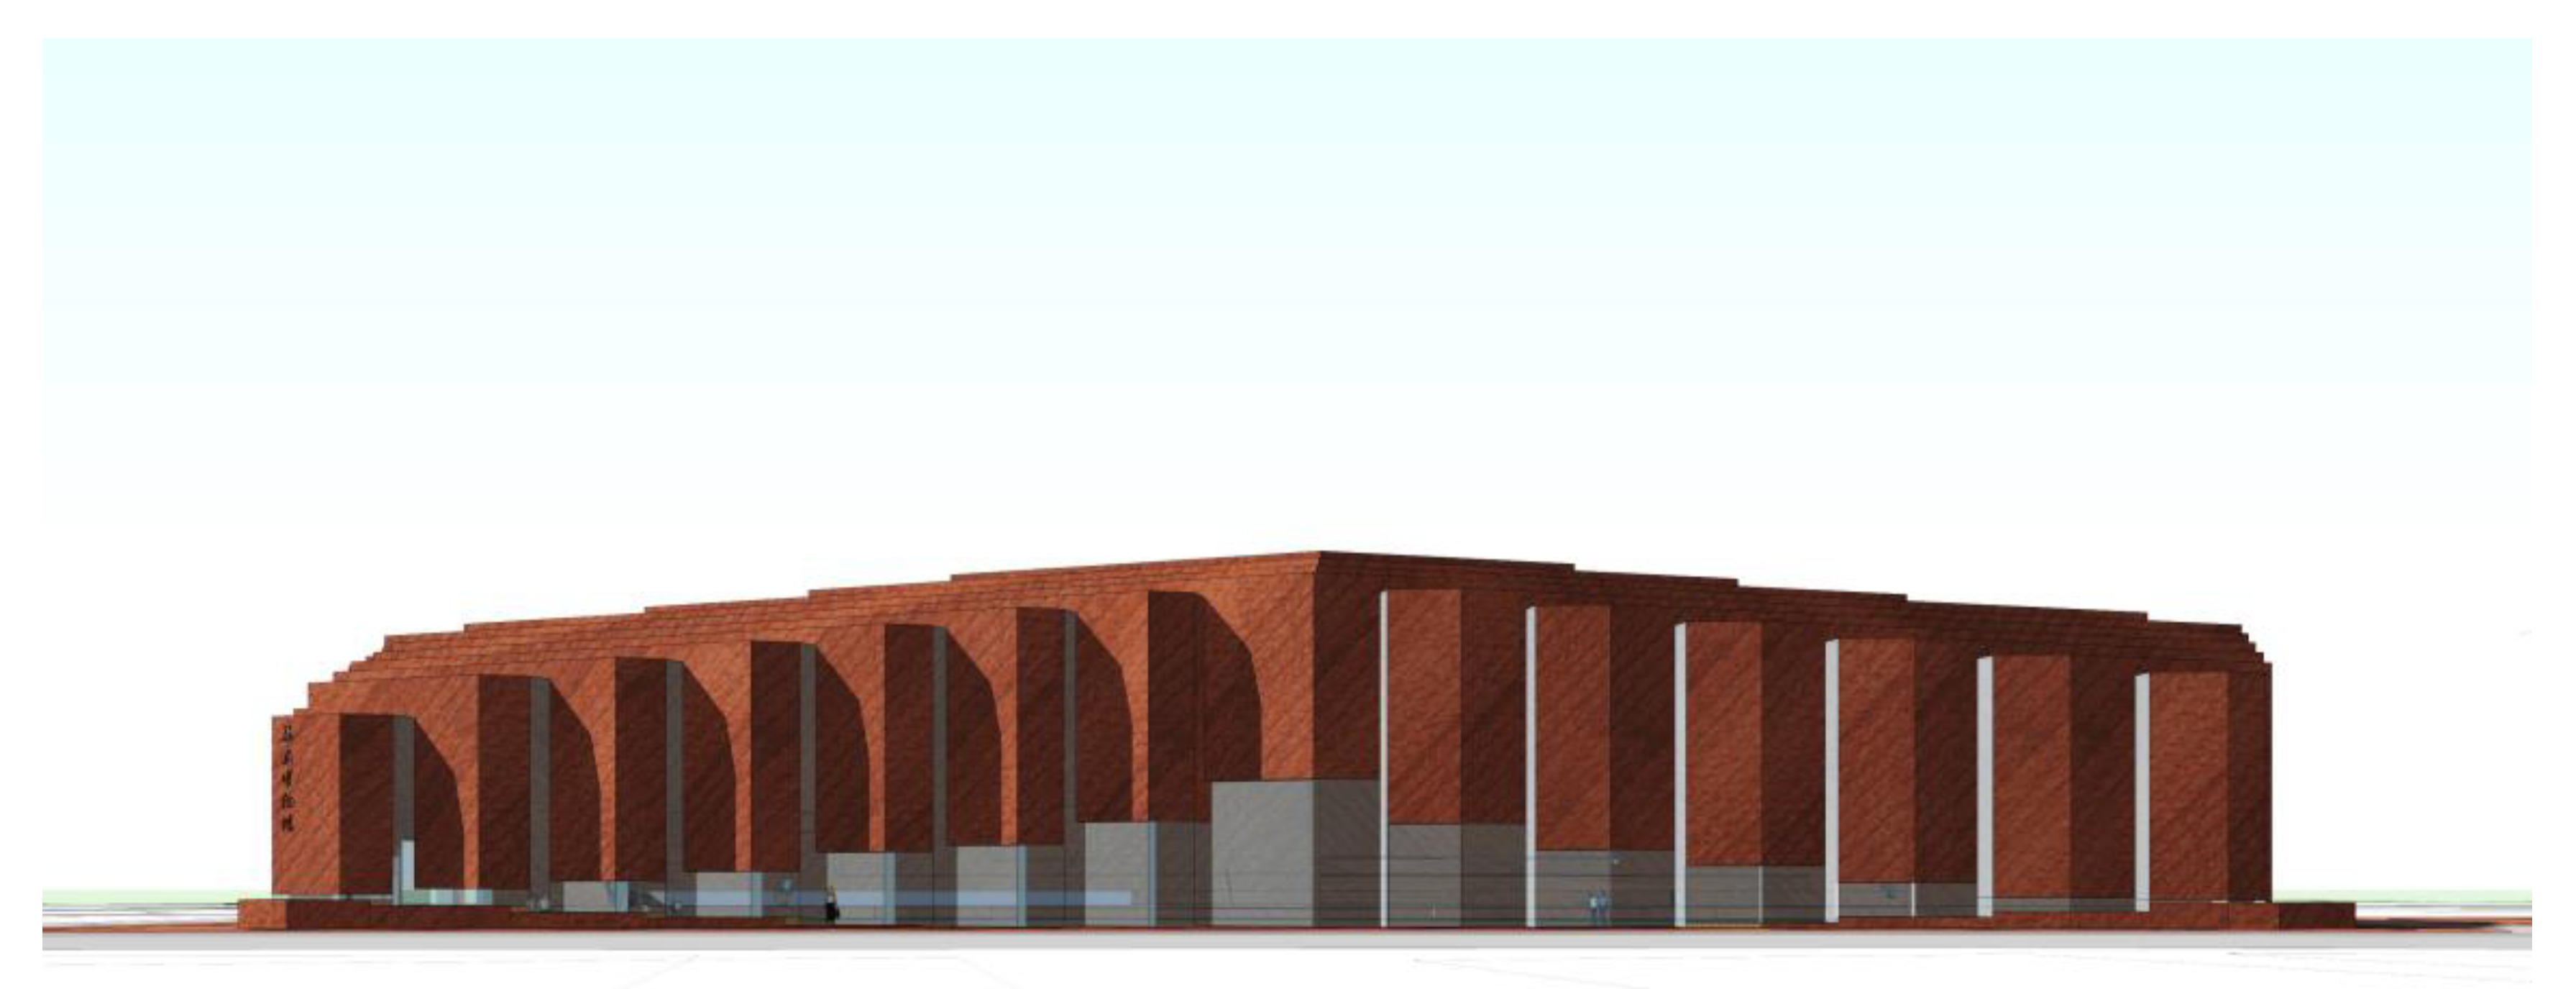
This building is located on an east–west narrow site on campus. The main exhibition room is designed on the north side. The curtain wall has a wrinkled shape to simulate the geological effect of a rock formation (
Figure 2). A model with multiple changeable zones is simulated simultaneously. The grid number of the exhibition hall’s fold-shaped window and the bulge’s location are the key variables in the case study. Other geometric variables are the building’s length and width and the window-to-wall ratio of the facades in different directions. The material quantities used to calculate the embodied energy and LCC of the building are taken from the geometric model above, including the entire exterior envelope, the floor slab and part of the interior walls between the condition zones. Building elements such as equipment, structures, foundations, and interior walls of rooms are not considered. These components need to be studied after the early design form is determined.
Table 3 and
Table 4 show the variables and physical properties of the building elements in this case study. In the Building geometry category, Width refers to the length of the building in the east-west direction; Bulge’s X indicates the center of the most prominent part of the exhibition hall as a percentage of the overall width (from the west side); Bulge’s Y refers to the length from the exhibition hall’s northernmost end to its southernmost end; and Grid’s number refers to the number of wrinkles on the north facade (always an odd number).
Since the main facade of the exhibition hall of this building faces north, the window-to-wall ratio variable of the north facade takes a range larger than that of the south façade. The upper range still meets the energy-saving design standard [
29].
4.1. Different Workflows in the Design Process
Concentrating on the decision-making in the early design stage, three possible optimization workflows are proposed and compared:
- (1)
Pre-set optimization: artificially pre-set the geometric shape according to the architects’ preference, and then optimize the variables relating to the window-to-wall ratio and those related to building components (seven variables);
- (2)
Stepwise optimization: Step 1, optimize the geometric shape of the building (four variables), with the window-to-wall ratio and the building components (seven variables) as pre-set default values; Step 2, start from Step 1′s optimal solution sets, manually select one solution as the default value of the geometric shape, then optimize the window-to-wall ratio and building components (seven variables);
- (3)
One-step optimization: simultaneously optimize the variables relating to building geometric shape, the window-to-wall ratio and those related to building components (eleven variables).
4.2. Comparison of the Objectives under Different Workflows
In this study, the minimum and maximum values of the results obtained from all the calculation processes (except for the first step in the stepwise optimization due to the extended difference of the solutions) are defined as 0 and 1. Other results in the solution sets are mapped to this interval to demonstrate the solutions’ values in the same standard scope to assist the comparison. The calculation results of each workflow are demonstrated in the following subsections.
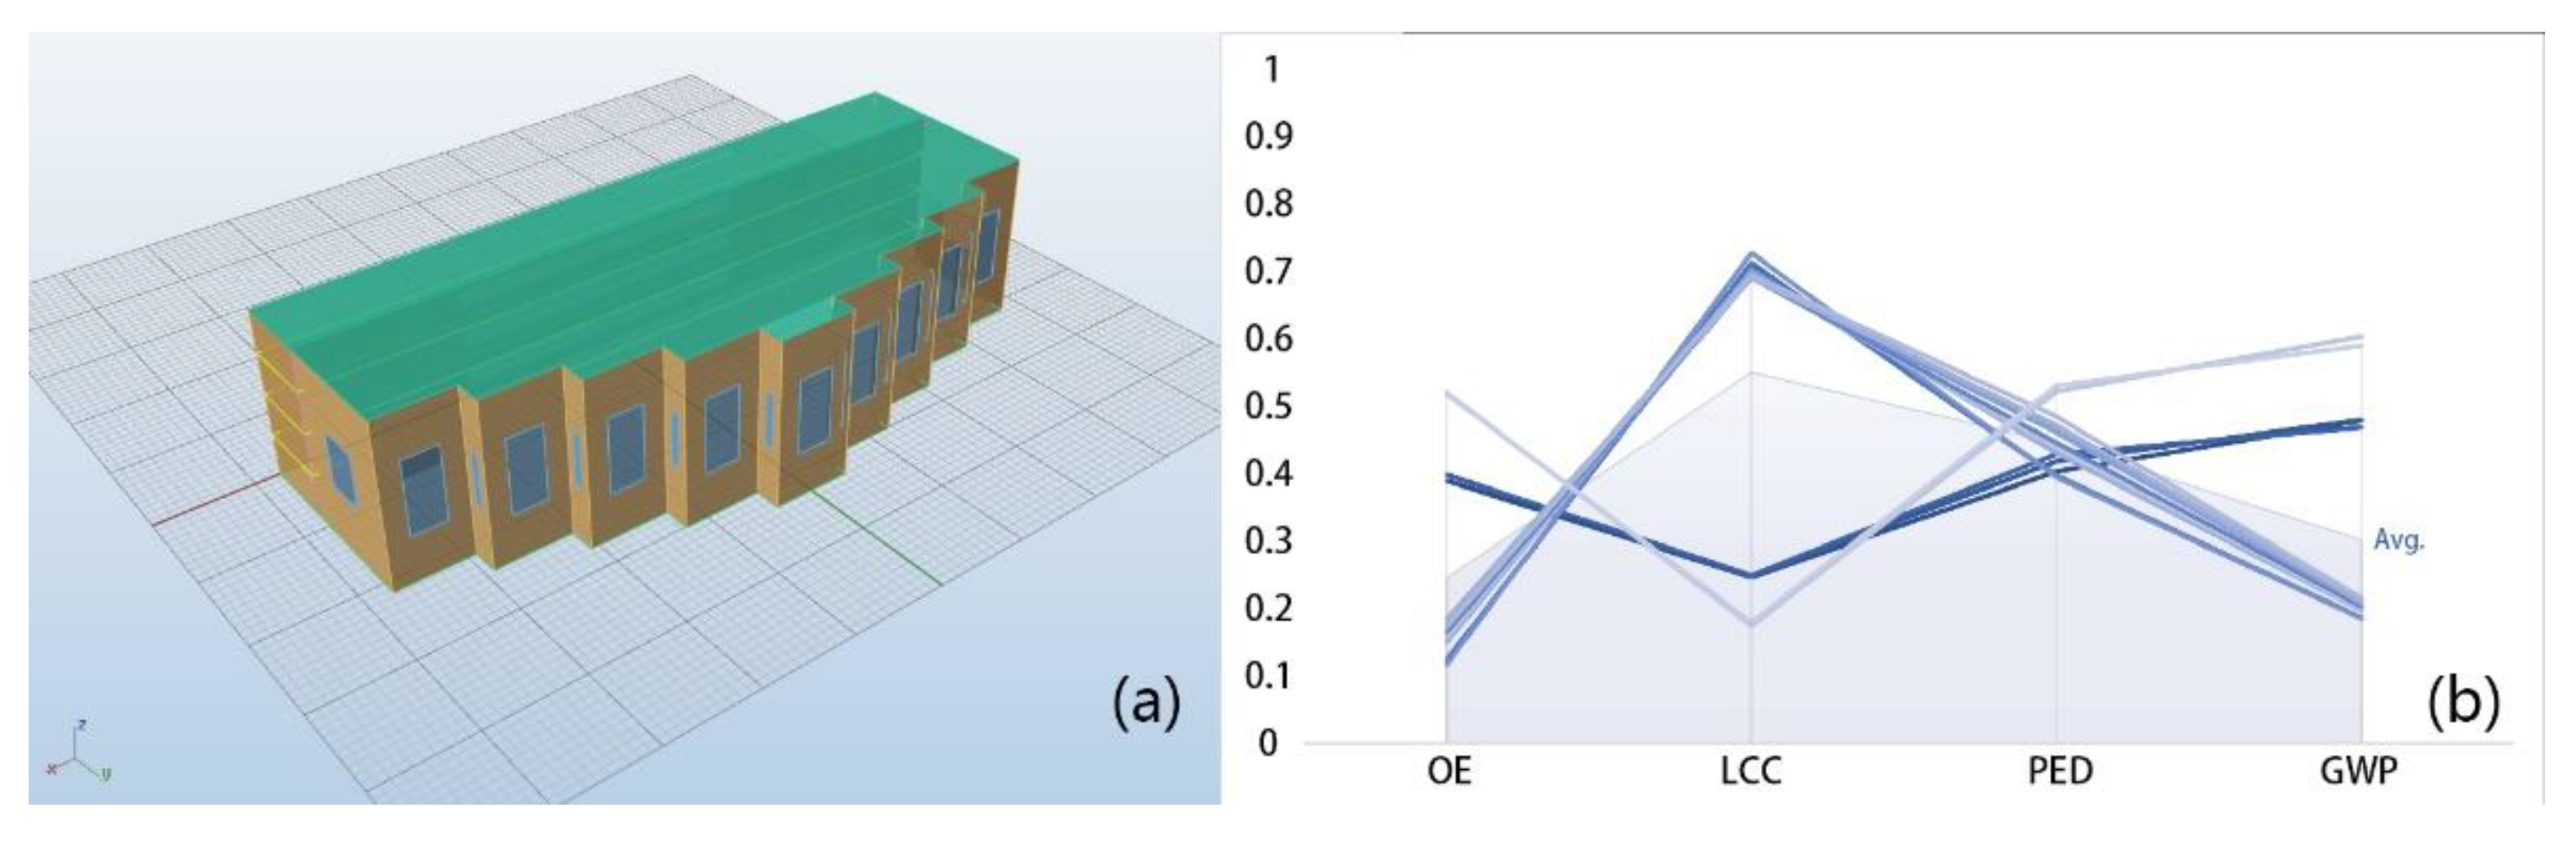
4.2.1. Pre-Set Optimization
The geometric shape of the building in this optimization workflow is a fixed setting, in which each variable is predefined as the intermediate value in the scope. The window-to-wall ratio and building elements’ attributes (window, exterior wall, roof) are the variables to be optimized. The result is shown in
Figure 3b. Each line represents one optimal solution set. The bend points represent the value of the objectives. This set of optimal solutions contains 16 optimal solutions.
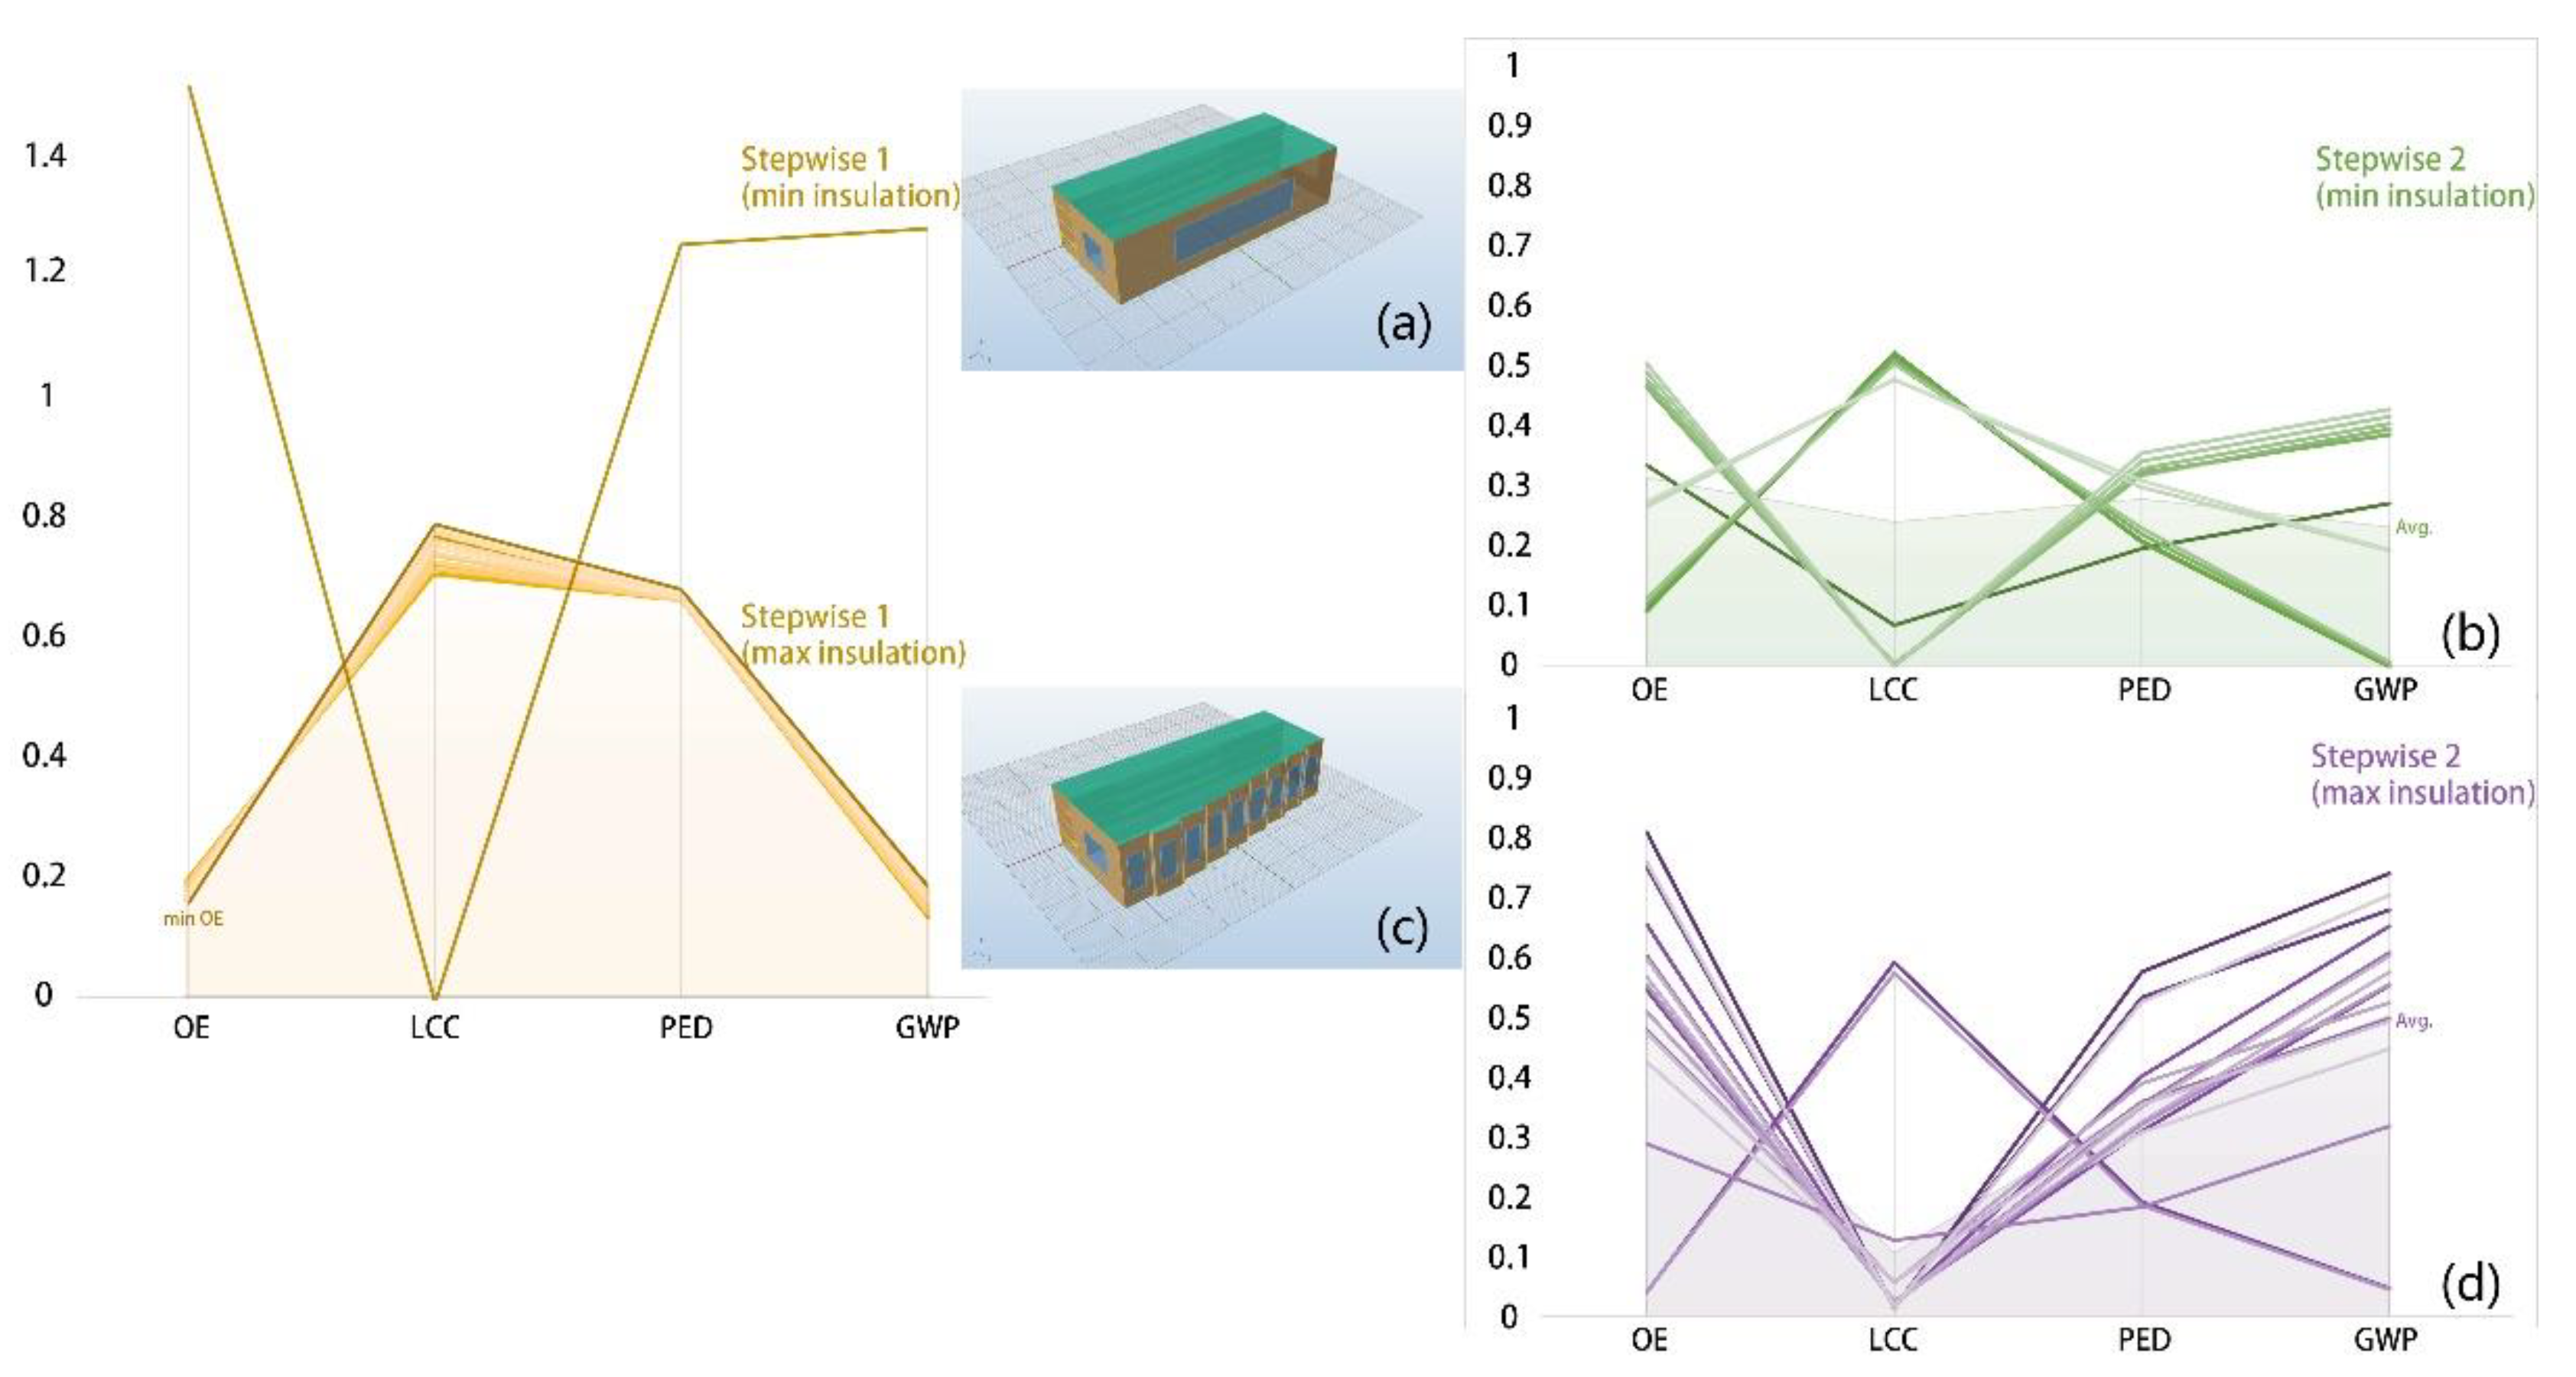
4.2.2. Stepwise Optimization
In the first step of the stepwise optimization, the window-to-wall ratio is set to the median value in the variable scope, and the physical attributes of the building elements are set to the minimum value (the lowest value that meets the requirements of the design codes [
28,
29]), and the geometric parameters are variables. The calculated optimal solution sets are all close to the simple volume without ‘wrinkles’ (
Figure 4a), so this geometry is set as a fixed value for the second step of optimization: optimizing the window-to-wall ratio and building elements. The optimization results are shown in
Figure 4b.
As the geometric shape obtained by the above optimization tends to be simplified, the calculation is performed again, considering whether it is caused by the material’s inadequate insulation quality. This time, the building elements are set to the maximum value in the variable scope. One set of geometric shape variables corresponding to the minimum operational energy consumption with a functional plane is selected (
Figure 4c), and the second step of the stepwise optimization is performed again. The optimization results are shown in
Figure 4d.
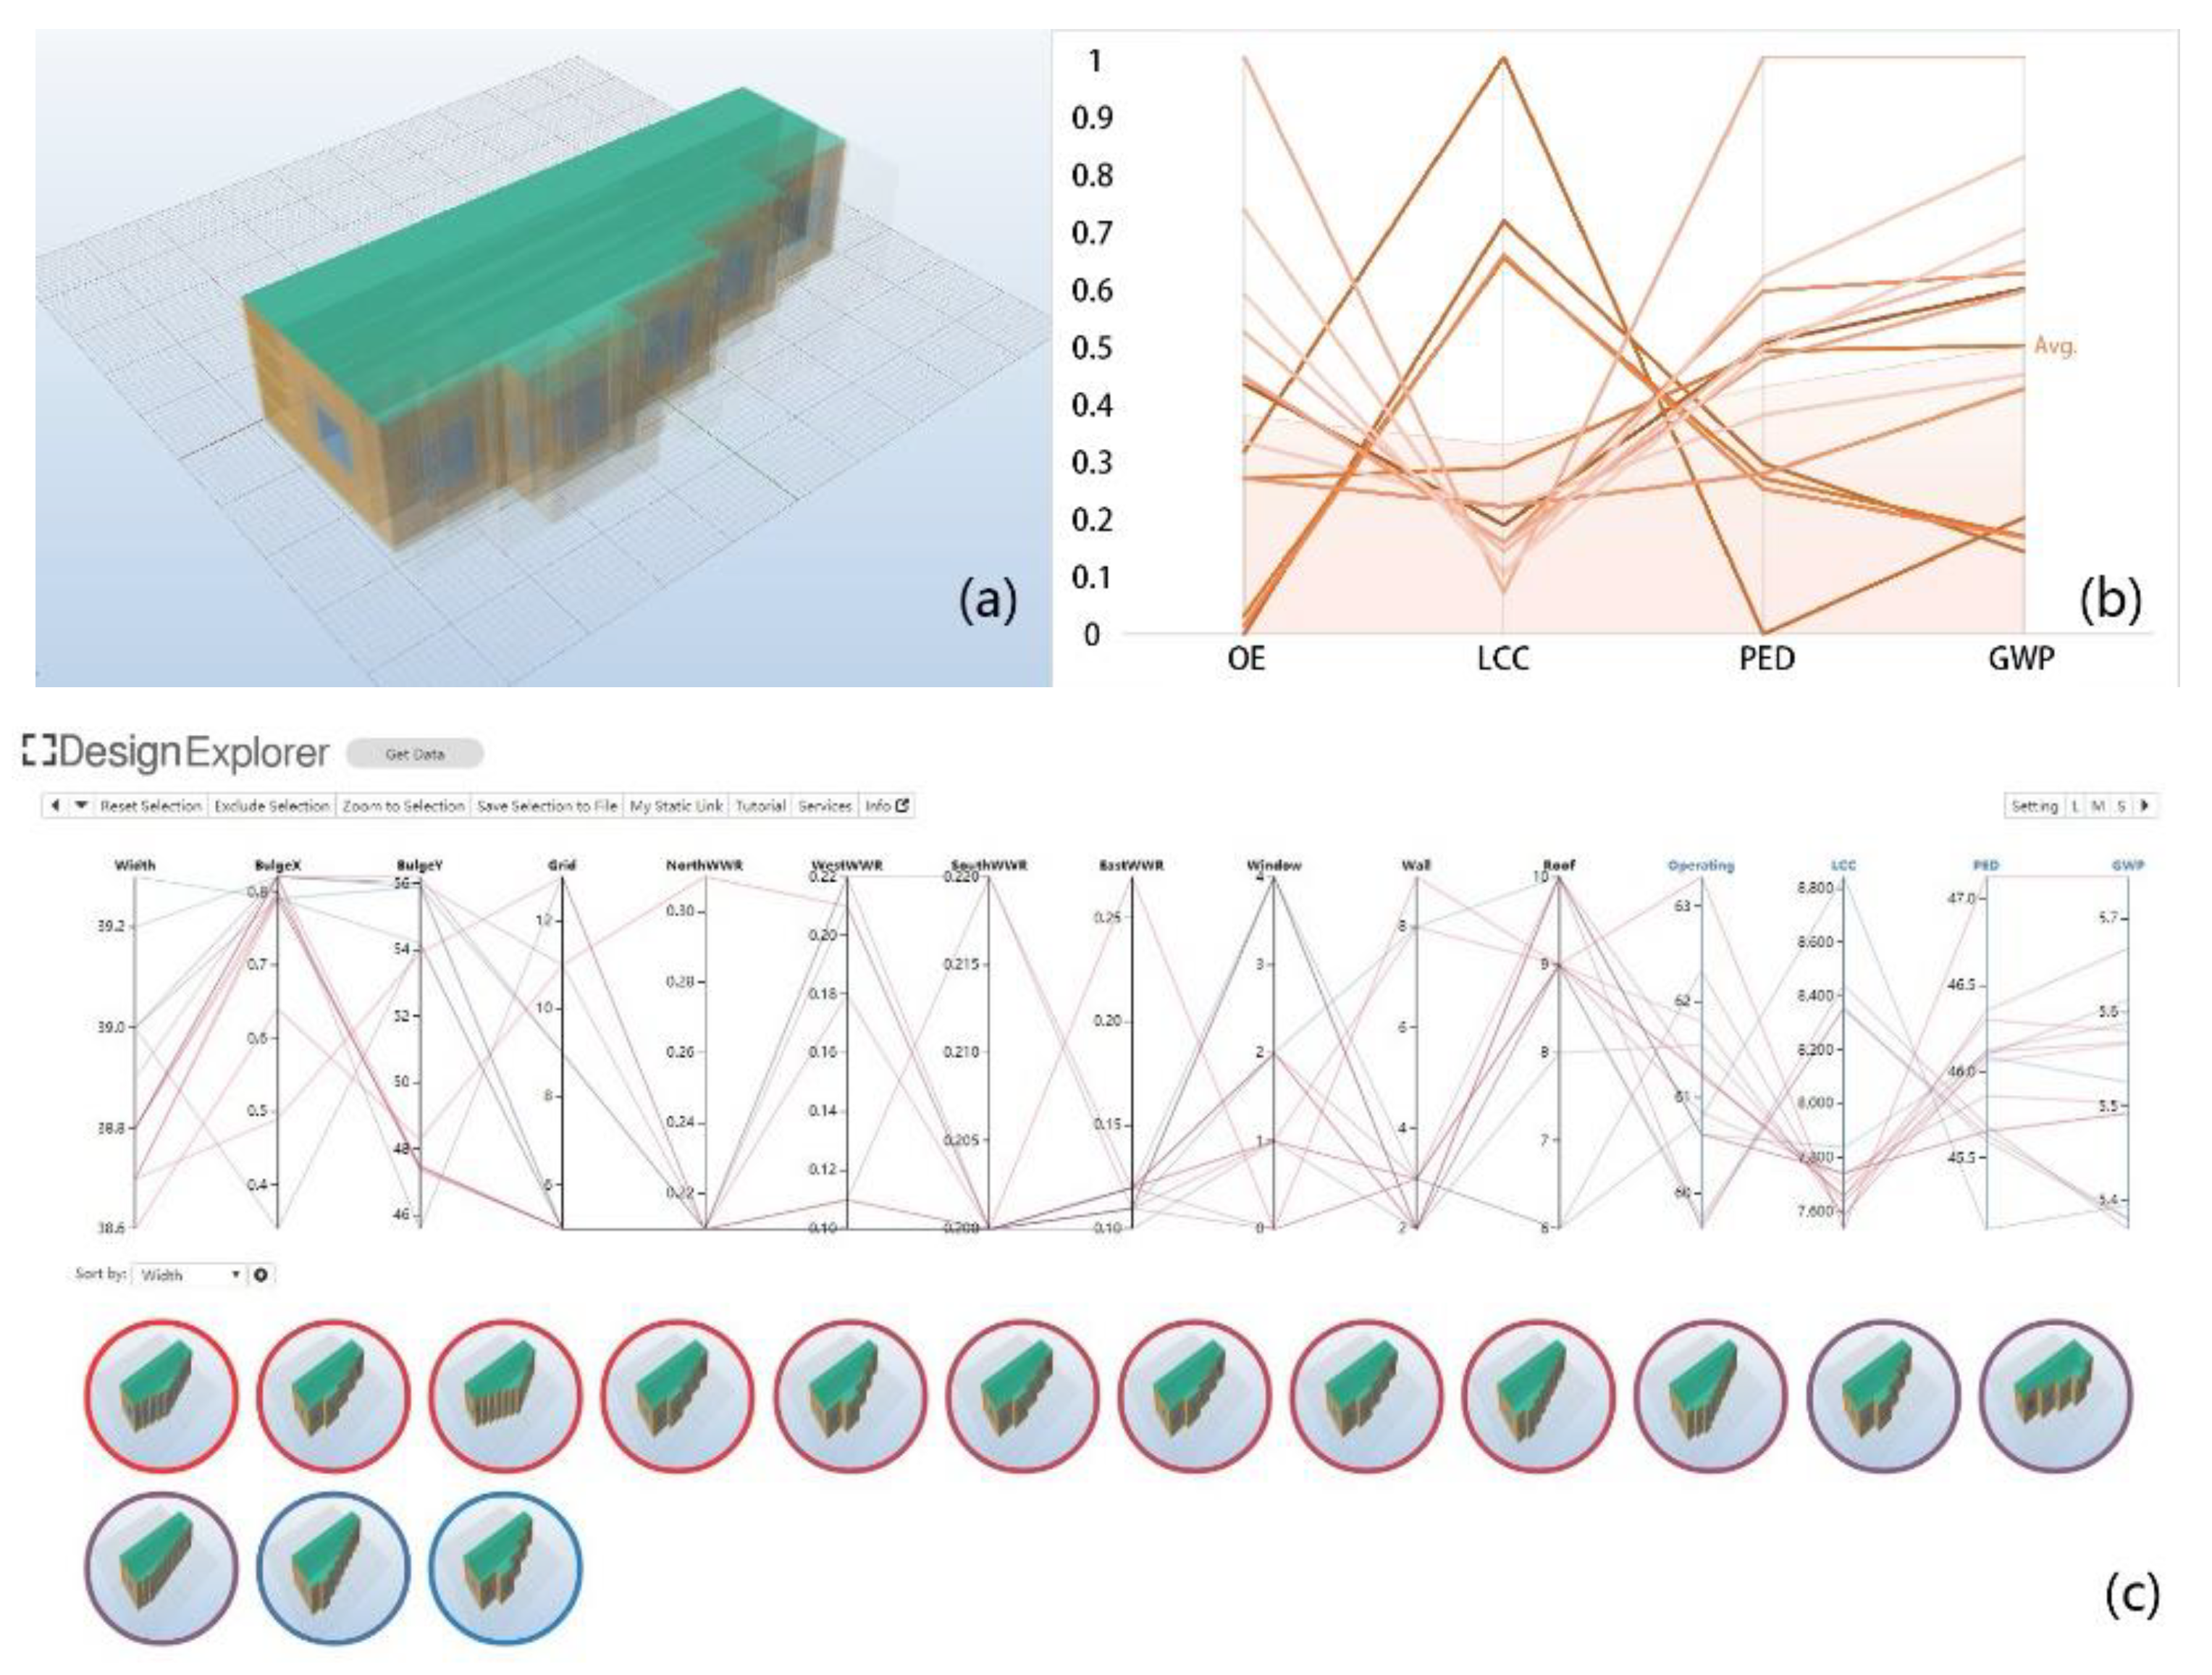
4.2.3. One-Step Optimization
All variables are optimized in one-step optimization at the same time. The results of the geometric model and their performances are show in
Figure 5. It can be seen from the models that the diversity of the geometric design solutions is much greater than those from the other two workflows, and their performances are compared in
Table 5. The visualization by Design Explorer (
Figure 5c) represents the value of the variables and objectives, as well as presenting the geometric models in a concise and comprehensive way. Architects can make design decisions without an in-depth understanding of mathematical principles such as trends in variables or objectives’ distributions.
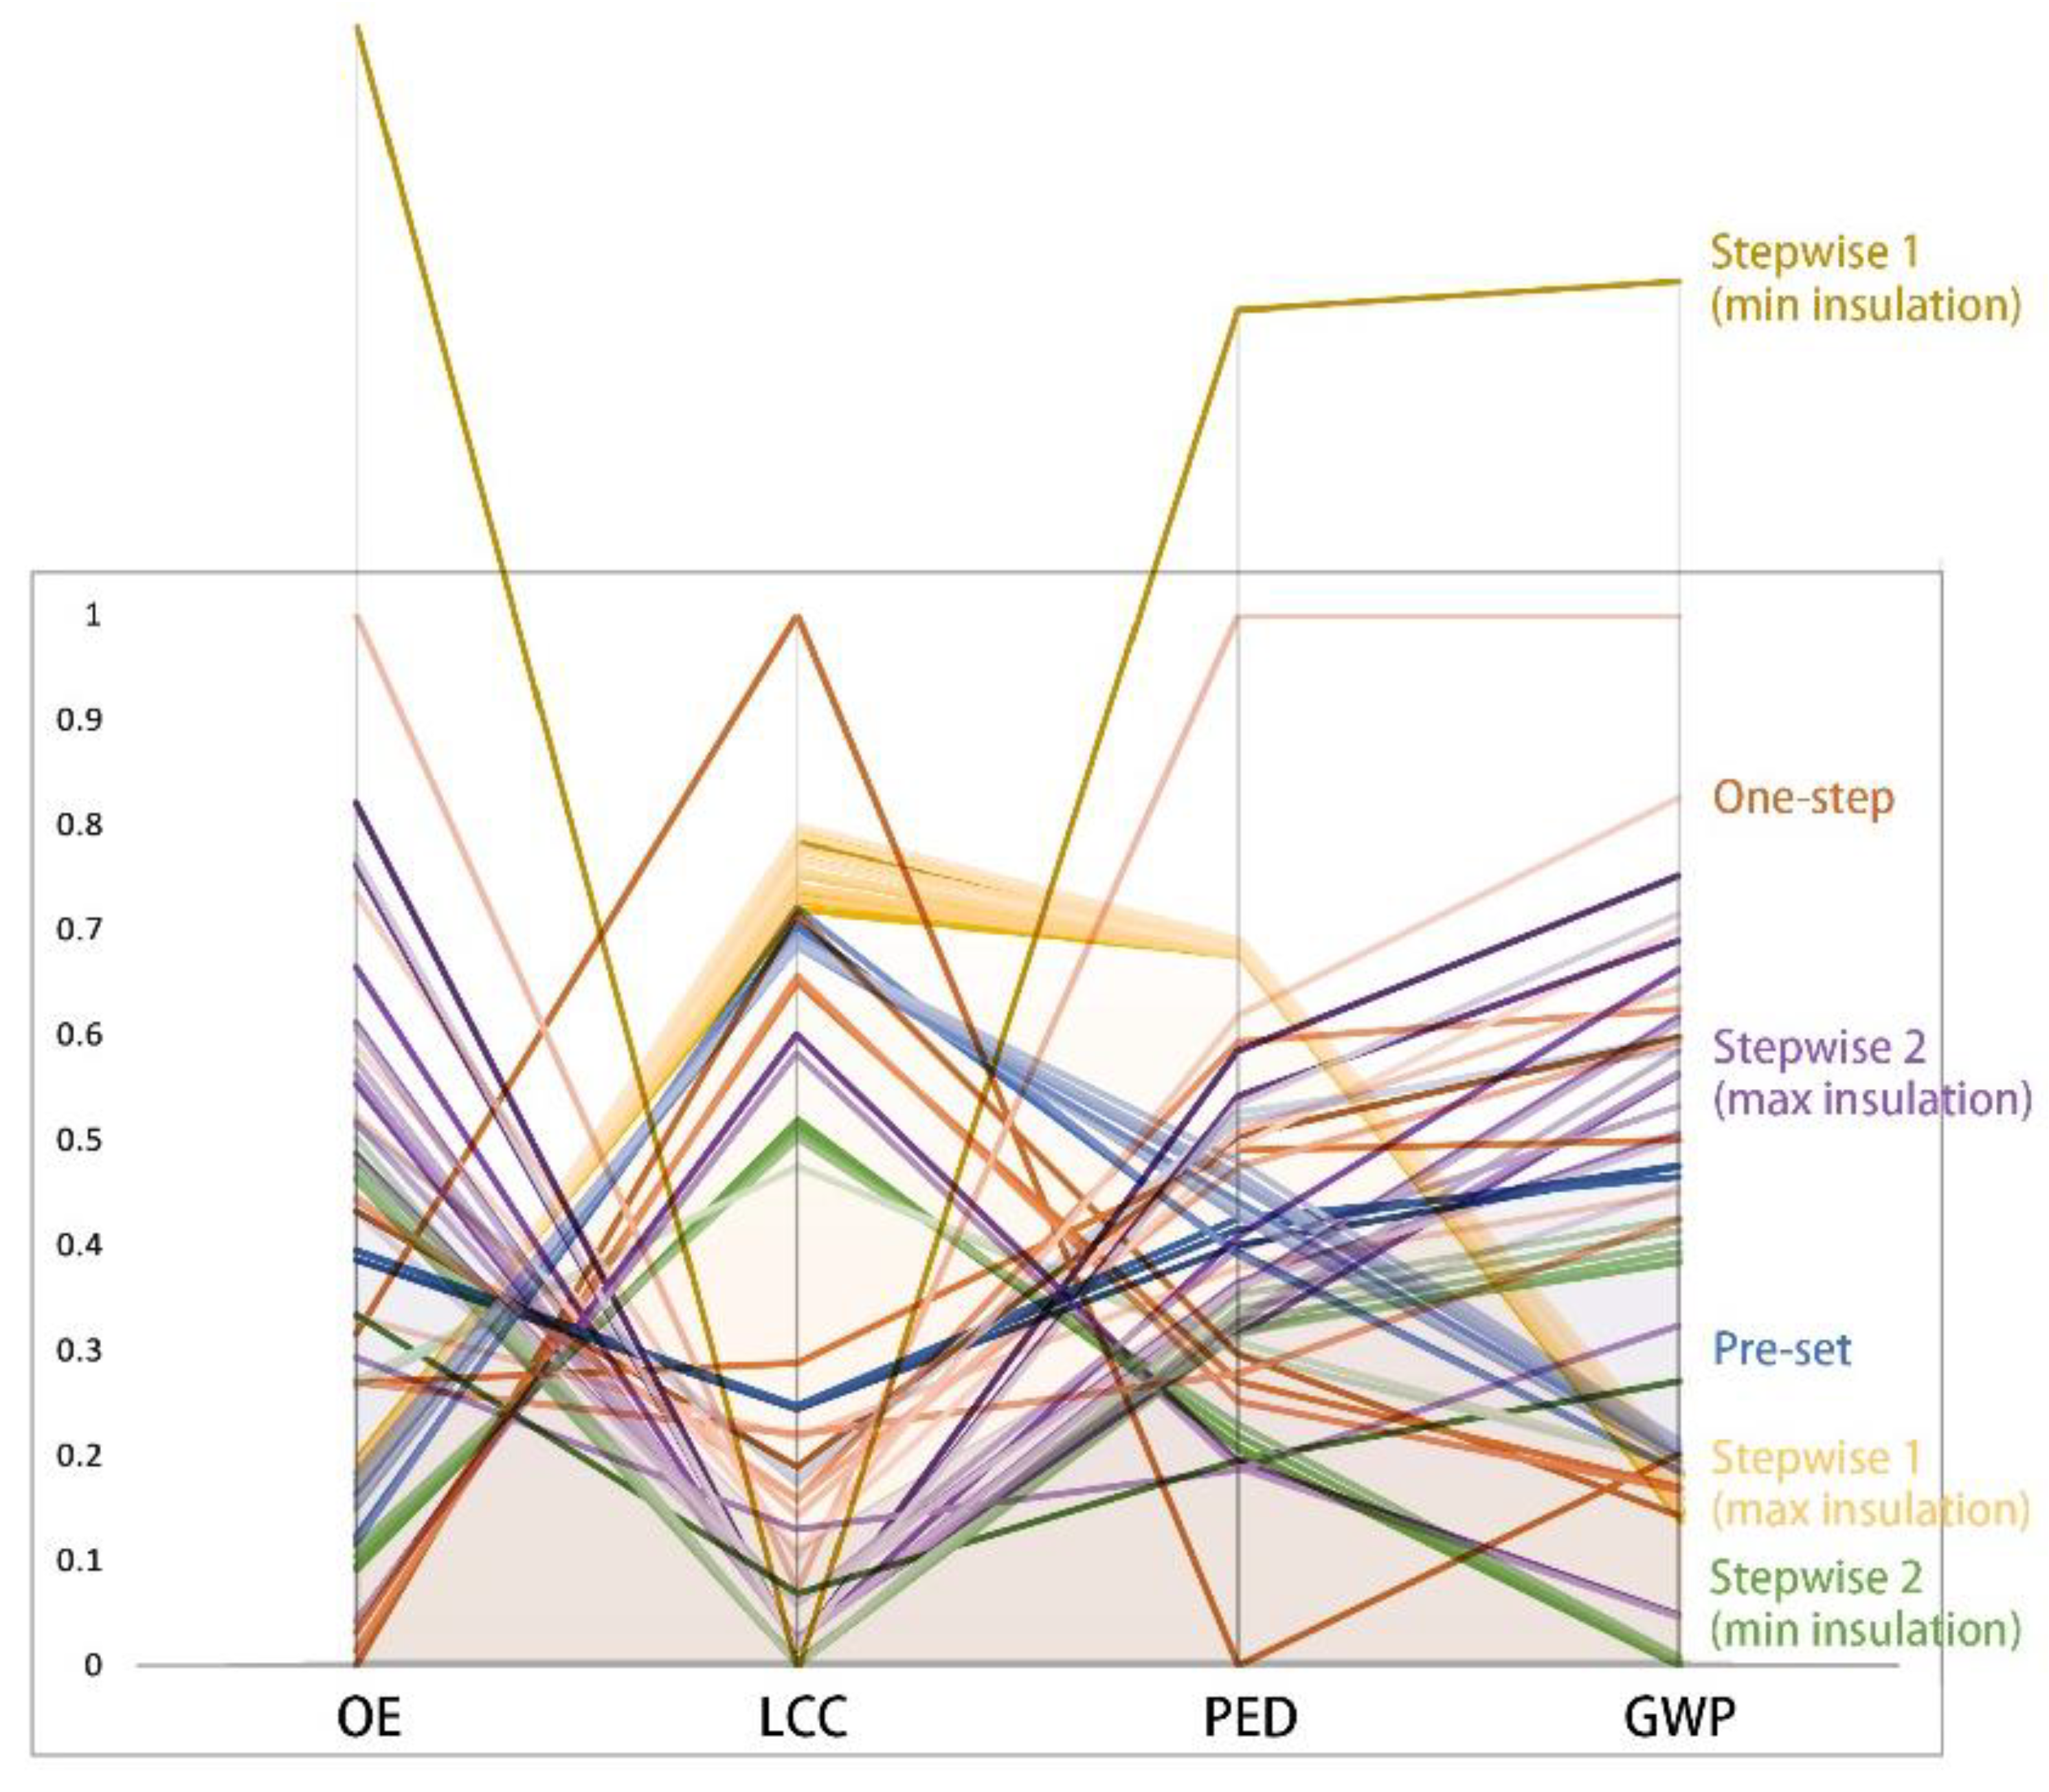
4.2.4. Comparison of Results
Under the above three workflows of optimization, the number of each of the six calculations’ optimal solution sets is less than 20 in all cases.
Table 5 lists the minimum value of the four optimization objectives in each solution set and the average value of all optimal solutions in the group.
Figure 6 shows the values of optimization objectives corresponding to the optimal solution sets. Due to the default minimum insulation settings, the results from Step 1 in the stepwise optimization have the worst performance. Meanwhile, the solutions from Step 2 in the stepwise workflow have competitive performances based on the simple shape without wrinkles obtained in Step 1. The results from the pre-set optimization workflow have relatively higher life cycle impact values partly due to the predefined complex shape. The minimum values for OE and PED appear in the solution set of the one-step optimization’s workflow, and the values for the other objectives are also close to the lowest ones.
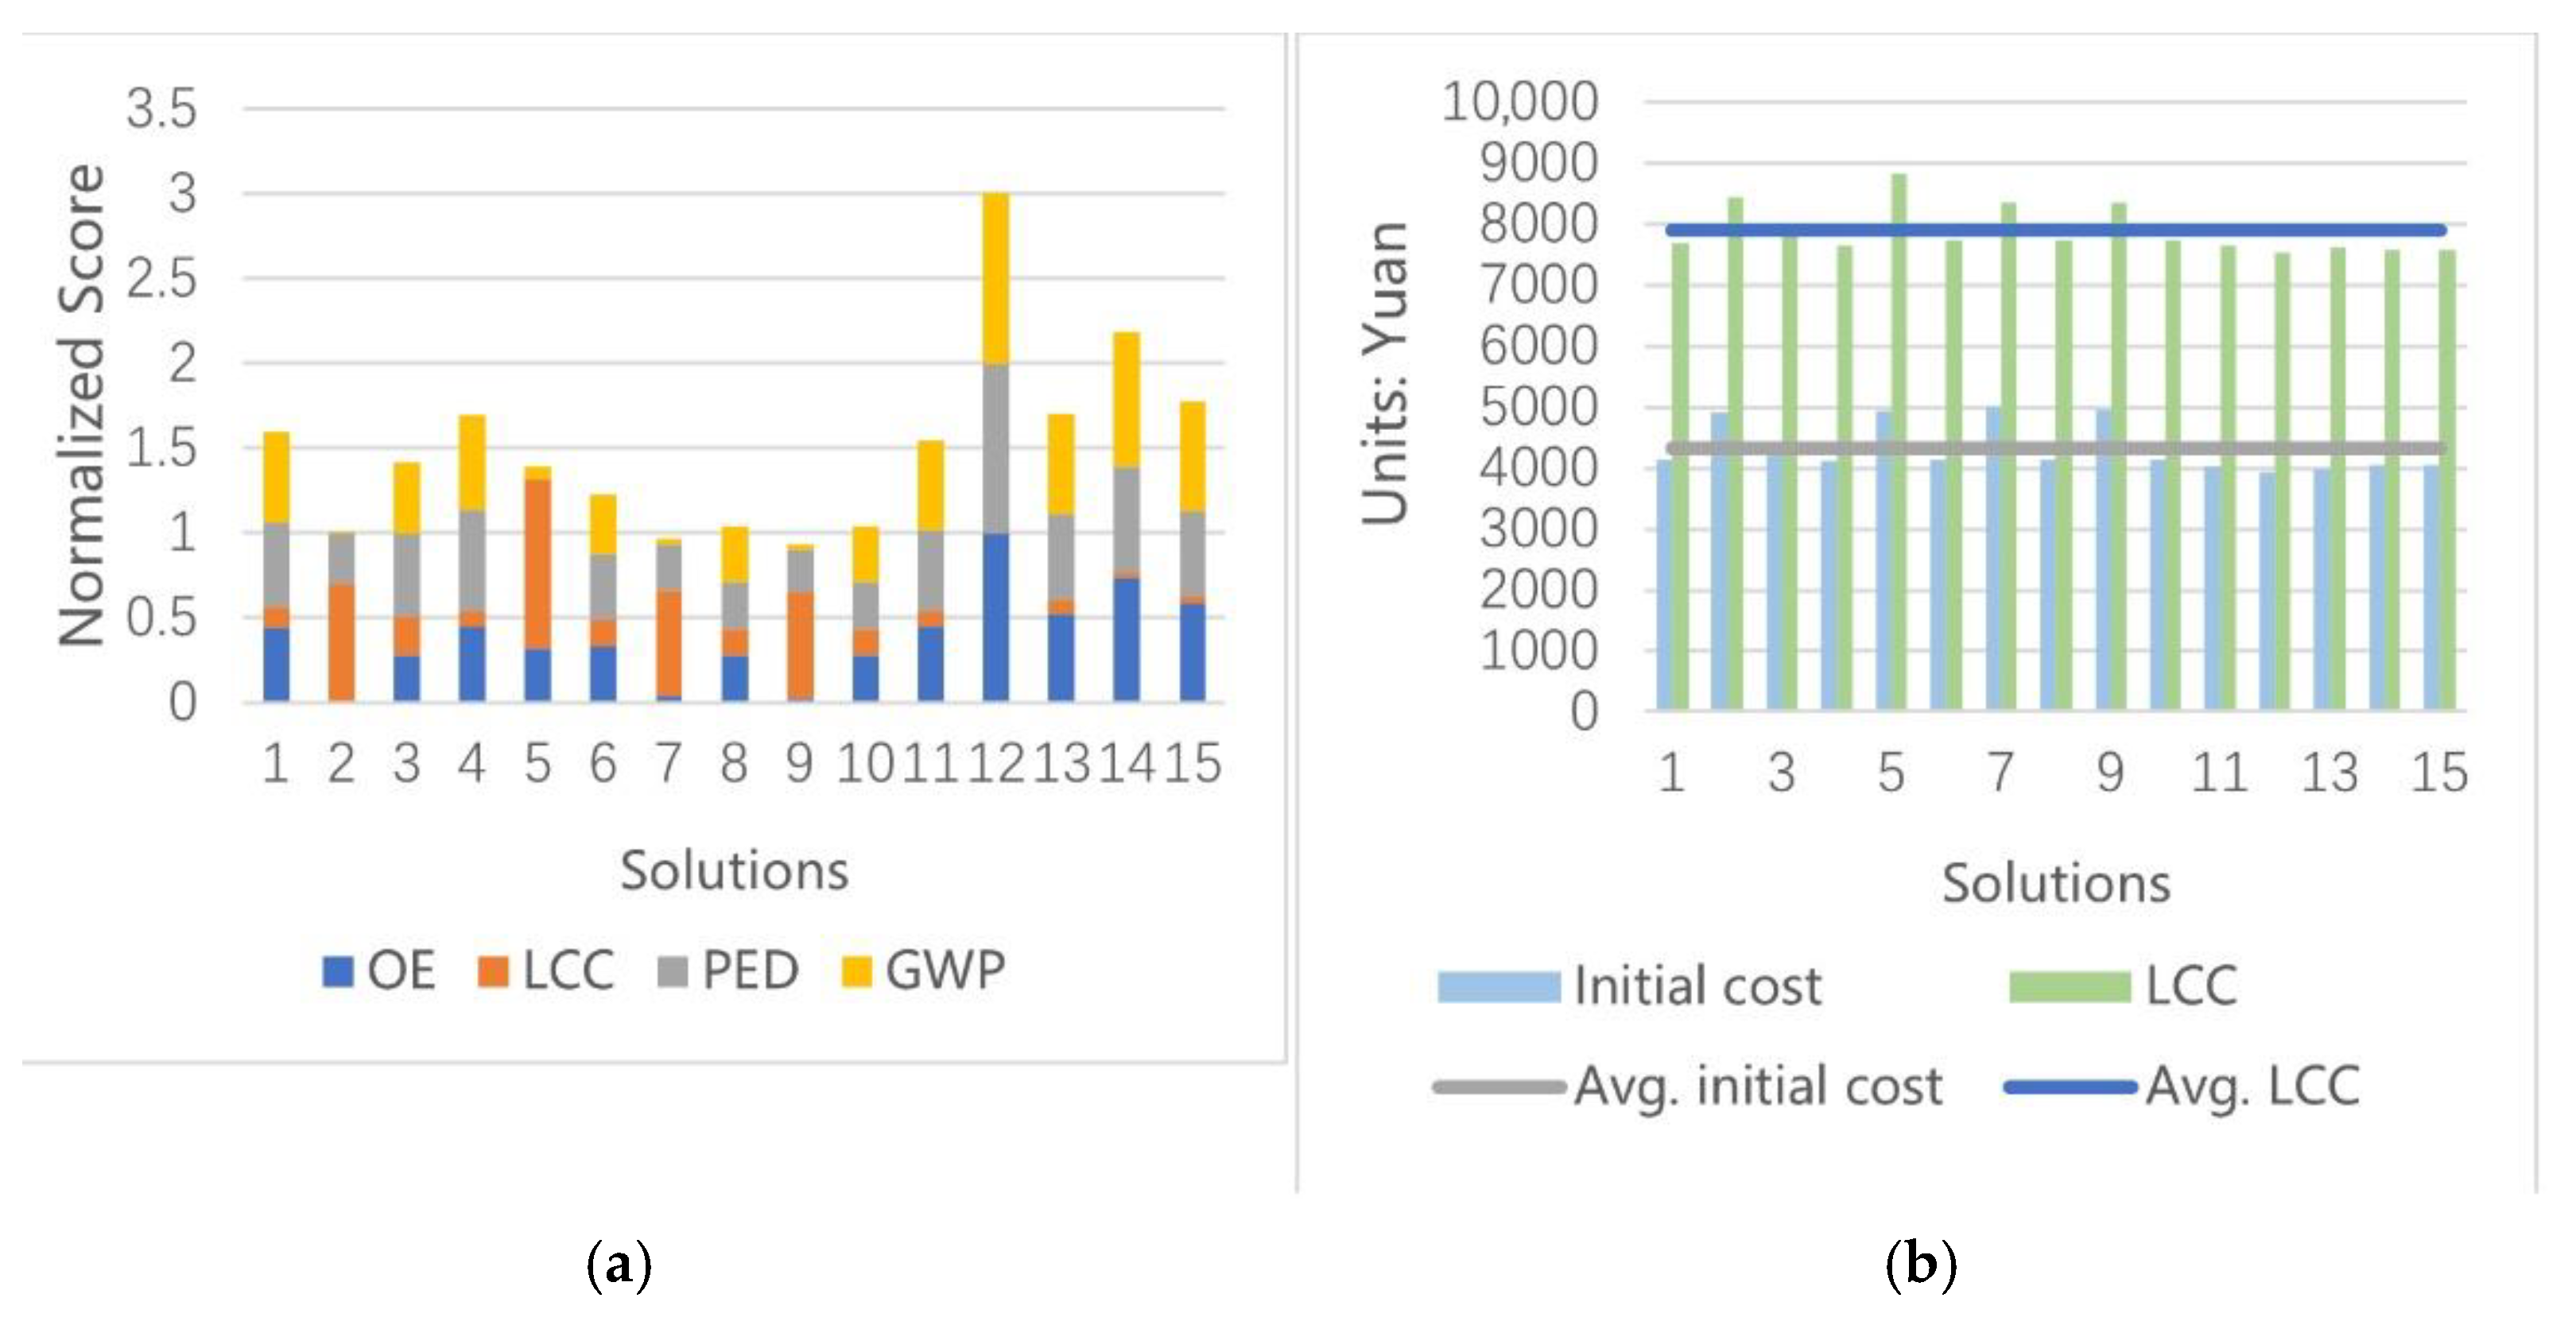
In one set of optimal solutions, the architects can choose the final solution according to the design intention. Taking the optimal solution set of one-step optimization as an example, each objective can be weighted to obtain a normalized total score (the lower, the better) for comparison (
Figure 7a), or only the LCC (as a long-term economic indicator)/initial cost (as an investor concerned economic indicator), which if it was below the average cost, would be selected (
Figure 7b). Similarly, OE can also be used as a screening condition from the point of view of market feasibility and regulations.
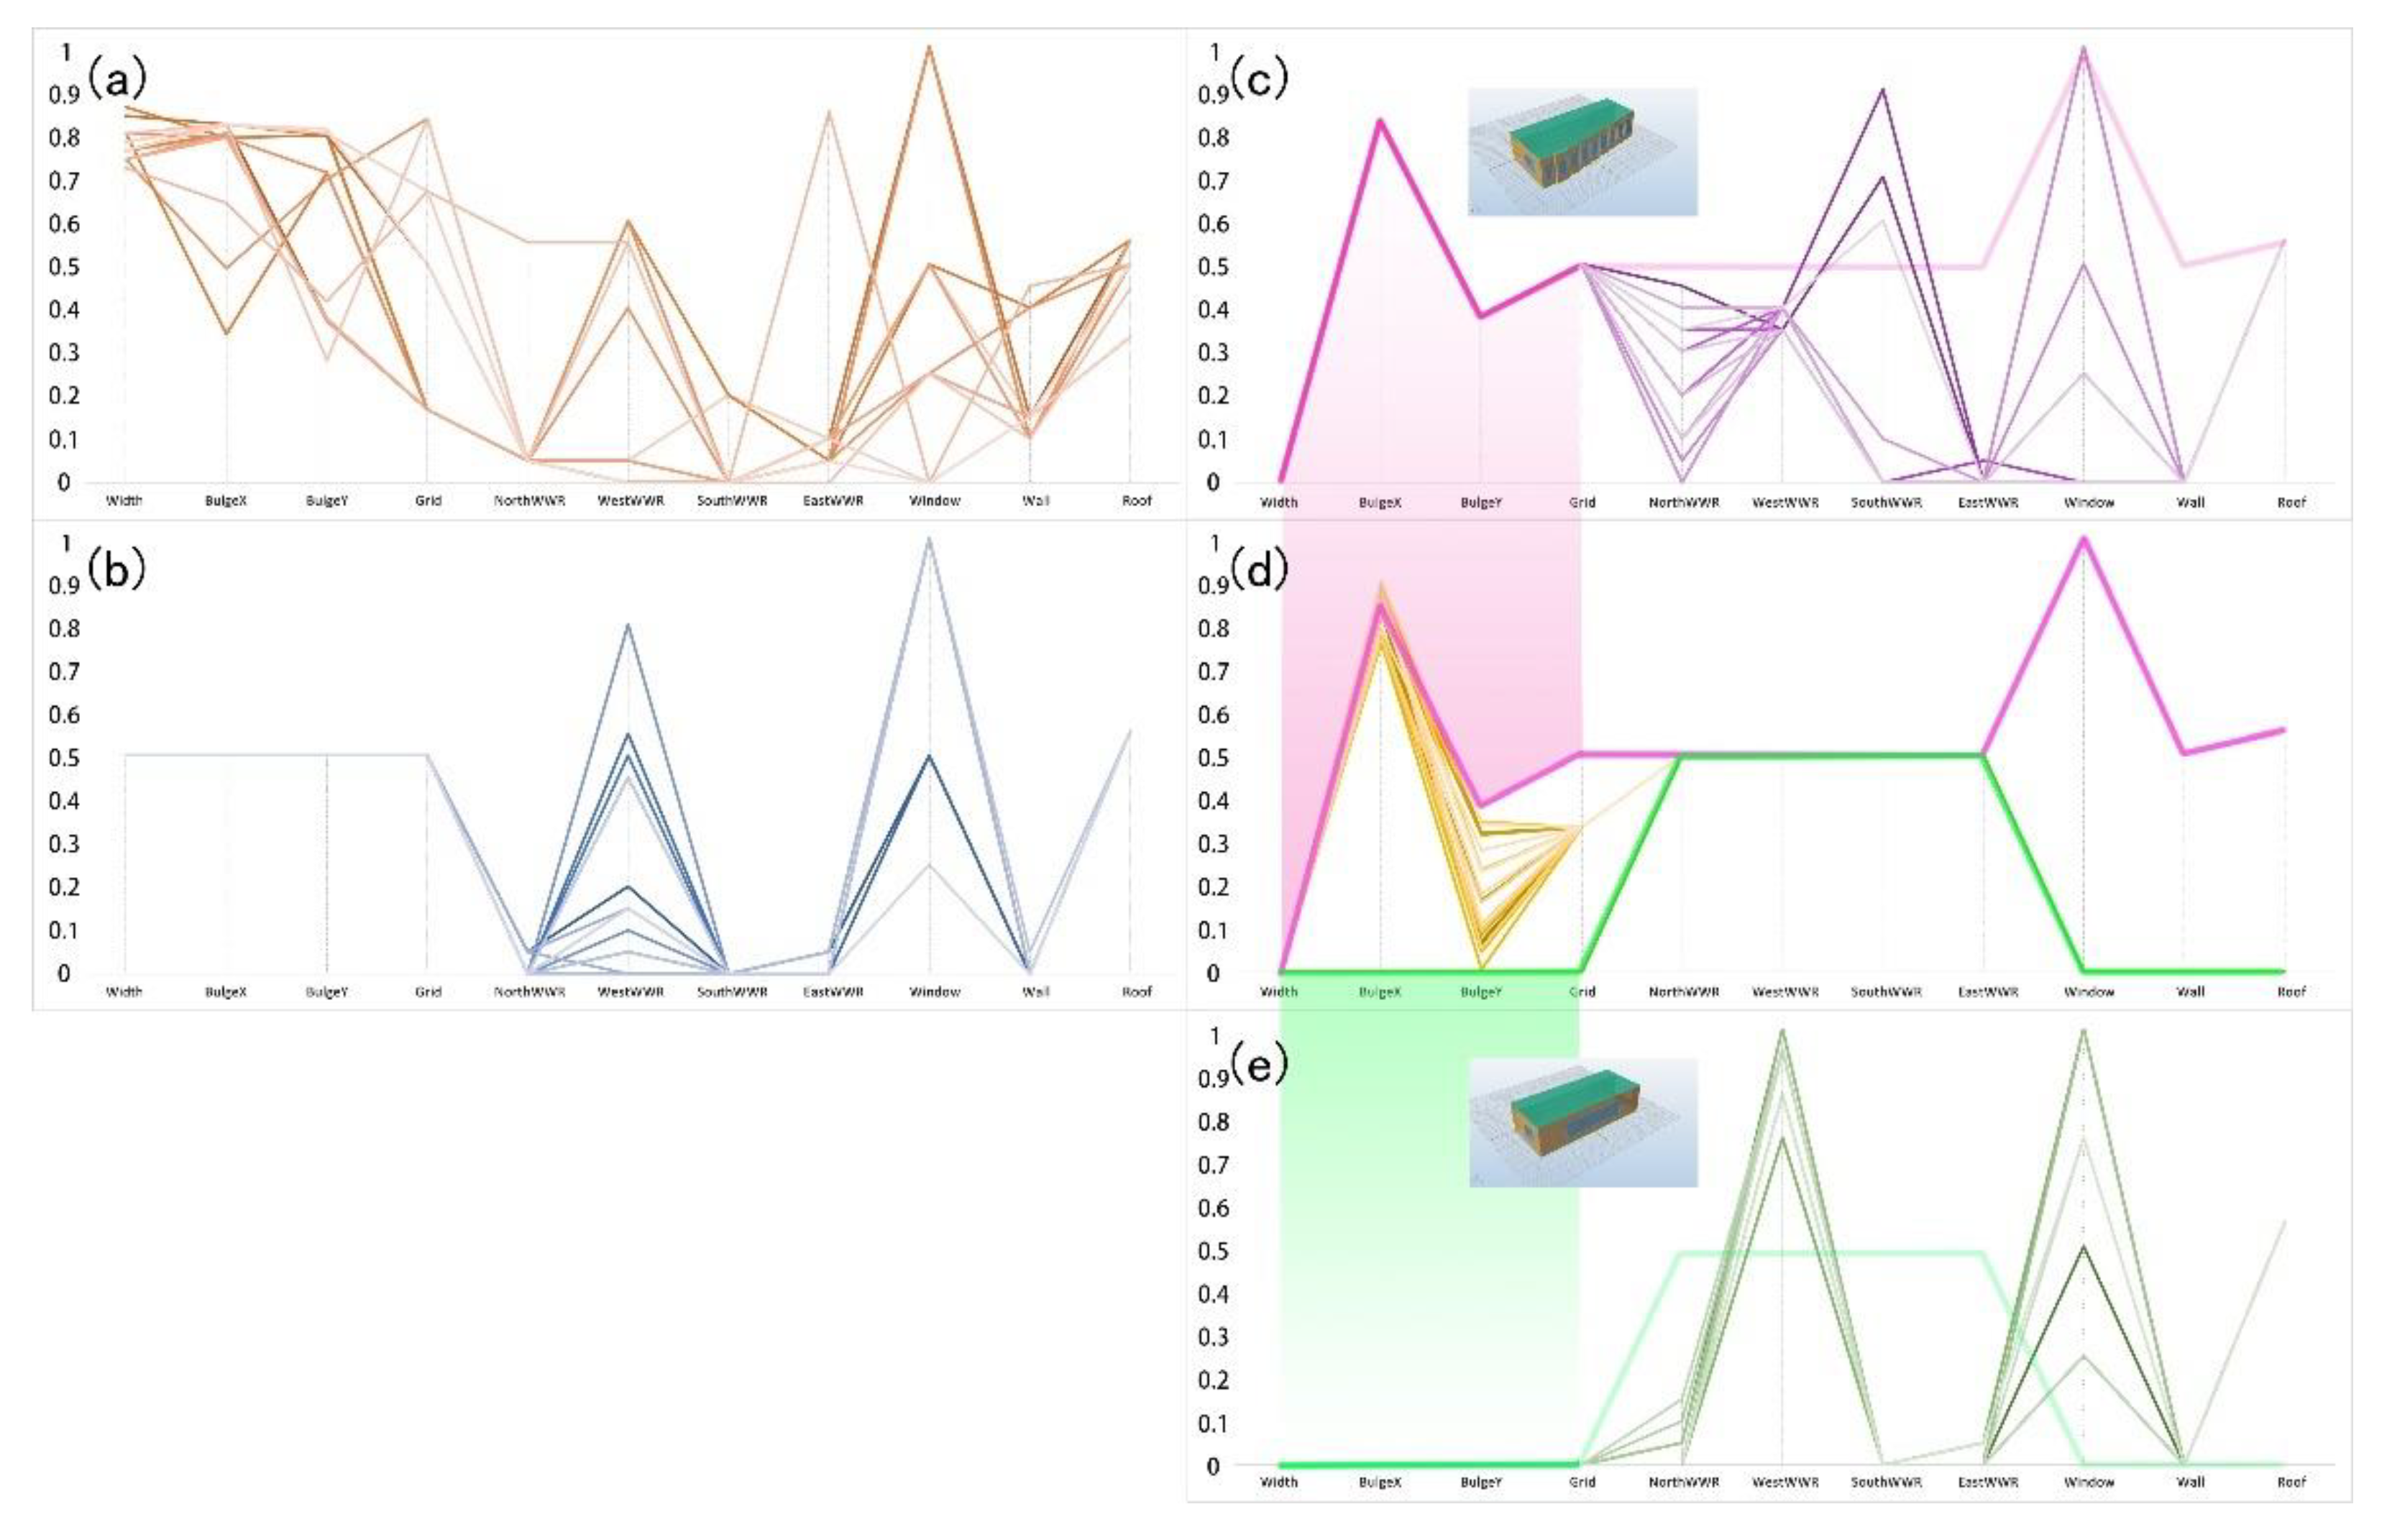
4.3. Variables’ Values of the Optimal Solution Sets
Although the result values of the objectives in each optimization workflow have only a small difference, the values of the design variables corresponding to the optimal solution set are relatively scattered. Defining the range of all the variables from the optimizations in the range of 0 to 1, and then normalizing the variable values corresponding to the optimal solution set in this range (
Figure 8), the one-step optimization process’ geometric parameters are the most scattered, and the resulting geometric shapes are diverse. The architects can choose from them according to the aesthetic and functional design intentions. In the other optimization workflows, the geometric parameters are more settled. Moreover, the best values for the window-to-wall ratio and material variables are relatively concentrated.
In order to objectively evaluate the diversity of variables corresponding to the optimal solution set, the standard deviations of the above normalized variable values are summed up separately.
Table 6 shows that the standard deviations of the pre-set variables are 0. The larger the standard deviation value, the more diverse the variables are. The highest value of the sum of standard deviation of all the variables of the one-step optimization indicates that the comprehensive diversity of their variable values is the strongest among all processes.
4.4. Discussion
For better integration with the design process, the optimization workflows are examined. Since the solutions in the optimal sets all perform equally well in their life cycle performance, the values of the corresponding variables require more attention in the selection, among which the geometric variables are the most intuitive but also the most subjective. The values of the material variables show a certain degree of aggregation. This aggregation phenomenon can be used as a reference for the preparation of building component variables in the subsequent stages of the design process. The products with properties closer to the values of the above variables among the existing building component products can be selected in the variables’ ranges. The material variables’ value also shows a degree of tradeoff, manifested by a thinner wall or a thicker roof, for example. This phenomenon may be caused by the tradeoff between operational energy consumption and embodied energy consumption in the life cycle.
The standard deviation analysis of the optimal solution set is intended to describe the values of the variables quantitatively and only serves as an aid to decision-making. Since the number of solutions in each optimal solution set is not large, the standard deviation values are not statistically valuable. Other methods describing the solution space are not used because they do not reflect the diversity of the variables’ values in this case.
By comparing the above-mentioned workflows, it can be concluded that setting geometric and material variables in different steps in the entire optimization process has a significant impact on the results. The adjustment of the order of any variable in the stepwise optimization process affects the direction of the final result. Since this study starts with a practical case in architecture, the variables are classified according to geometry and material, and no single variable is ordered and combined individually. By setting the time points at which variable groups appear, the whole design scheme can be realigned to address an architectural design priority or performance priority.
5. Conclusions and Perspective
This study establishes an architectural design optimization process for the life cycle environmental impacts and cost targets based on the parametric design platform, combining geometry diversity and variable optimization steps with LCA/LCC methods in the early design phase. The research gap that this study intends to fill is the combination of a geometric model with design intention in the architectural early design stage and an optimization process that includes multiple LCA/LCC objectives. By comparing the optimal solution sets under the four different workflows, it is verified that each set of optimal solutions has its strengths under different objectives while approximating the optimal solution. In the one-step solution searching process, the variables corresponding to the geometric parameters related to the shape are relatively scattered, which allows a high degree of flexibility for architectural design. The architects can then make decisions with the consideration of different emphases and other additional attributes such as aesthetic and functional concerns. The workflows with restrictions on the initial geometric layout and shape lead to no disadvantages in the optimal solution sets’ life cycle performance or the calculation’s duration, although the diversity of architectural design is very limited. The design optimization method proposed in this study provides architects with a basis for achieving the final formulation of the design in conditions with a great deal of uncertainty. The findings of this study do not improve the optimal values of the optimization objectives or the computational efficiency, but rather the analysis of different design processes involving optimization algorithms from the idea of form design, which is the main concern of architects at the early stage of architectural design. Without destroying design diversity, it ensures that the generation of early-stage solutions is based on the objectives of optimal building performance throughout the whole process.
In terms of the practical contribution, the parametric model in this study is not only applicable to optimization. Due to its large range of variables, it can be used for subjective exhaustive or randomly generated form studies by architects. Additionally, the optimization phase is not time-consuming in a single calculation and can be quickly reused after changing the pre-sets to explore more approximate optimal solutions under other conditions.
In terms of the limitation of this research, the geometric mass model in the early design stage can only contain limited information about the project. Since the volumes containing the main functional spaces dominate the geometric model at this stage of architectural design, this study did not consider the auxiliary space of the building. The question of how to refine the model while preserving the geometric characteristics in the transformation from this stage to the next needs to be addressed. In terms of material and construction, the material and thermal calculation only concerns the building’s envelope in the early design stage. The structure frames and the equipment components are not considered as variables. A larger number of unquantified parameters will need to be considered in the subsequent design stages. Whether to consider them as variables or default values, as well as their inheritance relationship with the variables in the previous stages, needs to be explored in future studies.
Author Contributions
H.Y.: Methodology, Software, Data curation, Writing—Original draft preparation; W.Y.: Supervision, Conceptualization, Methodology, Reviewing and modification of the final version; Q.L.: Preparation for the basic data of the case study project; J.L.: Software—Simulation parameter setting. All authors have read and agreed to the published version of the manuscript.
Funding
The authors acknowledge the National Natural Science Foundation of China for the financial support given to this research under the process numbers of 51878436 and 51478294.
Institutional Review Board Statement
Not applicable.
Informed Consent Statement
Not applicable.
Data Availability Statement
This contribution is the further exploration based on previous findings on the relevant topics that had been published in a conference paper [
27] and a Chinese journal article [
39] presented by the same authors.
Acknowledgments
Information of the case study project is provided by Jie Zhu from Tianjin University Research Institute of Architectural Design and Urban Planning Co., Ltd.
Conflicts of Interest
The authors declare no conflict of interest.
Appendix A
Figure A1.
Site plan of the case study.
Figure A1.
Site plan of the case study.
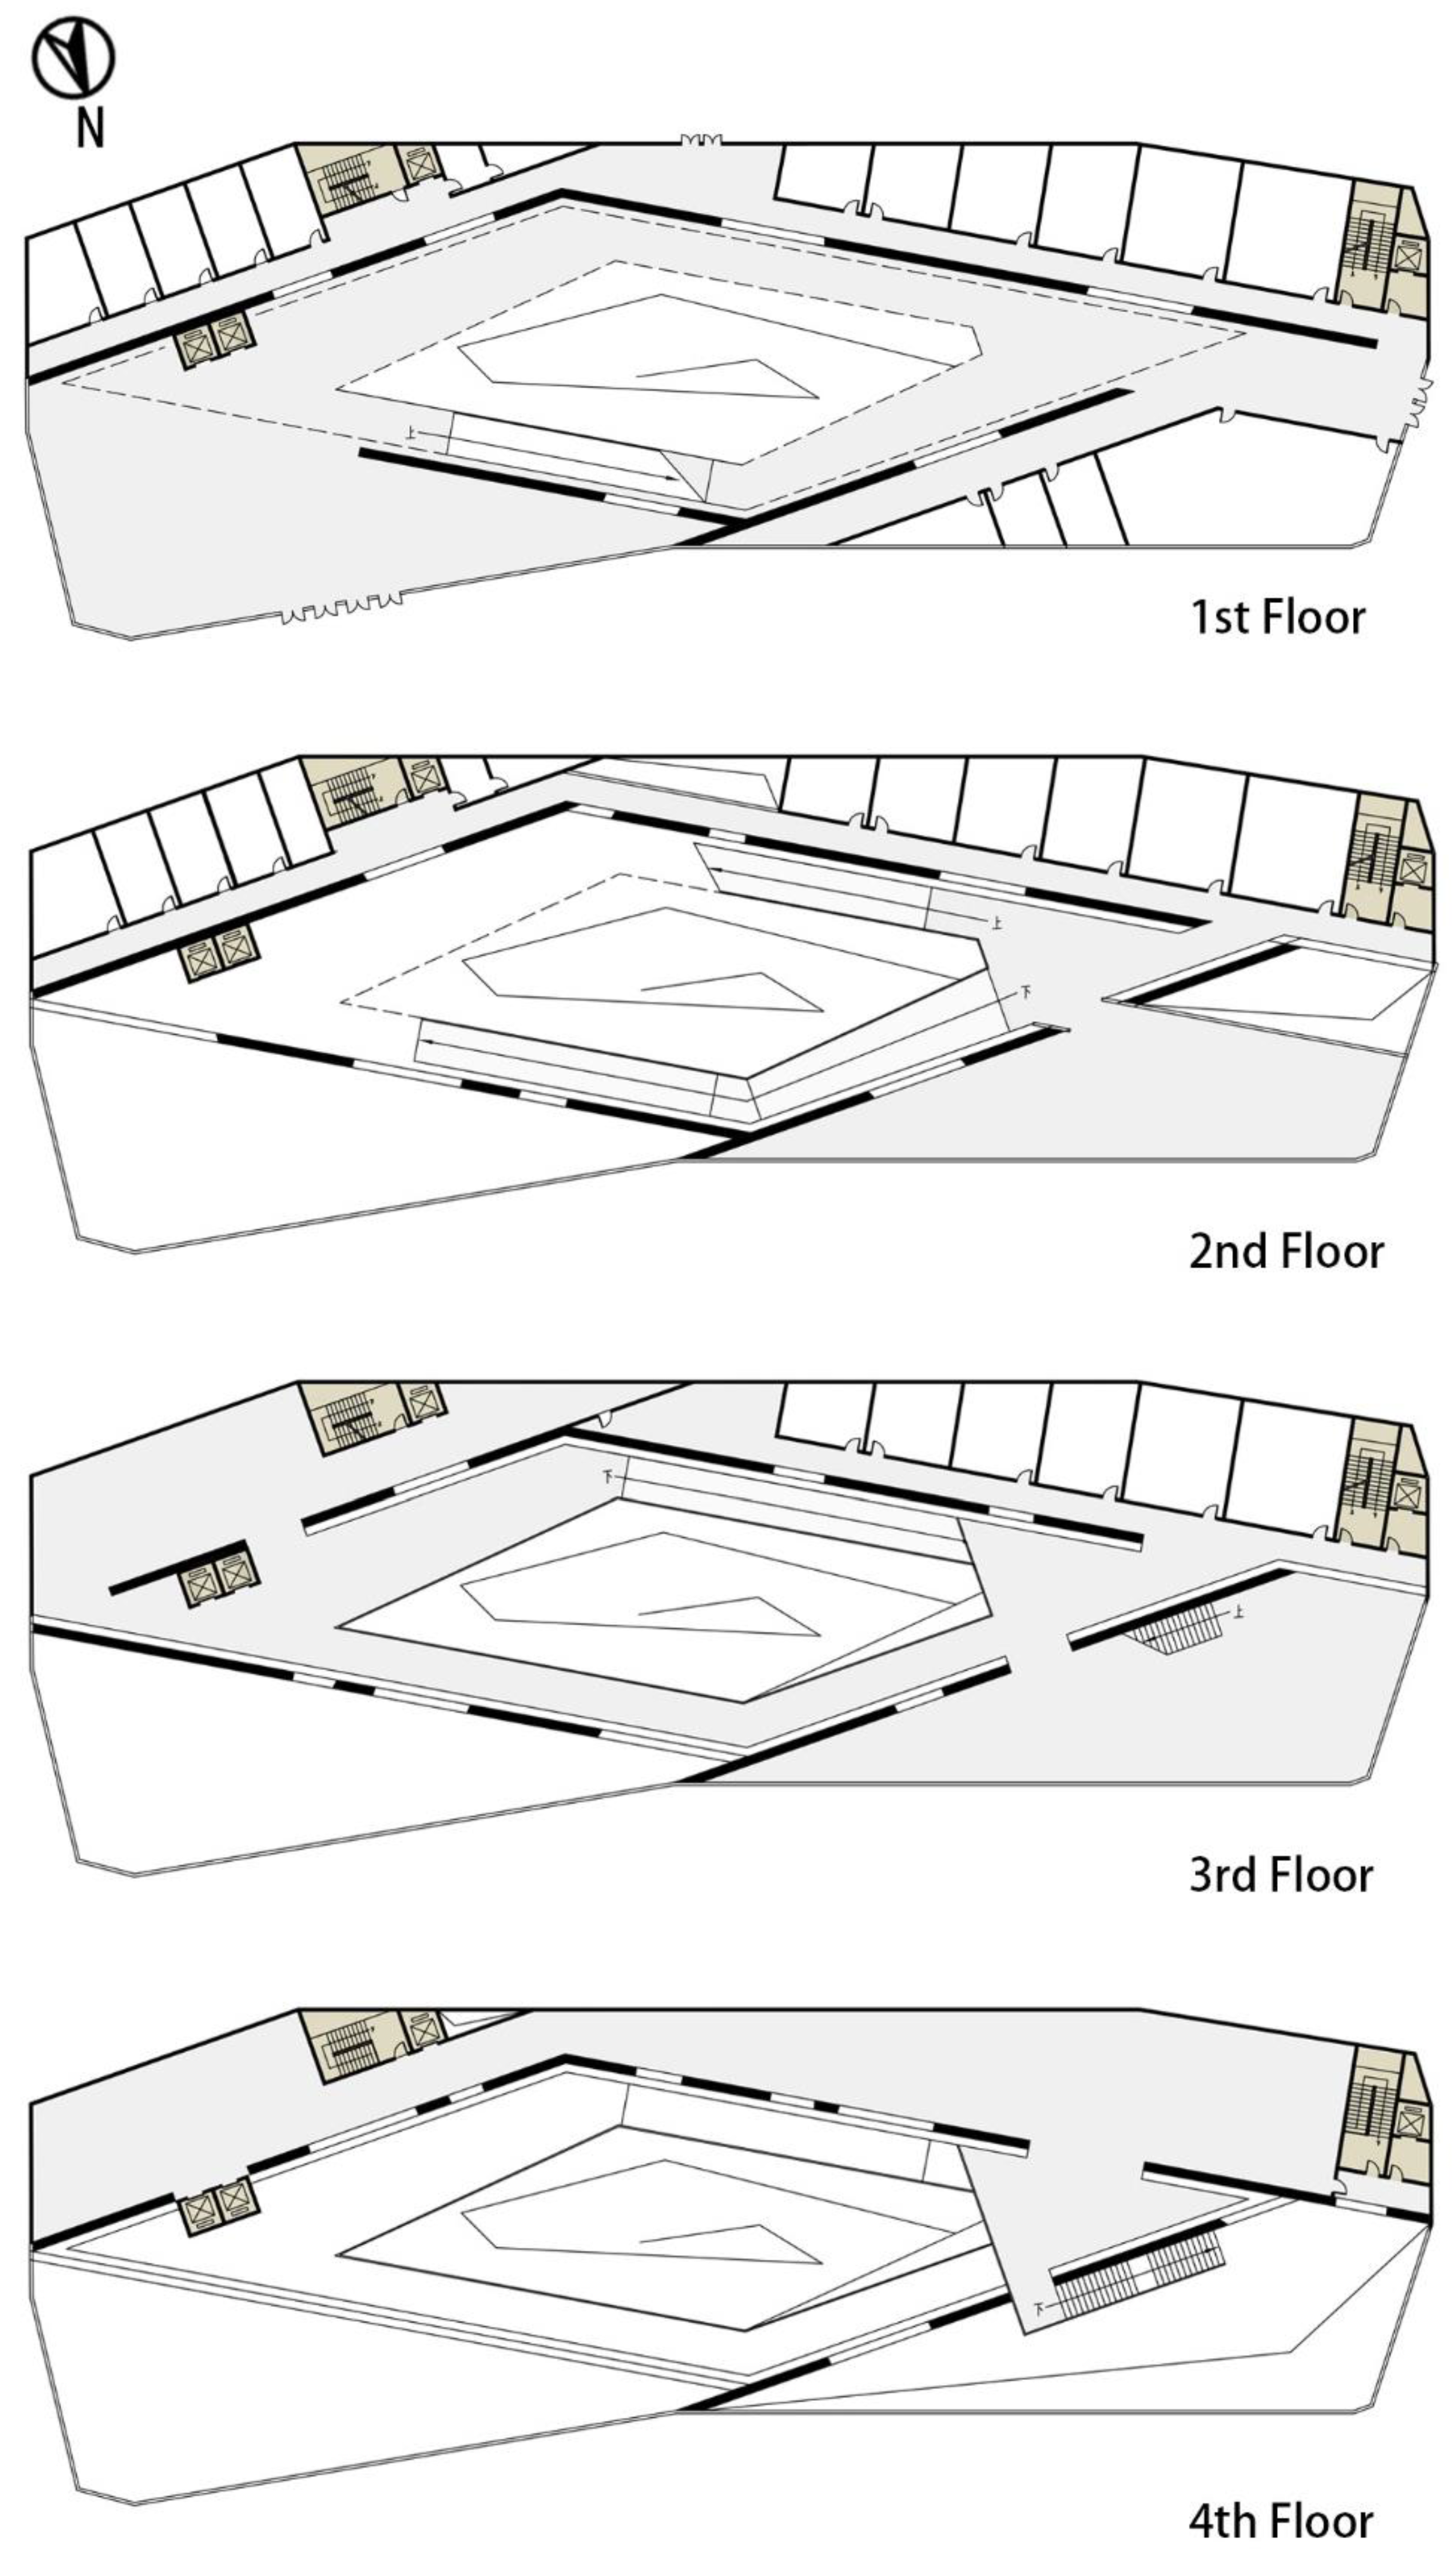
Figure A2.
Floor plans of the case study.
Figure A2.
Floor plans of the case study.
Figure A3.
North elevation of the case study.
Figure A3.
North elevation of the case study.
Appendix B
Table A1.
Environmental data of materials used (Life cycle stages A1–A3).
Table A1.
Environmental data of materials used (Life cycle stages A1–A3).
| Categories | Components | Unit | PED
[MJ] | GWP
[kg CO2 eq] | Database | Initial Cost
[Yuan] | Initial Cost’s Unit | RSL [a] |
|---|
| Insulation material | Rock wool panel | kg | 17.4 | 1.41 | Ecoinvent | 474.61 | m3 | 30 |
| XPS panel | kg | 96.1 | 4.57 | CLCD | 747.2 | m3 | 30 |
| Structure | Autoclaved aerated
concrete block | m3 | 2300 | 323 | CLCD | 463.93 | m3 | >50 |
| | Reinforced concrete | kg | 1.077 | 0.146 | Ecoinvent | 743.66 | m3 | >50 |
| Cladding | Stone panel | m2 | 535.76 | 35.92 | ÖKOBAUDAT | 805.56 | m2 | 30 |
| | Aluminium frame | kg | 51.86 | 10.68 | ÖKOBAUDAT | 340.44 | m2 | 30 |
| | Cement mortar | kg | 2.02 | 0.289 | Ecoinvent | 49.23 | m2(10mm thickness) | 20 |
| | Polymer waterproofing membrane | kg | 83.7 | 3.3 | CLCD | 5.69 | m2 | 30 |
| | Thermal insulation mortar | kg | 2.05 | 0.29 | ÖKOBAUDAT | 33.72 | m2 | 30 |
| | Perlite insulating concrete | kg | 14.58 | 1.23 | Ecoinvent | 366.26 | m3 | 30 |
| Window | Double Low-E(A) | m2 | 1792.07 | 131.54 | Added by Low-E glass and Bridge-cut aluminium alloy data from CLCD | 756.78 | m2 | 30 |
| | Triple Low-E(A) | m2 | 2362.21 | 172.58 | 963.61 | m2 | 30 |
| | Triple Low-E(A)
(Argon filled) | m2 | 2387.27 | 174.53 | 1313.61 | m2 | 30 |
| | Double Low-E(WA) | m2 | 3301 | 180 | 3104 | m2 | 30 |
| | Triple Low-E(WA) | m2 | 3520.52 | 193.91 | 3311 | m2 | 30 |
| Energy | Electricity | kW·h | 11.84 | 0.9419 | a | 0.9 | kW·h | - |
| | Natural gas | m3 | 15.49 | 0.28 | CLCD | - b | - | - |
References
- United Nations Environmental Programme. 2021 Global Status Report for Buildings and Construction. Available online: https://www.unep.org/resources/report/2021-global-status-report-buildings-and-construction (accessed on 1 June 2022).
- China Building Energy Consumption Research Report 2020. Build. Energy Effic. 2021, 49, 1–6, (In English and Chinese).
- Dixit, M.K. Life cycle embodied energy analysis of residential buildings: A review of literature to investigate embodied energy parameters. Renew. Sustain. Energy Rev. 2017, 79, 390–413. [Google Scholar] [CrossRef]
- ISO 14040:2006; Environmental Management—Life Cycle Assessment—Principles and Framework. International Organization for Standardization: Geneva, Switzerland, 2006.
- ISO 21929-1:2011; Sustainability in Building Construction—Sustainability Indicators—Part 1: Framework for the Development of Indicators and a Core Set of Indicators for Buildings. International Organization for Standardization: Geneva, Switzerland, 2011.
- Ostermeyer, Y.; Wallbaum, H.; Reuter, F. Multidimensional Pareto optimization as an approach for site-specific building refurbishment solutions applicable for life cycle sustainability assessment. Int. J. Life Cycle Assess 2013, 18, 1762–1779. [Google Scholar] [CrossRef] [Green Version]
- Shadram, F.; Mukkavaara, J. An integrated BIM-based framework for the optimization of the trade-off between embodied and operational energy. Energy Build. 2018, 158, 1189–1205. [Google Scholar] [CrossRef]
- Fu, Y.; Wang, L.; Li, L. Conceptual design scheme automatic generation and decision-making considering green demand. Procedia Manuf. 2020, 43, 407–414. [Google Scholar] [CrossRef]
- Basbagill, J.; Flager, F.; Lepech, M.; Fischer, M. Application of life-cycle assessment to early stage building design for reduced embodied environmental impacts. Build. Environ. 2013, 60, 81–92. [Google Scholar] [CrossRef]
- One Click LCA Ltd. One Click LCA. Available online: https://www.oneclicklca.com/ (accessed on 1 December 2021).
- Building Transparency, KT Innovations, Thinkstep, Autodesk. Tally. Available online: http://choosetally.com/ (accessed on 1 December 2021).
- Hollberg, A.; Ruth, J. LCA in architectural design—A parametric approach. Int. J. Life Cycle Assess 2016, 21, 943–960. [Google Scholar] [CrossRef] [Green Version]
- Lolli, N.; Fufa, S.M.; Inman, M. A Parametric Tool for the Assessment of Operational Energy Use, Embodied Energy and Embodied Material Emissions in Building. Energy Procedia 2017, 111, 21–30. [Google Scholar] [CrossRef]
- Negendahl, K. Building performance simulation in the early design stage: An introduction to integrated dynamic models. Autom. Constr. 2015, 54, 39–53. [Google Scholar] [CrossRef]
- Si, B.; Wang, J.; Yao, X.; Shi, X.; Jin, X.; Zhou, X. Multi-objective optimization design of a complex building based on an artificial neural network and performance evaluation of algorithms. Adv. Eng. Inform. 2019, 40, 93–109. [Google Scholar] [CrossRef]
- Negendahl, K.; Nielsen, T.R. Building energy optimization in the early design stages: A simplified method. Energy Build. 2015, 105, 88–99. [Google Scholar] [CrossRef]
- Jin, J.-T.; Jeong, J.-W. Optimization of a free-form building shape to minimize external thermal load using genetic algorithm. Energy Build. 2014, 85, 473–482. [Google Scholar] [CrossRef]
- Yi, Y.K.; Malkawi, A.M. Optimizing building form for energy performance based on hierarchical geometry relation. Autom. Constr. 2009, 18, 825–833. [Google Scholar] [CrossRef]
- Harter, H.; Singh, M.M.; Schneider-Marin, P.; Lang, W.; Geyer, P. Uncertainty Analysis of Life Cycle Energy Assessment in Early Stages of Design. Energy Build. 2020, 208, 109635. [Google Scholar] [CrossRef]
- Shadram, F.; Mukkavaara, J. Exploring the effects of several energy efficiency measures on the embodied/operational energy trade-off: A case study of swedish residential buildings. Energy Build. 2019, 183, 283–296. [Google Scholar] [CrossRef]
- Yang, M.-D.; Lin, M.-D.; Lin, Y.-H.; Tsai, K.-T. Multiobjective optimization design of green building envelope material using a non-dominated sorting genetic algorithm. Appl. Therm. Eng. 2017, 111, 1255–1264. [Google Scholar] [CrossRef]
- Brunelli, C.; Castellani, F.; Garinei, A.; Biondi, L.; Marconi, M. A Procedure to Perform Multi-Objective Optimization for Sustainable Design of Buildings. Energies 2016, 9, 915. [Google Scholar] [CrossRef] [Green Version]
- Abbasi, S.; Noorzai, E. The BIM-Based multi-optimization approach in order to determine the trade-off between embodied and operation energy focused on renewable energy use. J. Clean. Prod. 2021, 281, 125359. [Google Scholar] [CrossRef]
- Ascione, F.; Bianco, N.; Mauro, G.M.; Vanoli, G.P. A new comprehensive framework for the multi-objective optimization of building energy design: Harlequin. Appl. Energy 2019, 241, 331–361. [Google Scholar] [CrossRef]
- Li, H.; Wang, S. Coordinated optimal design of zero/low energy buildings and their energy systems based on multi-stage design optimization. Energy 2019, 189, 116202. [Google Scholar] [CrossRef]
- Ascione, F.; Bianco, N.; De Masi, R.F.; Mauro, G.M.; Vanoli, G.P. Resilience of robust cost-optimal energy retrofit of buildings to global warming: A multi-stage, multi-objective approach. Energy Build. 2017, 153, 150–167. [Google Scholar] [CrossRef]
- Yu, H.; Yang, W.; Li, Q. Multi-objective optimization of building’s life cycle performance in early design stages. IOP Conf. Ser. Earth Environ. Sci. 2019, 323, 012116. [Google Scholar] [CrossRef]
- GB/T 51161-2016; Standard for Energy Consumption of Building. Ministry of Housing and Urban-Rural Development of the People’s Republic of China: Beijing, China, 2016.
- GB 50189-2015; Design Standard for Energy Efficiency of Public Buildings. Ministry of Housing and Urban-Rural Development of the People’s Republic of China: Beijing, China, 2015.
- Battisti, A.; Persiani, S.G.L.; Crespi, M. Review and Mapping of Parameters for the Early Stage Design of Adaptive Building Technologies through Life Cycle Assessment Tools. Energies 2019, 12, 1729. [Google Scholar] [CrossRef] [Green Version]
- Competence Centre of the Swiss Federal Institute of Technology. Available online: https://www.ecoinvent.org/ (accessed on 1 December 2021).
- GmbH, S.S. Gabi. Available online: http://www.gabi-software.com/ (accessed on 1 December 2021).
- Beibob Medienfreunde, greendelta, IBO—Österreichisches Institut für Bauen und Ökologie GmbH, KIT—Institute for Applied Computer Science, Okworx, Online Now! GmbH, Sphera Solutions GmbH. IBO—Österreichisches Institut für Bauen und Ökologie GmbH, KIT—Institute for Applied Computer Science, Okworx, Online Now! GmbH, Sphera Solutions GmbH. ÖKOBAUDAT. Available online: https://www.oekobaudat.de/ (accessed on 1 December 2021).
- Group, B. IMPACT Database. Available online: https://www.bregroup.com/impact/the-impact-database/ (accessed on 1 December 2021).
- IKE Environmental Technology, Co. Available online: http://www.efootprint.net/#/home (accessed on 1 December 2021).
- Sadeghipour Roudsari, M.; Pak, M. Ladybug: A parametric environmental plugin for grasshopper to help designers create an environmentally-conscious design. In Proceedings of the BS 2013: 13th Conference of the International Building Performance Simulation Association, Chambéry, France, 26–28 August 2013; pp. 3128–3135. [Google Scholar]
- University of Applied Arts Vienna, Bollinger+Grohmann Engineers. Octopus. Available online: https://www.food4rhino.com/app/octopus (accessed on 1 December 2021).
- Tomasetti, T. Design Explorer. Available online: https://tt-acm.github.io/DesignExplorer/ (accessed on 1 December 2021).
- Yang, W.; Yu, H. Optimizing building’s life cycle environmental impacts and costs in the design process. Archit. J. 2021, 2, 35–41. [Google Scholar]
| Publisher’s Note: MDPI stays neutral with regard to jurisdictional claims in published maps and institutional affiliations. |
© 2022 by the authors. Licensee MDPI, Basel, Switzerland. This article is an open access article distributed under the terms and conditions of the Creative Commons Attribution (CC BY) license (https://creativecommons.org/licenses/by/4.0/).


