Abstract
Groundwater is essential for both water supply and environmental conservation, especially in semi-arid and desert areas. Managing groundwater resources requires a thorough understanding of groundwater characteristics and dynamics. The hydrogeochemical properties and evolution of groundwater in the Essaouira synclinal basin in northwest Morocco were studied in this research, with 105 water samples collected in 2009, 2017, 2018, and 2019. The Water Quality Index (WQI) and Irrigation Water Quality Index (IWQI) were developed to determine groundwater quality for consumption and irrigation purposes. The chemical evolution of groundwater is mainly dominated by evaporite, mineral carbonate dissolutions, and cation exchange. Contamination by nitrates is particularly severe in agricultural and tourist areas. The WQI of the 2019 campaign showed that 6.7% of groundwater samples are unsuitable for drinking; 76.7% are poor quality water; and 13.3% are very poor-quality water; while only 3.3% are drinkable. According to IWQI, the total study area has been split into 50% (good), 43.3% (bad), and 6.6% (unfit), respectively, and no excellent groundwater areas have been identified. Therefore, the water is suitable for agriculture but must be treated for drinking. The presence of evaporation and maritime intrusion and the contribution of recent precipitations to aquifer recharging were demonstrated by stable isotope content.
1. Introduction
Groundwater is an essential strategic factor in encouraging economic and social growth in many parts of the world. The increasing population has caused rapid socio-economic change due to the unsustainable use of freshwater reserves in recent years [1,2,3]. Groundwater in aquifers is a vital source of drinking water, but it is susceptible to pollution. In addition, human activity significantly affected surface and groundwater in the previous century, introducing various toxins [4,5]. Furthermore, an assessment of groundwater chemistry and quality will identify possible variables that influence the chemical composition of groundwater and recognize the causes of groundwater contamination [6,7,8,9,10]. These variables will contribute to significant steps towards conserving and sustainable use of groundwater resources. However, to ensure access to safe drinking water for the growing population, it is necessary to protect and use the water supply carefully and responsibly [10,11,12]. To achieve this goal, the origins and hydrochemistry of water must be established. These two fundamental aspects are at the heart of any study of groundwater treatment.
The hydrochemical method is one of the most common and effective approaches to identify groundwater circulation. Along the general groundwater flow direction, the ions’ concentrations change because of water–rock interactions between groundwater and aquifer materials. The chemical composition of groundwater is controlled by the composition and quantity of rainfall, the geological structure, the aquifer minerals, and hydrochemical evolution processes along flow paths [13,14,15].
All the critical factors contributing to the salinity of the aquifer are the proximity of the coastal aquifer to the sea, the prevalence of sand and gravel soils in the area, agricultural activity, and the hydraulic properties of the aquifer [16,17]. The chemical composition of groundwater is influenced by several factors, including precipitation composition, geological structure and mineralogy of sandy aquifers in watersheds, and geochemical processes in aquifers [10,11,18,19,20,21,22].
The reversal of groundwater flow in recent years has resulted in seawater intrusion into the interior along the coastal belt due to heavy pumping of groundwater, especially in summer, making the borehole and the open well unsuitable for agricultural production and consumption [23,24]. Researchers have assessed groundwater quality in several arid and semi-arid countries, notably: Morocco, Tunisia, Egypt, and India [10,23,25,26,27,28]. Various techniques are used to assess water quality; we cited the following for drinking uses [7,25,29,30,31].
In North African arid/desert lands, groundwater (depth > 500 m) is the only source of water supply for most of the local demand (agricultural, industry, tourism, and domestic). Like most countries in the world, the populations of southern Mediterranean countries live under water stress (<450 l/person/year), defined as those using more than 20% of their renewable water resources. In contrast, over 40–50% withdrawal means severe water stress. Currently, the ONU estimates that in 2025, 25 African countries will suffer from water scarcity or water stress. According to UNEP (2006, 2010, and 2011), about 1100 million people do not have access to clean drinking water (surface and/or groundwater), and contaminated water is the direct cause of 5 million deaths yearly, most of them occurring in sub-desertic Africa.
At the national level, water issues, especially groundwater salinization, have become the center of interest for scientific researchers and managers. Several studies across the country have raised it. Morocco, like many Mediterranean countries, has suffered from several drought periods since the 1980s. Its water resources are limited; they are estimated at 20 billion cubic meters, or an average of 700 m3/year/inhabitant, corresponding to a reasonably high-water stress situation. The number of years in a rainfall deficit is greater than the number of wet years, with a general downward trend of 23%.
According to its extension and location, one of the most critical aquifers in Morocco is the Plio-Quaternary aquifer of the Essaouira basin, located in the western part of the kingdom of Morocco. In order to assess the quality evolution of this vital resource, especially groundwater, within areas under semi-arid climate and in terms of climate change, the Essaouira basin is used as an example. In the last decades, this basin has experienced a succession of drought periods, leading to a degradation of its groundwater quality. The Essaouira basin is one of the most critical basins in Morocco; it contains 10% of the total aquifer at the national level (8 aquifers out of 80) [32,33,34,35,36,37,38]. Therefore, to improve water resource management in these regions, it is essential to understand the primary process of controlling groundwater mineralization [1,18,20,24,39].
Water quality index (WQI) measures the quality of water for drinking and other purposes, the WQI was defined by Horton [40] and posteriorly developed by Brown, McClelland [17,21,41]. It transfers several water parameters to give only a single number to assess the overall water quality at a certain location and time [12,42,43]. WQI is a valuable and unique rating to depict the overall water quality status in a single term that helps for selecting proper treatment technique. It was used in several studies to assess groundwater quality [44,45,46,47,48].
Understanding the sources and mechanisms of groundwater recharge in the Essaouira synclinal basin, a semi-arid area in northwest Morocco, is essential for water resource management and coal mine safety [49,50]. Hydrochemical and stable hydrogen and oxygen isotopic data were used to study water-rock interactions and groundwater recharge in many regions [22,51,52,53].
This article aimed to understand variations in groundwater quality, the main factors affecting water quality in the KSOB sub-basin over the last ten years, and the current condition. The primary objectives were: Firstly, to assess the drinking water quality status of groundwater. Secondly, to characterize the associated geochemical mechanisms that govern the geochemical evolution of groundwater.
The spatial distribution of the physicochemical parameters and water quality index was generated using the inverse distance weighted interpolation method (IDW).
The findings will provide a detailed understanding of the drinking water quality of groundwater, which will enable policymakers to properly tackle groundwater issues and design sustainable management of groundwater supply in the regions of Essaouira. This study demonstrates that combining WQI and GIS methods could be a helpful tool for water resources management.
2. Materials and Methods
2.1. Location and Climate
The KSOB sub-basin is located southwest of Morocco, in the Essaouira basin, at a latitude range between 31.34° N–31.42° N, a longitude range between −9.61° E − −9.83° E. The research area is bordered by the TIDZI DIAPER and the Atlantic Ocean. This sub-basin covers an area of 300 km2 (Figure 1). The climate is unusual and very particular: it is mild or cool most of the year. The cold current flowing along Morocco’s Atlantic coast lowers summer temperatures to the point that highs remain around 20 °C even in July and August. The wind is another constant in this climate; it often blows, especially as an afternoon breeze in summer. Another characteristic of this climate is fog and haze, which affect this coastal region, especially in the mornings, then dissolve in the afternoon. Rainfall is scarce, typical of a semi-arid climate, at around 300 mm per year (Figure 2), most of which occurs from October to April. Usually, the rain comes in the form of short showers, sometimes heavy.
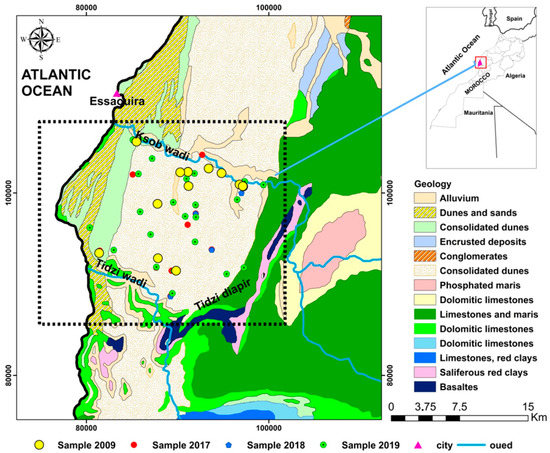
Figure 1.
Schematic map of the sampling sites and geology of the synclinal basin of Essaouira.
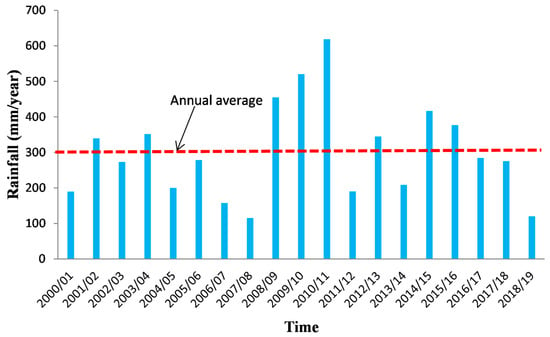
Figure 2.
Precipitation evolution at Essaouira bassin for the period 2000–2019.
2.2. Geologic Setting
The two principal aquifers in the lower section of the Essaouira basin are the Turonian and Plio-Quaternary aquifers, found between KSOB Wadi and Tidzi Wadi, which serve as the study area’s primary groundwater supplies [50,54]. The Plio-Quaternary is a limestone sandstone matrix of up to sixty meters of different thicknesses. The Turonian aquifer consists of a confined aquifer belonging to the Senonian marls of the synclinal system, the thickness of which, in certain areas, exceeds 200 m, represented by limestone.
2.3. Hydrogeologic Setting
The aquifer underlies the KSOB sub-basin (Figure 1), and its recharge sources are irrigation and precipitation. It has a groundwater flow direction from the northeast to the southwest [12,23,42]. Transmissivity levels of approximately (4.5−5) m2/s from pumping experiments conducted inside the aquifer [55]. According to Bahir [54], the hydraulic permeability is 3.2 × 10⁻² m/s.
2.4. Analytical Techniques and Groundwater Sampling
One hundred five samples were collected from surface water, wells, and boreholes during a series of sampling campaigns conducted in 2009, 2017, 2018, and 2019 (Table 1) in the downstream part of the Essaouira basin, and the extension of Table 1 and Table 6 of all 105 sample are available in the supplementary material. The Plio-Quaternary and the Turonian aquifer are captured by all the wells sampled. The Hana HI9828 multiparameter was used to measure physicochemical parameters such as pH, electrical conductivity (EC), temperature (T), and total dissolved solids (TDS) in the KSOB sub-basin. With a two-hundred-meter piezometric sound probe, the depth of the water level was determined. The Analysis used ion chromatography to investigate the primary chemical elements (SO42−, Na+, HCO3−, K+, Ca2+, NO3−, Cl−, and Mg2+) for the 2009 campaign [56]. Alkalinity is determined from the sulfuric acid solution using a pH meter. Chemical element studies were carried out for the 2017 and 2018 campaigns at the Laboratory of Geosciences and Environment (LGE) at ‘Ecole Normale Superieure (ENS)’ of Marrakech city (Cadi Ayyad University, Marrakech, Morocco). Mohr titration with 0.1 N HCL was used to measure the concentrations of Cl−, CO3−, and HCO3−. For the 2019 campaign, Analyses of chemical elements: HCO3−, NO3−, Mg2+, Cl−, Ca2+, SO42− tests were carried out in the Laboratory of ENS (Cadi Ayyad University, Marrakch, Morocco), and the two parameters Na+ and K+ were determined using emission spectrometry in the University Center for Analysis, Tecnology Transfer & Incubation Expertise (CUAE2TI) at “Faculty of Sciences” (lbn tofail University, Morocco).

Table 1.
Summary of descriptive statistics of different hydrochemical parameters of all the 105 groundwater samples from four campaigns: 2009, 2017, 2018 and 2019.
Heavy metals of the campaign 2019 of the July month were realized in the International Water Research Institute at Mohammed VI Polytechnic University from Morocco using a SKALAR San++ Continuous Flow Analyzer (CFA).
The study’s findings were confirmed based on the ionic balance (IB). Furthermore, the total of cation concentrations (Ca2+, Na+, K+, Mg2+) should equal the total of the ani-on concentrations (NO3−, SO4−, HCO3−, Cl−) within a tolerable margin of error, prefera-bly 5% but up to 10% is acceptable [57]. The formula (1) was used to calculate the ionic balance (IB).
Within the ±10 range, all analyzed samples were balanced.
2.5. Groundwater Quality: Water Quality Index (WQI)
The Drinking Water Quality Index (DWQI) is a perfect method for assessing drinking water quality and regulating water sources [58]. The WQI evaluation standard, according to Xiao [59], focuses on analyzing distinct chemical components and indicates the effect of different chemical factors on the overall quality of drinking water [29]. Also, these indicators have been adapted to evaluations of water quality worldwide, especially in the Essaouira Basin concurrent study area, with substantial impacts on the population and decision-makers for managing groundwater resources [29,40,58,59]. The following equation (Equation (2)) was used to calculate the water quality index:
The relative weight ωi is the weight of each chemical parameter calculated for drinking purposes by its relative effects on human health [40,58,59], as shown in Table 2. In each groundwater sample, the measured concentration of each chemical element is called ‘Ci’, and the corresponding standard value for each chemical parameter is called ‘Si’ [60]. Based on WQI values, water quality can be divided into five classes. The quality of water is excellent when WQI is less than 50; the quality of water is good when WQI < 100 and above 50; the quality of water is poor when WQI is between 100 and 200; the quality of water is very poor when WQI range between 200 and 300; groundwater is unsuitable for drinking purposes if WQI above 300. Furthermore, using the IDW tool of Arcgis software version 10.2 (ESRI 1999), the spatial distribution of the estimated WQI values in the Essaouira basin was obtained.

Table 2.
Weight and relative weight of each parameter used for the WQI calculation.
2.6. Irrigation Quality: Irrigation Water Quality Index (IWQI)
The model of the Irrigation Water Quality Index (IWQI) was created as a practical hydrogeological tool for assessing the overall quality of irrigation groundwater [61,62], as amended by Verma [63]. As shown in Table 3, eleven factors were used in the research region to assess water quality for irrigation purposes. Each attribute is given a weight based on its relative importance [61,62,64]. Because of its significance and influence on plant growth and soil quality, electrical conductivity, for example, is given a weighting of five. However, chloride is weighted due to its low concentration in groundwater compared to world standard limits [60]. The water quality index (WQI) is calculated using the following formulas:
where, Qi: quality rating of ith parameter, SLi: subindex of the ith parameter Wi: Relative weight of the ith parameter of IWQI, Si: Standard limits for the ith parameter [60], Ci: the value of the measured concentration in the KSOB sub-basin of ith parameter.

Table 3.
Weight and relative weight of each parameter used for the IWQI calculation.
Water quality is divided into five categories based on IWQI values: good quality (50 < IWQI < 100), poor quality (100 < IWQI < 200), very poor (200 < IWQI < 300), improper quality (IWQI > 300), and excellent quality (IWQI < 50).
2.7. Irrigation Quality: Irrigation Water Quality Index (IWQI)
To measure each parameter’s effect on the IWQI value, and according to Ibrahim [29] and Sener [65] the effective weight (EWi) is determined by dividing the SLi by the IWQI value.
where: EWi is meaning the effective weight value for ith parameter.
3. Results and Discussion
3.1. Groundwater Hydrochemical Types
The piper diagram is a graphical representation used to describe groundwater’s hydrochemical characteristics, forms, and hydrochemical evolution [66,67]. This research obtained a Piper diagram using the diagrammes software version 6.76. The piper is a triangle consisting of the central diamond and two secondary triangles, as shown in Figure 3. The diamond is divided into six sections, each with a different water facies [68]. The diamond indicates the overall hydrochemical characteristics of the water sample, while the triangle represents the relative amount of each ion. The 105 groundwater sites on this diagram show that the groundwater in the KSOB sub-basin research region contained three chemical kinds during the two campaigns in 2017 and 2018. The Ca-Mg-Cl type of water predominates among three facies, the Na-Cl facies is the second dominant chemical water type, and the Ca-Cl water type is also present. The campaign of 2009 has just one water type, Na-Cl. The campaign 2019 has two facies: the Mixed Ca-Mg-Cl water type and the Na-Cl water type. The projections of all groundwater samples from the campaigns going from 2009 to 2019 in the study area are illustrated in Figure 3. The hydrochemical types indicate that the chemical facies have changed due to several factors over the years.
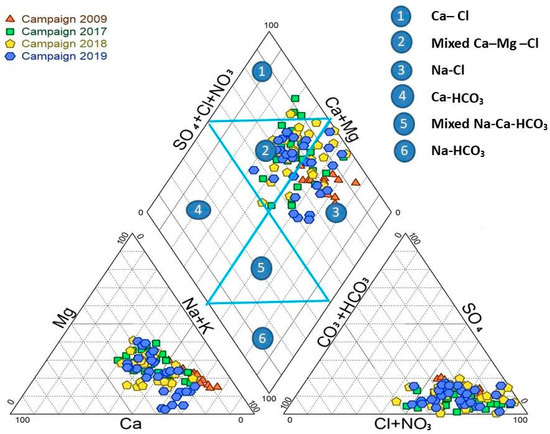
Figure 3.
Piper diagram of analyzed samples of four campaign: 2009, 2017, 2018, and 2019.
3.2. Hydrochemical Characteristics
Table 1 displays the hydrochemical parameter statistical study of 105 groundwater samples collected in 2009, 2017, 2018, and 2019. As shown in Table 1, the concentration of cations in all groundwater samples follows the same order of Na+ > Ca2+ > Mg2+ > K+. However, in the field of research, the order of the concentration of anions of the four groundwater campaigns collected follows the same order: chloride > HCO3− > SO42− > nitrate.
The values of electrical conductivity (EC) in the KSOB sub-basin range from 1671 to 3520 µS/cm with a mean of 2193.8 µS/cm for 2009 samples; from 724 to 7555 µS/cm with a mean of 2217.8 µS/cm for 2017 samples; from 916 to 9744 µS/cm with a mean of 2753.9 µS/cm for 2018 samples, and from 880 to 12,250 µS/cm with a mean of 2775.4 µS/cm for 2019 samples. Furthermore, the spatial distribution of EC values (Figure 4a, Figure 5a, Figure 6a, and Figure 7a) for the four groundwater collected campaigns (2009, 2017, 2018, and 2019) reveals that the groundwater salinity in the area where it drains into the Atlantic Ocean has risen through time.
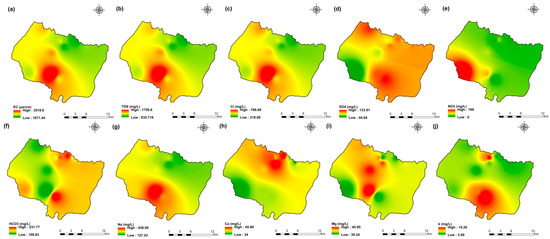
Figure 4.
Spatial distribution maps of all physicochemical parameters (a) EC, (b) TDS, (c) Cl, (d) SO4, (e) NO3, (f) HCO3, (g) Na, (h) Ca, (i) Mg, (j) K of 2009 campaign in the KSOB sub-basin.
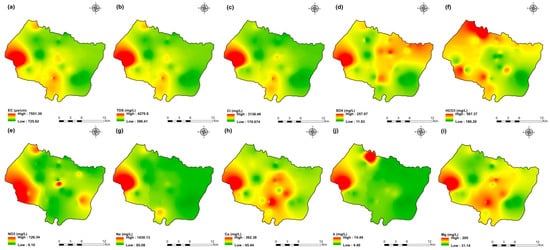
Figure 5.
Spatial distribution maps of all physicochemical parameters (a) EC, (b) TDS, (c) Cl, (d) SO4, (e) NO3, (f) HCO3, (g) Na, (h) Ca, (i) Mg, (j) K of 2009 campaign in the KSOB sub-basin.
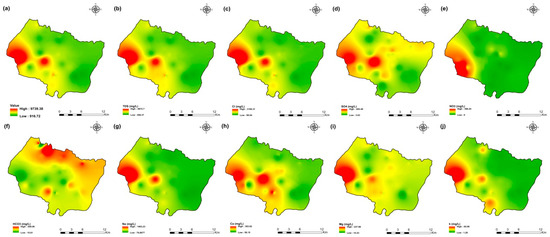
Figure 6.
Spatial distribution maps of all physicochemical parameters (a) EC, (b) TDS, (c) Cl, (d) SO4, (e) NO3, (f) HCO3, (g) Na, (h) Ca, (i) Mg, (j) K of 2009 campaign in the KSOB sub-basin.
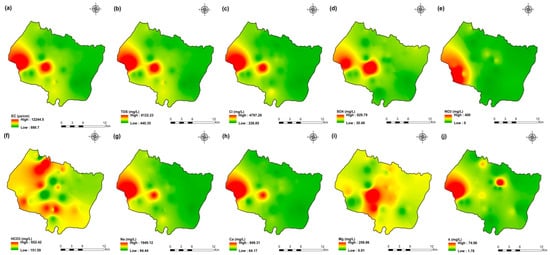
Figure 7.
Spatial distribution maps of all physicochemical parameters (a) EC, (b) TDS, (c) Cl, (d) SO4, (e) NO3, (f) HCO3, (g) Na, (h) Ca, (i) Mg, (j) K of 2009 campaign in the KSOB sub-basin.
The dominant cation has been present in the 105 groundwater samples for four years. Na+ concentrations ranged from 127.42 to 438.15 mg/L in 2009, 85 to 1430.9 mg/L in 2017, 76.75 to 1464 mg/L in 2018, and 84.28 to 1950 mg/L in 2019, respectively, with a mean of 220.06, 254.28, 278.05 and 346.92 mg/L. The Na+ concentrations are increasing toward the Atlantic Ocean (Figure 4g, Figure 5g, Figure 6g, and Figure 7g). Furthermore, silicate and halite dissolution may increase the concentration of sodium in groundwater [6,23,39,69,70]. In addition, sodium can also come from the exchange of ions [71,72]. The average concentrations of K+ were 7.2, 14.63, 11.20, 12.20 mg/L in 2009, 2017, 2018 and 2019, respectively.
The concentration of calcium (Ca2+) ranged from 34 mg/L to 46 mg/L in 2009, from 44.9 mg/L to 368.7 mg/L in 2017, from 57.72 mg/L to 364 mg/L in 2018, and from 64.13 mg/L to 849.70 mg/L in 2019. In 2009, the concentration of Mg2+ ranged from 30.24 to 45.96 mg/L; 31.1 to 205.1 mg/L in 2017; 14.2 to 238 mg/L in 2018; and 6.80 to 260 mg/L in 2019. The mean concentrations of Ca2+ and Mg2+ were 39.54 mg/L and 36.44 mg/L in 2009, 133.84 mg/L and 80.83 mg/L in 2017, 136.75 mg/L and 71.17 mg/L in 2018, 163.29 mg/L and 67.27 mg/L in 2019, respectively.
Chloride concentration (Cl−) is the dominant anion in the 105 groundwater samples in the KSOB sub-basin. Cl− ranges from 218–766.8 mg/L in 2009, 170.4–3138.2 mg/L in 2017, 98.8–3158 mg/L in 2018, and 226.6–4799.6 mg/L for 2019, with a mean of 372.91, 670.64, 641 and 814.25 mg/L, respectively. For all groundwater samples, chloride concentrations are highest in the downstream half of the study area, with an increasing trend toward the Atlantic Ocean, according to the spatial distribution of Cl− (Figure 4c, Figure 5c, Figure 6c, and Figure 7c). However, the average Cl− concentrations show a significant increase over ten years, which could be explained by lower precipitation rates associated with climate change, increasing the solvent load in groundwater [23], and the marine intrusion effect. The average concentrations of HCO3− and SO42− are 182.53−110.33 mg/L in 2009, 337.3−94 mg/L in 2017, and 270.43−127.33 mg/L in 2018, 381.71−145.12 mg/L in 2019, respectively. For the 2009 and 2018 campaigns, the highest amounts were found in the northern half of the research zone. In addition, the highest values were observed in the southern portion of the study zone in 2017 and 2019 (Figure 4f, Figure 5f, Figure 6f, and Figure 7f). Anthropogenic inputs, such as tourism and agricultural activities, are an important source of nitrate in the groundwater. In the study area, the NO3− concentration was found to vary from zero to 199 mg/L in 2009, from 6 to 126.5 mg/L in 2017, from zero to 398.25 mg/L in 2018 and from zero to 400 mg/L in 2019. Furthermore, nitrate concentrations change from year to year and are remarkably spatially distributed, and the concentrations have shown an increasing trend from 2009 to 2019 (Figure 4e, Figure 5e, Figure 6e, and Figure 7e). Climate change, which has resulted in a decrease in precipitation in the studied region in recent years, can explain this [73]. Consequently, it increases the retention of nitrates on the soil surface and ultimately their penetration into the aquifer.
The spatial distribution of the concentration of k+, Mg2+, and SO42− has not changed significantly since 2009.
The pH values of groundwater samples ranged from 7.15 (E9) to 7.69 (E13) in 2009, with a mean of 7.37 as shown in Table 1. In 2017, the pH values ranged between 7. 1 (E21) and 8 (E31), with an average of 7.57. In 2018, the pH was 7.2 (E49) to 8.65 (E65), with a mean of 7.68. In 2019, the pH ranged from 7.09 (E81) to 9.11 (E95), with a mean of 7.62. According to the World Health Organization, the average pH value of drinking water for consumers is between 6.5 and 8.5 [60]. Thus, the pH analysis results show that in this area, most groundwater is within the potable range.
3.3. Hydrochemical Characteristics
The rank correlation (r) was used to evaluate the relationship between two variables. The correlation matrix of the nine physicochemical parameters is presented in Table 4. A high correlation is defined as a correlation with an R-value greater than 0.7, while a moderate correlation is defined as a correlation with an R-value between 0.5 and 0.7 [72]. Table 2 displays the results of the primary hydrochemical parameter correlation. The strong positive associations between the EC and mainly the ions (Mg2+, SO42−, Na+, Cl−, and Ca2+) indicate these ions are essential in the hydrochemistry of groundwater. There are good corrections between Na+ and Cl− as shown by these values of 0.96, 0.92, 0.98, and 0.97 in 2009, 2017, 2018, and 2019, respectively. The values of Mg2+ and Cl− were 0.87 and 0.90 in 2017 and 2018, respectively. Cl− and Ca2+ with 0.83 in 2017, 0.80 in 2018, and 0.96 in 2019. This implies that halite, gypsum, and carbonate may result from the dissolution of the major groundwater ions.

Table 4.
Correlation matrix for the analyzed parameters of four campaigns.
3.4. Major Ion Relations in the Groundwater
The relationship of primary ions has been plotted to illustrate the processes of hydrochemical evolution and the mechanism of control of the mineralization of groundwater. The ion ratio relationship in this area can further help explain the interactions between water and rock. Therefore, according to the hydrochemistry results, a ratio graph of the primary ion relationship is plotted (Figure 8). If the Na+/Cl− molar ratio is approximately to 1, halite dissolution primarily contributes to the Na+ groundwater concentration; if the ratio is greater than 1, suggesting silicate weathering or cation exchange; and if the ratio is less than 1, an anthropogenic disruption is reflected [28,74].
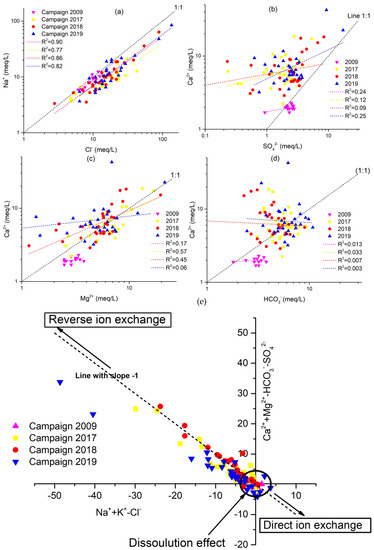
Figure 8.
Scatter plots showing the correlation of major cations/anions to discriminate the geochemical processes of 4 campaigns 2009, 2017, 2018 and 2019. (a) Na+ vs. Cl−, (b) Ca2+ vs. SO42−, (c) Ca2+ vs. Mg2+, (d) Ca2+ vs. HCO3−, and (e) [(Ca2++Mg2+) −(SO4−+ HCO3-)] vs. [(Na++k+) − Cl−)].
Figure 8a depicts the ion connection between Na+ and Cl− for the four campaigns of 2009, 2017, 2018, and 2019. A few groundwater samples were along the 1:1 trend line, while the others were above it, demonstrating that halite dissolution, silicate weathering, and cation exchange are all important sources of sodium. The saturation index (SI) of halite will further illustrate this view of the origin of Na+ and Cl− (Figure 9). There is a strong association between Na+ and Cl−, as shown in Figure 8a, with R2 = 0.90, R2 = 0.77, R2 = 0.86, and R2 = 0.82 for the 2009, 2017, 2018, and 2019 sampling campaigns, respectively (Figure 8a), implying that the two minerals have the same origin. This hypothesis is confirmed by the negative halite SI values, indicating halite dissolution as an essential process in the study region (Figure 9).
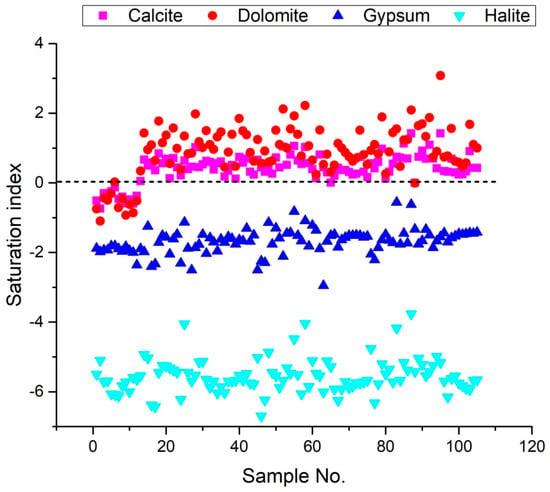
Figure 9.
Saturation index (SI) for relevant minerals of 105 groundwater sample.
The molar ratio of Ca2+ would be 1:1 if Ca2+ and SO42− originated from gypsum weathering. The relationship between Ca2+ and SO42− has been demonstrated in Figure 8b. Most of the groundwater samples along the 1:1 trend line have been observed, and Ca2+ rises with SO42−, indicating that gypsum weathering is a cause of Ca2+ and SO42−. The gypsum saturation indices are negative supports this hypothesis (Figure 9). However, the excess of Ca2+ relative to SO42− observed in most samples is due to the reverse base exchange processes. Indeed, the saturation indices computed for these samples are similar to zero or more significant for some samples concerning carbonate minerals, demonstrating that calcium enrichment is primarily attributable to the occurrence of base exchange (Figure 8e). A positive correlation is demonstrated by the correlation diagram Ca2+ vs. Mg2+ (Figure 8c), which indicates that these two elements originate from the same source. Most of the samples are distributed over the dissolution section of the dolomite (1:1 line), demonstrating the contribution of the mineral to groundwater mineralization. Other points above the 1:1 line indicate that the base exchange process contributes to groundwater mineralization. The dolomite dissolution line is linked to most points in the Ca2+ versus Mg2+ diagram (Figure 8c). Several other locations are placed above the 1:1 line of Figure 8c due to reverse base exchange phenomena. The Ca2+ versus HCO3− correlation (Figure 8d) show that most of the samples analyzed in the study area had a Ca2+/HCO3− molar ratio above than one, indicating that these two components do not have a strong association. The presence of more Ca2+ than HCO3− confirms the role of ion exchange processes
3.5. Saturation Index (SI)
Several processes, such as groundwater flows, recharge and discharge processes, and water-rock reactions, control groundwater’s hydrochemistry [27,30]. The weathering of minerals in the long-term direction of groundwater flow also affects hydrochemistry [75]. The following Equation (8) can be used to calculate the saturation index (SI) of a mineral:
where, KSP is the solubility product of the mineral, and KIAP is the ions activity product for a mineral equilibrium reaction.
The SI values of groundwater minerals can be determined using the DIAGRAMMES program version 7 [76]. Furthermore, the Saturation Index results reveal the chemical equilibrium model of water minerals and water-rock interaction. The Saturation Index values for calcite, dolomite, gypsum, and halite, vary from −0.75 to 0.05, −1.1 to 0.34, and −2.36 to −1.81, −6.12 to −5.1 with a mean of −0.39, −0.52, −1.94 and 0.64, respectively for campaign 2009, from 0.12 to 1.02, 0.39 to 1.98, and −2.5 to −1.13, −6.43 to −4.05 with a mean of 0.51, 1.12, −1.75 and −5.56, respectively for campaign 2017, from −0.01 to 1.06, 0.24 to 2.22, −2.95 to −0.82, and −6.7 to −4.04 with a mean of 0.48, 1, −1.65 and −5.58, respectively for campaign 2018, from 0 to 1.42, −0.01 to 3.08, −2.21 to −0.56, and −6.32 to −3.76 with a mean of 0.62, 1.14, −1.55 and −5.42, respectively for campaign 2019. These values suggest that these minerals saturate many samples (Figure 9). The SI values for calcite, dolomite, gypsum, and halite range from −0.74 to 1.42, −1.1 to 3.08, −2.95 to −0.56, and −6.7 to −3.76, respectively for the four groundwater samples collected, indicating that gypsum and halite are not saturated in the water samples (Figure 9). This indicates that the samples have a propensity to dissolve these minerals constantly. The findings revealed that the phenomenon of base exchange and the dissolution of evaporated minerals (gypsum, anhydrite, halite and dolomite) influence the salinization of groundwater for the 105 groundwater samples taken in 2009, 2017, 2018 and 2019. If the mineral is unsaturated (SI less than 0), groundwater will continuously dissolve it; if the mineral is supersaturated (SI greater than 0), it will precipitate; and the mineral phase will remain in equilibrium if SI is close to zero.
3.6. Main Hydrochemical Processes
Gibbs developed a Gibbs diagram [77] to assess surface water changes quantitatively. However, they are still commonly used today in groundwater studies, as in our case in the KSOB sub-basin. The three major evolutionary processes of each of the Gibbs diagrams are divided into three sections: rock dominance firstly, which is in the center of the graph; secondly, evaporation dominance which is located in the upper part of the graph; and thirdly, precipitation dominance which is located in the lower part of the graph [77]. Figure 10 presented the highest part of the diagrams; most of the samples are plotted, demonstrating that rock weathering and water-rock interactions are the primary determinants of groundwater chemistry. However, in the evaporation dominance zone, several samples are found, which means that groundwater evaporation is also a significant factor influencing groundwater chemistry. To affect groundwater chemistry, the shallow depth of the water level makes the evaporation of groundwater powerful in the discharge region towards the Atlantic Ocean. Therefore, most of the samples in the diagram show a slightly increasing trend, again showing the effects of evaporation.
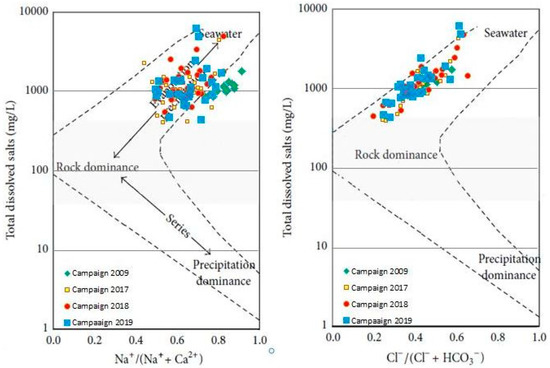
Figure 10.
Gibbs diagrams for the major-ion composition of the groundwater in the the synclinal basin of Essaouira.
3.7. Groundwater Salinity
Groundwater is the principal drinking and agricultural water source in water-scarce areas, particularly in dry and semi-arid climates [4,5,8,10,72]. Climate change has recently strained this resource, causing its quality to deteriorate [1,18,78]. The spatiotemporal evolution of groundwater salinity in the KSOB sub-basin has been examined in this regard (Figure 11). The current research salinity values range from 0.83 to 1.76 g/L, with a mean of 1.09 g/L for the 2009 campaign samples (Figure 11a). For the 2017campaign collected points range from 0.39 to 4.27 g/L with a mean of 1.16 g/L (Figure 11b), from 0.45 to 4.87 g/L for the 2018 campaign samples with a mean of 1.39 g/L (Figure 11c), and finally range between 0.44 to 6.12 g/L for the 2019 samples with a mean of 1.38 g/L (Figure 11d). The KSOB sub-basin study area is marked by a lack of industrial activity, a decrease in rainfall, and an increase in temperature, which has resulted in recent drought cycles, lower groundwater levels, and degradation of water quality [12,20,42,69].
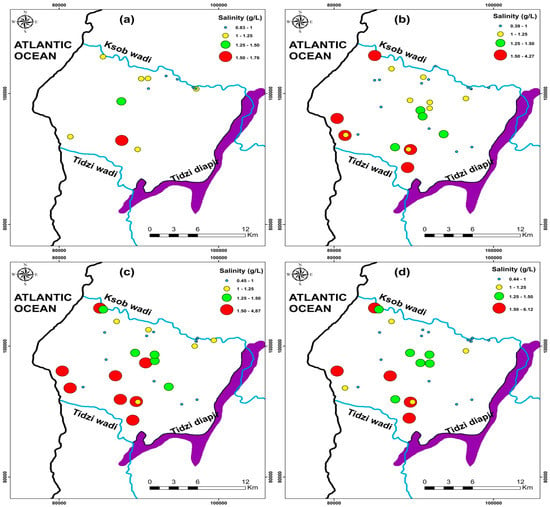
Figure 11.
Spatial distribution of salinity in the study area of four campaigns (a) 2009, (b) 2017, (c) 2018, and (d) 2019.
3.8. Water Quality Index (WQI) Calculated
The Water Quality Index (WQI) was used to measure the quality of groundwater for drinking purposes in the research area of Plio-Quaternary and Turonian aquifers using World Organization standards. The relative importance of each chemical parameter in the deterioration of water quality for domestic use determines the weight assigned to each chemical parameter, which ranges from one to five (Table 2). This analysis showed that the water quality index (WQI) ranged from 90.80 to 191.07 for 105 samples, with an average of 123. Therefore, groundwater samples were generally “good water” (23%) and “Poor quality water” (77%) for the campaign 2009 (Table 4). WQI ranged from 78.7 to 491.9 with an average of 159.4. Groundwater samples were generally “good water” (16.1%), “Poor quality water” (71%), “Very Poor quality water” (9.7%), and “Unfit for drinking” (3.2%) for the campaign 2017 (Table 4). The water quality index (WQI) ranged from 73.15 to 544.90 with an average of 168.53. Groundwater samples were generally “good water” (9.7%), “Poor quality water” (74.2%), “Very Poor quality water” (6.4%), and “Unfit for drinking” (9.7%) for the campaign 2018 (Table 4). The water quality index (WQI) ranged from 91.80 to 740.12 with an average of 187.23. Groundwater samples were generally “good water” (3.3%), “Poor quality water” (76.7%), “Very Poor-quality water” (13.3%), and “Unfit for drinking” (6.7%) for the campaign 2019 (Table 5).

Table 5.
Results of WQI and its percentage of four campaigns 2009. 2017. 2018. and 2019.
The spatial distribution of WQI in the KSOB sub-basin of groundwater samples collected in 2009, 2017, 2018, and 2019 is represented in Figure 12. It is evident that in most areas of the synclinal basin of Essaouira, the phreatic water was poor or good quality water. Following the results of the ten years of water quality index, we observed that water quality is deteriorating, particularly on the coast of the aquifers near the Atlantic ocean. The excessive fertilizer used in agriculture seeps into groundwater because the soil surface is close to the water table [10,26]. Therefore, as the hydraulic conductivity is critical, this region is susceptible; another reason is several tourist activities since there is no sanitation network or a water treatment station that generates wastewater infiltration directly onto the water table. Another reason is the phenomenon of marine intrusion. The calculated WQI values can be obtained by comparing the WQI spatial trends and the leading chemical indicators (Figure 4, Figure 5, Figure 6 and Figure 7). The spatial distribution of WQI is comparable to that of TDS, SO42−, Na+, and Cl−, implying that the high WQI values observed were primarily responsible for specific chemical parameters. Furthermore, since nitrate (NO3−) was given the highest relative weight (5), it appears to be the main factor of WQI values. High nitrate (NO3−) values were observed in the northwest of the study area near of diapir TIDZI, especially in the upstream part (Figure 4e, Figure 5e, Figure 6e, Figure 7e), and high WQI values were found in these areas (Figure 12).
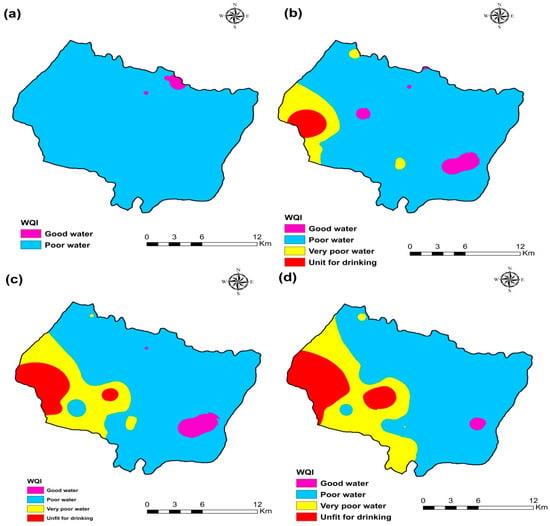
Figure 12.
Water quality index (WQI) map of the four campaigns (a) 2009, (b) 2017, (c) 2018, and (d) 2019.
3.9. IWQI Calculation
The sub-index model was applied to eleven water endpoints of the studied well for irrigation, including pH and electrical conductivity (EC), chloride (Cl−), bicarbonate (HCO3−) ions, sodium percentage (%NA), sodium adsorption rate (SAR), protentional salinity (PS), magnesium hazard (MH), Permeability index (PI), Kelly index (PI) comparing it with the global standard [60,63].
The IWQI values ranged from 60.3 to 463, with an average of 105 for all campaigns (2009, 2017, 2018, 2019), according to the results provided in Table 6. When compared with water quality classification, it was found that 83.8% of the studied water samples were of good water quality class, and 46.2% were bad water quality for the campaign 2009. Groundwater samples were generally “good water” (48.4%), “Bad quality water” (48.4%), and “Unfit for drinking” (3.2%) for the campaign 2017 (Table 7). Groundwater samples were generally “good water” (61.3%), “Bad quality water” (32.26%), “Very bad quality water” (3.22%), and “Unfit for drinking” (3.22%) for the campaign 2018 (Table 7). Groundwater samples were generally “good water” (50%), “Bad quality water” (43.3%), and “Unfit for drinking” (6.66%) for the campaign 2019 (Table 7).

Table 6.
Minimum, maximum, and mean of the IWQI values of 105 samples in the study area.

Table 7.
Statistical analysis of the effective weight.
An IDW spatial variation map of IWQI values was produced in an ArcGIS environment to visualize the spatial distribution of water quality over each area (Figure 13). This map was utilized to manage water resources better to locate irrigation water quality classification sites in the research area. According to Figure 13, all IWQI values for the four campaigns (2009, 2017, 2018, and 2019) are above 50, indicating an absence of excellent water classification of drinking water. Figure 13 and Table 7 show that the irrigation water quality index (IWQI) values were relatively high from the 2009 to 2019 campaigns, and this is due to the first significant factor, which is the effect of climate change that leads to a decrease in rainfall and therefore a rise in the concentration of the major ions [11,19].
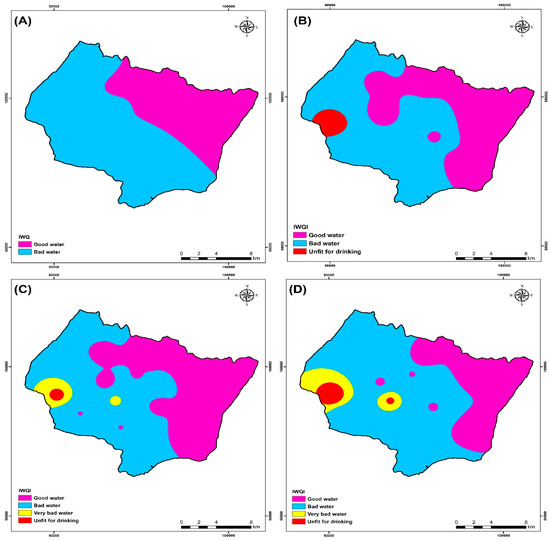
Figure 13.
Irrigation water quality index (IWQI) map of the four campaigns (A) 2009, (B) 2017, (C) 2018, and (D) 2019.
The ArcGIS Spatial Analyst tool and equation number seven were used to calculate the effective weight values of each water quality measure. Table 7 shows the statistical findings of comparing the effective weights to the relative weights of each water quality measure. According to the calculations, the PS parameter has the largest average effective weighting value of 26.23%, and these parameters are the most influential in the IWQI calculations. On the other hand, Chloride has a higher relative weight (9.09%) than the other variables. Different parameters with low relative weight, such as (HCO3−, SAR; NO3−), also have low effective weight (Table 7). Additionally, pH and electrical conductivity have high effective weights of 10.54% and 12.4%, respectively.
3.10. Heavy Metals
The concentrations of most heavy metals analyzed (e.g., Cr, B, Ni, Cd, and As) in all the analyzed samples of the 2019 campaign (Table 8) were found to be below the detection limit of the analytical methods applied.

Table 8.
Metals contents results of analysed samples of the 2019 campaign.
The electrical conductivity (EC) in the study area ranged from 863 μS/cm to 16,300 μS/cm for the campaign of July 2019. The maximum values were recorded on wells that are near the sea (Figure 14A).
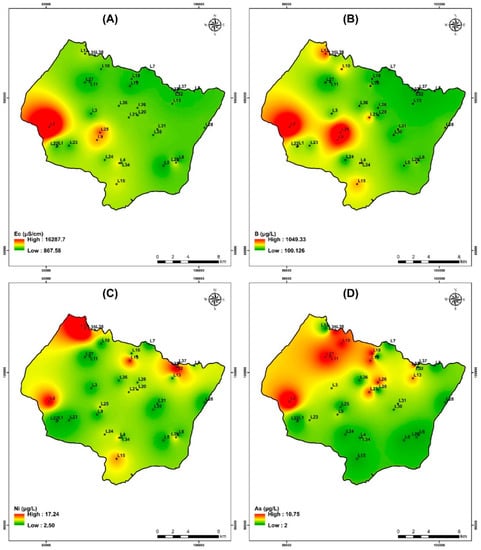
Figure 14.
Spatial distribution of Electrical conductivity and heavy metals for samples collected in the study area of the campaign July 2019. (A) Electrical conductivity, (B) Boron, (C) Nickel, and (D) Arsenic.
The study area contains the highest concentration of boron among the trace/minor elements. Its concentration varies from 100 to 1050 µg/L. With sodium and potassium, it shows strong positive associations, respectively (Figure 14B). The geographic distribution of B contents (Figure 14B) increases from northeast to southwest in a manner comparable to that of Cl− (Figure 7c) and Na+ (Figure 7g). The points with high salinity are those where the greatest concentrations of B are found; these include points L2, L9, L12, and L25. The spatial distribution of each heavy metal is depicted in Figure 14.
The amount of nickel in measured groundwater is considerably lower than the drinking water standard of 70 µg/L established by WHO [60] (Table 8). In ferromagnesian minerals like olivine, orthopyroxene, spinel, pyrite and chalcopyrite, this relatively abundant element in rocks easily takes the place of iron and magnesium. Even when water interacts with nickel-rich rocks such as olivine basalts and ultramafic rocks (which typically contain 2000 mg/kg), groundwater nickel concentrations are often below a few µg/L. Figure 14C shows that the Ni contents, in particular at the level of sample L12 and L33, has the highest Ni contents.
Arsenic levels for the study area range from less than 2.12 to 10.76 µg/L. The highest value (WHO drinking water criteria of 10 µg/L) is noted at well L2 and L36 (Table 8). The western and northwest regions of the search area had the highest values, according to the spatial distribution of As contents (Figure 14D).
3.11. Water Stable Isotopes (δ2H-δ18O)
Isotopic analysis is a useful tool for deciphering the mechanisms that drive an aquifer system’s hydrogeological and hydrochemical evolution [26,79,80]. Stable isotopes of oxygen (δ18O) and hydrogen (δ2H) are thought to be transported conservatively in shallow aquifers, according to Kim [81]. The source and movement of groundwater, as well as the technique of aquifer recharge, are revealed by these two isotopes [81]. According to Geyh [82], they can also provide physical processes that affect the body of water, such as evaporation and mixing. The source of groundwater salinity can be determined using stable isotopes [10,24].
Locations sampled in Plio-Quaternary and Turonian aquifers of KSOB sub-basin had oxygen-18 levels ranging from −5 to −1.8 and −5 to −4.4, respectively (Table 9). The GMMM and RMML lines on the δ2H-δ18O correlation graphic show the distribution of representative samples from the study area of the KSOB sub-basin (Figure 15) provides a better understanding of the main phenomena involved in the hydrodynamic and geochemical functioning of defined aquifers [4]. In the δ 2H vs. δ 18O plot scheme (Figure 15), all isotopic points are represented simultaneously for the Essaouira basin with the Global Meteoric Water Line (G-MMM) (Equation (9)) [83] and the regional meteoric water line (R-MWL) was developed by the researchers Mennani [55] indicated by the equation (Equation (10)).

Table 9.
Statistical summary of the stable isotopic values of the campaign 2018.
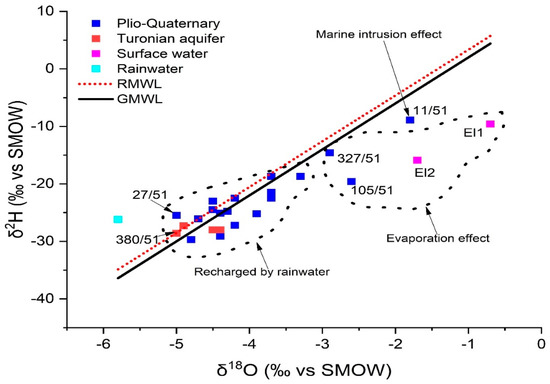
Figure 15.
Isotopic data in the study area. δ18 O versus δ2H for 2018 campaign.
Most of the sites lie along straight lines of GMWL and RMWL, indicating that Atlantic precipitation recharges the region’s aquifer (group 1). The hydrogeochemical results, particularly well 27/51, which has low salinity with the value = 454 mg/L, are perfectly compatible with the rainwater supply of the shallow aquifer located in the SIDI KAWKI region, which is the cause of the drop in salinity of the fluids of these wells. It is the well that is closest to the freshwater pole (rainwater pole). There are other points which characterize by the recharge of rainwater, such as point O6 which is located near wadi KSOB. The lithological characteristics of the unsaturated zone, as well as its thickness, should facilitate this recharge. The majority of the samples in this group come from the shallow aquifer, while the rest of the water points (M98, 346/51...O121) come from the deep Turonian aquifer.
In contrast, the waters from the Group 1 wells show no signs of evaporation, indicating that precipitation is rapidly infiltrating them. Their location below the GMWL line distinguishes them from the other water points (Group 2); They are arranged in a straight line with an evaporation characteristic slope of less than eight. There are other processes that mainly affect surface waters upstream O98 (EL1) and downstream O99 (EL2) and boreholes 105/51 and 327/51, respectively, in the study area (Figure 16). In the unsaturated zone, evaporation is likely to occur before water infiltration, or during sampling. The isotopic signature of rainwater and saltwater in the Atlantic Ocean has been used to draw the freshwater-saltwater boundary [25,79]. On the same plot, well 11/51, located near Cap Sim on the coastal edge, has high salinities and a drop in the piezometric level (since 2015). This demonstrates that the enhanced mineralization in this well is mostly due to the phenomena of saltwater intrusion. The regional altitudinal gradient in oxygen-18 of −0.26 was used to determine the assumed recharge zones for the study area [32,50].
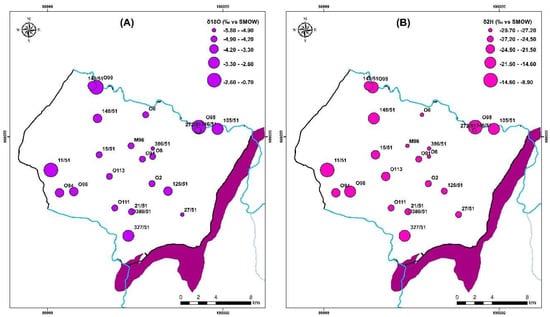
Figure 16.
Distribution map of (A) oxygen 18 (‰ VSMOW) and (B) deuterium (‰ VSMOW) for samples collected in 2018.
The points have undergone evaporation (105/51 and 327/51), and marine intrusion (11/51) has been eliminated from the δ18O vs. altitude diagram (Figure 17). From this, we can deduce that the altitudes of the recharge areas of the Shallow aquifer vary between one hundred and eight hundred meters, and those of the Turonian recharge vary between 550 and 800 m. Some water points (3/51, 125/51, 148/51, 149/51, and O96) capturing the Plio-Quaternary aquifer are recharged at altitudes varying between 100 and 350 m. at the same time, the rest of the points should be recharged at altitudes oscillating between 450 and 800 m. However, the altitudes of the TIDZI DIAPIR (eastern limit of the two aquifers) do not exceed 400 m. The differences in the isotopic compositions between the two aquifers, and those of the precipitation (with which the gradient was estimated) cannot be due to an altitude effect. However, this depletion may be due to recharge during winter periods.
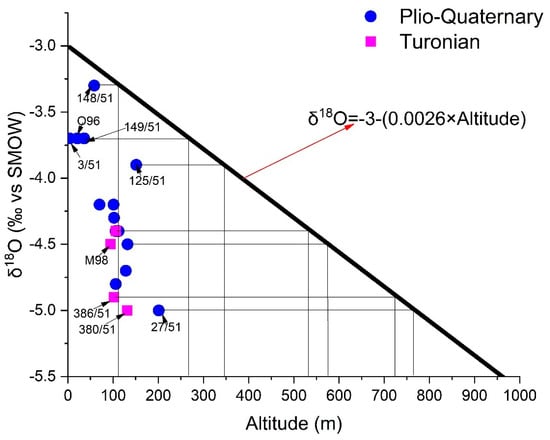
Figure 17.
Relationship between oxygen-18 content and altitude of water points in the study area of the study area.
4. Conclusions
A comprehensive study of the hydrochemical data of 105 water samples from the Essaouira synclinal basin was carried out to provide a basis for understanding the origin, distribution, and associated hydrogeochemical evolutions of the primary ions in the downstream part of the Essaouira basin. Water quality is influenced by various factors, including contact time of groundwater with rocks and anthropogenic pollutants.
This study used multivariate statistical analysis and index techniques (WQI and IWQI) based on the GIS environment to explore water quality and suitability. Groundwater in the KSOB sub-basin exhibits a variety of hydrochemical facies, including mixed Ca-Mg-Cl water (52%) and Na-Cl water (48%). The results indicate that Na+ is the dominant cation and Cl− is the dominant anion in the study area. Most of the groundwater-dominated by Na−Cl facies indicates that the rock-water interaction and evaporation are dominant processes in the study area. Furthermore, the patterns of the dominance of the major anions and cations, which are found in order of Cl− > HCO3− > SO42− > NO3−, and Na+ > Ca2+ > Mg2+ > K+, respectively.
The spatial-temporal evolution of groundwater quality demonstrates a progressive degradation in time and space. Results of WQI of campaign 2019 showed that 6.7% of groundwater samples are unsuitable for drinking, 76.7% are poor quality water, and 13.3% are very poor-quality water, while only 3.3% of samples are potable for WQI, and according to IWQI, the total study area has split into 50% (good areas), 43.3% (bad areas), and 6.6% (unfit areas), respectively, and no excellent groundwater areas have been identified.
The concentration of heavy metals (e.g., Cr, Ni, B, Cd, and As) in all samples analyzed are found to be below the detection limit.
The δ18O–δ2H diagram for the water samples showed that the aquifer recharge is supported by direct infiltration of oceanic precipitation, with negligible evaporation.
Furthermore, the altitudes of the recharge areas of the Plio-Quaternary aquifer vary between 100 and 800 m, and those of the Turonian recharge vary between 550 and 800 m.
For a better understanding of the geochemical processes of groundwater evolution in this region and other similar areas, the findings of this study may provide a good reference. Furthermore, hydrochemistry characteristics and groundwater evolution can direct the selection of water resource areas and provide knowledge for detailed assessment and conservation of groundwater resources.
Supplementary Materials
The following supporting information can be downloaded at: https://www.mdpi.com/article/10.3390/su14138012/s1, Table S1: Physicochemical Parameters of the Analyzed Samples from the Plio-Quaternary and Turonian Aquifer of all the 105 groundwater samples of four campaigns 2009. 2017. 2018 and 2019. Table S2: The IWQI values of all 105 samples in the study area.
Author Contributions
Conceptualization, O.E.M. and M.B.; methodology: O.E.M.; software, O.E.M.; validation, M.B., A.C., D.D. and H.E.J.; formal analysis and investigation, O.E.M. and M.B.; resources: O.E.M. and M.B.; writing—original draft preparation: O.E.M.; writing—review and editing: O.E.M., M.B., A.C., D.D. and H.E.J.; visualization: O.E.M. and M.B.; supervision: M.B.; project administration: M.B., A.C., D.D. and H.E.J. All authors have read and agreed to the published version of the manuscript.
Funding
This research received no external funding.
Acknowledgments
The authors are grateful to Editor-in-Chief of Sustainability, the Assistant Editor Susan Guo and Sally Li who handled this manuscript and the reviewers for their constructive and useful comments. We appreciate the help of the people from the Office National de l’Eau Potable (ONEE) in Essaouira city; We thank the people of Tensift Hydraulic Basin Agency (ABHT) of the city of Marrakech. The authors appreciate the help they have received from their colleagues throughout the data collection and the field survey.
Conflicts of Interest
The authors have reported no conflict of interest.
References
- Bahir, M.; Ouazar, D.; Ouhamdouch, S. Characterization of mechanisms and processes controlling groundwater salinization in coastal semi-arid area using hydrochemical and isotopic investigations (Essaouira basin, Morocco). Environ. Sci. Pollut. Res. 2018, 25, 24992–25004. [Google Scholar] [CrossRef] [PubMed]
- Fernandes, P.G.; Carreira, P.M.; Bahir, M. Mass balance simulation and principal components analysis applied to groundwater resources: Essaouira basin (Morocco). Environ. Earth Sci. 2010, 59, 1475–1484. [Google Scholar] [CrossRef]
- Hasan, M.; Shang, Y.; Metwaly, M.; Jin, W.; Khan, M.; Gao, Q. Assessment of Groundwater Resources in Coastal Areas of Pakistan for Sustainable Water Quality Management using Joint Geophysical and Geochemical Approach: A Case Study. Sustainability 2020, 12, 9730. [Google Scholar] [CrossRef]
- Bahir, M.; El Mountassir, O.; Chehbouni, A.; El Jiar, H.; Carreira, P.M. Hydrogeochemical and isotopic assessment for characterizing groundwater quality and recharge processes in the Essaouira Basin, Northwestern Morocco. Arab. J. Geosci. 2022, 15, 603. [Google Scholar] [CrossRef]
- Bouaroudj, S.; Menad, A.; Bounamous, A.; Ali-Khodja, H.; Gherib, A.; Weigel, D.E.; Chenchouni, H. Assessment of water quality at the largest dam in Algeria (Beni Haroun Dam) and effects of irrigation on soil characteristics of agricultural lands. Chemosphere 2019, 219, 76–88. [Google Scholar] [CrossRef] [PubMed]
- Carreira, P.M.; Bahir, M.; Ouhamdouch, S.; Galego Fernandes, P.; Nunes, D. Tracing salinization processes in coastal aquifers using an isotopic and geochemical approach: Comparative studies in western Morocco and southwest Portugal. Hydrogeol. J. 2018, 26, 2595–2615. [Google Scholar] [CrossRef]
- Jehan, S.; Ullah, I.; Khan, S.; Muhammad, S.; Khattak, S.A.; Khan, T. Evaluation of the Swat River, Northern Pakistan, water quality using multivariate statistical techniques and water quality index (WQI) model. Environ. Sci. Pollut. Res. 2020, 27, 38545–38558. [Google Scholar] [CrossRef]
- El Mountassir, O.; Bahir, M.; Ouazar, D.; Carreira, P.M. Nitrate Pollution in Groundwater of the Ouazi Basin: Case of Essaouira (Southwestern Morocco). In Advances in Geoethics and Groundwater Management: Theory and Practice for a Sustainable Development. Advances in Science, Technology & Innovation; Abrunhosa, M., Chambel, A., Peppoloni, S., Chaminé, H.I., Eds.; Springer: Berlin/Heidelberg, Germany, 2021; pp. 239–245. [Google Scholar] [CrossRef]
- El Mountassir, O.; Bahir, M.; Ouazar, D.; Carreira, P.M. For a Better Understanding of Recharge and Salinization Mechanism of a Cenomanian–Turonian Aquifer. In Advances in Geoethics and Groundwater Management: Theory and Practice for a Sustainable Development. Advances in Science, Technology & Innovation; Abrunhosa, M., Chambel, A., Peppoloni, S., Chaminé, H.I., Eds.; Springer: Berlin/Heidelberg, Germany, 2021; pp. 201–206. [Google Scholar] [CrossRef]
- El Mountassir, O.; Bahir, M.; Ouazar, D.; Chehbouni, A.; Carreira, P.M. Evaluation of nitrate source and its distribution in the groundwater of Essaouira basin. Sustain. Water Resour. Manag. 2022, 8, 28. [Google Scholar] [CrossRef]
- El Mountassir, O.; Bahir, M.; Ouazar, D.; Chehbouni, A.; Carreira, P.M. Temporal and spatial assessment of groundwater contamination with nitrate using nitrate pollution index (NPI), groundwater pollution index (GPI), and GIS (case study: Essaouira basin, Morocco). Environ. Sci. Pollut. Res. 2022, 29, 17132–17149. [Google Scholar] [CrossRef]
- Bahir, M.; EL Mountassir, O.; Ouazar, D.; Chehbouni, A.; Carreira, P.M. Stable isotope and quality of groundwater around Ksob sub-basin, Essaouira, Morocco. Sustain. Water Resour. Manag. 2021, 7, 73. [Google Scholar] [CrossRef]
- Moral, F.; Cruz-Sanjulián, J.; Olías, M. Geochemical evolution of groundwater in the carbonate aquifers of Sierra de Segura (Betic Cordillera, southern Spain). J. Hydrol. 2008, 360, 281–296. [Google Scholar] [CrossRef]
- André, L.; Franceschi, M.; Pouchan, P.; Atteia, O. Using geochemical data and modelling to enhance the understanding of groundwater flow in a regional deep aquifer, Aquitaine Basin, south-west of France. J. Hydrol. 2005, 305, 40–62. [Google Scholar] [CrossRef]
- Huang, X.; Wang, G.; Liang, X.; Cui, L.; Ma, L.; Xu, Q. Hydrochemical and stable isotope (δD and δ18O) characteristics of groundwater and hydrogeochemical processes in the Ningtiaota Coalfield, Northwest China. Mine Water Environ. 2018, 37, 119–136. [Google Scholar] [CrossRef]
- Afonso, M.J.; Chaminé, H.I.; Marques, J.M.; Carreira, P.M.; Guimaraes, L.; Guilhermino, L.; Gomes, A.; Fonseca, P.E.; Pires, A.; Rocha, F. Environmental issues in urban groundwater systems: A multidisciplinary study of the Paranhos and Salgueiros spring waters, Porto (NW Portugal). Environ. Earth Sci. 2010, 61, 379–392. [Google Scholar] [CrossRef]
- Bahir, M.; El Moukhayar, R.; Youbi, N.; Chamchati, H.; Chkir Ben Jemaa, N. Management and protection of groundwater resources in semi-arid zones: Application of hydrochemical methodologies to Essaouira Synclinal Basin, Morocco. Int. J. Hydrol. Sci. Technol. 2013, 3, 160–175. [Google Scholar] [CrossRef]
- Bahir, M.; Ouhamdouch, S.; Carreira, P.M.; Chkir, N.; Zouari, K. Geochemical and isotopic investigation of the aquifer system under semi-arid climate: Case of Essaouira basin (Southwestern Morocco). Carbonates Evaporites 2018, 33, 65–77. [Google Scholar] [CrossRef]
- El Mountassir, O.; Ouazar, D.; Bahir, M.; Chehbouni, A.; Carreira, P.M. GIS-based assessment of aquifer vulnerability using DRASTIC model and stable isotope: A case study on Essaouira basin. Arab. J. Geosci. 2021, 14, 321. [Google Scholar] [CrossRef]
- Bahir, M.; Ouhamdouch, S.; Ouazar, D.; Chehbouni, A.; Ouarani, M.; El Mountassir, O. Groundwater quality of the alluvial and carbonate aquifers of Essaouira basin (Morocco). Carbonates Evaporites 2021, 36, 23. [Google Scholar] [CrossRef]
- Mendonqa, J.L.; da Silva, M.O.; Bahir, M. Considerations concerning the origin of the Estoril (Portugal) thermal water. Estud. Geológicos 2004, 60, 153–159. [Google Scholar]
- Asadi, E.; Isazadeh, M.; Samadianfard, S.; Ramli, M.F.; Mosavi, A.; Nabipour, N.; Shamshirband, S.; Hajnal, E.; Chau, K.W. Groundwater quality assessment for sustainable drinking and irrigation. Sustainability 2019, 12, 177. [Google Scholar] [CrossRef]
- Bahir, M.; Ouhamdouch, S. Groundwater quality in semi-arid environments (Essaouira Basin, Morocco). Carbonates Evaporites 2020, 35, 41. [Google Scholar] [CrossRef]
- Bahir, M.; Ouhamdouch, S.; Ouazar, D. An assessment of the changes in the behavior of the groundwater resources in arid environment with global warming in Morocco. Groundw Sustain. 2021, 12, 100541. [Google Scholar] [CrossRef]
- Aouiti, S.; Hamzaoui Azaza, F.; El Melki, F.; Hamdi, M.; Celico, F.; Zammouri, M. Groundwater quality assessment for different uses using various water quality indices in semi-arid region of central Tunisia. Environ. Sci. Pollut. Res. 2021, 28, 46669. [Google Scholar] [CrossRef] [PubMed]
- EL Mountassir, O.; Bahir, M.; Ouazar, D.; Chehbouni, A.; Carreira, P.M. Geochemical and isotopic evidence of groundwater salinization processes in the Essaouira region, north-west coast, Morocco. SN Appl. Sci. 2021, 3, 698. [Google Scholar] [CrossRef]
- Rabeiy, R.E. Assessment and modeling of groundwater quality using WQI and GIS in Upper Egypt area. Environ. Sci. Pollut. Res. 2018, 25, 30808–30817. [Google Scholar] [CrossRef] [PubMed]
- Tiwari, A.K.; Singh, P.K.; Mahato, M.K. GIS-based evaluation of water quality index of ground water resources in West Bokaro Coalfield, India. Curr. World Environ. 2014, 9, 843. [Google Scholar] [CrossRef]
- Ibrahim, M.N. Assessing groundwater quality for drinking purpose in Jordan: Application of water quality index. J. Ecol. Eng. 2019, 20, 101–111. [Google Scholar] [CrossRef]
- Teshome, F.B. Seasonal water quality index and suitability of the water body to designated uses at the eastern catchment of Lake Hawassa. Environ. Sci. Pollut. Res. 2020, 27, 279–290. [Google Scholar] [CrossRef]
- Skoczko, I.; Piekutin, J.; Szatyłowicz, E.; Niedźwiecka, M. Removal of boron from groundwater by filtration through selected filter bed materials. Rocz. Ochr. Sr. 2016, 18, 279–290. [Google Scholar]
- Bahir, M.; El Moukhayar, R.; Chamchati, H.; Youbi, N.; Carreira, P.M.; Chkir, N. Recharge and hydrogeochemical evolution groundwater in semi-arid zone (Essaouira Basin, Morocco). Comun. Geol. 2014, 3, 651–653. [Google Scholar]
- Jalal, M.; Blavoux, B.; Bahir, M.; Bellion, Y.; Laftouhi, N.; Puig, J.; Mennani, A.; Daniel, M. Etude du fonctionnement du systeme aquifere karstique Cenomano-Turonien de l’oued Igrounzar, bassin d’Essaouira. Maroc. J. Afr. Earth Sci. 2001, 32, 803–817. [Google Scholar] [CrossRef]
- Mennani, A.; Blavoux, B.; Bahir, M.; Bellion, Y.; Jalal, M.; Daniel, M. Apports des analyses chimiques et isotopiques a la connaissance du fonctionnement des aquiferes plio-quaternaire et turonien de la zone synclinale d’Essaouira, Maroc occidental. J. Afr. Earth Sci. 2001, 32, 819–835. [Google Scholar] [CrossRef]
- Bahir, M.A. Mennani Problématique de la gestion des eaux souterraines au Maroc. Estud. Geológicos 2002, 58, 103–108. [Google Scholar]
- Laftouhi, N.E.; Vanclooster, M.; Jalal, M.; Witam, O.; Aboufirassi, M.; Bahir, M.; Persoons, É. Groundwater nitrate pollution in the Essaouira Basin (Morocco). Comptes Rendus Geosci. 2003, 335, 307–317. [Google Scholar] [CrossRef]
- Fernandes, P.G.; Bahir, M.; Mendonça, J.; Carreira, P.M.; Fakir, Y.; Silva, M. Anthropogenic features in the Sines (Portugal) and Essaouira (Morocco) coastal aquifers: A comparative study of their hydrochemical evolution by a Principal Component Analysis. Estud. Geol. 2005, 61, 207–219. [Google Scholar]
- Bahir, M.; Chkir, N.; Trabelsi, R.; Friha, H.A.; Zouari, K.; Chamchati, H. Hydro-geochemical behaviour of two coastal aquifers under severe climatic and human constraints: Comparative study between Essaouira basin in Morocco and Jeffara basin in Tunisia. Int. J. Hydrol. Sci. Technol. 2012, 2, 75–100. [Google Scholar] [CrossRef]
- Bahir, M.; El Mountassir, O.; Ouazar, D.; Carreira, P.M. Hydrochemical Analysis and Evaluation of Groundwater Quality in Ouazi Basin (Essaouira, Morocco). In Advances in Geoethics and Groundwater Management: Theory and Practice for a Sustainable Development. Advances in Science, Technology & Innovation; Abrunhosa, M., Chambel, A., Peppoloni, S., Chaminé, H.I., Eds.; Springer: Berlin/Heidelberg, Germany, 2021; pp. 247–250. [Google Scholar] [CrossRef]
- Horton, R.K. An index number system for rating water quality. J. Water Pollut. Control Fed. 1965, 37, 300–306. [Google Scholar]
- Brown, R.M.; McClelland, N.I.; Deininger, R.A.; O’Connor, M.F. A water quality index—Crashing the psychological barrier. In Indicators of Environmental Quality; Springer: Berlin/Heidelberg, Germany, 1972; pp. 173–182. [Google Scholar]
- Bahir, M.; El Mountassir, O.; Ouazar, D.; Carreira, P.M. Use of WQI and Isotopes to Assess Groundwater Quality of Coastal Aquifers (Essaouira, Morocco). In Advances in Geoethics and Groundwater Management: Theory and Practice for a Sustainable Development. Advances in Science, Technology & Innovation; Abrunhosa, M., Chambel, A., Peppoloni, S., Chaminé, H.I., Eds.; Springer: Berlin/Heidelberg, Germany, 2021; pp. 251–255. [Google Scholar] [CrossRef]
- El Mountassir, O.; Bahir, M.; Ouazar, D.; Ouhamdouch, S.; Chehbouni, A.; Ouarani, M. The use of GIS and water quality index to assess groundwater quality of krimat aquifer (Essaouira; Morocco). SN Appl. Sci. 2020, 2, 871. [Google Scholar] [CrossRef]
- Adimalla, N. Controlling factors and mechanism of groundwater quality variation in semiarid region of South India: An approach of water quality index (WQI) and health risk assessment (HRA). Environ. Geochem. Health 2020, 42, 1725–1752. [Google Scholar] [CrossRef]
- Soleimani, H.; Nasri, O.; Ojaghi, B.; Pasalari, H.; Hosseini, M.; Hashemzadeh, B.; Kavosi, A.; Masoumi, S.; Radfard, M.; Adibzadeh, A. Data on drinking water quality using water quality index (WQI) and assessment of groundwater quality for irrigation purposes in Qorveh&Dehgolan, Kurdistan, Iran. Data Br. 2018, 20, 375–386. [Google Scholar] [CrossRef]
- Bouteraa, O.; Mebarki, A.; Bouaicha, F.; Nouaceur, Z.; Laignel, B. Groundwater quality assessment using multivariate analysis, geostatistical modeling, and water quality index (WQI): A case of study in the Boumerzoug-El Khroub valley of Northeast Algeria. Acta Geochim. 2019, 38, 796–814. [Google Scholar] [CrossRef]
- El Baba, M.; Kayastha, P.; Huysmans, M.; De Smedt, F. Evaluation of the groundwater quality using the water quality index and geostatistical analysis in the Dier al-Balah Governorate, Gaza Strip, Palestine. Water 2020, 12, 262. [Google Scholar] [CrossRef]
- Wu, J.; Zhang, Y.; Zhou, H. Groundwater chemistry and groundwater quality index incorporating health risk weighting in Dingbian County, Ordos basin of northwest China. Geochem 2020, 80, 125607. [Google Scholar] [CrossRef]
- Bahir, M.; El Moukhayar, R.; Chkir, N.; Chamchati, H.; Fernandes, P.G.; Carreira, P.M. Groundwater Chemical Evolution in the Essaouira Aquifer Basin—NW Morocco. Open J. Mod. Hydrol. 2013, 3, 8. [Google Scholar] [CrossRef][Green Version]
- Bahir, M.; Carreira, P.; Silva, M.O.; Fernandes, P. Caractérisation hydrodynamique, hydrochimique et isotopique du système aquifère de Kourimat (Bassin d’Essaouira, Maroc). Estud. Geol. 2008, 64, 61–73. [Google Scholar] [CrossRef]
- Rassou, K.K.; Fakir, Y.; Bahir, M.; Zouari, K.; Marah, M. Origine et datation des eaux souterraines du bassin hydrologique de la lagune d’Oualidia. Estud. Geol. 2005, 61, 191–196. [Google Scholar] [CrossRef]
- Bahir, M.; Jalal, M.; Mennani, A.; Laftouhi, N. Potentialités hydrogéologiques du synclinal de Kourimat (bassin d’Essaouira, Maroc). Estud. Geol. 2001, 57, 47–52. [Google Scholar] [CrossRef]
- Elmeknassi, M.; Bouchaou, L.; El Mandour, A.; Elgettafi, M.; Himi, M.; Casas, A. Multiple stable isotopes and geochemical approaches to elucidate groundwater salinity and contamination in the critical coastal zone: A case from the Bou-areg and Gareb aquifers (North-Eastern Morocco). Environ. Pollut. 2022, 300, 118942. [Google Scholar] [CrossRef]
- Bahir, M.; Mennani, A.; Jalal, M.; Youbi, N. Ressources hydriques du bassin synclinal d’Essaouira (Maroc). Estud. Geol. 2000, 56, 185–195. [Google Scholar] [CrossRef]
- Mennani, A. Apport de l’hydrochimie et de l’isotopie à la Connaissance du Fonctionnement des Aquifères de la Zone Côtière d’Essaouira (Maroc Occidental). Ph.D. Thesis, Université Cadi Ayyad, Marrakesh, Morocco, 2001; p. 152. [Google Scholar]
- Chamchati, H. Evaluation et Protection des Ressources en eau en Zones Semi-Arides; Exemple du Bassin d’Essaouira. Ph.D. Thesis, Université Cadi Ayyad, Marrakesh, Morocco, 2014. [Google Scholar]
- Kouassi, A.M.; Mamadou, A.; Ahoussi, K.E.; Biemi, J. Simulation de la conductivité électrique des eaux souterraines en relation avec leurs propriétés géologiques: Cas de la Côte d’Ivoire. Rev. Ivoir. Sci. Technol. 2013, 21, 138–166. [Google Scholar]
- Brown, R.M.; McClelland, N.I.; Deininger, R.A.; Tozer, R.G. A water quality index-do we dare. Water Sew. Work. 1970, 117, 339–343. [Google Scholar]
- Xiao, J.; Wang, L.; Deng, L.; Jin, Z. Characteristics, sources, water quality and health risk assessment of trace elements in river water and well water in the Chinese Loess Plateau. Sci. Total Environ. 2019, 650, 2004–2012. [Google Scholar] [CrossRef] [PubMed]
- Edition, F. Guidelines for Drinking-Water Quality; WHO: Geneva, Switzerland, 2011; Volume 38, pp. 104–108.
- Al-Hamdany, N.A.; Al-Saffawi, A.Y.; Al-Shaker, Y.M. Applying the sub-index model to evaluate the quality of water for irrigation purposes, a case study: Wells water of left side from Mosul city, Iraq. Nippon. J. Environ. Sci. 2020, 1, 1–8. [Google Scholar] [CrossRef]
- Alghamdi, A.G.; Aly, A.A.; Aldhumri, S.A.; Al-Barakaha, F.N. Hydrochemical and quality assessment of groundwater resources in Al-Madinah City, Western Saudi Arabia. Sustainability 2020, 12, 3106. [Google Scholar] [CrossRef]
- Verma, P.; Singh, P.K.; Sinha, R.R.; Tiwari, A.K. Assessment of groundwater quality status by using water quality index (WQI) and geographic information system (GIS) approaches: A case study of the Bokaro district, India. Appl. Water Sci. 2020, 10, 27. [Google Scholar] [CrossRef]
- Ememu, A.H.; Nwankwoala, H.O. Application of Water Quality Index (WQI) For Agricultural and Irrigational Use Around Okpoko, Southeastern Nigeria. Eng. Herit. J. 2018, 2, 14–18. [Google Scholar] [CrossRef]
- Şener, Ş.; Şener, E.; Davraz, A. Evaluation of water quality using water quality index (WQI) method and GIS in Aksu River (SW-Turkey). Sci. Total Environ. 2017, 584, 131–144. [Google Scholar] [CrossRef]
- Jain, C.K.; Vaid, U. Assessment of groundwater quality for drinking and irrigation purposes using hydrochemical studies in Nalbari district of Assam, India. Environ. Earth Sci. 2018, 77, 1–14. [Google Scholar] [CrossRef]
- Kattan, Z. Using hydrochemistry and environmental isotopes in the assessment of groundwater quality in the Euphrates alluvial aquifer, Syria. Environ. Earth Sci. 2018, 77, 45. [Google Scholar] [CrossRef]
- Piper, A.M. A graphic procedure in the geochemical interpretation of water-analyses. Eos Trans. Am. Geophys. Union 1944, 25, 914–928. [Google Scholar] [CrossRef]
- Bahir, M.; Ouazar, D.; Ouhamdouch, S. Hydrogeochemical mechanisms and recharge mode of the aquifers under semiarid climate from Morocco. Appl. Water Sci. 2019, 9, 103. [Google Scholar] [CrossRef]
- Carreira, P.M.; Marques, J.M.; Nunes, D. Source of groundwater salinity in coastline aquifers based on environmental isotopes (Portugal): Natural vs. human interference. A review and reinterpretation. Appl. Geochem. 2014, 41, 163–175. [Google Scholar] [CrossRef]
- Foued, B.; Hénia, D.; Lazhar, B.; Nabil, M.; Nabil, C. Hydrogeochemistry and geothermometry of thermal springs from the Guelma region, Algeria. J. Geol. Soc. India 2017, 90, 226–232. [Google Scholar] [CrossRef]
- Hamed, Y.; Hadji, R.; Redhaounia, B.; Zighmi, K.; Bâali, F.; El Gayar, A. Climate impact on surface and groundwater in North Africa: A global synthesis of findings and recommendations. Euro-Mediterr J. Environ. Integr. 2018, 3, 25. [Google Scholar] [CrossRef]
- Ouhamdouch, S.; Bahir, M.; Ouazar, D.; Carreira, P.M.; Zouari, K. Evaluation of climate change impact on groundwater from semi-arid environment (Essaouira Basin, Morocco) using integrated approaches. Environ. Earth Sci. 2019, 78, 449. [Google Scholar] [CrossRef]
- Hamid, E.N.; Khan, J.; Malik, M.I. Multi-criteria evaluation based groundwater potential zonation of Pampore watershed using geo-spatial tools. Int. J. Res. Anal. 2018, 5, 352–358. [Google Scholar]
- Selvakumar, S.; Chandrasekar, N.; Kumar, G. Hydrogeochemical characteristics and groundwater contamination in the rapid urban development areas of Coimbatore, India. Water Resour. Ind. 2017, 17, 26–33. [Google Scholar] [CrossRef]
- Parkhurst, D.L.; Appelo, C.A.J. User’s guide to PHREEQC (Version 2): A computer program for speciation, batch-reaction, one-dimensional transport, and inverse geochemical calculations. Water-Resour. Investig. Rep. 1999, 99, 312. [Google Scholar] [CrossRef]
- Gibbs, R.J. Mechanisms controlling world water chemistry. Science 1970, 170, 1088–1090. [Google Scholar] [CrossRef]
- Bahir, M.; Ouhamdouch, S.; Ouazar, D.; El Moçayd, N. Climate change effect on groundwater characteristics within semi-arid zones from western Morocco. Groundw Sustain. Dev. 2020, 11, 100380. [Google Scholar] [CrossRef]
- Abourida, A.; Er-rouane, S.; Bahir, M.; da Silva, M.O.A. Cheggour Contribution des isotopes de l’environnement pour la comprehension du fonctionnement de l’aquifere mio-plioquaternaire du Haouz de Marrakech (Maroc). Estud. Geol. 2004, 60, 161–167. [Google Scholar] [CrossRef]
- Tijani, M.N.; Loehnert, E.P.; Uma, K.O. Origin of saline groundwaters in the Ogoja area, Lower Benue Trough, Nigeria. J. Afr. Earth Sci. 1996, 23, 237–252. [Google Scholar] [CrossRef]
- Kim, Y.; Lee, K.-S.; Koh, D.-C.; Lee, D.-H.; Lee, S.-G.; Park, W.-B.; Koh, G.-W.; Woo, N.-C. Hydrogeochemical and isotopic evidence of groundwater salinization in a coastal aquifer: A case study in Jeju volcanic island, Korea. J. Hydrol. 2003, 270, 282–294. [Google Scholar] [CrossRef]
- Geyh, M.A. An overview of 14C analysis in the study of groundwater. Radiocarbon 2000, 42, 99–114. [Google Scholar] [CrossRef]
- Craig, H. Isotopic variations in meteoric waters. Science 1961, 133, 1702–1703. [Google Scholar] [CrossRef]
Publisher’s Note: MDPI stays neutral with regard to jurisdictional claims in published maps and institutional affiliations. |
© 2022 by the authors. Licensee MDPI, Basel, Switzerland. This article is an open access article distributed under the terms and conditions of the Creative Commons Attribution (CC BY) license (https://creativecommons.org/licenses/by/4.0/).