Article

Evaluation and Influencing Factors of Network Resilience in Guangdong-Hong Kong-Macao Greater Bay Area: A Structural Perspective

1
School of Economics, Shandong Normal University, Jinan 250358, China
2
College of Geography and Environment, Shandong Normal University, Jinan 250358, China
3
Institute of Geographic Sciences and Natural Resources Research, Chinese Academy of Sciences, Beijing 100101, China
4
College of Resources and Environment, University of Chinese Academy of Sciences, Beijing 100049, China
*
Authors to whom correspondence should be addressed.
Sustainability 2022, 14(13), 8005; https://doi.org/10.3390/su14138005
Submission received: 3 June 2022 / Revised: 27 June 2022 / Accepted: 28 June 2022 / Published: 30 June 2022
(This article belongs to the Topic Resilience of Interdependent Urban Systems)

Abstract

:
Currently, urban crises are spreading, even tending to be magnified along the urban networks. Improving urban network resilience can effectively reduce the loss and cope with sudden disasters. Based on the dimensions of regional resilience and the framework of urban network, a new evaluation system of network resilience, including economic, social, and engineering networks, was established to assess the network resilience of the Guangdong–Hong Kong–Macao Greater Bay Area (GBA) from a structural perspective. We analyzed the spatial characteristics and influencing factors of network resilience using social network analysis and quadratic assignment procedure. The results were as follows: (1) regional difference was biggest in GBA’s economic network strength while smallest in its transportation network strength, and the east bank of the Pearl River represented an extremely resilient connection axis; (2) the structures of network resilience and its subsystems were heterogeneous, and the connection paths of network resilience were more heterogeneous and diversified than those of the subsystems; (3) network resilience presented an obvious core–edge structure, and the spatial correlation and spillover effect between blocks were substantial; and (4) geographical proximity, as well as differences in economic development, urban agglomeration, and market development, had a significant impact on network resilience. This study provides a more systematic approach to evaluate the regional network resilience, and the results provide references for the construction of bay areas in developing countries.

1. Introduction

Globalization and informatization have considerably changed the spatial organization model of cities, and the close and complex interconnectedness between cities has presented a network-like spatial structure, thereby contributing to the emergence of urban networks [1]. The research on urban networks was initiated by the Globalization and World Cities Research Network (GaWC), a think tank that came up with the well-known interlocking network model (INM) [2] and brought the research on urban networks worldwide to a new stage.
With the urban network, cities are no longer isolated from each other but are inextricably linked with the surrounding cities. On the one hand, this promotes the orderly flow of production factors in the urban network and greatly improves the regional production efficiency. On the other hand, the crisis factors are also likely to be transmitted and spread along the urban network, which is more likely to be magnified and affect the whole region. For example, the outbreak of COVID-19 in China in 2020 was expanding due to the extensive population movement between cities [3], and China’s measures to control the transportation network and its nodes played a crucial role in epidemic prevention and control. Effective urban network management and control and diversified urban network emergency-response mechanisms not only facilitate the orderly flow of production factors between cities but also curb the spread of urban crisis factors and improve the city’s capability to cope with sudden disasters.
A bay area is an important form of agglomeration of coastal cities [4]. The development of world-class bay areas is based on urban element networking on local and global scales. They rely heavily on the strong agglomeration and radiation force of world-class core cities within to realize the close interconnection of local areas and to enhance the competitiveness of the whole region. The world-class bay areas have provided an excellent model for developing a network of coastal cities. GBA is the largest and most populous among the four major bay areas globally. In 2018, it surpassed the San Francisco Bay Area in gross domestic product (GDP) [4]. As an emerging bay area, GBA should not be under-estimated. Meanwhile, its urban network structure is also continuously improving, and the pattern of “front shop, back factory” is gradually disappearing. Exploring the urban network resilience of GBA will enrich the development experience and interpretation of the world’s four major bay areas and provide a guide for the construction of bay areas in developing countries.
The research on urban network has been conducted worldwide and has become more developed. Scholarly attention has been paid to the various aspects of the urban network globally, including the traffic network [5], economic network [6,7,8], information network [9,10], innovation network [11,12], and corporate organization network [13], among others, aiming to build an analytic framework for urban network based on single connection data. Complex network analysis and social network analysis have been widely used in these studies [1,5]. Presently, along with rapidly advancing industrialization and urbanization, although urban networks have changed the spatial organization of cities dramatically, are very vulnerable to various disturbances and impacts from the outside world and itself. Therefore, their defense or buffering capabilities when facing disasters and their resilience to various disturbances from the outside world and itself, has become a hot topic for scholarly study.
The concept of resilience was first introduced as an ecological research framework by ecologist Crawford Stanley Holling in 1973 [14]. The combination of resilience and regional space gives rise to the concept of regional resilience, which refers to the ability of a region to adapt to shocks and impacts, and establish new growth paths when faced with challenges and changes [15]. The combination of urban network and regional resilience gives birth to urban network resilience, a form of regional resilience in space as well as an extension of regional resilience in urban networks. Urban network resilience is defined as the ability of urban network systems to prevent, resist, respond, and adapt to external shocks, and realize the recovery and transformation of itself by virtue of the social, economic, engineering, and organizational collaboration and complementation between cities [16].
Compared with urban network, little attention has been paid to urban network resilience globally. Urban network resilience is an extension of urban network research, which mainly includes economic network resilience [17], infrastructure network resilience [18], social network resilience [19], organizational network resilience [20], and so on. Progress has been made in quantitative research on the resilience of urban network structure as an important perspective of urban network resilience. In these studies, the network is mostly constructed from the economic, social, and engineering levels, and the residence of network structures is assessed in terms of hierarchy, matching, diversity, transmission, and agglomeration [21,22,23,24], thereby producing satisfactory results. The resilience of network structure refers to the ability of the network structure to respond to the impact, and restore, maintain, or improve the features and functions of the original system in the face of external disturbances [21]. In a previous study [25], urban networks were constructed from the four dimensions of engineering, economy, society, and innovation, and the resilience of the network structure was assessed in terms of hierarchy and matching.
In most existing studies on the urban network resilience globally, the network resilience is constructed based on single connection data and analyzed with the established network topology, paying less attention to comprehensive networks. The evaluation of urban network resilience in academia is still under exploration, and an unanimously recognized method has not yet been developed [16]. In addition, less attention is paid to the influencing factors of urban network resilience.
Urban network resilience stems from regional resilience, and regional resilience generally covers four dimensions: economy, society, ecology, and engineering, which should also be taken into consideration in evaluating urban network resilience. In this study, therefore, based on the dimension and framework of regional resilience, the construction of the urban network, and the measurement of urban network structure resilience drawn on the existing studies [16,21], we build an indicator system covering the dimensions of economy, society, and engineering, which does not include an ecological network because ecology is regarded as the regional base. This system relies on multiple connection elements to overcome the uncertainty of a single connection element in evaluating urban network resilience. Meanwhile, this study combines “traditional statistical data” with big data. Then, it is used to assess the network resilience of GBA, together with social network analysis to the spatial structure characteristics and influencing factors of network resilience innovatively, with the hope to provide a methodological reference for related empirical research on urban network resilience, enhance the proper interconnectivity of GBA cities, and provide decision-making support for these cities to better cope with risks and crises, thereby realizing the sustainable development of GBA.

2. Methods and Data Source

2.1. Methods

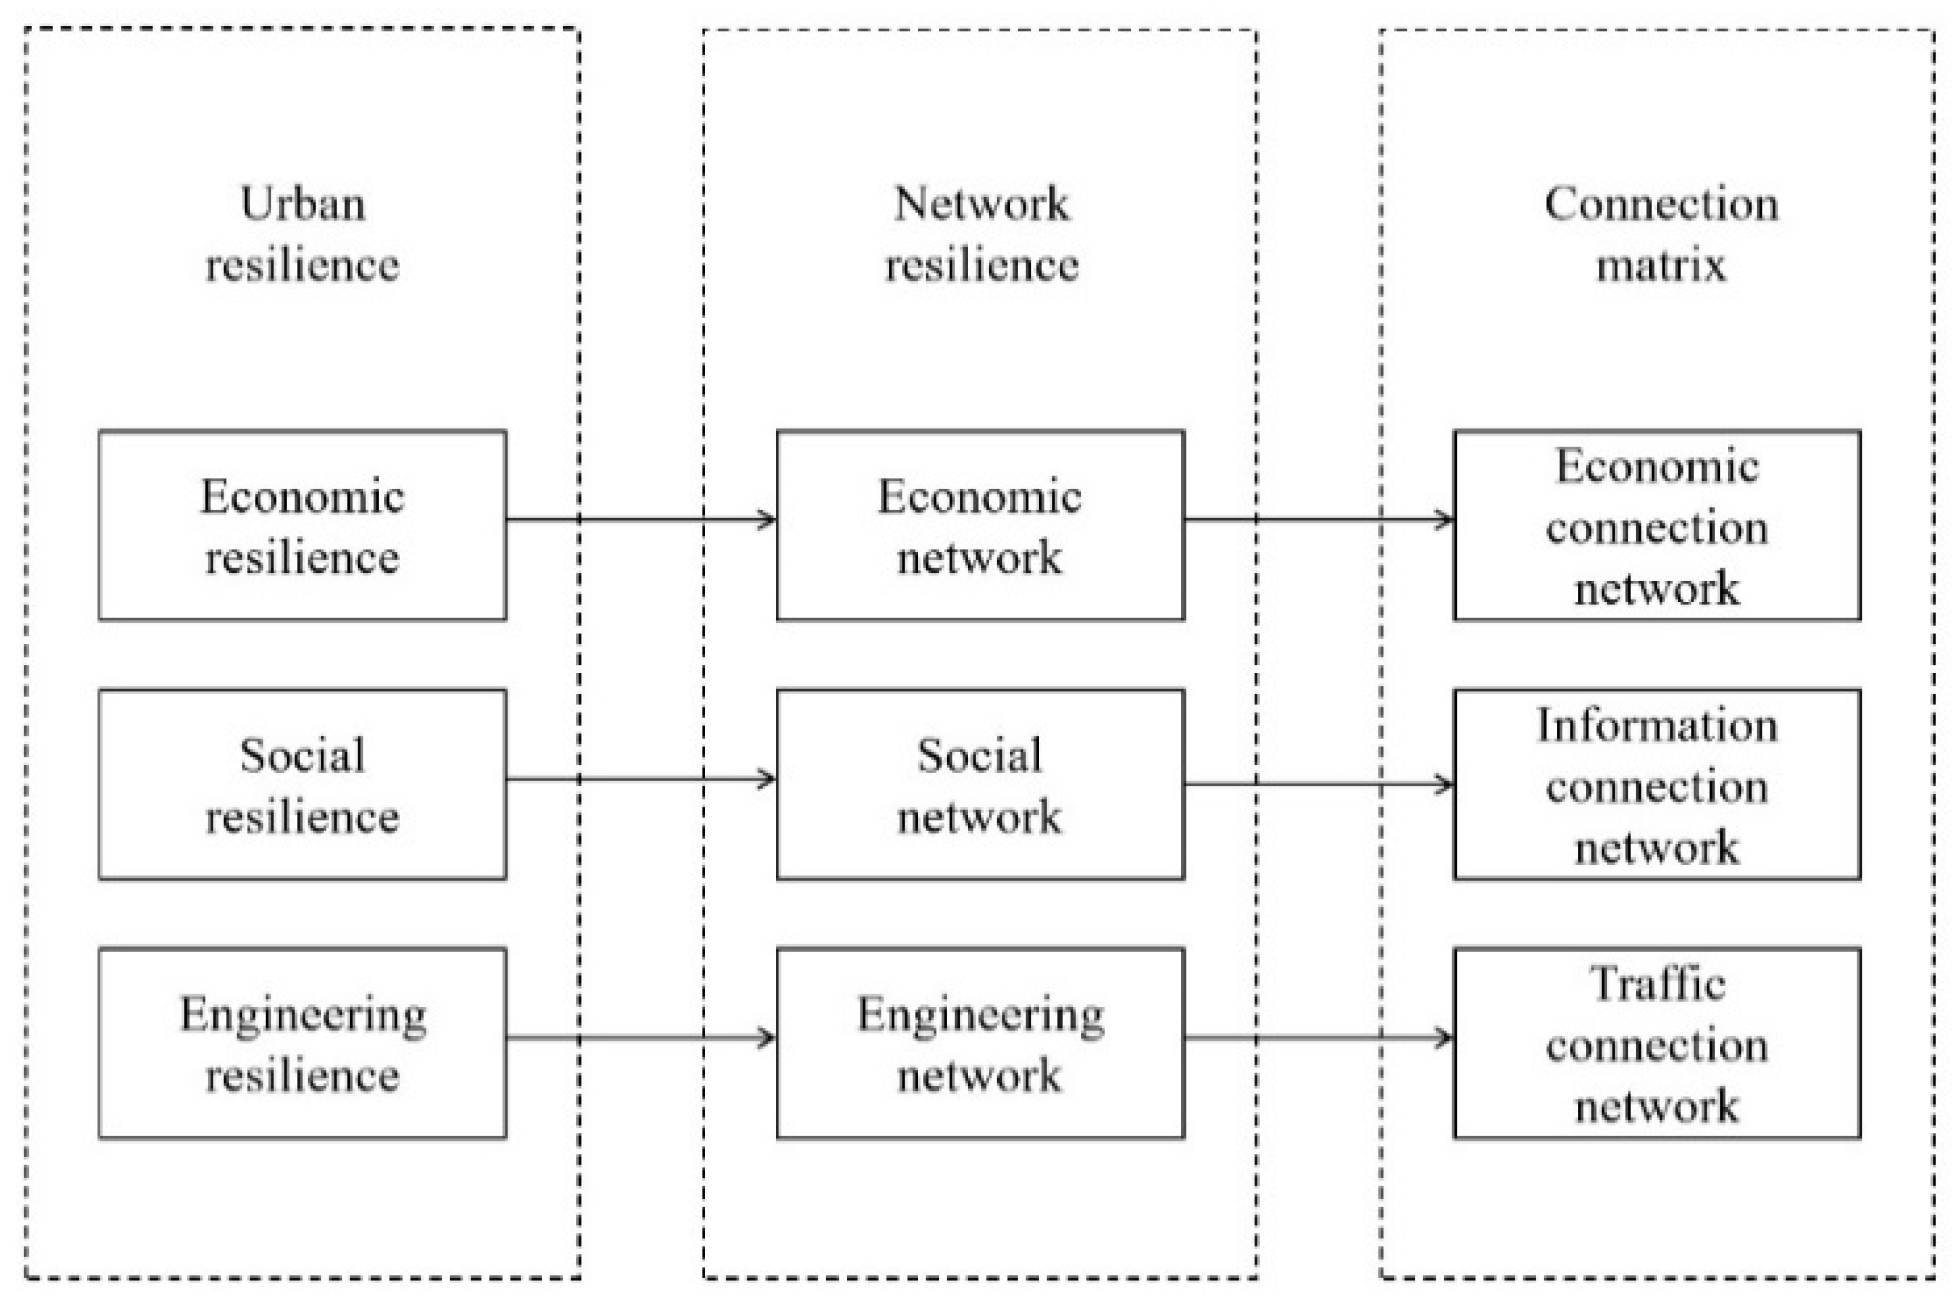
2.1.1. Indicators of Network Resilience

Based on the previous analysis, a network resilience evaluation system (Table 1) covering the dimensions of economy, society, and engineering (Figure 1) was built based on the representativeness, availability, and integrity of data as previously described [21], which was used for evaluation of urban network resilience.
The strength of the economic connection between cities is measured by the modified gravity model, according to the following formula [26]:
F i j = k i j P i G i P j G j D i j 2 ,   k i j = G i G i + G j
wherein, F i j represents the strength of the economic connection between i and j; P i and P j are the total populations of i and j; G i and G j represent the GDP of i and j; D i j refers to the straight-line distance between the centers of gravity of i and j. k i j stands for the attraction coefficient. The network of economic networks is thus constructed.
The economic, information and transportation networks were standardized using the extreme value method to construct an undirected symmetric matrix (https://baike.so.com/doc/6935052-7157408.html accessed on 26 May 2022 ). The weights of the economy, information, and transportation networks were 0.76, 0.2, and 0.03, respectively, according to the entropy method (https://wenku.baidu.com/view/c96487ee16fc700aba68fc4e.html accessed on 26 May 2022). Finally, the comprehensive connection network between regions was available for the evaluation of network resilience. There is no need to specify the calculation formula here.

2.1.2. Social Network Analysis

In recent years, social network analysis has been widely used in the analysis of various network structures. In this study, social network analysis was introduced and realized with Ucinet 6.0(Stephen Borgatti, Martin·Everett and Linton Freeman, Irvine, CA, USA), especially the centrality, core-edge structure, block model, and other analytical methods in order to explore the spatial organization of GBA’s network resilience.
  • Analysis of basic network characteristics (weighted degree, distribution, and correlation)
In the present study, the spatial structure of network resilience was scrutinized through degree distribution and degree correlation. The weight of the network edge was taken into account in the calculation and represented by the weighted degree and its distribution and correlation. The weighted degree refers to the sum of the weights of the edges directly connected to a node, namely, the sum of the connection strength [22], which can reflect the connection strength between nodes more accurately than the degree per se. The higher the weighted degree, the stronger the connection between nodes.
The weighted degree of each node city was ranked in descending order using a rank-order scale and drawn into a power curve, and the distribution formula for the weighted degree of the study area’s network was as follows [21]:
K i = C ( K i * ) a
In the formula, K i is the weighted degree of node i; K i * refers to the rank of the weighted degree of node i in the network; C is a constant term; and a represents the slope of the weighted degree distribution curve.
Each node in the network is directly connected to a certain number of adjacent nodes. The average weighted degree K ¯ i of all adjacent nodes directly connected to node i was calculated using the following formula [21]:
  K ¯ i = j V i K j K i
In the formula, K j is the weighted degree of node j adjacent to node i; V i refers to the set of all nodes j adjacent to node i. The linear relationship between K i and K ¯ i underwent power curve estimation by the following formula:
K ¯ i = D ( K i ) b
In the formula, D is a constant term; b represents the weighted degree correlation coefficient. If b > 0, the average weighted degree of adjacent nodes increases with the weighted degree; in other words, the weighted degree is positively correlated, and the network is homogeneous. If b < 0, the average weighted degree decreases as the weighted degree increases; in other words, the weighted degree is negatively correlated, and the network is heterogeneous.
  • Core–edge analysis
The “core–edge” model can be used to identify the core area and the edge area within the network. The members of the core area gather together and enjoy a dominant position in the network resilience, and the network resilience between the members is strong; the other members are marginalized, and there are few, or no, connections between these members in a disadvantaged position in the network, thus resulting in weak network resilience among these members [27,28]. The core–edge analysis plays a crucial role in exploring the high-value areas of network resilience in GBA and defining high-resilience and low-resilience connection areas.
  • Block model analysis
Block model analysis is an important means for spatial clustering analysis of social networks which can be used to analyze the location characteristics of network nodes. Members playing the same role constitute a block, thereby revealing the spatial clustering characteristics of GBA’s network resilience, characterizing the internal structure of the interrelation network, and identifying the role and status of each block in the network [29]. The interrelation between blocks can be examined based on the members identified in each block, thus facilitating the analysis of the overall interrelation network.
  • Quadratic Assignment Procedure regression analysis
Since the spatial correlation matrix and the variables of related driving forces were all matrices composed of relational data, and there may be multicollinearity problems between variables, they could not be tested by conventional measurement methods. Quadratic Assignment Procedure (QAP) regression analysis is helpful to explore the regression relationship between a single matrix and multiple matrices and can evaluate the significance of the determination coefficient R2. As a non-parametric analysis method, QAP can be used to examine the regression relationship between multiple independent variable matrices and one dependent variable matrix without assuming that the independent variables are independent of each other, which is more effective and robust than the parametric method [30]. Hence, QAP regression analysis was adopted to test the influence of various factors on network resilience. QAP regression analysis was performed in two steps: first, conventional multiple regression statistical analysis was carried out, aiming at the long vector elements corresponding to the independent variable matrix and the dependent variable matrix; secondly, the rows and columns of the dependent variable matrix were randomly replaced at the same time and regressed, and all the coefficients and the coefficient of determination R2 were saved.

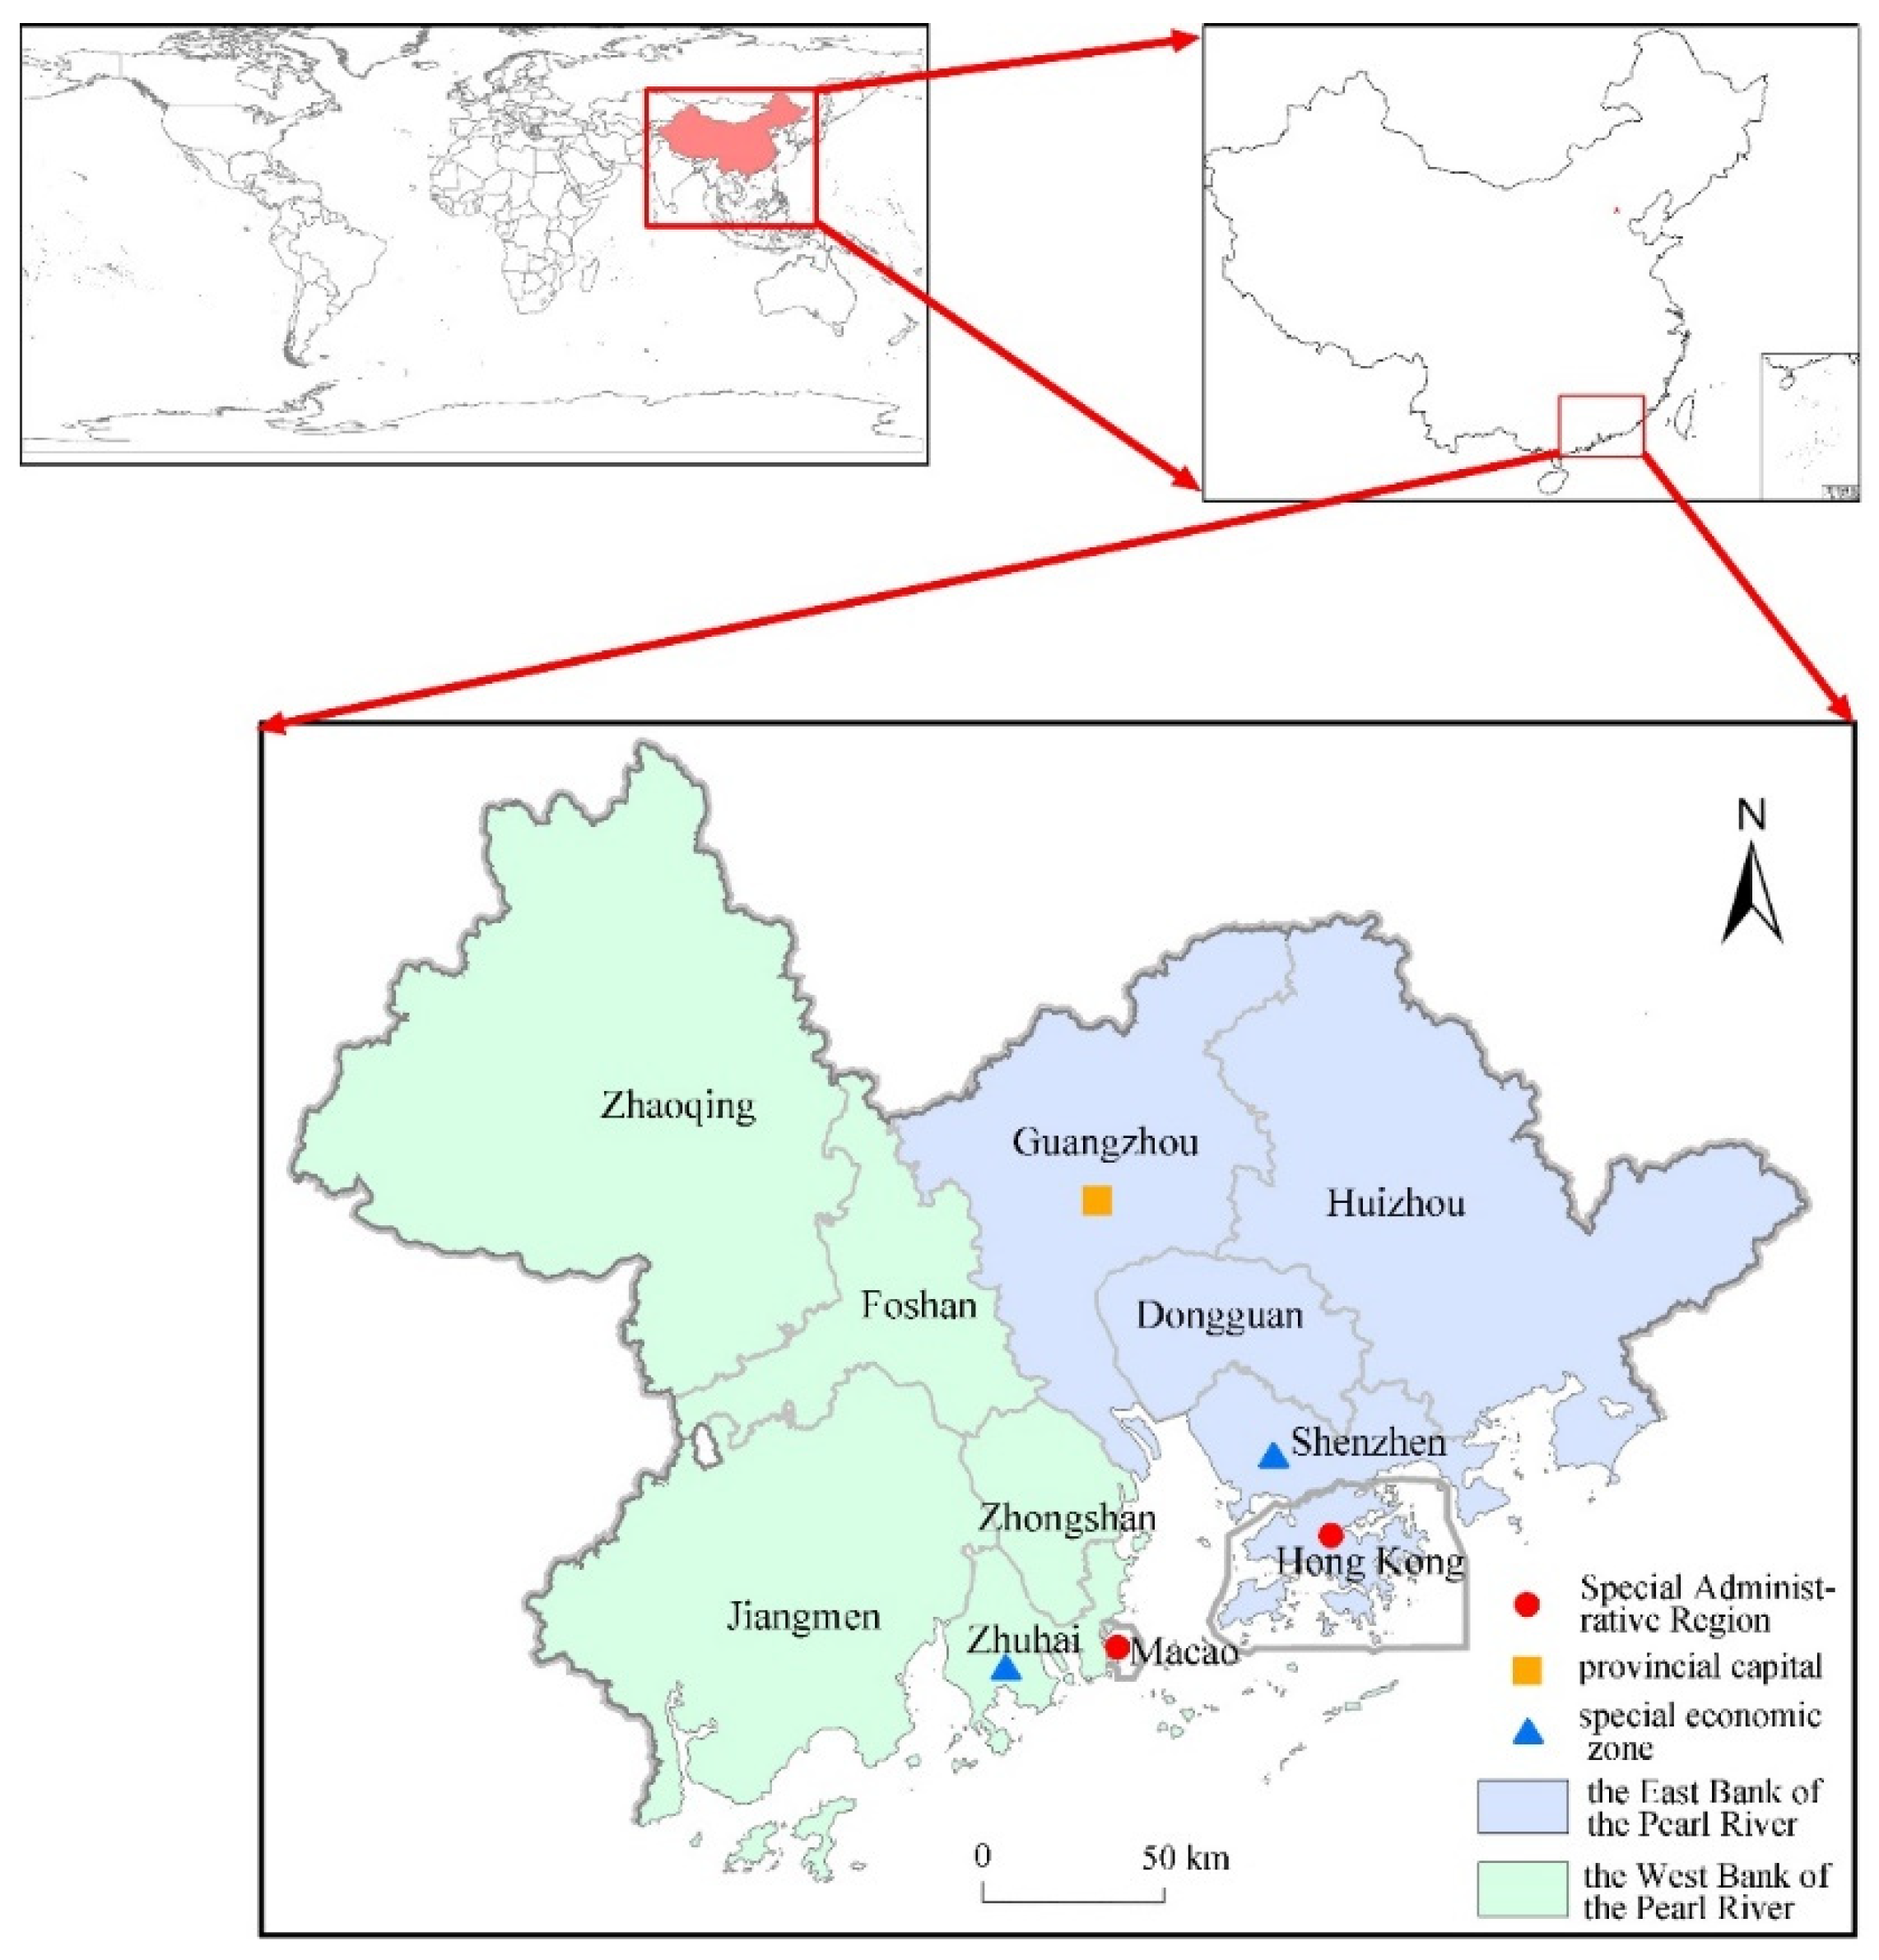
2.2. Study Area and Data Source

According to the Outline Development Plan for the Guangdong–Hong Kong–Macao Greater Bay Area issued in 2019, nine prefecture-level cities, namely, Guangzhou, Shenzhen, Zhuhai, Foshan, Huizhou, Dongguan, Zhongshan, Jiangmen, and Zhaoqing, as well as Hong Kong and Macao, were selected in this study. By the end of 2019, GBA had a land area of about 54,803.11 square kilometers, a population of 72,669,300, and a regional GDP of 11,587.8 billion yuan. It is one of the most vibrant and promising bay areas in the world as well as a region featuring the strongest economic vitality, the most concentrated innovation resources, and the highest degree of openness, enjoying a prominent place across China. Its internal urban network is more complex compared with other cities. Guangzhou and Shenzhen in the study area represent one of the cores of the national urban network in China [1]. Therefore, GBA serves as a representative area for research on urban network resilience. The study area is shown in Figure 2.
Since the distance between cities required to construct a transportation network is fixed, the data of only one year were employed as a sample in the present study. These data were derived from the 2020 Guangdong Statistical Yearbook, the 2020 Hong Kong Statistical Yearbook, the 2019 Macao Statistical Yearbook, the Baidu Index, and the Baidu Map.

3. GBA’s Network Resilience Evaluation

3.1. Characteristics of Various Network Resilience Subsystems

3.1.1. Spatial Characteristics of Subsystems

The connection strength between regions was calculated using the method for network resilience and each subsystem, and visualized with ArcGIS 10.2. It was then classified into five levels with reference to natural fracture patterns (https://www.zhihu.com/question/308786900 accessed on 1 June 2022) and drawn into a geographical network and topological network (Figure 3 and Figure 4) representing GBA’s network resilience.
The overall connection strength of GBA’s economic network varied greatly among regions, and the high-value areas of connection were spatially concentrated (standard deviation = 0.14). The high-value areas were centered on Hong Kong and Shenzhen, and formed a dendritic network. The connection strength of the east bank of the Pearl River was at a high level, while that of most areas on the west bank was weak, demonstrating an obvious rich-club phenomenon. The present study showed that Hong Kong–Shenzhen was at the first tier as a significant core area. The economic connection strength between the two cities accounted for about 42% of the total in the whole region, indicating that the economic connection strength in GBA was highly concentrated. This could be attributed to the geographical proximity of the two cities, whose GDP was a leader in the study area, and both cities relied on the financial and logistics industries, thereby resulting in close economic ties between them. The second-tier network was Shenzhen–Dongguan, whose economic connection strength accounted for about 14% of the total in the whole region. The third-tier economic network was, basically, centered on Guangzhou, including Guangzhou–Dongguan, Guangzhou–Shenzhen, Guangzhou–Foshan, and Dongguan–Hong Kong. Finally, the share of fourth-tier and fifth-tier urban connections was as high as 77%, and the economic connection between most regions at these tiers was weak.
There was, basically, no distance attenuation in the information connection between regions, and geographical proximity did not necessarily mean that there was a close information connection that could form an orderly connection network. The information network strength was highly concentrated in the study area (standard deviation = 0.19), and the information connection strength between prefecture-level cities was high. The information connection strength of Shenzhen–Hong Kong and Guangzhou–Hong Kong at the first tier accounted for about 18.8% of the total in the whole region, showing hierarchical radiation centered on provincial capital cities, special economic zones, and special administrative regions. There was a certain degree of coupling between the information connection strength between nodes in the network and the level of regional development.
The regional differences in the transportation network strength were small (standard deviation = 0.21), and the transportation network density was as high as 0.59. The first-tier and second-tier, transportation connection values were highly dispersed in GBA, and the first-tier transportation connection strength accounted for about 14% of the total in the entire region. As the transportation connection evaluation model emphasized the influence of geographical proximity, the overall transportation connection level demonstrated that the shorter the spatial distance, the stronger the regional connection, and the prime connection of each region mostly pointed to its adjacent nodes.
The standard deviation of the connection strength of GBA’s network resilience was 0.14, with highly concentrated high-value areas and significant strength gaps at each level. The hierarchical connection structure was closely related to the urban spatial location of GBA and characterized with a radical spatial-connection pattern with central cities as the core and neighboring cities as the hinterland. The high-value areas of network resilience were mainly distributed in the vicinity of the Pearl River estuary, forming a star-shaped network with Hong Kong–Shenzhen as the center as well as a strong resilience connection axis in the east bank of the Pearl River. These areas specifically referred to Hong Kong, Shenzhen, Guangzhou, Dongguan, and Foshan. For these areas, the first-tier and second-tier resilience connection strength accounted for as high as 48% of the total in the region. This region enjoyed a sound emergency response mechanism to combat uncertain risks, bear the high cost of urban recovery and development, and cope with external impacts in the connection between regions.
Furthermore, provincial capital cities and special administrative regions have played a leading role in regional development. These cities boast relative complete urban economic, social, ecological, and engineering facilities, and highly synergic spatial structures within the regional network, thus, getting a higher network resilience score. Cities with high levels of resilience connections were similar to cities with high levels of connections in subsystem networks, and the main axis of resilience connection strength was, basically, consistent with that of economic connection strength. Cities at the fifth tier were, basically, located in the edge area, far away from the core area, and out of the radical reach from the core area. The traditional spatial distance still affected the strength of their network resilience. In the future, it will be important to accelerate the development of inland and edge areas.

3.1.2. Weighted Degree of Subsystems

The weighted degrees of the economic, information, transportation, and resilience networks of 11 cities in GBA (Table 2) were calculated with the social network analysis software Ucinet6.0 to explore the individual characteristics of the resilience correlation network in GBA. The finding revealed that there was a difference between the weighted degree of network resilience and that of each subsystem, and the difference in the weighted degree of the network between regions was statistically significant. There was a positive correlation between the administrative level and network resilience; namely, the higher the administrative level, the higher the status in the network, and the stronger the connection with other regions.
The weighted degree of network resilience was highly hierarchical. Guangzhou, Shenzhen, and Hong Kong occupied a predominant position in the network and stood at the core of the economic, information, and network resilience of GBA. With a solid position and significant advantages, these cities enjoyed absolute influence and attractiveness to other cities and showcased strong resilience to external impacts. This could be attributed to the high level of economic development in the region and its dominant position in GBA. Prefectural-level cities, such as Zhaoqing, Jiangmen, and Huizhou, had weak connections with surrounding areas and were located at the periphery of network resilience. This was because these cities were relatively under-developed and did not have advantageous resources compared with provincial capital cities and special economic zones. In addition, they were located on the outer edge of GBA, resulting in inconvenient communication and weak connections with other cities in GBA. Judging from these findings, there is still big room for improvement in the network resilience among the regions. The administrative level should not hinder the connection between cities and it is necessary to promote the coordinated development of regions in the future.
The weighted degrees of all node cities in the network were ranked and drawn into a power curve (Figure 5). As shown in the weighted degree distribution of the network resilience subsystems in GBA, the slope of the curve ∣a∣ was 0.2–2.1, and the slopes of the fitting power curves of the degree distributions of each city varied greatly, indicating a significant hierarchy. The ∣a∣ of the economic network was the highest, followed by the resilience, information, and transportation networks in descending order. The inter-regional hierarchy of the economic network was the most significant, and the status of the core city was the most prominent, consistent with previous studies. The fitting curve of the information network was relatively flat, with fewer cities featuring high-weighted degrees and smaller differences in weighted degrees between regions. The transportation network lacked strong core cities, with scattered low-value areas, which were, apparently, homogenous. The ∣a∣ of network resilience based on the three dimensions was 0.9, demonstrating significant differences between the network resilience and the three subsystems.
The weighted degrees of all node cities in the network and the average weighted degrees of all adjacent nodes underwent power curve fits (Figure 6). According to the weighted degree correlation of the network resilience subsystems in GBA, the network correlation coefficient |b| was 1.07–1.11, and the resilience and its subsystem networks were both negatively correlated with weighted degrees. The resilience network was the most heterogeneous, followed by the information, transportation, and economic networks, in descending order. The economic network was characterized by weak heterogeneity, simpler connection paths compared with other networks, and a closed network, which may hinder the enhancement of network resilience. The connection paths of the information network were more heterogeneous and diversified than the transportation economic networks. The nodes with high-weighted degrees, while connected with cities of the same level, could also give consideration to the cities that were very different from themselves, making the overall network connection more diverse. At the same time, the heterogeneous and diversified connection paths improved the efficiency of information transfer between regions and, thus, improved the network resilience. The transportation network showed a weak heterogeneity; the greater the weighted degree of the nodes, the smaller the average weighted degree of adjacent nodes; the connection between cities tended to aggregate. The network resilience was negatively correlated with weighted degrees, and the correlation coefficient was higher than that of subsystems, demonstrating a flattening trend of network connections. The connection paths were more heterogeneous and diversified than the subsystem networks, and the network as a whole had more connection possibilities, indicating that the network resilience took advantage of its subsystems, and the network system was relatively complete. Therefore, it could adapt itself to impacts with excellent resilience.

3.2. Characteristics of Network Resilience

3.2.1. Core–Edge Analysis of Network Resilience

In this study, the core–edge structure in social network analysis was used to measure network resilience. The results were as follows: the fitting correlation coefficient of the core–edge structure of network resilience was as high as 0.96, indicating that there was an obvious core–edge structure in the network resilience of GBA. Roughly, the core areas were Guangzhou, Shenzhen, and Hong Kong, while the other nine cities were edge areas, basically consistent with the conclusions mentioned earlier. The core–edge continuum model was further employed to measure the coreness of each city to correct the absolute model results (Table 3). The study area could be divided into three parts based on their coreness: the cities with a coreness > 0.1 (Shenzhen, Hong Kong, Dongguan, and Guangzhou) were absolute core areas, which were the dominant cities in the spatial structure of network resilience; cities with a coreness of 0.04–0.1 (Foshan, Huizhou, Zhuhai, Zhongshan, and Macao) were core–edge transition areas, which were important node cities; cities with a coreness < 0.04 (Jiangmen and Zhaoqing) were absolute edge areas.

3.2.2. Block Model Analysis of Network Resilience

For the block model analysis, the maximum division degree was 2, and the concentration standard was 0.2. The 11 cities in GBA were divided into four blocks, and the spillover effect between the blocks was shown in Table 4. The block model analysis enabled us to explore the position of the four blocks in the spatial resilience network of GBA. There were 36 correlations between the 11 cities in GBA, only four correlations within blocks, and 32 correlations between different blocks, revealing that the spillover effect of network resilience between blocks was remarkably correlated with space. The expected internal relationship ratio of Block 1 (Guangzhou and Shenzhen) and Block 2 (Hong Kong, Dongguan, and Huizhou) was 10%, while the actual level was 25%. Block 3 included Macao, Zhongshan, and Zhuhai, and Block 4 was basically under-developed areas on the edge of GBA, including Foshan, Jiangmen, and Zhaoqing.
The network density matrix of each block was calculated (assign the block with a density > 0.085 to 1; otherwise, assign it to 0), thereby constructing an image matrix (Table 5). The diagonal elements of the image matrix of Block 1 and Block 2 were all 1, indicating that network resilience had a significant correlation within the block and showing an obvious rich-club effect, while it was not the case in neither Block 3 nor Block 4. Table 4 shows the relationship between the four blocks: Block 1 had a spatial spillover effect on Block 2 in addition to its internal correlation; the spillover effect of network resilience of Block 2 was manifested within Block 1 and Block 2. Taken together, the development level of Block 1 and Block 2 was higher, and there were more spillovers between regions. The relationship between the two blocks was extremely active, which was not only the “power house” in the resilience correlation network but also the “bridge” between the blocks. Furthermore, Block 3 and Block 4 were relatively isolated, making it necessary to enhance their network resilience strength with surrounding areas in the future.

4. Influencing Factors of GBA’s Network Resilience

4.1. Influencing Factors

Referring to previous studies [31,32,33], eight socio-economic factors, namely geographical proximity, economic development, urban agglomeration, infrastructure, market development, administrative power, education, and opening to the outside world, were investigated as the influencing factors GBA’s resilience correlation network. The closer the geographical distance, the stronger the connection between regions. When the cost of element flow between adjacent regions is low, spatial correlation is more likely to occur. Geographical proximity (Dis) depended on whether the cities were adjacent to each other and was characterized by the Rook adjacency-based weight matrix. The adjacent prefecture-level cities or special administrative regions were characterized as 1, and the non-adjacent ones as 0 to construct a geospatial adjacency matrix. According to the spatial characteristics of network resilience described earlier, there was a certain correlation between economic development and network resilience strength, and it was likely to have spillover effects between developed and under-developed regions. For this reason, economic development (Gdp) was investigated as an influencing factor of network resilience, which was characterized by per capita GDP. Urban agglomeration (Pop) was expressed as population density. Infrastructure (Roa) was also an important factor affecting the improvement of network resilience, which, therefore, was measured by per capita road length. Market development (Con) was expressed as the total retail sales of social consumer goods per capita. The administrative power of local governments (Fin) also affected the strength of regional network resilience, which was represented by the proportion of fiscal expenditure in GDP. Education (Edu) was expressed as the proportion of education expenditure in GDP. Opening to the outside world (Ope) was measured by the proportion of total imports and exports to GDP. As such, a measurement model of influencing factors was established:
R = f ( D i s , G d p , P o p , R o a , C o n , F i n , E d u , O p e )
In the formula, R is the spatial correlation matrix of network resilience; Dis, Gdp, Pop, Roa, Con, Fin, Edu, and Ope represent the correlation matrices constructed for the absolute value of the difference of each variable.
To solve the endogeneity problem caused by reverse causality and improve the exogeneity of the model, the independent variables in the model were changed to variables with a lag of one period of the dependent variables [34]. This method of data selection was more rigorous than most studies using contemporaneous variables [35]. The variables involved in the influencing factors were based on the data of 2018, which were all derived from the 2019 Guangdong Statistical Yearbook, the 2019 Hong Kong Statistical Yearbook, and the 2018 Macao Statistical Yearbook. Since the statistical calibers of Hong Kong, Macao, and the mainland were different, the total retail sales value and the total retail sales were used as an alternative for the total retail sales of consumer goods in the two places, respectively.

4.2. Results Analysis

In this study, QAP regression analysis was performed on the dependent variable network resilience correlation matrix and eight independent variable matrices by 5000 random permutations. The results of the first regression were shown in Table 6. Then, the independent variables with no statistical significance were removed, and the stepwise regression results were obtained as shown in Table 7.
According to the stepwise regression results, R2 was 0.285, indicating that the distribution of each effective variable could account for 28.5% of the variation of the network resilience correlation matrix. The coefficient of certainty of QAP regression analysis was lower than that of OLS regression, and, therefore, the overall fitting of the research results was satisfactory. Geographical proximity, economic development, urban agglomeration, and market development all passed the significance test with a regression coefficient of 5%, meaning that these were important influencing factors of network resilience. By contrast, the impact of the other four factors on network resilience was not yet revealed.
The standardized regression coefficient of geographical proximity was positive, suggesting that it played a crucial role in strengthening the spatial correlation of network resilience between regions, and adjacent regions had stronger spatial spillover effects than non-adjacent regions. The standardized regression coefficient of economic development was positive, meaning that when there was a great difference in the level of economic development between two cities, the economically developed areas were more likely to have correlation and spillover effects on economically under-developed areas, and the network resilience in the two regions was likely to be stronger. The impact of urban agglomeration on the network resilience correlation matrix was negative, suggesting that the network resilience between cities was stronger when the agglomeration difference between them was smaller. The regression coefficient of market development was negative, showing that the closer the market development level, the stronger the spatial correlation of network resilience; on the contrary, when the difference in the market development levels between regions was huge, the urban network would be unstable and fragile when affected by external shocks.
Therefore, to enhance the network resilience in GBA, it is necessary to give full play to the role of spatial differences in promoting the flow of various elements and strengthen the spatial spillover effect of high-resilience regions on low-resilience regions, so as to avoid the isolated development between cities caused by huge spatial differences in network resilience.

5. Discussion

5.1. GBA’s Network Resilience

As industrialization and urbanization quicken the pace, cities are faced with all-round and multi-angle impacts from nature and culture. Crisis elements even have a magnifying effect as the network spreads [36,37]. Moreover, studies have shown that strengthening or weakening key nodes and connections or improving the network topology can effectively enhance a region’s ability to actively respond to external disturbances and shocks [16]. For example, the COVID-19 epidemic, a public-health emergency, is still running its full course, which provides an opportunity to accelerate the construction of resilient cities. China has effectively curbed the spread of COVID-19, in which the establishment of inter-city public-health networks and medical staff networks, as well as the management and control of key transportation network nodes, have played a crucial role [3,16].
The concept of resilience originated from ecology [14], which refers to the ability of a system to defuse external shocks and maintain its main functions in the event of a crisis. However, most of the current research on urban or regional resilience is based on the economic development or disaster prevention, and only a few have discussed this issue from a spatial perspective. We need to see that under the multiple actions of informatization, globalization, and regionalization, the spatial transformation of cities is of great significance [16]. The structural perspective is an important aspect of the resilience of a city or regional network. On the one hand, the structural resilience of urban network is essentially a typical form of regional resilience in space; on the other hand, network structure is an important way to characterize regional network patterns and evaluate the resilience of cities or regions [21].
Cities need to be resilient, and urban networks, as an essential part of cities, need to be even more resilient. In the meantime, as one of the world-known bay areas, GBA has formed a highly complex network of connections within. How to address the impact of various uncertainties and achieve sustainable urban development under the impact remains a problem that needs to be resolved immediately [38]. It will also set an example for other regions.
This paper found that there were great differences in the strength of network links among cities in GBA. There was an obvious core–edge structure in the network resilience of GBA. The distribution of the core and hinterland of GBA is consistent with the findings of Wu et al. [8]. The east bank of the Pearl River was more developed than the west bank. Zhang et al. [39] also confirmed this point. And the east bank of the Pearl River was a strong connection axis of resilience. There was a positive correlation between the administrative level and the strength of network resilience (Figure 3 and Table 2). The economic network was the least heterogeneous. It was a potential obstacle to the improvement of network resilience in GBA. Geographical proximity and economic development were positively correlated with network resilience. Differences in urban agglomeration levels and market development levels were negatively correlated with resilience networks.
This study extends the theoretical and practical aspects of network resilience. Firstly, this paper argues that traffic, information, and economy all have an important impact on the urban network and are irreplaceable for each other. Therefore, the present study measures the resilience of GBA’s comprehensive urban network. Secondly, social network analysis has been widely used to probe into networks [23]. This paper considers both the universality and particularity of this method in urban agglomerations. To this end, in addition to the commonly used core–edge analysis, this study also resorts to a weighted degree, weighted degree distribution, weighted degree correlation, and blocks to realize the systematic analysis of points, blocks, and surfaces. The evaluation of network resilience provides a new perspective for a systematic understanding of GBA. At the same time, it is noted that the analysis of the influencing factors in previous studies is weak. For this reason, this paper continues to explore other influencing factors after the anticipated evaluation. It employs the QAP regression analysis, which is more effective and robust than the parametric method, to examine the driving force of GBA’s urban network resilience, aiming to provide more precise guidance for GBA’s urban network to improve its ability against urban risks and shocks. The analysis of influencing factors also provides thinking for strengthening the connection of GBA, which is also in line with the original intention of the country to position GBA as a national development strategy and main part of the new pattern of comprehensive opening up.

5.2. Policy Implications

The development of the economic, information, and transportation networks promotes the integration and flow of resources and makes the relationship between cities even closer. The research on urban network resilience is of great significance to the urban spatial organization today, which serves as an important barrier to improve the network resilience of GBA and deal with external shocks and various uncertainties. On this basis, efforts may be made to improve network resilience from the following aspects:
(1)
It is necessary to build a networked spatial pattern driven by poles. Cities should further optimize the spatial network and promote balanced regional development. GBA shows obvious hierarchy and heterogeneity in cities, with Hong Kong and Shenzhen as primary cities. It is essential to give full play to the role of Hong Kong–Shenzhen as an “engine” and “booster” in GBA’s resilience network and strengthen its linkage and radiation effect on GBA cities. It is also important to give play to the leading role of Hong Kong–Shenzhen, Macau–Zhuhai, and other strong alliances, deepen the cooperation between Hong Kong–Shenzhen and Macau–Zhuhai, accelerate the urban integration of Guangzhou and Foshan, realize the integrated construction of GBA, and form a coordinated regional network system driven by the center, thereby improving urban network resilience;
(2)
It is essential to strengthen the axis support and enhance the strength of the engineering network connection. The findings hereinbefore have shown that geographic proximity has a significant impact on the improvement of network resilience (Table 7). Therefore, it is necessary to diminish the negative impact of distance on urban connections by building a rapid transportation network. In the future, it is important to build a modern comprehensive transportation system. Relying on the rapid transportation network with the high-speed railway, intercity railway, high-grade highway, as well as port groups and general aviation, it is essential to build a regional economic development axis and form a networked spatial pattern of efficient connection between major cities. Jiangmen City, Zhaoqing City, Guangzhou City, and Huizhou City should speed up the construction of transportation and become important functional nodes for connecting GBA with peripheral cities. It is imperative to give full play to the role of the Hong Kong–Zhuhai–Macao Bridge, build a rapid transportation network in GBA, and strive to achieve one-hour access to major cities in GBA. It is also important to strengthen the transportation links between under-developed cities and core cities, especially pay attention to improving the connectivity between urban public transportation systems, reduce the adverse impact of local transportation network failures on urban network resilience, and promote the various functions of passenger transport functions and the superposition of various types of transportation networks in GBA;
(3)
It is essential to focus on connecting the mainland with Hong Kong and Macao as well as the east and west sides of the Pearl River and improve the strength of the connection between information flow and capital flow. This study demonstrates a large gap in network resilience between the two sides of the Pearl River, which is consistent with the existing research [40]. Therefore, it is necessary to improve the connectivity of the west bank of the Pearl River, strengthen the spatial spillover effect of high-resilience areas on low-resilience areas, and avoid the isolated development of cities due to the huge spatial differences in network resilience, thereby achieving regional coordinated development and urban network resilience; and
(4)
Cities should work closely together in the construction of “the Belt and Road” in GBA. Differences in market development levels have a significant impact on the improvement of network resilience. It is imperative to deepen the cooperation between Guangdong, Hong Kong, and Macao, further optimize the investment and business environment of the nine Pearl River Delta cities, enhance the market integration in GBA, connect with the international high-standard market rules, accelerate the construction of a new open economy system, form an all-round open pattern, and jointly create new advantages in international economic and trade cooperation.

5.3. Limitations and Prospects

The network resilience topology established in the present study is a “static” evaluation method. The multi-dimensional “dynamic” evaluation of urban network resilience is a current challenge and an issue that merits more attention in the future. Due to the difficulty of collecting some data, this paper does not evaluate the long-term network resilience. However, as a large-scale space across political systems, the development of GBA is also affected by many fluctuating factors [41]. In the future, long-term series can be deeply explored to unravel the patterns behind. As the diverse elements of cities continue to emerge, it is essential to enrich the constituent elements of the comprehensive network in the future.
Structure and function are the two major aspects of urban or regional network resilience, which, basically, determine the various characteristics of the system, including resilience. Social network analysis may not be fully applicable to the functional perspective. Therefore, in the follow-up research, it may be interesting to delve into the functional perspective. The weighted stochastic block model (WSBM) is a good method [39,42], which may be attempted in future studies at the county level.

6. Conclusions

In the present study, based on previous studies on urban network resilience, we constructed a network resilience evaluation system composed of economic, social, and engineering networks to evaluate the network resilience of GBA, and applied social network analysis to explore the spatial characteristics and influencing factors of network resilience. The findings are as follows:
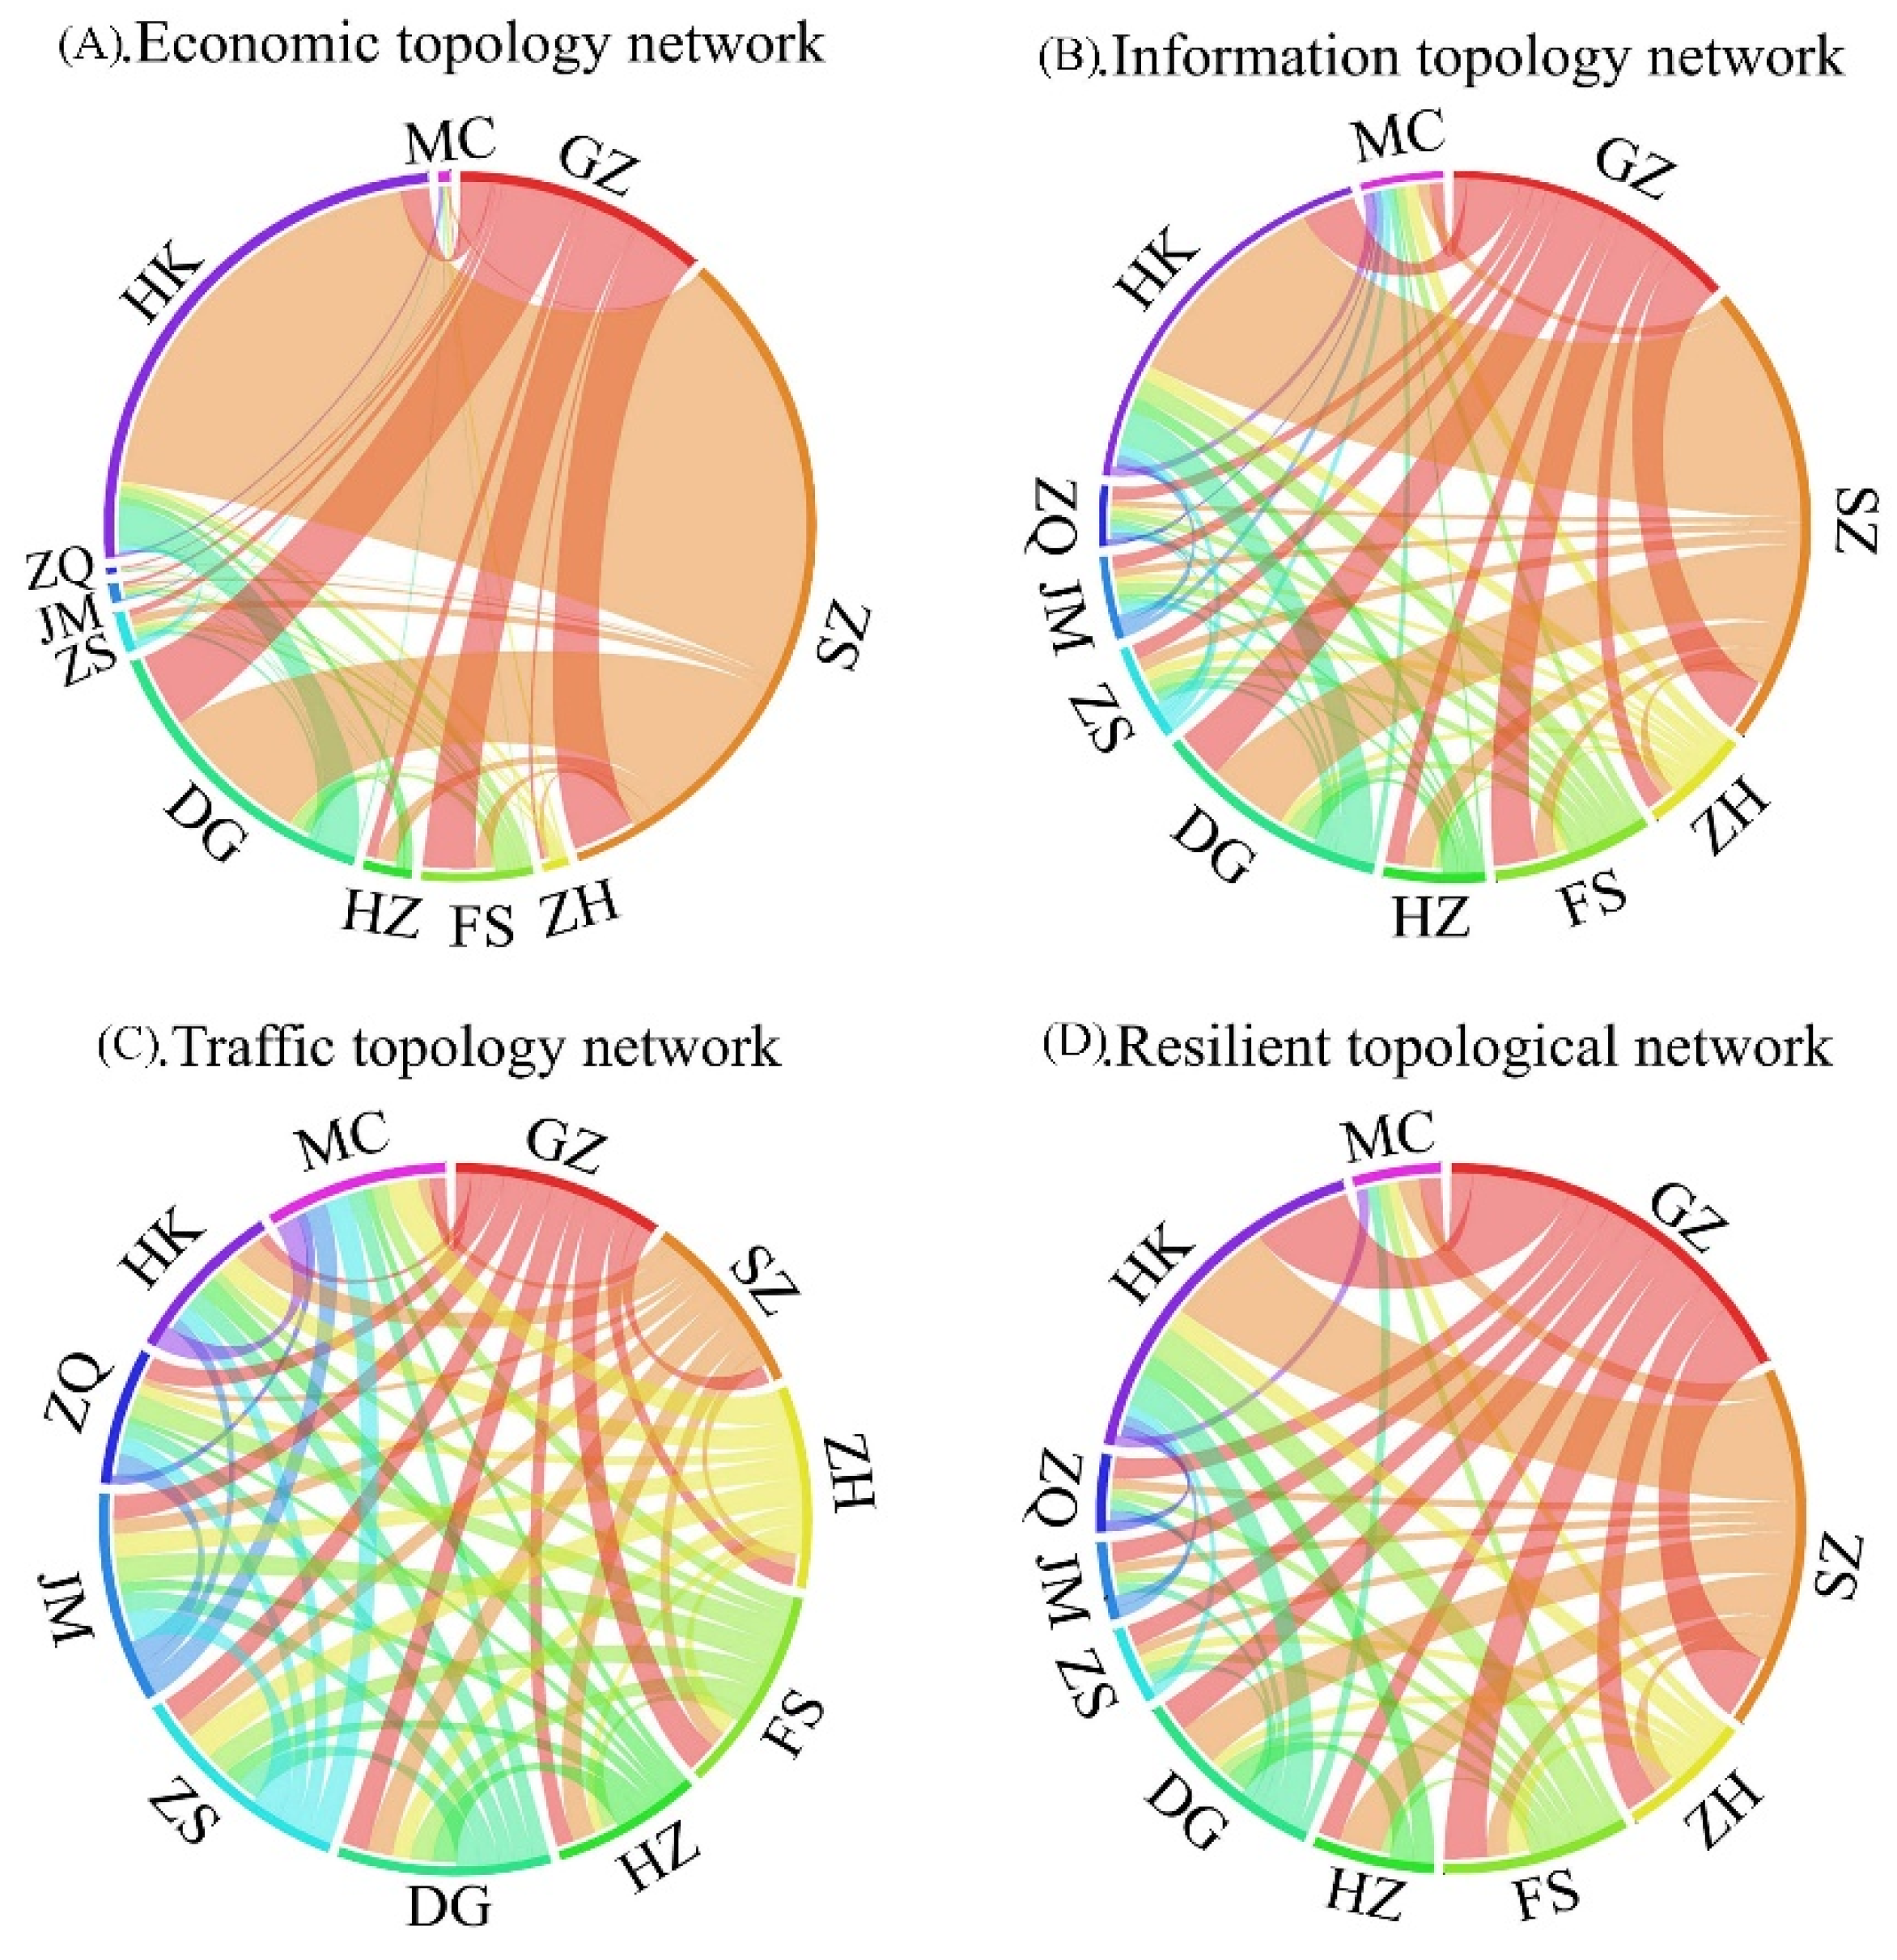
  • The regional difference was biggest in GBA’s economic network strength while smallest in its transportation network strength. The high-value areas of network resilience were centered on “Hong Kong–Shenzhen”, which accounted for about 42% of the total economic connection, with neighboring cities as the hinterland, forming a radial spatial connection pattern, and the east bank of the Pearl River was a strong connection axis of resilience. Cities with high levels of resilience connections were similar to cities with high levels of connections in subsystem networks. For example, the three subsystems of “Hong Kong–Shenzhen” network resilience were strongly connected, and the level of network resilience was relatively high (Figure 4). The east bank of the Pearl River was more developed than the west bank [39], which could cope with external impacts in the network connection between regions with stronger network resilience;
  • The hierarchical degree distribution and matching degree correlation can effectively represent the number of connections between cities and the correlation of connections between cities [21]. There was a positive correlation between the administrative level and the strength of network resilience (Figure 3 and Table 2). Guangzhou (1.07), Shenzhen (2.09), and Hong Kong (1.77) had higher weighted values and were located at the core of the economic, information, and network resilience of GBA, which could demonstrate stronger resilience to external shocks. Under the dual role of administrative power and their own radiation, provincial capitals and special administrative regions have become the leading cities in the region [43], and jointly improve the network resilience in surrounding areas. Therefore, it is necessary to promote the planning and construction of resilient cities to ensure the reliability of key regional nodes [44], thereby driving the healthy development of GBA’s network;
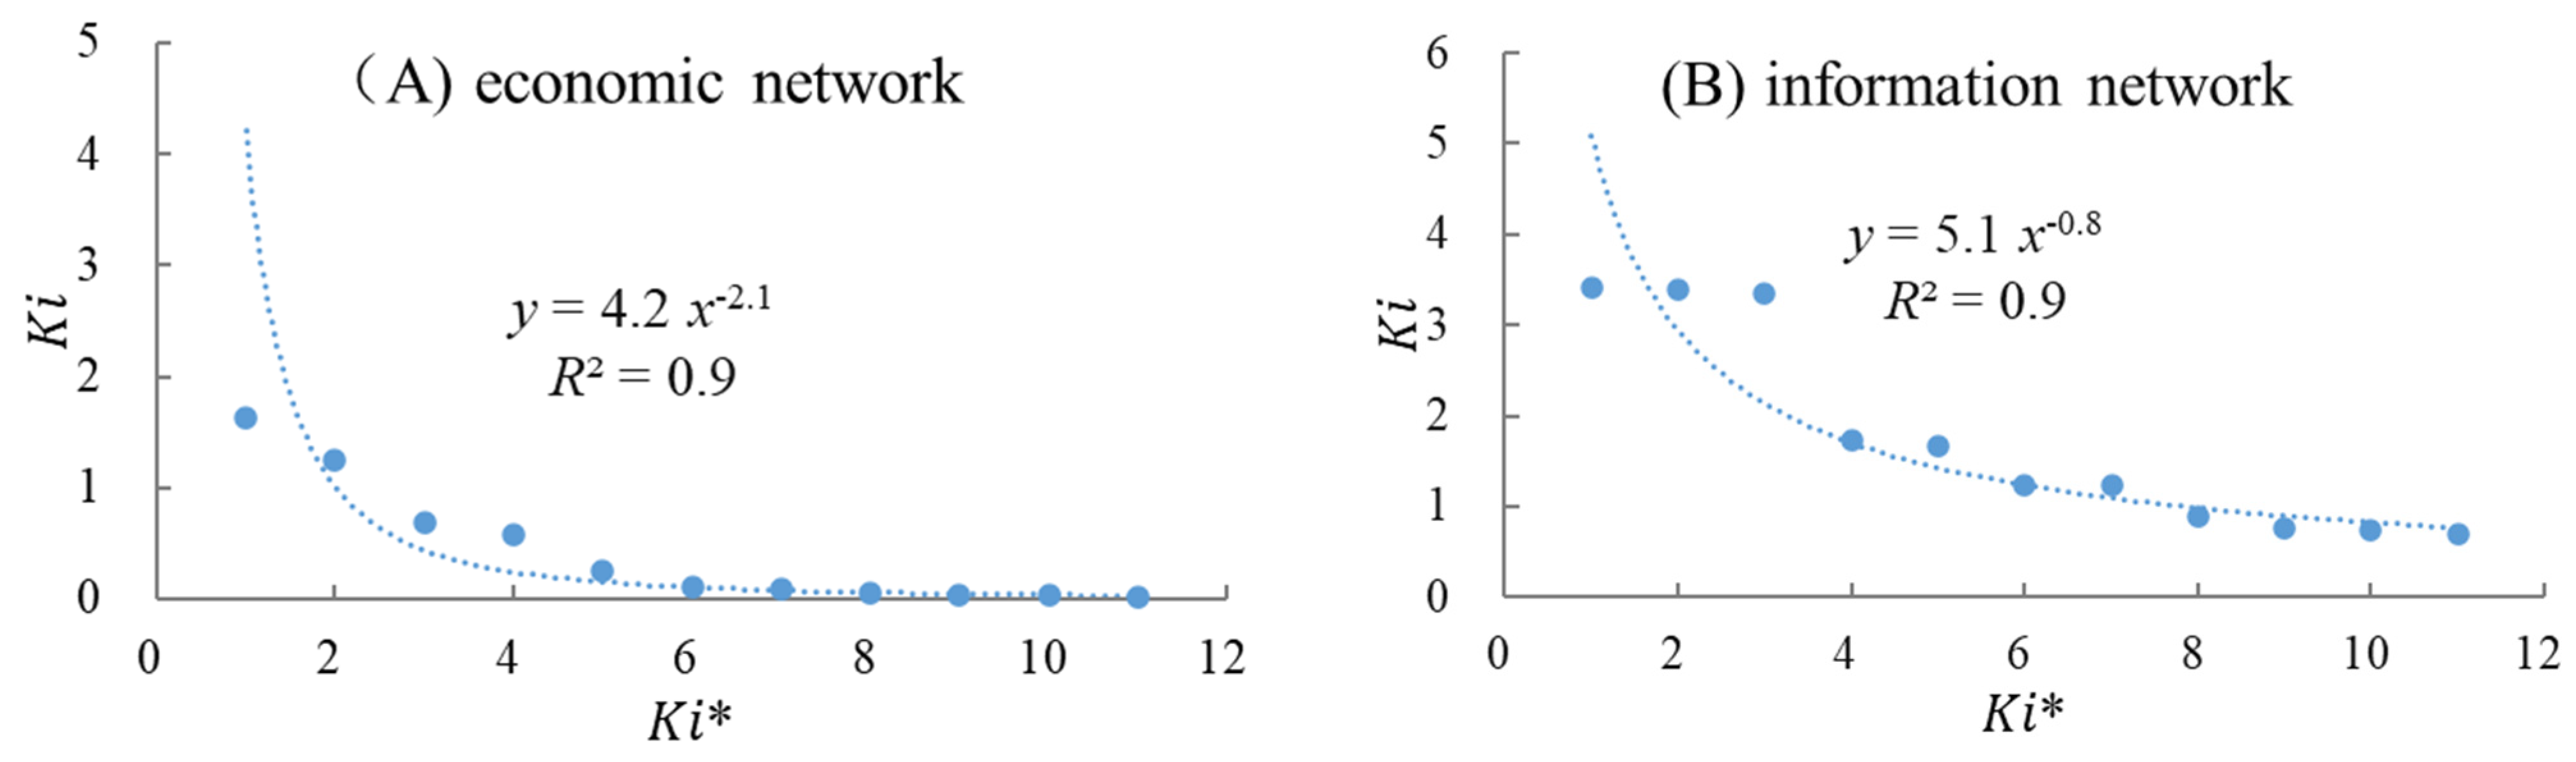
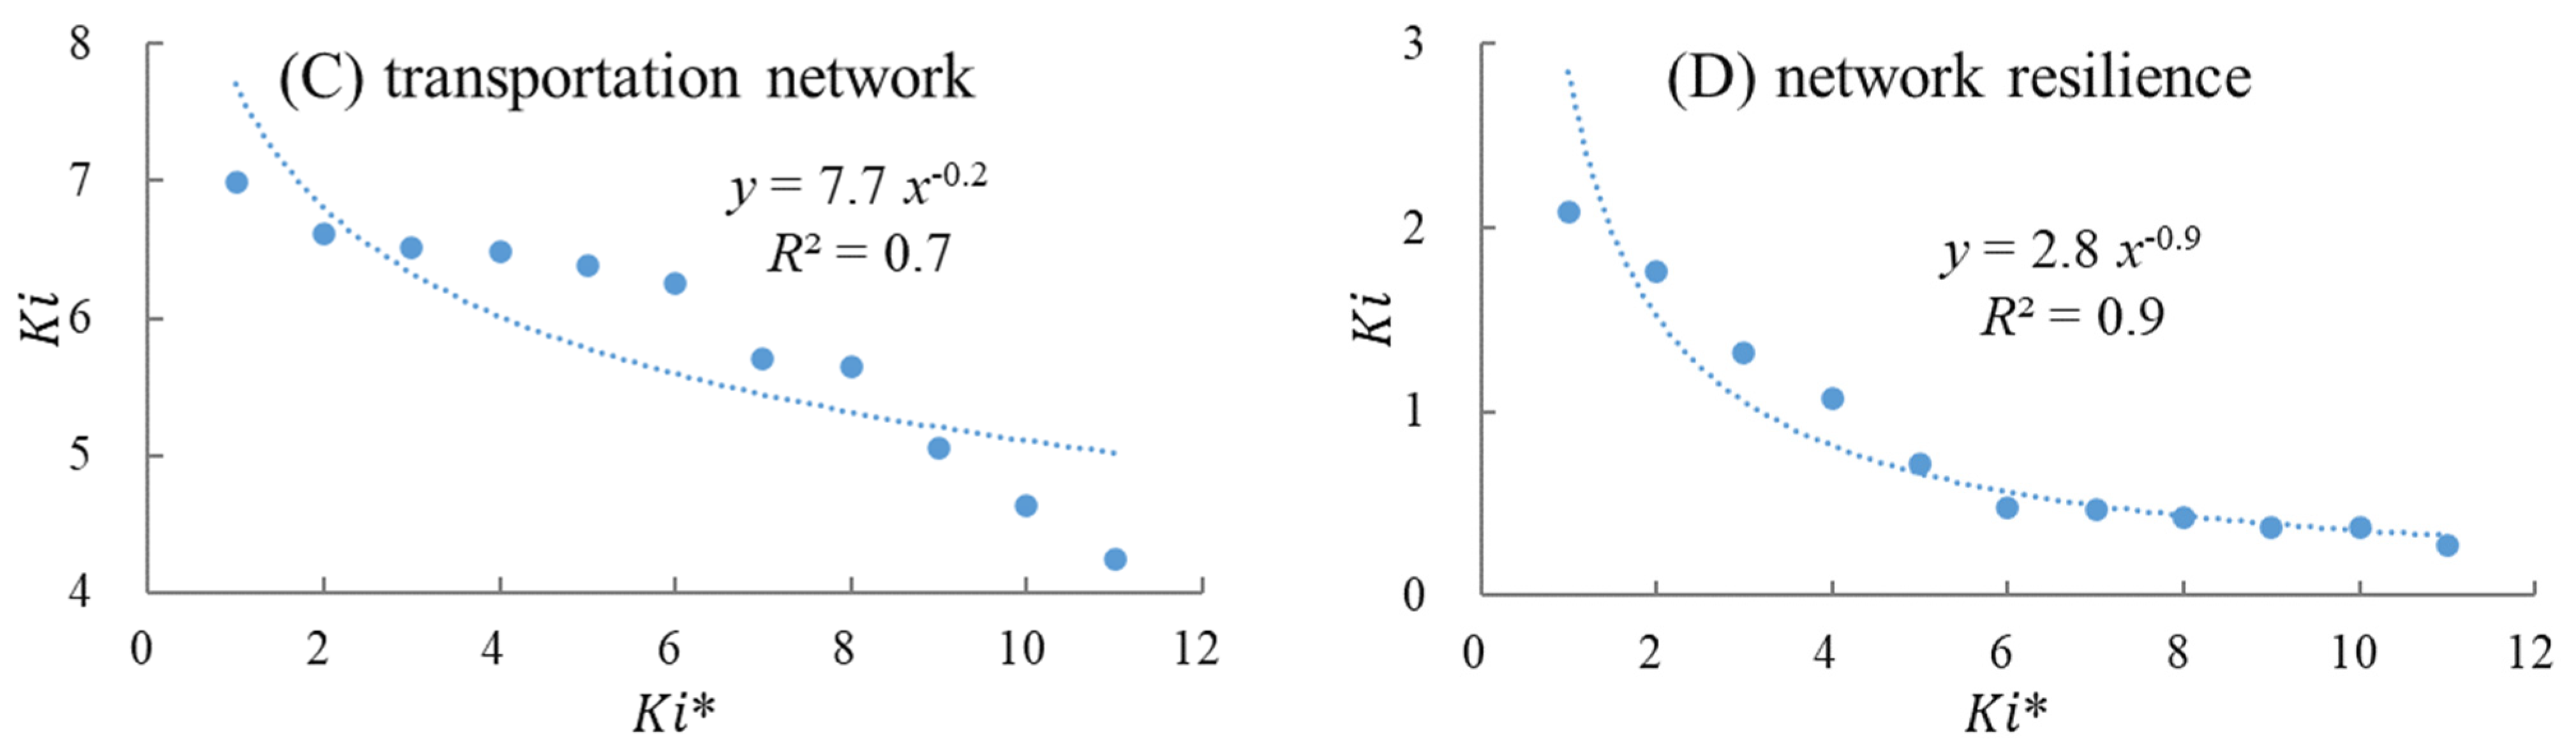
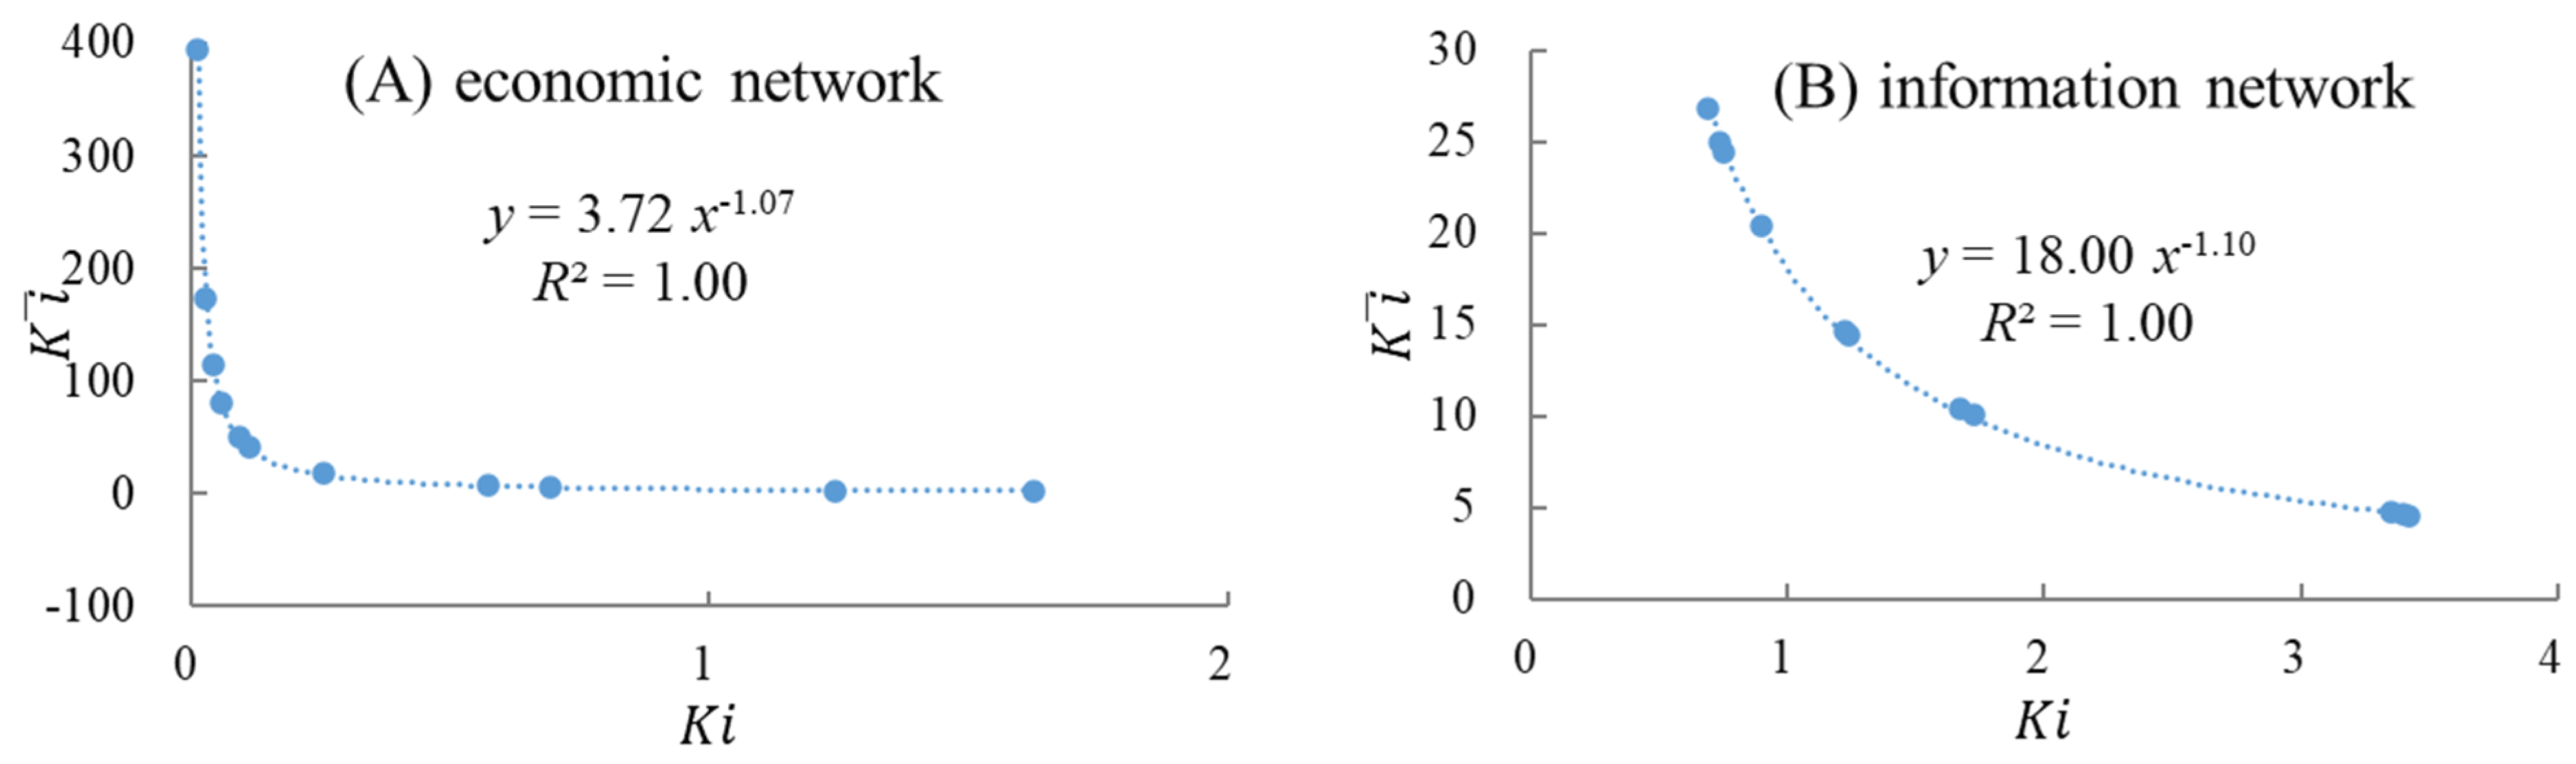
  • The slopes of the fitting power curves of the city degree distributions varied greatly. The slopes were between 0.2 and 2.1, with a significant hierarchy. The slopes of the curves from high to low are economy, resilience, information, and transportation network. The inter-regional hierarchy of the economic network was the most significant, and the status of core cities was the most prominent, which is consistent with Peng’s study [45]. Power curve fitting was performed on the weighted degree and adjacent weighted average degree of all city nodes in the network, and the network correlation coefficient was between 1.07 and 1.11. Network resilience and its subsystem networks were all heterogeneous. Among them, the economic network was the least heterogeneous with the simplest connection path, which may hinder the enhancement of network resilience. The connection path of network resilience was more heterogeneous and diversified than the subsystem network, which integrated the advantages of its subsystems and formed a complete network system;
  • There was an obvious core–edge structure in the network resilience of GBA, which is consistent with Wang et al.’s study [43]. However, with the development of globalization and regional integration policies, the development opportunities of the peripheral cities in the region will increase in the future. The core degrees of Shenzhen and Hong Kong were as high as 0.761 and 0.566, respectively, and the core degrees of Jiangmen and Zhaoqing in the absolute peripheral areas were less than 0.04. In this study, the resilience correlation network was divided into four blocks. There was a total of 36 associations, only four associations within the block, and 32 associations between the blocks. The block model analysis showed prominent spatial correlation and spillover effects of network resilience between blocks, and the spillover effect was characterized by a gradient transfer; and
  • Geographical proximity, economic development, urban agglomeration, and market development had a significant impact on the enhancement of network resilience. Geographical proximity and economic development were positively correlated with network resilience. Research by Guo et al. [44] also shows that the geographical distance had a greater impact on the overall resilience of China’s high-speed rail urban network. Differences in urban agglomeration levels and market development levels were negatively correlated with resilience networks.

Author Contributions

Conceptualization, J.S., X.W. and C.W.; methodology, J.S. and X.W.; software, J.S. and X.W.; validation, F.C.; writing—original draft preparation, J.S. and X.W.; writing—review and editing, H.L., C.W. and Y.M.; supervision, H.L., C.W. and Y.M.; and funding acquisition, C.W. and F.C. In addition, J.S. and X.W. have contributed equally to this work and share first authorship. All authors have read and agreed to the published version of the manuscript.

Funding

This study was funded by the National Social Science Foundation of China (Grant No. 20BJY070) and the Social Science Planning and Research Project of Shandong Province (Grant No. 20BJJJ06).

Institutional Review Board Statement

Not applicable.

Informed Consent Statement

Not applicable.

Data Availability Statement

The data presented in this study are available on request from the corresponding author. The data are not publicly available because research is ongoing.

Conflicts of Interest

The authors declare that the research was conducted in the absence of any commercial or financial relationships that could be construed as a potential conflict of interest.

References

  1. Pan, F.H.; Fang, C.; Li, X.D. The Progress and Prospect of Research on Chinese City Network. Sci. Geogr. Sin. 2019, 39, 1093–1101. [Google Scholar]
  2. Taylor, P.J.; Catalano, G.; Walker, D.R.F. Measurement of the world city network. Urban Stud. 2002, 39, 2367–2376. [Google Scholar] [CrossRef]
  3. Shi, J.L.; Wang, X.; Ci, F.Y.; Liu, K. Spatiotemporal Characteristics and Patterns of the COVID-19 Pandemic in China: An Empirical Study Based on 413 Cities or Regions. Int. J. Environ. Res. Public Health 2022, 19, 2070. [Google Scholar] [CrossRef]
  4. Liu, Y.; Wang, Y.; Li, H. Industrial Development of World-class Bay Areas and Its Enlightenment to the Guangdong-Hong Kong-Macao Greater Bay Area. Bull. Chin. Acad. Sci. 2020, 35, 312–321. [Google Scholar]
  5. Li, M.; Guo, W.; Guo, R.; He, B.; Li, Z.; Li, X.; Liu, W.; Fan, Y. Urban Network Spatial Connection and Structure in China Based on Railway Passenger Flow Big Data. Land 2022, 11, 225. [Google Scholar] [CrossRef]
  6. Nehzati, T.; Dreyer, H.C.; Strandhagen, J.O. Production network flexibility: Case study of Norwegian diary production network. Adv. Manuf. 2015, 3, 151–165. [Google Scholar] [CrossRef]
  7. Wiedmer, R.; Griffis, S.E. Structural characteristics of complex supply chain networks. J. Bus. Logist. 2021, 42, 264–290. [Google Scholar] [CrossRef]
  8. Wu, Z.C.; Zhang, L.Y.; Huang, S.H. Spatial structure and characteristics of tourism economic connections in Guangdong-Hong Kong-Macao Greater Bay. Area Geogr. Res. 2020, 39, 1370–1385. [Google Scholar]
  9. Rosvall, M.; Trusina, A.; Minnhagen, P.; Sneppen, K. Networks and cities: An information perspective. Phys. Rev. Lett. 2005, 94, 028701. [Google Scholar] [CrossRef] [Green Version]
  10. Qiu, J.J.; Liu, Y.H.; Chen, H.R.; Gao, F. Urban Network Structure of Guangdong-Hong Kong-Macao Greater Bay Area with the View of Space of Flows:A Comparison between Information Flow and Transportation Flow. Econ. Geogr. 2019, 39, 7–15. [Google Scholar]
  11. Liu, X.Y. Structure and division of urban innovation network in the Guangdong-Hong Kong-Macao Greater Bay Area. Sci. Geogr. Sin. 2020, 40, 874–881. [Google Scholar]
  12. Najafi-Tavani, S.; Najafi-Tavani, Z.; Naude, P.; Oghazi, P.; Zeynaloo, E. How collaborative innovation networks affect new product performance: Product innovation capability, process innovation capability, and absorptive capacity. Ind. Mark. Manag. 2018, 73, 193–205. [Google Scholar] [CrossRef]
  13. Xiong, Y.; Hang, L. Spatio-temporal evolution of urban network in the Guangdong-Hong Kong-Macao Greater Bay Area—Based on listed company organization relations. World Reg. Stud. 2019, 28, 83–94. [Google Scholar]
  14. Holling, C.S. Resilience and stability of ecological systems. Annu. Rev. Ecol. Syst. 1973, 4, 1–23. [Google Scholar] [CrossRef] [Green Version]
  15. Li, Y.; Chen, W.; Sun, Y. New reflections on the analysis of regional resilience in geographical sciences from a relational-dynamic perspective. Area Geogr. Res. 2019, 38, 1694–1704. [Google Scholar]
  16. Wei, Y.; Xiu, C.L. Study on the concept and analytical framework of city network resilience. Prog. Geogr. 2020, 39, 488–502. [Google Scholar] [CrossRef]
  17. Li, R.Y.; Dong, Q.; Jin, C.; Kang, R. A New Resilience Measure for Supply Chain Networks. Sustainability 2017, 9, 144. [Google Scholar] [CrossRef] [Green Version]
  18. Tachaudomdach, S.; Upayokin, A.; Kronprasert, N.; Arunotayanun, K. Quantifying Road-Network Robustness toward Flood-Resilient Transportation Systems. Sustainability 2021, 13, 3172. [Google Scholar] [CrossRef]
  19. Aldrich, D.P. Building Resilience: Social Capital in Post-Disaster Recovery; University of Chicago Press: Chicago, IL, USA, 2012. [Google Scholar]
  20. Jung, K. Sources of Organizational Resilience for Sustainable Communities: An Institutional Collective Action Perspective. Sustainability 2017, 9, 1141. [Google Scholar] [CrossRef] [Green Version]
  21. Peng, C.; Lin, Y.Z.; Gu, C.L. Evaluation and optimization strategy of city network structural resilience in the middle reaches of Yangtze River. Area Geogr. Res. 2018, 37, 1193–1207. [Google Scholar]
  22. Wei, S.M. Study on the Resilience Measurement of Network Structure of Cities at Prefecture Level and above in China; Northwest Normal University: Lanzhou, China, 2020. [Google Scholar]
  23. Lin, Y.Z. Research on Evaluation of Regional Network’s Structural Resilience and Its Spatial Optimization—A Case Study of The Urban Agglomeration in the Middle Reaches of the Yangtze River; Huazhong University of Science & Technology: Wuhan, China, 2017. [Google Scholar]
  24. Peng, C.; Chen, S.Y.; Wang, B.Q. Analyzing City Network’s Structural Resilience Under Disruption Scenarios: A Case Study of Passenger Transport Network in the Middle Reaches of Yangtze River. Econ. Geogr. 2019, 39, 68–76. [Google Scholar]
  25. Xie, Y.S.; Wang, C.J.; Han, Z.L.; Liu, S.Z. Structural resilience evolution of multiple urban networks in the Harbin-Dalian urban belt. Prog. Geogr. 2020, 39, 1619–1631. [Google Scholar] [CrossRef]
  26. Zou, L.; Zeng, G.; Cao, X.Z.; Chen, S.Y. Research on Spatial Characteristic of the Economic Relation Network of Yangtze Economic Zone. Econ. Geogr. 2015, 35, 1–7. [Google Scholar]
  27. Qin, Q.; Wu, L.; Li, F.; Chen, S.K.; Zhang, D.; Chen, X.P. A social-network-based study on geo-relations in Southeast Asia. Acta Geogr. Sin. 2018, 73, 2014–2030. [Google Scholar]
  28. Li, H.F.; Wei, S.Q.; Chen, S.L. An Analysis on the Network Structure and Formation Causes of Regional Economic Connection in the West Coast of Taiwan Straits Economic Zone. Econ. Geogr. 2017, 37, 63–70, 78. [Google Scholar]
  29. Feng, Y.; Hou, M.Y.; Yao, S.B. Structural characteristics and formation mechanism of spatial correlation network of grain production in China. Acta Geogr. Sin. 2020, 75, 2380–2395. [Google Scholar]
  30. Barnett, G.A. Encyclopedia of Social Networks; SAGE Publications: Thousand Oaks, CA, USA, 2011; pp. 523–526. [Google Scholar]
  31. Zhang, P.; Yu, W.; Zhang, Y.W. Spatiotemporal differentiation of urban resilience and its influencing factors in Shandong Province. Urban Probl. 2018, 9, 27–34. [Google Scholar]
  32. Zhang, M.D.; Feng, X.Q. Comprehensive evaluation of urban resilience in China. Urban Probl. 2018, 10, 27–36. [Google Scholar]
  33. Zhu, J.H.; Sun, H.X. Research on Spatial—Temporal Evolution and Influencing Factors of Urban Resilience of China’s Three Metropolitan Agglomerations. Soft Sci. 2020, 34, 72–79. [Google Scholar]
  34. Gu, H.Y.; Shen, T.Y. Spatial evolution characteristics and driving forces of Chinese highly educated talents. Acta Geogr. Sin. 2021, 76, 326–340. [Google Scholar]
  35. Gu, H.Y.; Meng, X.; Shen, T.Y.; Wen, L. China’s highly educated talents in 2015: Patterns, determinants and spatial spillover effects. Appl. Spat. Anal. Policy 2020, 13, 631–648. [Google Scholar] [CrossRef]
  36. Zhang, Y.; Zhang, A.; Wang, J.E. Exploring the roles of high-speed train, air and coach services in the spread of COVID-19 in China. Transp. Policy 2020, 94, 34–42. [Google Scholar] [CrossRef] [PubMed]
  37. Cheng, Y.; Liu, H.M.; Wang, S.B.; Cui, X.G.; Li, Q.R. Global action on SDGs: Policy review and outlook in a post-pandemic Era. Sustainability 2021, 13, 6461. [Google Scholar] [CrossRef]
  38. Fang, C.L.; Liu, H.M.; Wang, S.J. The coupling curve between urbanization and the eco-environment: China’s urban agglomeration as a case study. Ecol. Indic. 2021, 130, 108107. [Google Scholar] [CrossRef]
  39. Zhang, W.J.; Fang, C.Y.; Zhu, J.C. Measuring megaregional structure in the Pearl River Delta by mobile phone signaling data: A complex network approach. Cities 2020, 104, 102809. [Google Scholar] [CrossRef]
  40. Cao, X.; Ouyang, S.; Yang, W.; Luo, Y.; Li, B.; Liu, D. Transport Accessibility and Spatial Connections of Cities in the Guangdong-Hong Kong-Macao Greater Bay Area. Chin. Geogr. Sci. 2019, 29, 820–833. [Google Scholar] [CrossRef] [Green Version]
  41. Liu, Y.; Wang, Y.; Yang, Y.; Ma, L. Regional integration and interaction of the Guangdong-Hong Kong-Macao Greater Bay Area. Acta Geogr. Sin. 2019, 74, 2455–2466. [Google Scholar]
  42. Zhang, W.J.; Thill, J.C. Mesoscale Structures in World City Networks. Ann. Am. Assoc. Geogr. 2019, 109, 887–908. [Google Scholar] [CrossRef]
  43. Wang, S.J.; Gao, S.; Wang, Y.Q. Spatial structure of the urban agglomeration based on space of flows: The study of the Pearl River Delta. Area Geogr. Res. 2019, 38, 1849–1861. [Google Scholar]
  44. Guo, W.D.; Zhong, Y.X.; Feng, X.H. Research on the resilience of China’s high-speed rail urban network from the perspective of vulnerability. Geogr. Res. 2022, 41, 1371–1387. [Google Scholar]
  45. Peng, F.M. Economic Spatial Connection and Spatial Structure of Guangdong-Hong Kong-Macao Greater Bay and the Surrounding Area Cities—An Empirical Analysis Based on Improved Gravity Model and Social Network Analysis. Econ. Geogr. 2017, 37, 57–64. [Google Scholar]
Figure 1. Network resilience evaluation framework.
Sustainability 14 08005 g001
Figure 2. The location and the map of GBA. Note: This map is based on the standard map (No. GS (2019) 4342) downloaded from the standard map services of the National Bureau of Surveying and Mapping, without alterations to the base map.
Sustainability 14 08005 g002
Figure 3. Connection strength of GBA’s network resilience and network resilience of various subsystems. Note: This map is based on the standard map (No. GS (2019) 4342) downloaded from the standard map services of the National Bureau of Surveying and Mapping, without alterations to the base map.
Sustainability 14 08005 g003
Figure 4. Topological connection strength of network resilience and various subsystems in GBA. Note: GZ—Guangzhou; SZ—Shenzhen; ZH—Zhuhai; FS—Foshan; HZ—Huizhou; DG—Dongguan; ZS—Zhongshan; JM—Jiangmen; ZQ—Zhaoqing; HK—Hong Kong; and MC—Macao.
Sustainability 14 08005 g004
Figure 5. The distribution of weighted degrees of network resilience and various subsystems in GBA.
Sustainability 14 08005 g005aSustainability 14 08005 g005b
Figure 6. The correlation of weighted degrees of network resilience and various subsystems in GBA.
Sustainability 14 08005 g006aSustainability 14 08005 g006b
Table 1. Network resilience evaluation system.
ObjectiveCriteriaIndicatorCalculation Method
Network
resilience
EconomyEconomic
connection
network
The strength of the economic connection between cities is measured by the modified gravity model, according to the following Equation (1) [26].
SocietyInformation
connection
network
The Baidu Index is a data sharing platform based on internet user behavior (https://index.baidu.com/v2/main/index.html#/help?anchor=pdesc accessed on 20 May 2022). The search index in the Baidu Index indicates the degree of internet users’ attention to keyword searches and changes within a time period, and directly reflects the degree of attention and information exchange between regions. By searching “keywords” and “region” in the Baidu Index, the daily average index of various regions from January 1 to 31 December 2019 is obtained and used to construct an information connection network between two regions.
EngineeringTraffic
connection
network
According to the availability and representativeness of the data, we calculate the shortest highway mileage between two regions using Baidu Map, thereby constructing a traffic connection network.
Table 2. The weighted degrees of network resilience and various subsystems in GBA.
CityWeighted Degree of Economic NetworkWeighted Degree of
Information Network
Weighted Degree of Transportation NetworkWeighted Degree of Network Resilience
Guangzhou0.5741.7246.4811.070
Shenzhen1.6263.4236.9872.086
Zhuhai0.0580.8945.6420.430
Foshan0.2541.6746.3830.719
Huizhou0.1111.2386.2520.477
Dongguan0.6933.3526.5191.316
Zhongshan0.0921.2255.7050.471
Jiangmen0.0410.7525.0510.373
Zhaoqing0.0120.6884.2410.274
Hong Kong1.2423.3986.6091.766
Macao0.0270.7354.6330.369
Table 3. Ranking of the coreness of network resilience in GBA.
RankingCityCoreness
1Shenzhen0.761
2Hong Kong0.566
3Dongguan0.206
4Guangzhou0.189
5Foshan0.085
6Huizhou0.079
7Zhuhai0.055
8Zhongshan0.048
9Macao0.044
10Jiangmen0.039
11Zhaoqing0.028
Table 4. The spillover effect of network resilience between different blocks.
Block 1Block 2Block 3Block 4No. of
Members
No. of Receiving
Relations
No. of Sending
Relations
Expected
Internal
Relationship Ratio (%)
Actual
Internal
Relationship Ratio (%)
Intra-BlockInter-BlockIntra-BlockInter-Block
Block 12501226261025
Block 25201326261025
Block 300003000000
Block 411003020200
Table 5. Density and image matrices of different blocks.
Density MatrixImage Matrix
Block 1Block 2Block 3Block 4Block 1Block 2Block 3Block 4
Block 10.2420.3400.0640.0821100
Block 20.3400.0980.0370.0391100
Block 30.0640.0370.0460.0310000
Block 40.0820.0390.0310.0400000
Table 6. First regression results of influencing factors to network resilience.
Unstandardized
Regression
Coefficient
Standardized
Regression
Coefficient
Significance
Probability
Value
Probability 1Probability 2
Intercept0.0950.000
D i s 0.1060.3420.0000.0001.000
G d p 0.00001.0810.0120.0120.988
P o p 0.0000−0.8720.0110.9890.011
R o a −0.001−0.0470.4190.5810.419
C o n −0.027−0.3310.0760.9240.076
F i n 0.0050.0010.5170.5170.485
E d u 0.0010.0000.0000.0001.000
O p e −0.003−0.0120.5280.4730.528
Table 7. Stepwise regression results of influencing factors to network resilience.
Unstandardized
Regression
Coefficient
Standardized
Regression
Coefficient
Significance
Probability
Value
Probability 1Probability 2
Intercept0.0880.000
D i s 0.1060.3430.0010.0010.999
G d p 0.0001.0980.0070.0070.993
P o p 0.000−0.8650.0180.9830.018
C o n −0.029−0.3580.0370.9640.037
Publisher’s Note: MDPI stays neutral with regard to jurisdictional claims in published maps and institutional affiliations.

