1. Introduction
Modern equipment installation, new control systems, and supervision techniques are essential subjects in transforming electrical substations [
1]. Therefore, the IEC (International Electrotechnical Commission) 61850 standardizes procedures to perform interoperability of different devices, at the same time leads to the implementation of different communication protocols and elements that reduce the number of electrical connections and data transfer through communication networks [
2,
3]. In addition, new technology is implemented to reduce electrical risk and costs in an electrical substation, benefiting users and companies [
4,
5].
However, some relevant studies must be conducted, such as the performance of electrical protections in digital substations and traffic in the communication network [
4]. Additionally, the process bus implementation in digital substations makes the issues more evident. Furthermore, protection and control equipment requires the conversion of analog signals from Current Transformers (CTs) and Potential Transformers (PTs) to Sampled Values (SVs) [
6,
7].
The literature shows that authors have focused on testing new equipment, defining the importance of interoperability, and evaluating the performance of transforming from conventional to digital substation. For instance, the authors of [
8] presented changes that occur when digitizing signals with the Merging Units (MUs) in a digital substation compared to a conventional hardwired protection scheme; they also reviewed the operation risk of electrical protections due to signal digitalization and the use of the multi-vendor equipment. In [
9], hardware in the loop was used to test and validate protection schemes by implementing IEC 61850 with Manufacturing Message Specification (MMS) protocol and Generic Object-oriented Substation Event (GOOSE). The authors of [
10] expressed that complying with the IEC 61850 standard does not imply fulfilling performance and interoperability with devices in their different functionalities; they made evaluations under test scenarios with GOOSE messages and MMS protocol. In [
11], the authors pointed out the importance of interoperability between devices that are part of digital substations and the difficulties of poor integration. In [
12], the authors employed an optimized network engineering tool to evaluate the performance of an Ethernet-based network and to validate the overall process bus design requirement of a high-voltage non-conventional instrument transformer. Furthermore, a detailed simulation analysis investigated the impact of communication delay on the substation automation system during peak traffic. In [
13], the authors presented a model to carry out an economic analysis of the process bus implementation, highlighting the importance of this technology and the tendency to implement it in electrical systems.
In addition, the authors of [
14] presented a method and scenario for interoperability and protection performance tests and automation of substations with IEC 61850; they highlighted the importance of evaluating the performances of interoperable protection schemes. In [
15], the authors emphasized the imminent technological renewal with Intelligent Electronic Devices (IEDs) and MUs and the need to guarantee an adequate performance of the protections based on their tests, validating the interoperability between devices. In [
16], the authors tested MUs, understanding the importance of evaluating the performance of electrical protections; the performance of MUs from different manufacturers and the importance of time synchronization in the digital substations are expressed. In [
17], the authors discussed the lack of knowledge of operating protection in a substation with a process bus and the need for a test environment. The results suggest that the protection passed the tests and that several aspects of the IEC 61850 standard may be very conservative. In [
18], the authors highlighted the need to validate the compatibility and performance of MUs and IEDs; therefore, they test distance protection considering communications redundancy.
Furthermore, in [
19], the authors highlighted the importance of evaluating interoperability and performance in digital substations, considering the virtual test model, the substation architecture, and the manufacturer configuration tools. They proposed a virtual model and evaluate it according to these aspects. In addition, they encountered incompatibility problems and management difficulties. In [
20], the authors highlighted the importance of interoperability and the problems generated when implementing digital substations; they developed a multi-vendor interoperable testbed to evaluate the performance of protections and other equipment used in the electrical infrastructure. In [
21], the authors implemented a process bus, GOOSE messages, and SVs for the protection relays; they examine GOOSE messages and the performance of protection relays.
In [
22], the study focused on the performance of the communication schemes, the simulated bandwidth, and the time delays generated because of data traffic volume. This information could be used to evaluate the protection performance because message encoding from the publishers and subscribers, and transit in the communication network, must be validated according to standards. Additionally, in [
23], the study highlighted the importance of identifying the existence of time lags for protections in digital substations with interoperable infrastructure. All the infrastructure used in the CTEEP (Companhia de Transmissão de Energía Elétrica Paulista) pilot was supplied by the manufacturer GE (General Electric) company. From these results, it is clear the necessity to consider the impact of interoperability on the performance of these systems.
The authors of [
24] presented a performance tests in a distance protection with a Brazilian simulation tool, comparing conventional and digital relays, but without interoperability. In [
25], the authors focused on the impact that the process bus has on the performance of the protections; a test architecture is defined, times are measured, and some considerations are obtained when implementing the process bus, considering the sampling time of the signals. In [
26], the authors identified relevant factors for implementing an interoperable process bus in a digital substation, highlighting the evaluation of redundancy in communications with Parallel Redundancy Protocol (PRP), the performance of GOOSE messaging and SV tests, and identifying risk of sampling associated with time synchronization.
Signal digitization, transmission, reception, and decoding have generated great uncertainty in electrical companies because of the process bus implementation in electrical substations [
27]. Thus, implementing digital substations with a process bus has a slow growth compared to the actual number of substations. Therefore, this paper focuses on designing a test scheme to evaluate the response time in electrical protection relays operating with SV in a digital substation. In addition, the relays were set up with the instantaneous overcurrent protection function, considering the same pickup currents when testing different fault current levels.
According to the literature reviewed, this paper considers the following contributions:
This work characterizes the main components of a digital substation with a process bus, considering the interoperability of the electrical substation;
A test scheme for electrical protections operating with the multi-vendor process bus is presented in the paper;
The response times of conventional protection relay and digital protection relay operating with the multi-vendor process bus are compared;
The protection scheme is evaluated considering the response times at three levels of the digital substation: physical trip in the protection relay, physical trip in digital MU, and GOOSE messages in the communication network.
The rest of the paper is structured into three more sections.
Section 2 describes the materials and methods where the test scheme diagram and the complete characteristics of the equipment are presented.
Section 3 shows the results obtained from the tests and the analysis. Finally, based on the results, the corresponding conclusions, recommendations, and future work are included in the last section of this document.
2. Materials and Methods
This section presents the materials and methods used in the research. The section considers the test scheme with the evaluation steps, the characteristics of the equipment, the variables, and the parameters used for the experiment.
2.1. Scheme for the Experiment
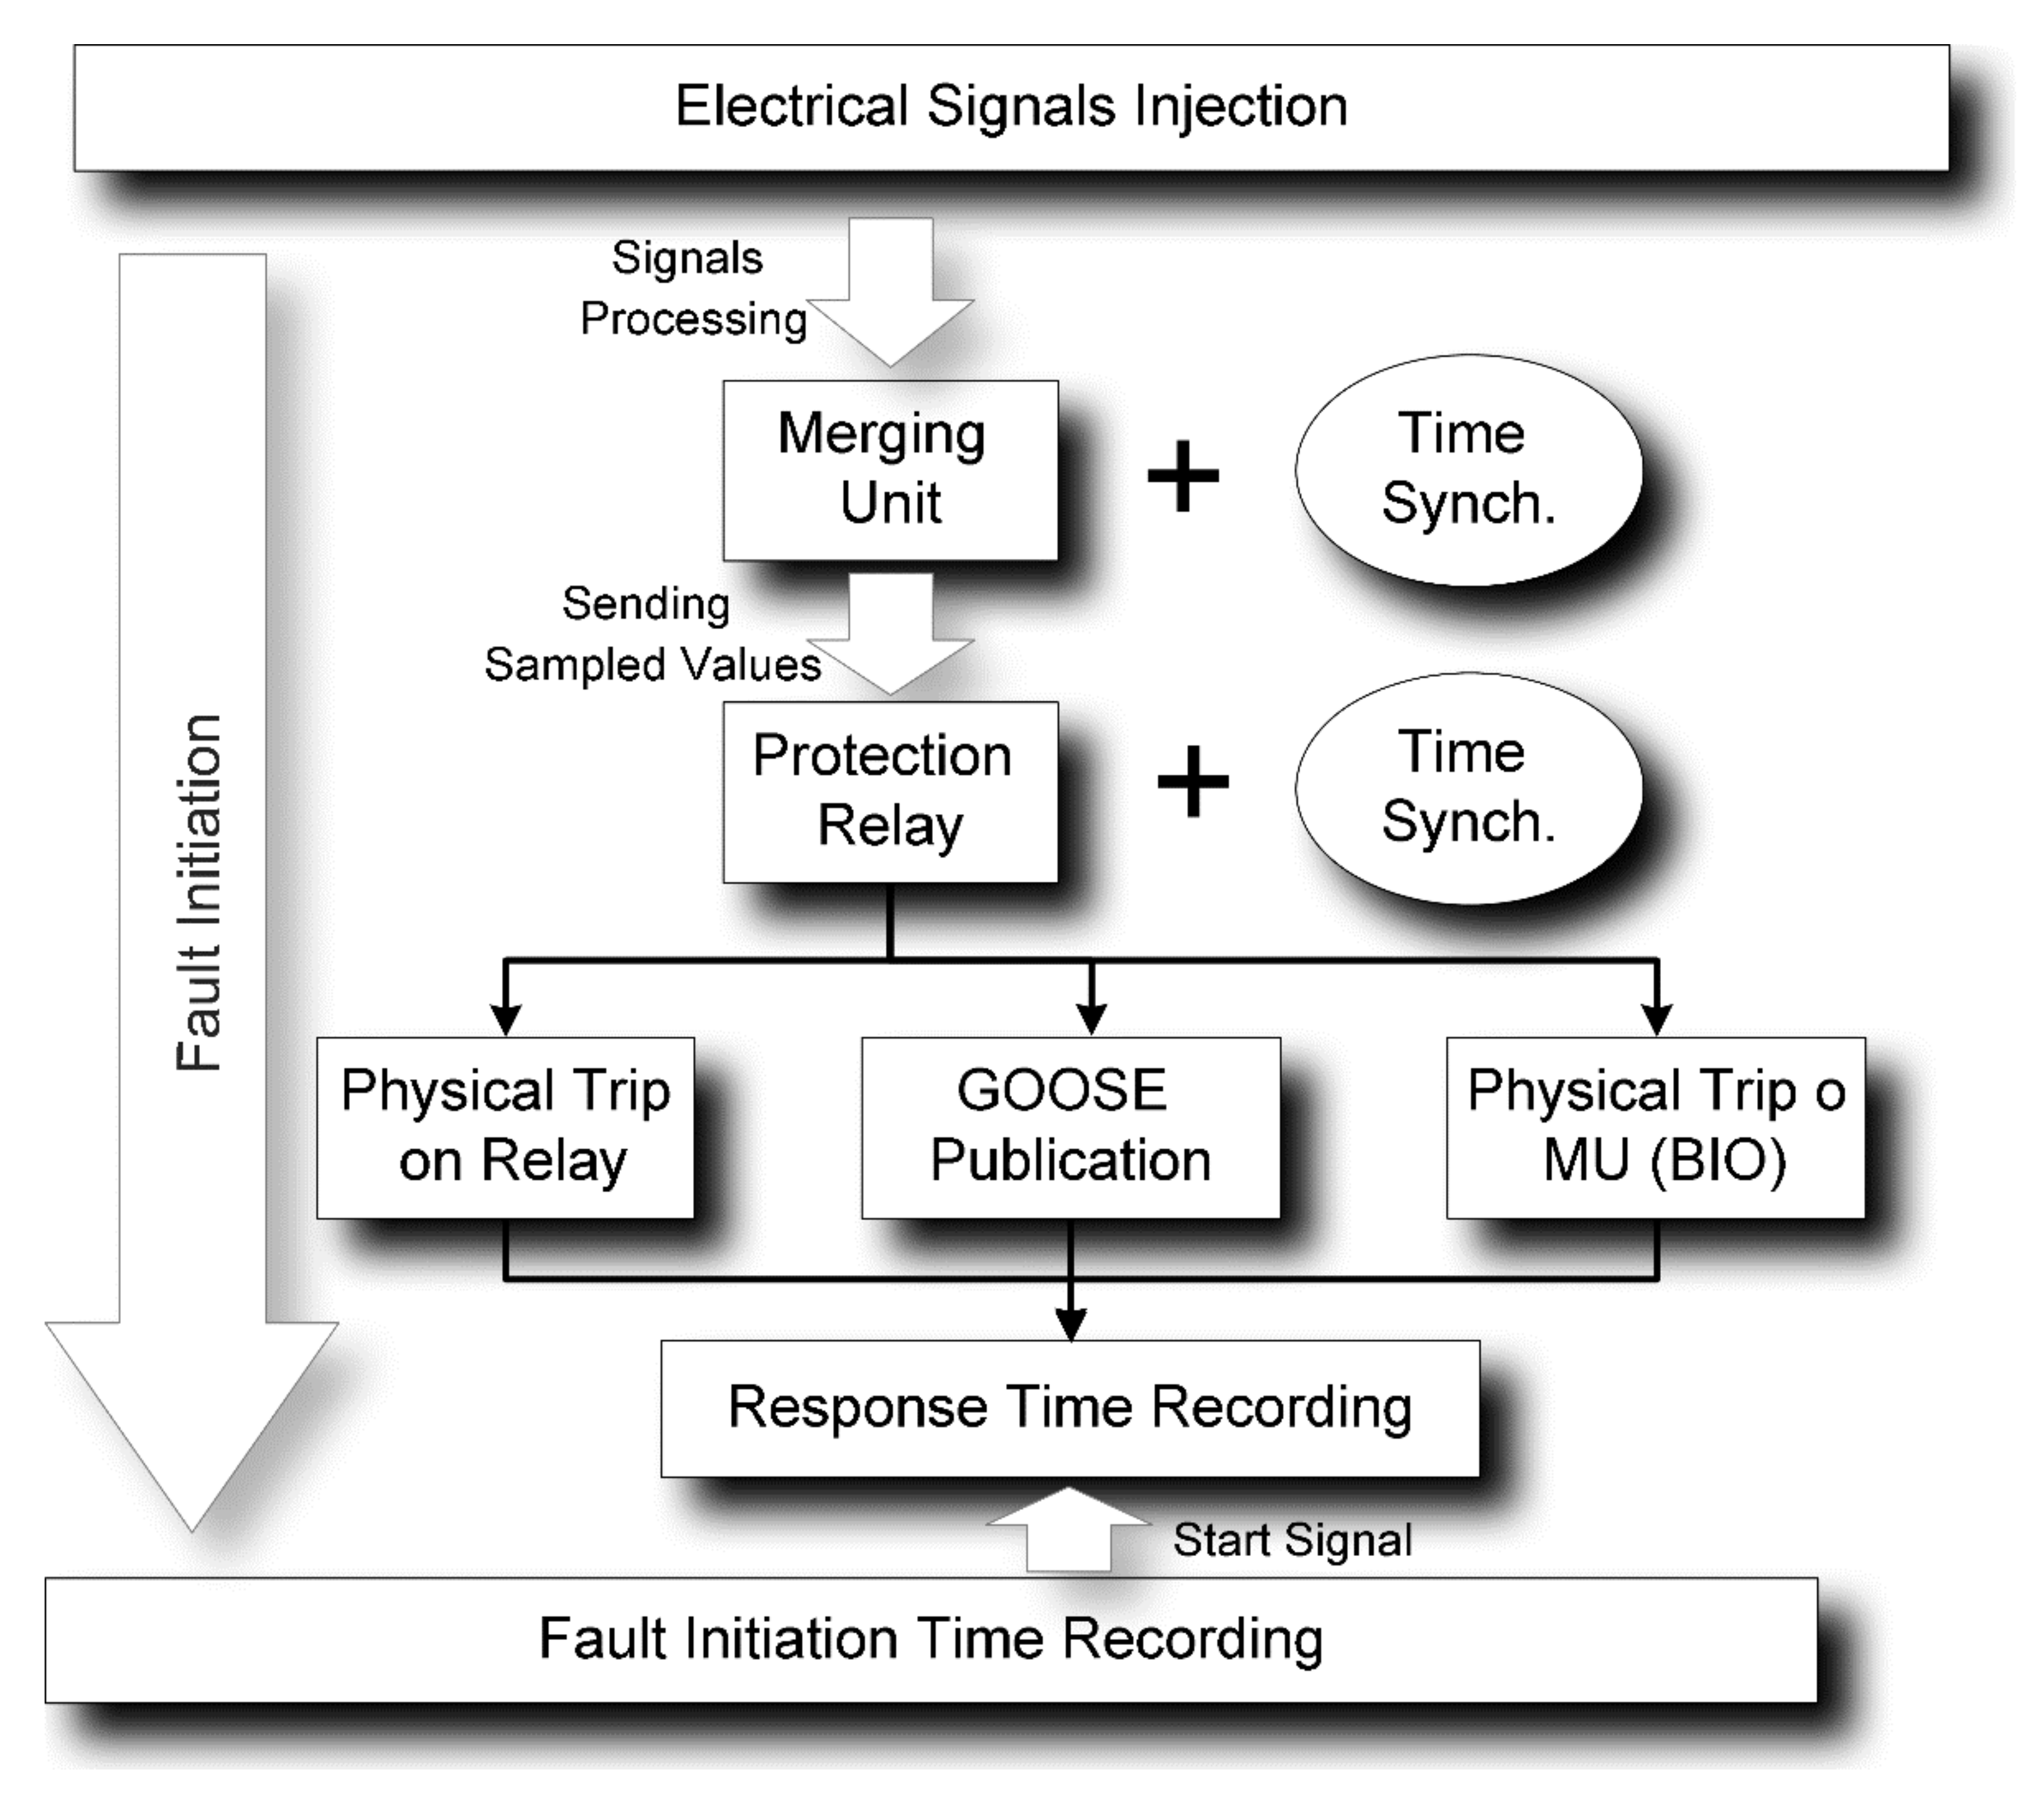
Figure 1 shows the main steps for evaluating the response time of electrical protections installed in a digital substation with a process bus. The proposed model identifies the essential characteristics for emulating a digital substation with a process bus. The process allows measuring analog signals from CTs and PTs in an electrical substation. An MU converts analog signals to digital signals and transmits SVs to other devices with adequate time synchronization. The protection device then processes the SVs received from the MU.
In the equipment under test, three feasible options are considered to measure the performance of the protection relay. The first option is activating a physical contact on a protection relay, the second option is publishing GOOSE messages issued by the equipment, and the third option is activating a digital MU with messages sent by the protection device. After receiving signals, it is necessary to record the time from the beginning of an electrical fault until the execution of each option. The event is recorded to compare the operation times of electrical protections in a digital substation with a process bus. Therefore, some minimum requirements for the devices that integrate the test scheme are necessary.
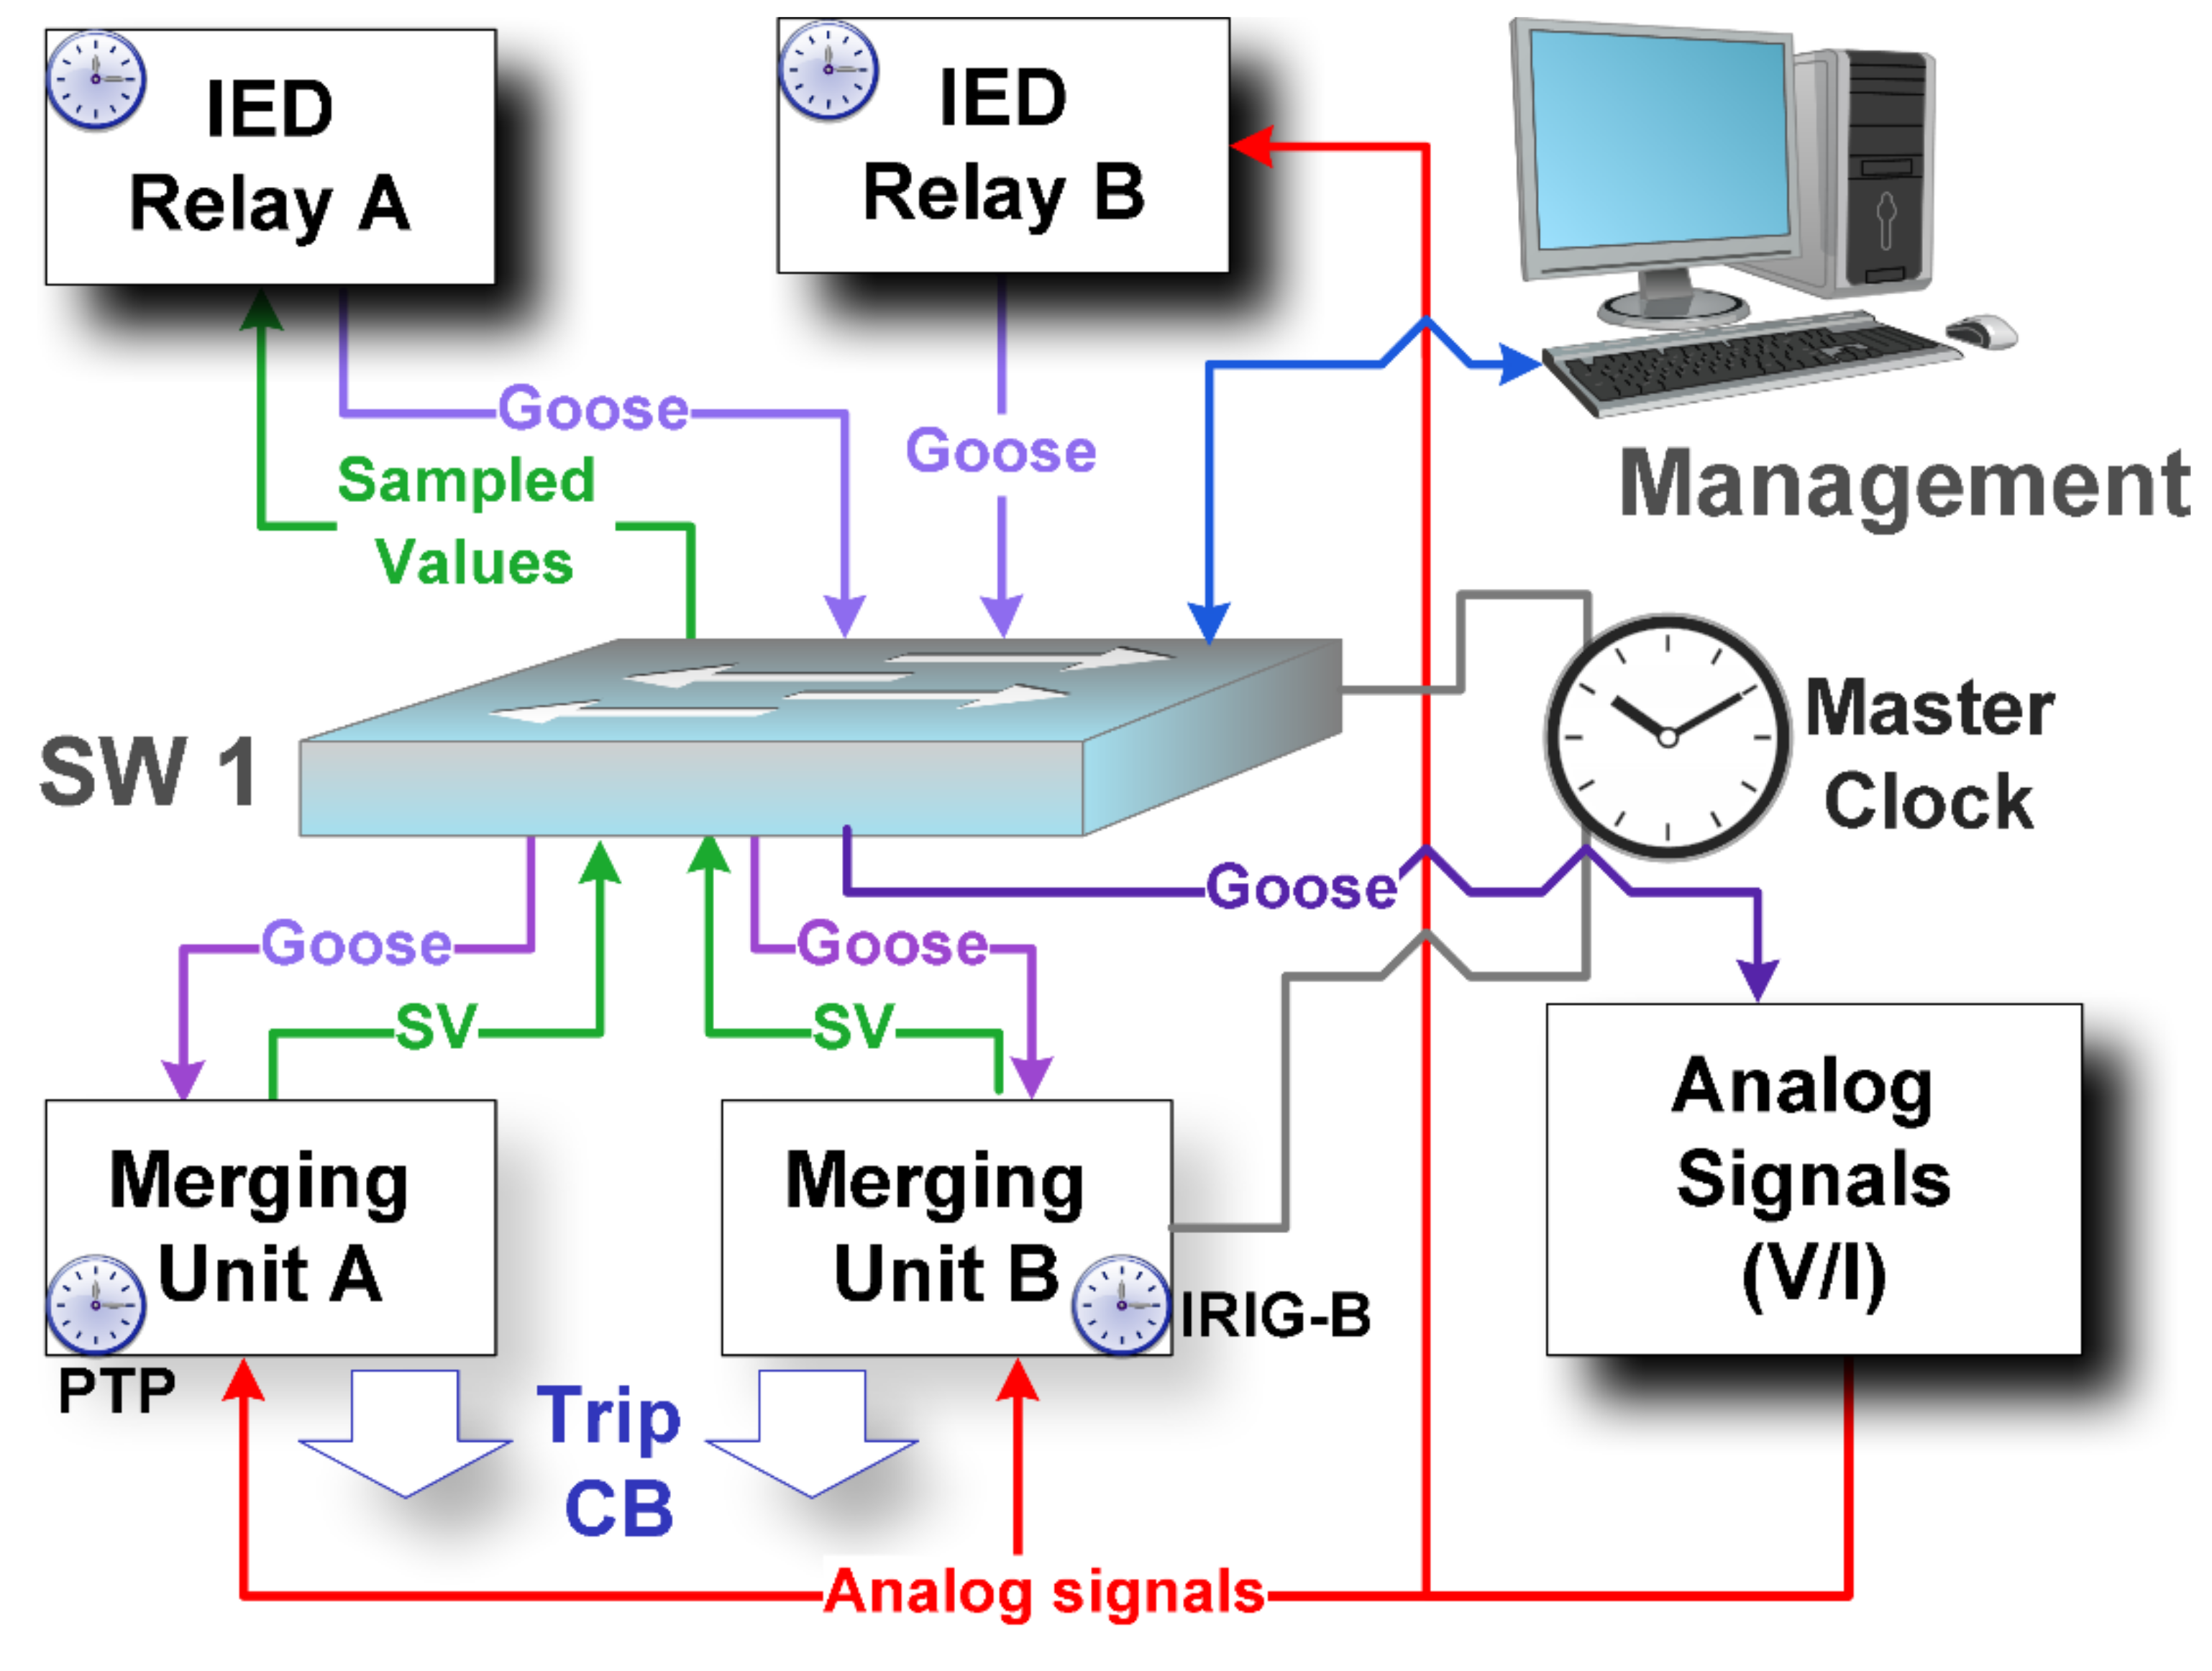
Figure 2 shows the corresponding diagram of the test scheme used to evaluate the response time in electrical protections with the process bus. The test scheme integrates IEDs and MUs to emulate the behavior of the protection relay. This scheme allows simultaneous comparison of the response times of electrical protections and evidence of interoperability, communication, publication, and messages subscription between the protection relay and MUs. In the same way, by implementing the test scheme, it is possible to monitor and test the time synchronization IEDs or MUs with any of the protocols required.
The signal injection was performed with the OMICRON CMC 356, from which the electrical signals are subtracted, simulating the behavior of the CTs and PTs in the electrical substation. The electrical signals are injected into the MUs to emulate the process bus in a digital substation with this device. These signals can be injected into conventional relays if required. This scheme helps define the operation times of electrical protections, physical contacts of IEDs, physical contacts of MUs, and GOOSE messages (detected in the communication network). In addition to the signal injection, a switch-type communication device is required to integrate the protection relays and MUs.
Furthermore, the equipment used in the test must have the technical and operational characteristics required in this type of infrastructure and be compatible with the different communication protocols and time synchronization. A PC is used to install the configuration tools of the relays, MUs, synchronization clock, and signal injector and to record the data from the test. Moreover, a device is required for time synchronization, and it can be a high-precision GPS clock with output protocols, such as IRIG-B (Inter-Range Instrumentation Group—Type B) and PTP (Precision Time Protocol).
Finally, an MU is used to transmit the SVs of voltage and current signals available in the protection relays through the communication network; this is useful to identify the operating state of the electrical system. A new digital MUs can be added to receive the GOOSE tripping message generated by the electrical protection and activate the physical contacts to execute a maneuver in the substation equipment.
2.2. Equipment for the Experiment
The experiment defined above considers different equipment as described below:
An analog MU is required to send SVs to other equipment installed in the system;
A digital MU is required to receive digital signals from the protection relay;
A digital protection relay is used to analyze signals from the analog MU, decide system protection actions, and send GOOSE messages to operate other devices. Only the instantaneous overcurrent function is set up for the test;
An analog protection relay is needed to compare the response to fault events. Similar to digital protection, an instantaneous overcurrent function is set up for the test;
Time synchronization is required to guarantee that all the equipment in the electrical substation has the same time;
A signal injector is used to emulate the current and voltage extracted from the instrumentation transformers (CTs and PTs) in the electric substation. The device must create multiple operation states in a system with different voltage and current values. Furthermore, an oscillography function is required to capture analog signals, receive digital or binary signals, and have binary input channels for reading the opening or closing operations of contacts in relays and digital MU;
A PC is used to install the data analysis and configuration software for the different devices in the system;
A communication interface compatible with protocols contemplated in the IEC 61850 standard is used in the test;
An industrial communication switch compatible with the communication protocols contemplated in the IEC 61850 standard and other communication and management devices is required for the test. The switch must have multiple communication interfaces that adjust to the amount of equipment in the infrastructure and are compatible with the type of connection and speed;
A device for converting protocols is required when there is an incompatibility in the wavelength of the signal emitted by optical fiber and conversion of optical fiber to Ethernet or coaxial (for IRIG-B).
Additionally,
Table 1 shows the main characteristics required to perform the experiment. The devices considered in this table are Analog Merging Unit (AMU), Digital Merging Unit (DMU), Digital Protection Relay (DPR), Time Synchronization (TS), and Signal Injector (SI). These characteristics must be according to IEC 61850-9-2 [
28], IEC 61850-8-1 [
29], and IEC 61850-9-3 [
30].
3. Results and Analysis
Different operation scenarios are evaluated for two protection relays under fault conditions, as presented in
Table 2. Two types of protection relays were considered in the experimental test, a digital protection relay identified as A and a conventional protection relay identified as B. In addition, the protection relay A is tested with the two types of MUs (MU A and MU B). The instantaneous overcurrent functions were set up for the two protection relays (A and B). For this device, five fault events are considered in the experimental test to evaluate the response time of the two protections, and each event is tested 10 times. Two variables are measured in the experimental test:
T and
σ. The term
T corresponds to the average time measured throughout the 10 tests performed per event. The term
σ is the standard deviation of the times calculated after 10 tests performed per event. These variables are measured in three points related to the physical contacts (relays and digital MUs) and GOOSE messages in the communication network. Finally, the results displayed in this paper are related to testing relays and comparing the results as defined in
Table 2.
3.1. Protection Relay A with the MU A
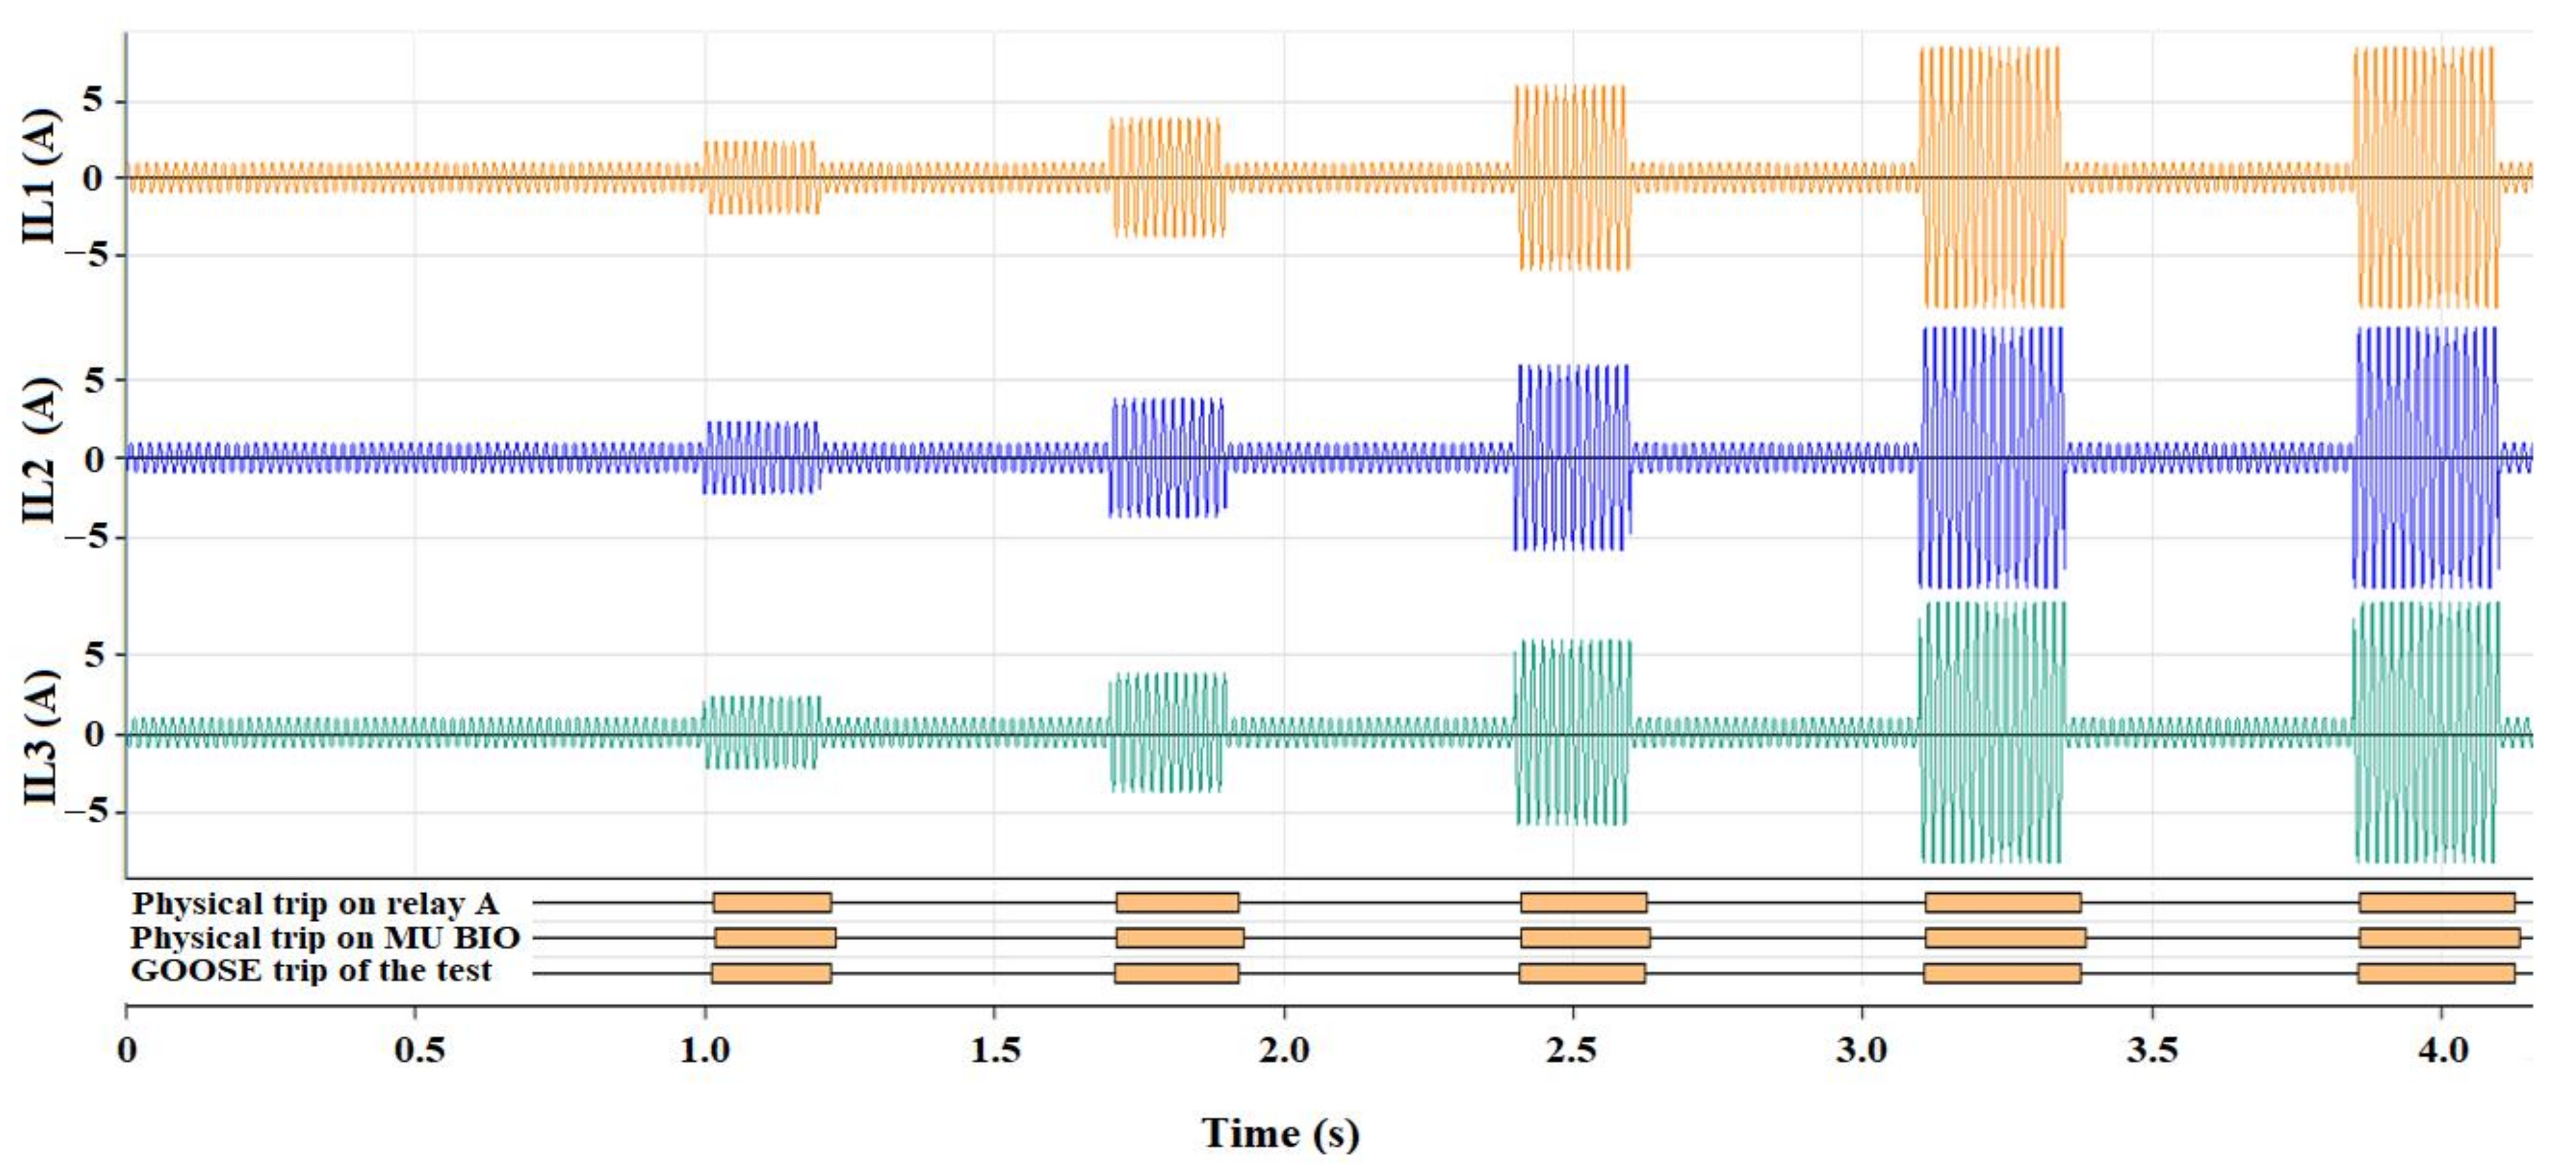
Figure 3 shows the oscillography of signals detected by the MU A of protection relay A, when the five events described in
Table 2 are evaluated. Times are measured at the three points associated with the digital variables observed in the oscillography (
Table 2). In addition, the test evaluates the GOOSE tripping messages set for the test for the different fault events.
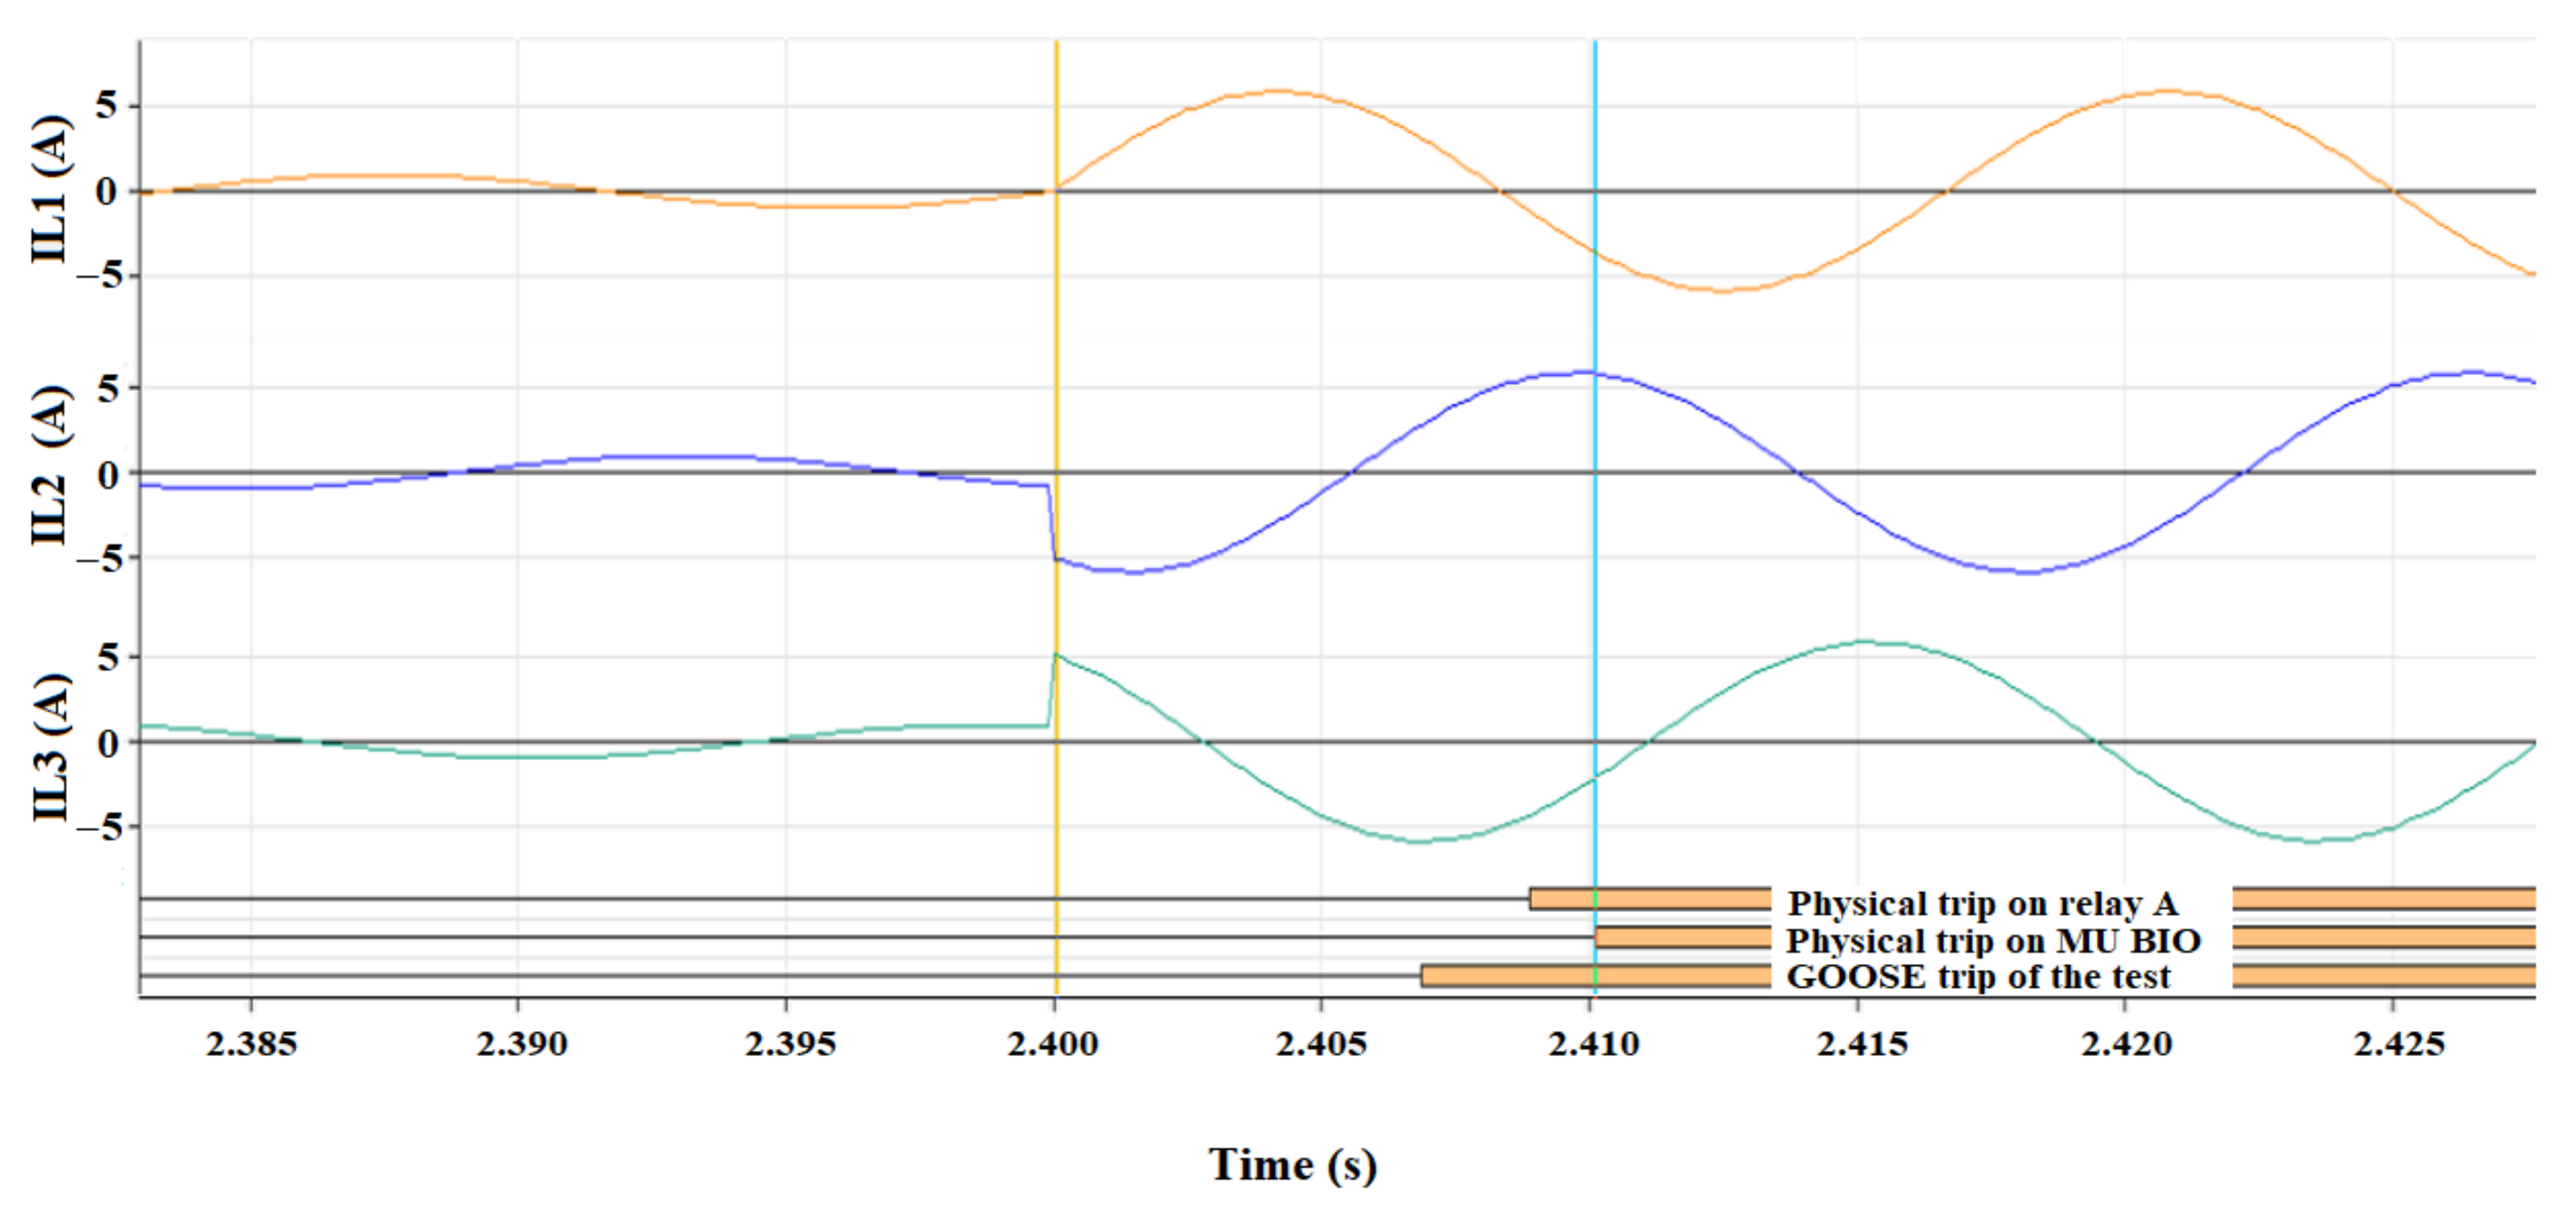
Figure 4 shows the segment that relates the times of the protection relay A with MU A, for the third fault event starting at 2.40 s. The pre-fault current is 700 mA (RMS), and the fault current is 4.2 A (RMS) at 2.4 s. In the lower part of this figure, the digital signals registered from the start of the fault are presented, representing the response action of the protection relay A. In this zone, the response time for the electrical protections is measured, considering the fault initiation at 2.4 s and establishing the delay generated at the same point. An average response time is consolidated from this difference, including all the repetitions made for this test.
Therefore,
Table 3 shows the average times measured for the protection relay A and MU A. The term
I corresponds to the fault currents of the five events defined in
Table 2. Times are measured in the three points defined in
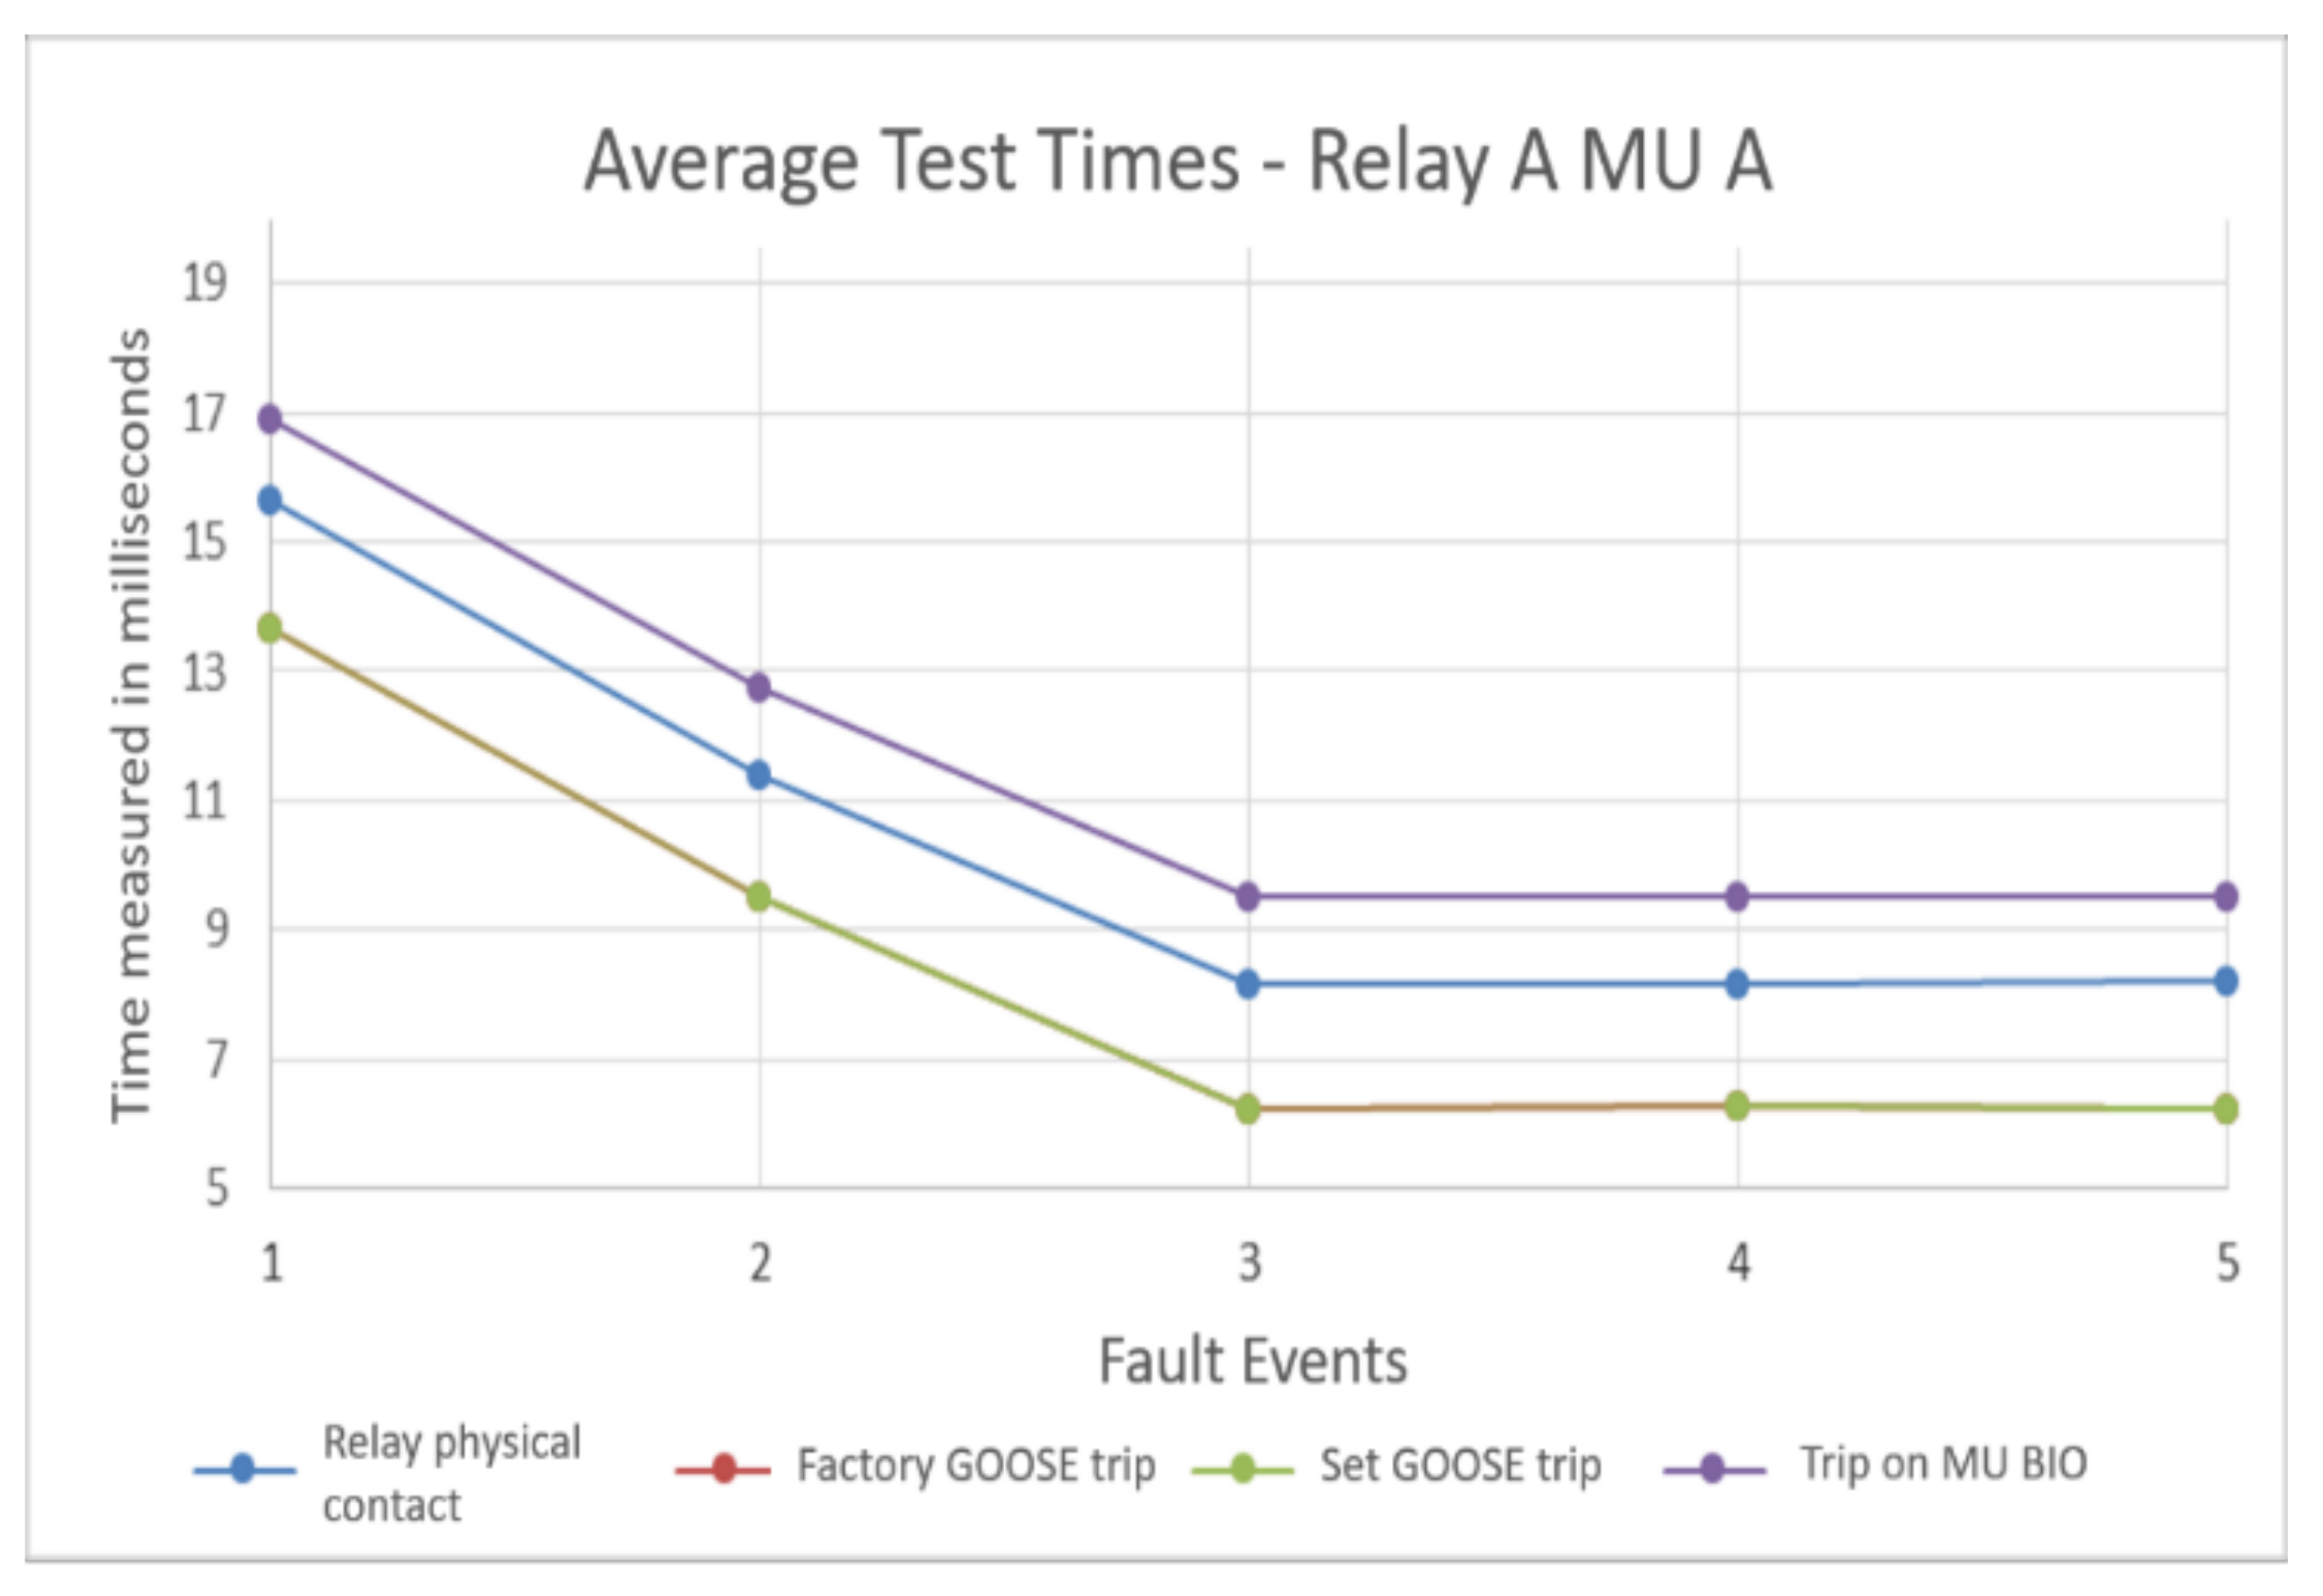
Table 2 (physical trip in relay, GOOSE messages in the communication network, and physical contacts in a digital MU). These results show that the most extended times are those registered at the lowest fault current, decreasing as the fault current increases. In the same way, the shortest response time for each fault is obtained after reading the GOOSE messages issued in the communication network. The response times of the protection relay were less than 17 milliseconds, implying that the device has a great response capacity. Furthermore, times are measured in the communication network for the GOOSE tripping messages predefined by factory (Factory GOOSE) and set for the test (Set GOOSE).
Figure 5 shows the response time of the protection relay A with the MU A for the five events defined in
Table 2. In this figure, the times of the GOOSE tripping messages (Factory GOOSE and Set GOOSE) are the same. The time difference between the first tripping signal (GOOSE) and the last measured signal (physical contact in digital MU) is about 3.5 milliseconds or fewer than 0.25 cycles of the 60 Hz sine wave. This result represents the time that the GOOSE message travels in the communication network, the time for processing the message in the digital MU, the time for activating the physical contacts, and the time for processing the signal received in the test equipment. In addition, the response time measured in the test with protection relay A and MU A is less than 10 milliseconds (current fault equal to 4.2 secondary amperes). This result guarantees good protection performance as the response time is fewer than one cycle of the 60-Hz analog signal (approximately 16.67 milliseconds).
3.2. Protection Relay A with the MU B
Now, new signals are injected according to the programmed fault events to study the response of protection relay A with MU B.
Table 4 presents the average times (
T) and the standard deviation (
σ) calculated for the three measurement points defined in
Table 2 (physical contact in the relay, GOOSE tripping messages, and physical contact in the MU). The term
I corresponds to the fault currents of the five events defined in
Table 2. The term
T corresponds to the average time measured throughout the 10 tests performed per event. The term
σ is the standard deviation of the times measured in the 10 tests performed per event. Moreover, times are measured in the communication network for the GOOSE tripping messages predefined by factory (Factory GOOSE) and set for the test (Set GOOSE).
This table shows that the times of the GOOSE tripping messages (Factory GOOSE and Set GOOSE) are the same. This result corroborates that the manufacturer of this equipment does not give special or priority treatment to its configurations and allows the user to obtain results equivalent to those with configuration and factory tests on the protection device. On the other hand, the longest response time in the fault scenarios is obtained with the values measured in the physical contact of a digital MU. This result is explained by considering all the processes performed from the fault events, such as SVs processing, protection function activation, publication of GOOSE message, communication transmission, signal processing in the digital MU, and activation of the physical contacts. However, the protection relay A with the MU B obtained the shortest response time in the GOOSE tripping messages predefined by factory and set for the test.
Figure 6 shows the average times measured for the protection relay A with MU B. The trend lines and points corresponding to the average time obtained with the two GOOSE tripping messages issued by the protection relay are overlapped, denoting that they are the same. The response time measured in the digital MU is higher than those values previously found in the tests. The time difference between the GOOSE tripping messages in the digital MU does not exceed four milliseconds in test scenarios. This result implies that the signal processing and device activation, added to the traffic in the network, is less than one-quarter of the cycle of a 60 Hz sine wave. However, when the response times of the MU and the activation of the physical contact in the protection relay are compared, the difference is minimal and does not reach 1.5 milliseconds. This result shows that the digital MU is an element that does not affect the final response time of the protection relay.
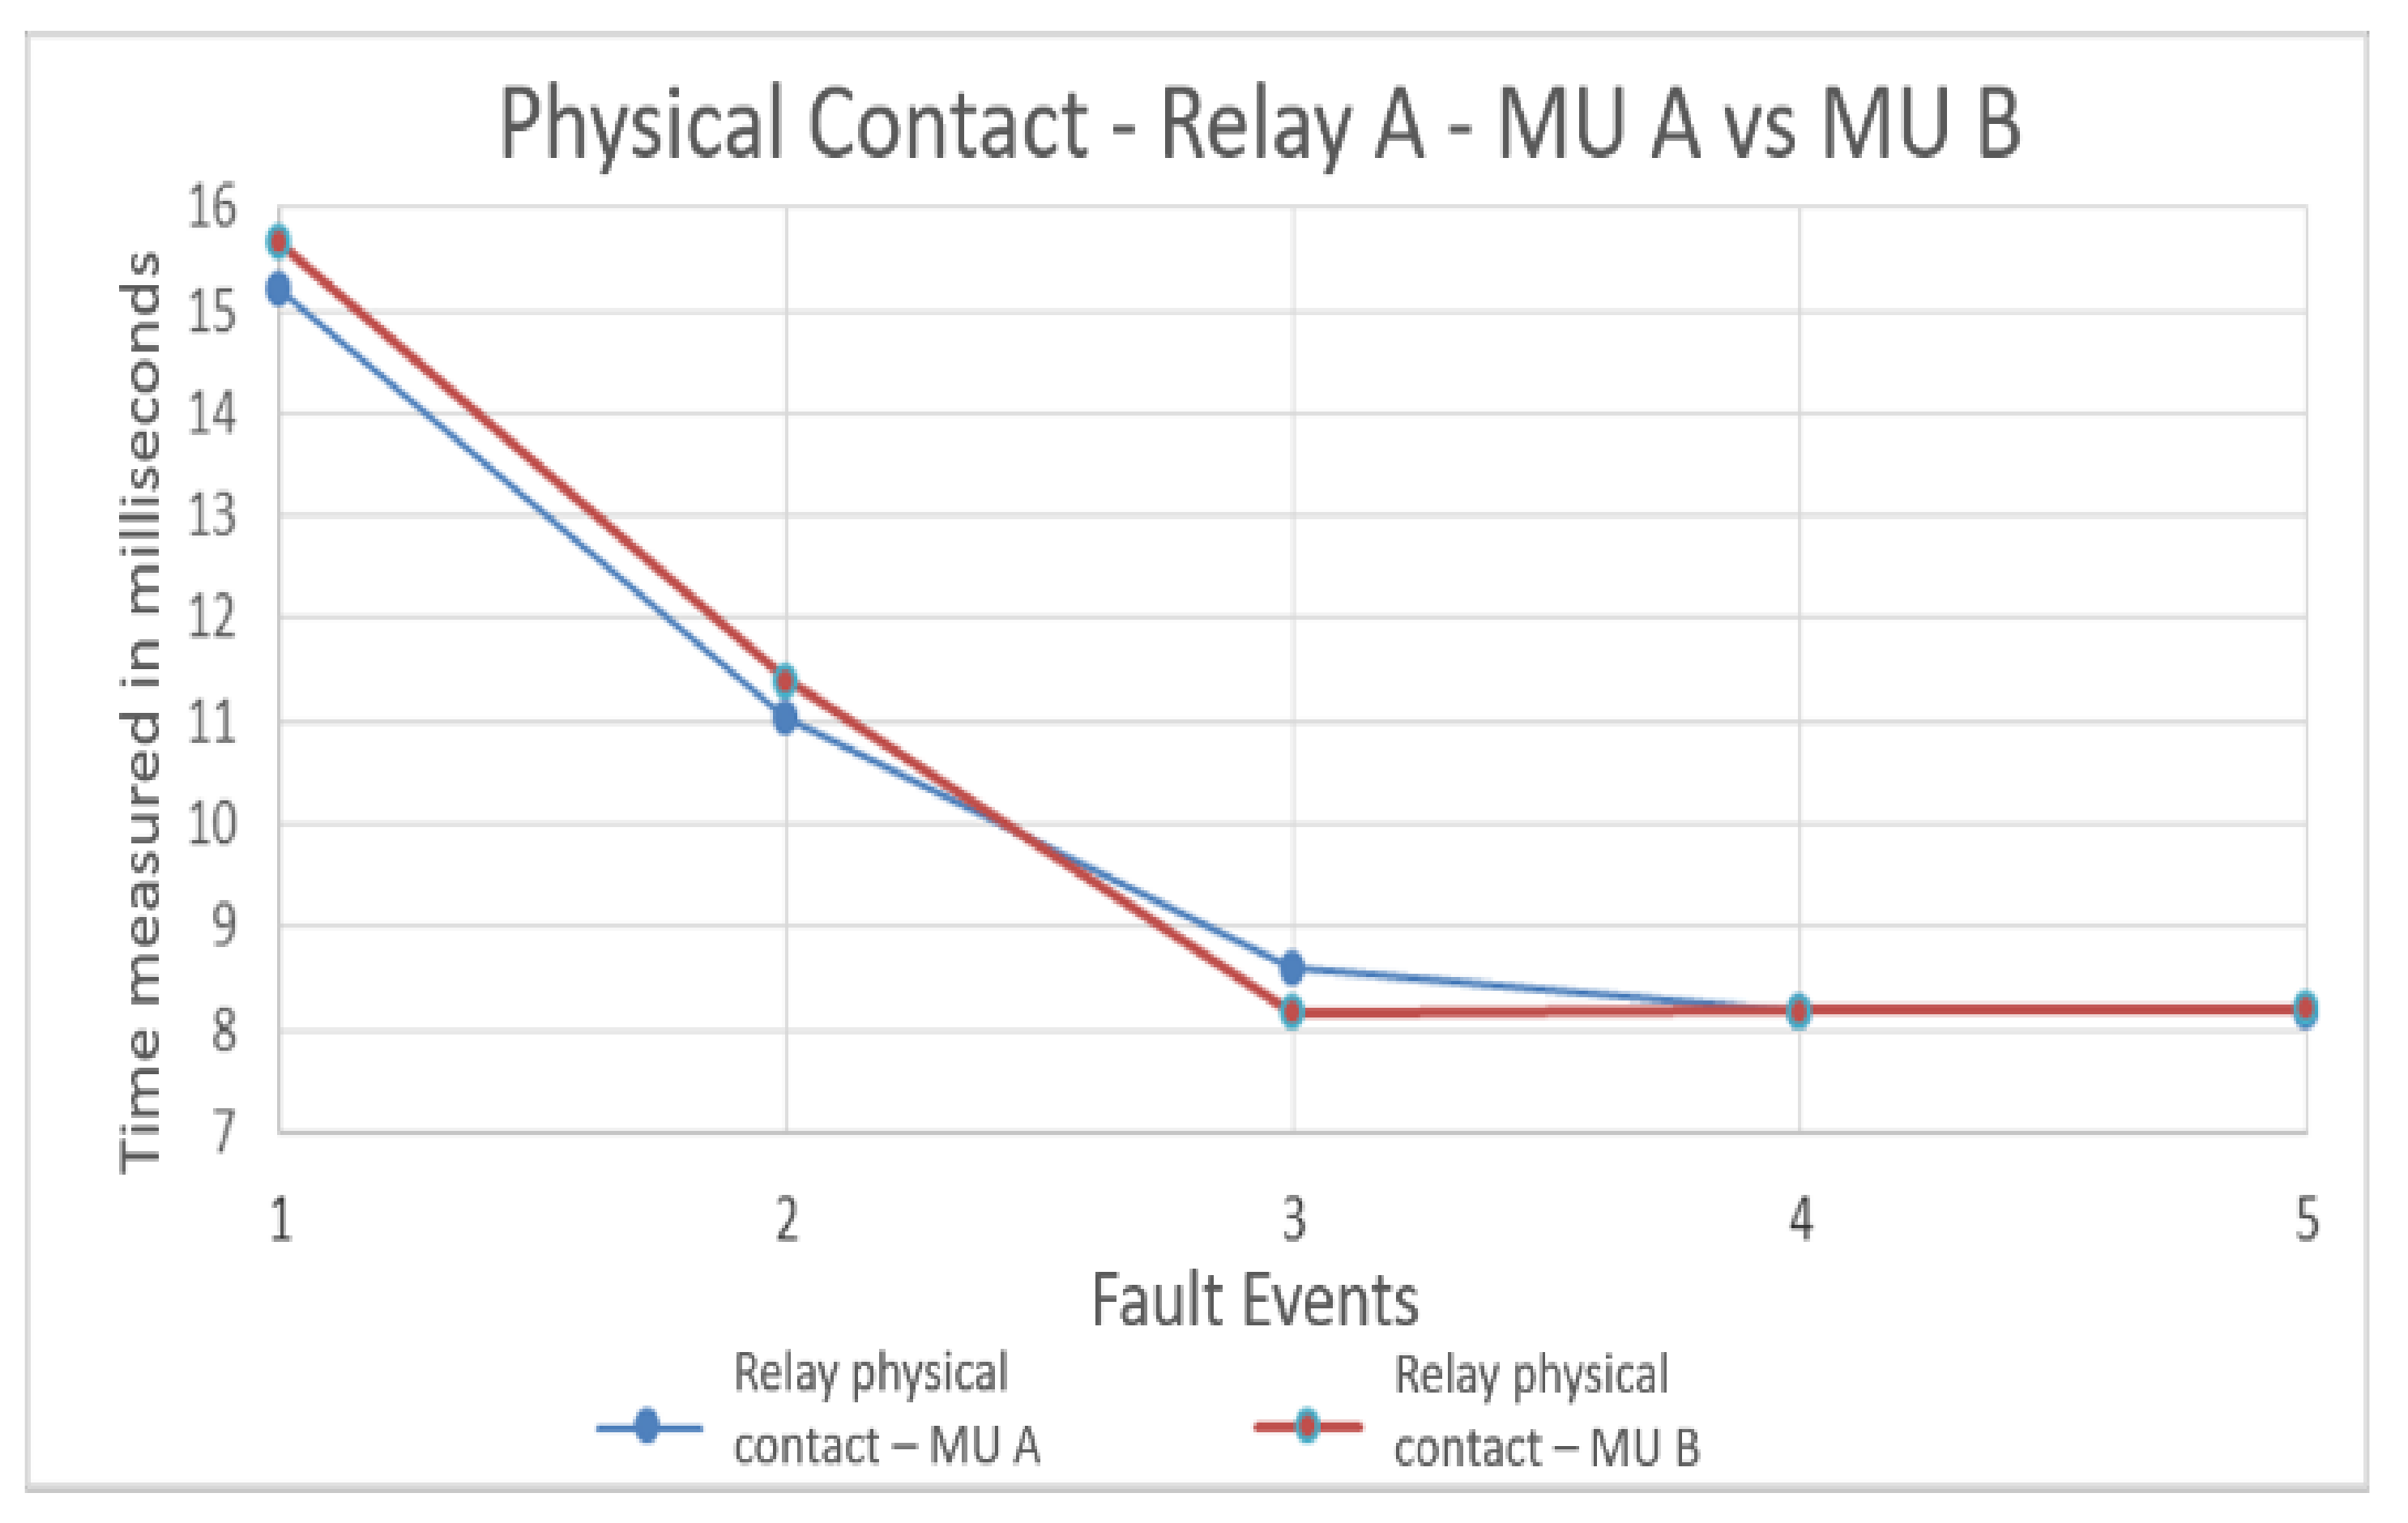
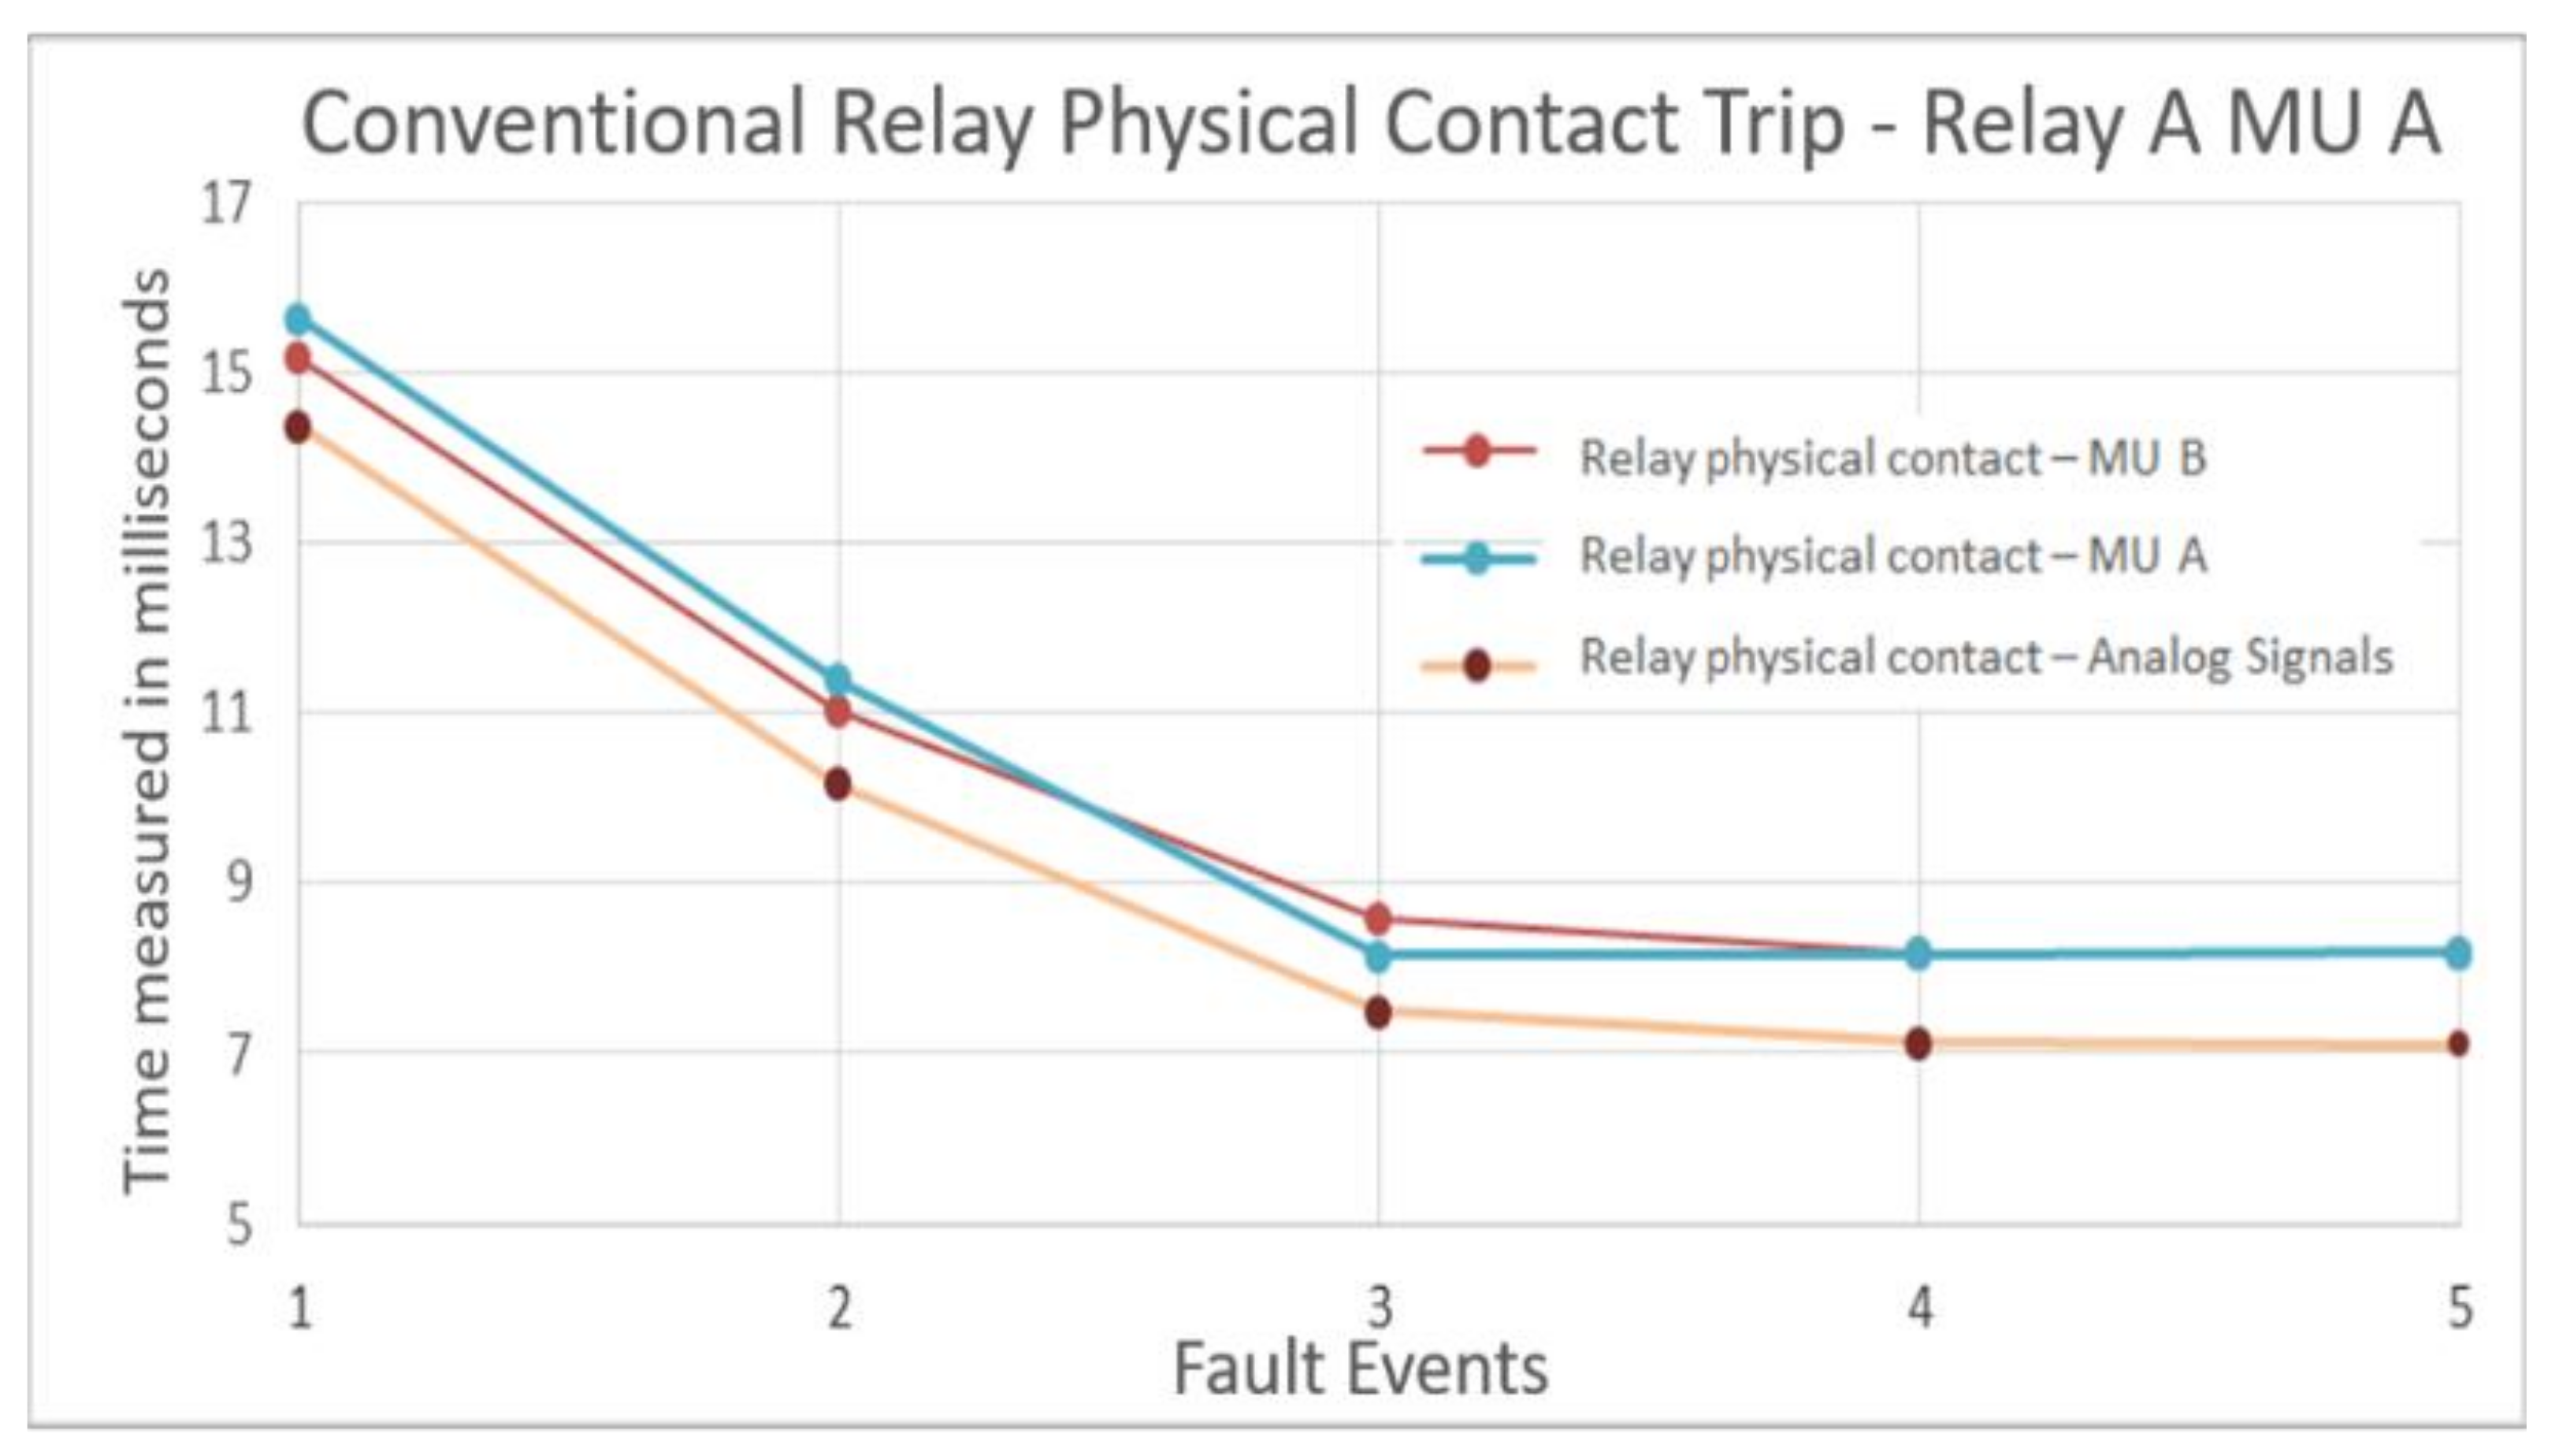
The variables measured in the protection relay A for the two test scenarios are carried out to observe the implications of using this equipment in a system with a process bus. Then,
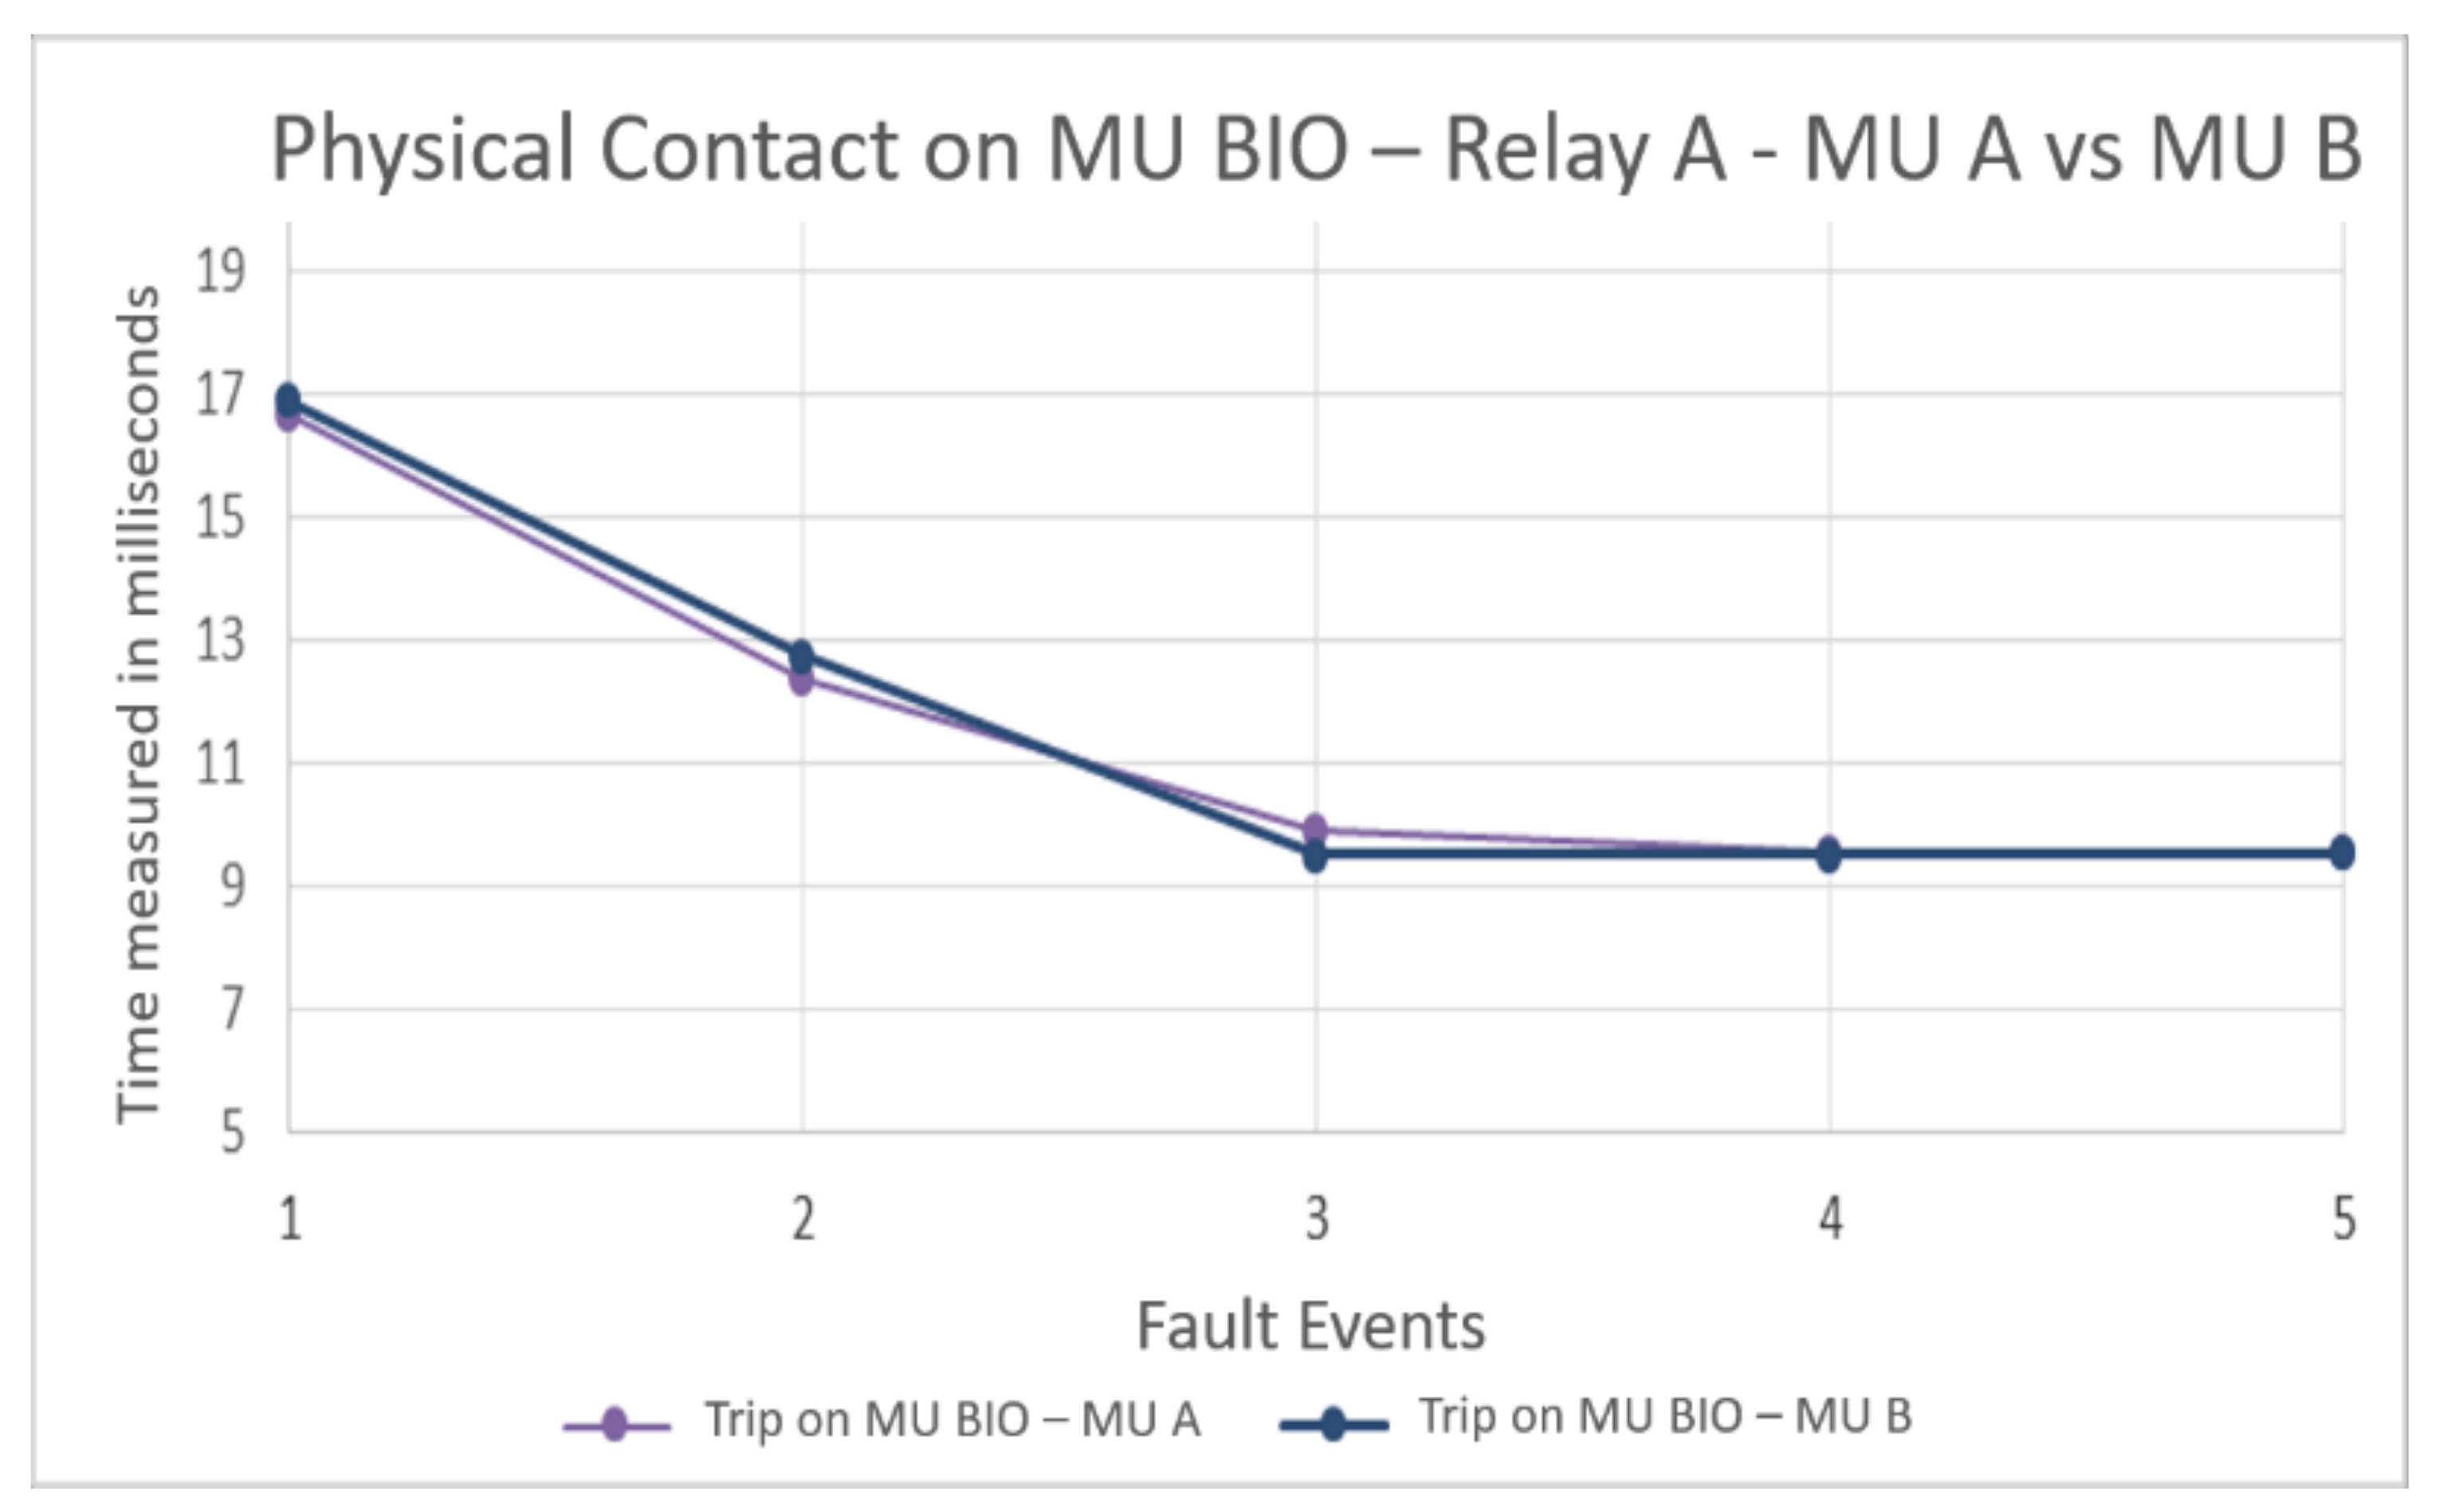
Figure 7 shows the average times for the actuation of physical contact in protection relay A with MU A and MU B. This test compares how these times are altered by changing analog MUs A and B, responsible for converting analog current and voltage signals to SVs. Then, these new SVs are transmitted to the protection relay through a communication network. This figure displays the times when the physical contact is activated in the protection relay A for the five fault events. The result shows that times are similar, with a small-time lag lower than 0.5 milliseconds. In addition, the signal is not affected significantly by the MUs, and it could be more associated with data traffic in the network and not with SV transfer.
Next,
Figure 8 shows the average times measured for the GOOSE messages issued by the protection relay A at different faults. Here, as in the previous results, the response times of GOOSE tripping messages set for the test are the same for protection relay A with both MUs. Thus, only one message from scenario A and one from scenario B were compared to observe the different behaviors. As in the previous figure, the time difference between the measurements taken for the GOOSE messages in both scenarios continues to be less than 0.5 milliseconds. Time may be associated with exchanging multiple messages in the communication network.
Figure 9 shows the times and trend lines corresponding to the physical contact in the digital MU. This test represents equipment located in the electrical substation yard, which would eventually be the actuator in a system with a process bus, according to IEC 61850-9-2. This figure intends to conclude if this protection relay A is affected when MUs A and B are included. In this case, the variable presents high traffic in the communication network.
The result shows that the times and the trend lines are similar, and the differences are less than 0.5 milliseconds. This result can be associated with the traffic variation in the communication network or saturations because of the amount of GOOSE tripping messages or SVs from the MUs. Minimum differences were found when comparing the response times in both MUs, and the delays are linked to traffic problems in the communication network.
3.3. Tests with the Conventional Protection Relay B
A conventional protection relay (B) with analog signals (without a process bus) was included in the test scheme. The protection relay B has functional and operational characteristics similar to those defined for protection relay A. The average times (
T) are measured and standard deviations (σ) are calculated for the three measuring points defined in
Table 2 (physical contact in the relay, GOOSE messages in the communication network, and physical contact in the MU). Therefore,
Table 5 shows the average times measured for the protection relay B with conventional analog signals. Moreover, times are measured in the communication network for the GOOSE tripping messages predefined by factory (Factory GOOSE) and set for the test (Set GOOSE).
The data presented in this table show the similarity between the protection relay B acting with conventional analog signals and the protection relay A operating with SVs supplied by the analog MU. The times obtained for the GOOSE tripping messages (Factory GOOSE and Set GOOSE) are the same (it agrees with the results found with the protection relay A). However, contrary to what was observed in the previous tests, the longer response time measured at the different faults does not occur in the physical contacts of the digital MU but in the physical contacts of the protection device. This last result shows that the equipment has a great processing capacity to publish computer signals.
3.4. Relay A with MUs A and B vs. Relay B
This section compares digital protection relay A operating with the two MUs and conventional protection relay B operating with analog signals.
Figure 10 displays the times for the three measuring points defined in
Table 2 (physical trip in relay, GOOSE messages in the communication network, and physical contacts in a digital MU). In addition, a trend line allows identifying the behavior of the equipment because of different fault current levels. In all fault events, the longest response time corresponds to the activation of the physical contacts in the conventional protection relay B. Time differences are less than 1.5 milliseconds. Likewise, the similarity between the signal of the GOOSE messages emitted from the relay and the activation times of the digital MU is noted. In addition, the time lag between the signals does not reach 0.2 milliseconds. This result shows high processing of the Digital MU because those 0.2 milliseconds correspond to the average time the device requires to process the incoming GOOSE message. The actions are associated with a physical command and final actuation.
Then, the average times measured for the physical contact in the protection relay B with conventional signals and the response times obtained with protection relay A with the two MUs are plotted in
Figure 11. Likewise, the corresponding trend lines are included for each exposed variable. In this illustration, the time values measured for the conventional protection relay B are short compared to the points found for the protection relay A operating with SVs of the MUs. However, the response times compared in all fault events do not present a difference larger than 1.5 milliseconds. This behavior means that the protection relay operation in an electrical substation with a process bus, according to IEC 61850-9-2, presents a similar response to conventional electrical protection that operates with analog signals.
The time delays in the test have a minimum time lag that can easily be associated with the communication architecture, network traffic, or digital signal processing. This result implies that including MUs devices in a digital substation does not introduce considerable delay times for the protection relays. Furthermore, it does not entail a risk to the satisfactory operation of the protection scheme. The results concerning the time lag between the signals (conventional relay and MUs) are like those presented with protection relay A with the two MUs. Thus, the time difference presents a magnitude lower than 0.5 milliseconds and can be attributed to data traffic in the communication network. The times do not reach the worst cases for the conventional protection relay B. For faults 3 to 5, a response time of less than half a cycle (8.33 ms) is obtained.
Figure 12 shows the signals corresponding to the time values and trend lines obtained with the protection relay A operating with both MUs and the results found with the protection relay B acting with conventional signals. This figure shows how the trend line continues as in previous results, where the signal measured for the response time of the conventional protection relay B is quite similar to the signal corresponding to the GOOSE message issued by protection relay A operating with both MUs. In this result, the worst-case scenario presents a delay of approximately one millisecond. This result shows part of the impact of including MUs in an electrical substation, where the response times are not significantly increased for electrical protection applications.
In the worst-case scenario, the most extended response time delay of equipment operating with SVs and a protection device that operates with conventional signals does not reach even 1.5 ms. Therefore, it is possible to affirm that the operation of an electrical system in which MUs are included would not be affected. The overcurrent protection function would act similarly in any operating condition, either with conventional signals or with SVs.
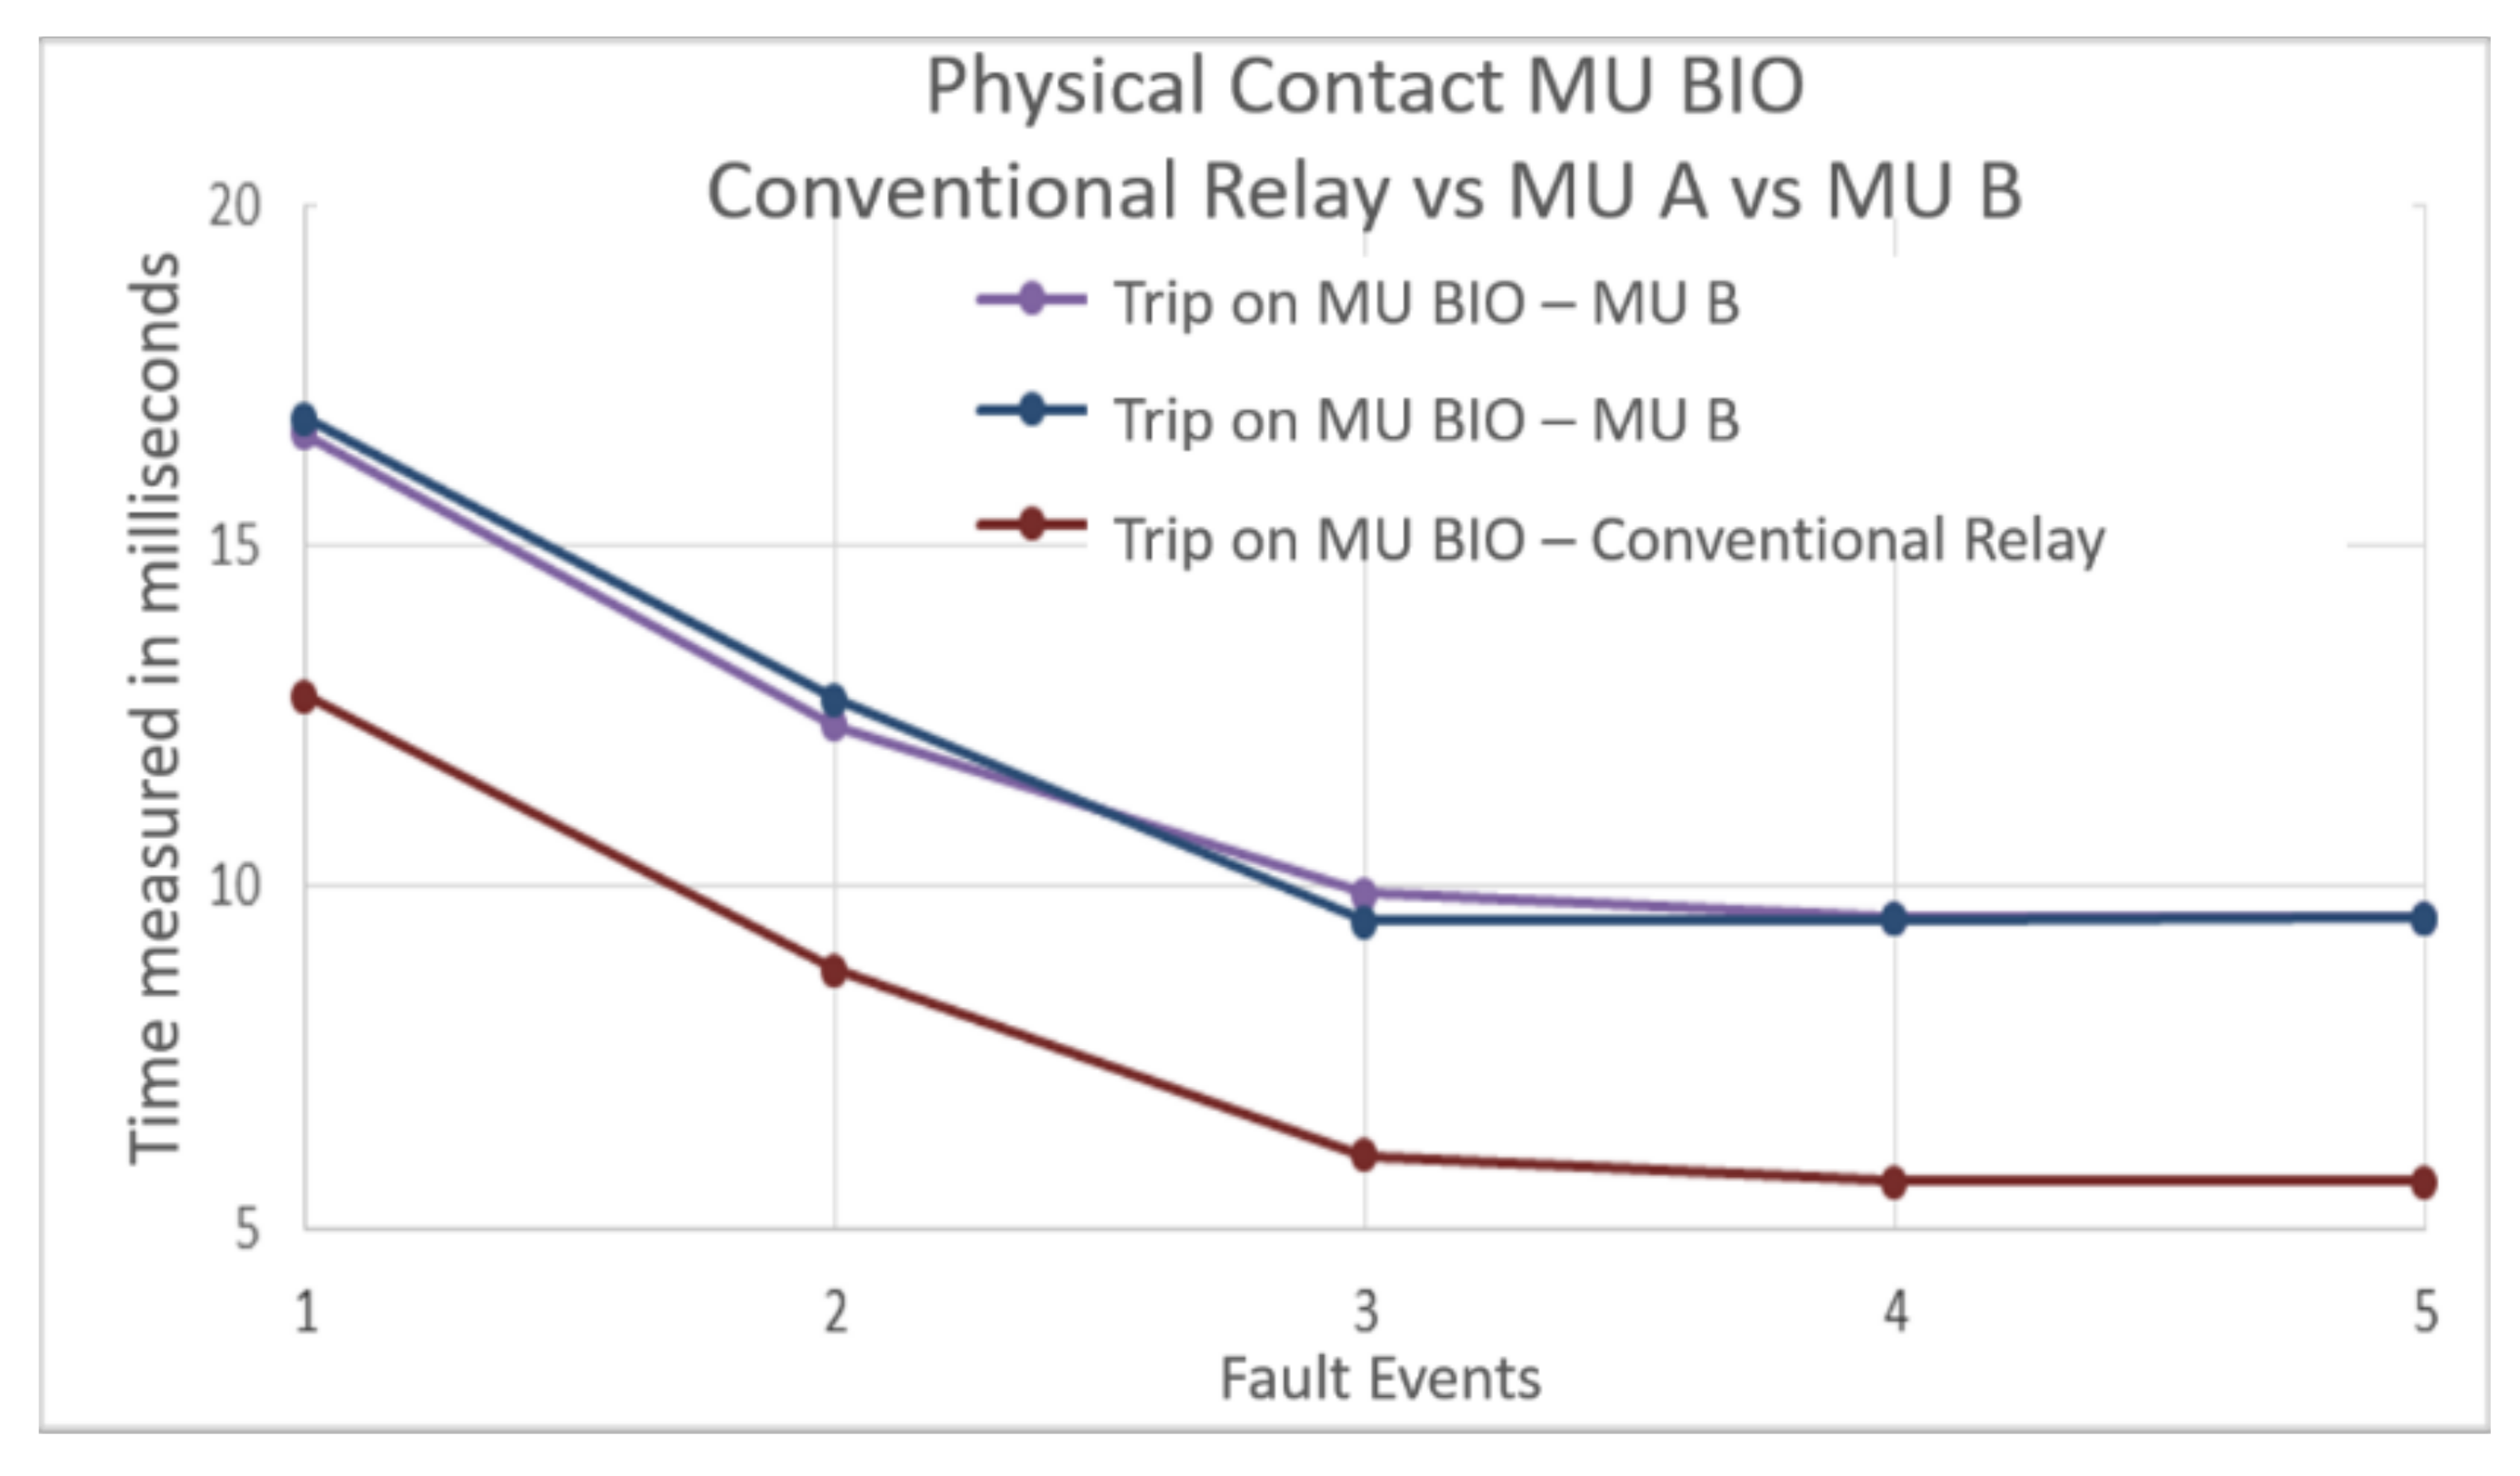
Finally,
Figure 13 shows the response times and trend lines of the protection relay A with the MUs and conventional protection relay B with conventional electrical signals. As observed in the protection relay operating with conventional signals, there was a minimum difference between the signals measured from the GOOSE messages in the communication network and the times found in the activation of physical contacts of the digital MU that operates using the received messages. This result is even more evident in the previous figures, where the digital MU signal activated with the conventional protection relay B has lower times than those obtained when activating the same contacts with the protection relay A.
This time reaches a value lower than four milliseconds, showing that the digital MU processes the GOOSE tripping messages sent by the conventional relay in a shorter time than the GOOSE tripping messages sent from a relay that operates with SVs. The messages sent from both devices are the same and even have very similar times when they are read on the communication network. However, the digital MU prioritizes the messages sent by the conventional relay, possibly because those that require the least amount of data in the communication network, considering the total traffic of the digital signal, are the first to reach the MU, so it is differentiated by minimum fractions of a second.
The GOOSE messaging process generates continuous messages that announce the change of state in the protection function, which may create time delays when reading the following messages; they would be those sent by the protection relay B. The delays observed between some signals throughout the tests are correct and related to high data traffic in the communication network.
4. Conclusions
This paper presented the response time of electrical protections operating with SVs in a digital substation with a process bus. A test scheme was proposed to emulate the system with the possibility of measuring time delays in protection relays. Then, the measured data were compared to the response time obtained with conventional protection relays operating with analog signals. The results show that despite the delay generated by processing the analog signal to SVs in an MU, it does not represent a risk for the operation of the protection scheme associated with electrical substations. In addition, the time delays obtained from the protection relays with MUs were similar to those found with a conventional protection relay fed by analogous signals. The protection device with process bus increased the final response time compared to conventional protection; however, this delay is lower than two milliseconds and does not represent a risk to the electrical system. Time delays were associated with high data traffic in the communication network, but even adding the processing time of the digital MU and the traffic saturation, the time was less than 1.5 ms.
These results are valuable for electricity companies and engineers as they generate confidence in adopting this type of system with digital substations, considering that the test scenario was performed with real devices, multi-vendor infrastructure, and different measurement points. It is recommended to conduct more tests to measure the response times when activating physical contacts of different digital MUs, protection relays, and switching devices. Future work should consider other functions, such as the differential, distance, or frequency protections. These tests could help identify if time delays affect or have considerable implications for protection functions.


