Article

Optimization Method for Conventional Bus Stop Placement and the Bus Line Network Based on the Voronoi Diagram

School of Civil Engineering and Architecture, Wuhan Institute of Technology, Wuhan 430074, China
*
Author to whom correspondence should be addressed.
Sustainability 2022, 14(13), 7918; https://doi.org/10.3390/su14137918
Submission received: 9 June 2022 / Revised: 23 June 2022 / Accepted: 27 June 2022 / Published: 29 June 2022
(This article belongs to the Special Issue Sustainable Road Transport System Planning and Optimization)

Abstract

:
With the rapid development of the economy, the existing conventional bus transit system finds it difficult to meet people’s increasing travel needs. In addition, with the emergence and rapid development of urban rail transit, it is also necessary to integrate the existing conventional bus transit system with the rail transit system to realize the optimization of the whole public transport system. This study introduces the concept of the Voronoi diagram and uses it to divide the service area of bus stops. Taking the average walking time of regional passengers to the station as the main index, the convenience of passengers in the service area was evaluated, and a set of candidate station sites is established. Against the background of urban rail transit, a complete optimization model for a conventional bus station layout and line network was proposed. Finally, taking Wuhan East Lake High-tech Development Zone as an example, two optimization schemes for the public transport system were obtained. Compared with the status quo, the optimized scheme had obvious improvement effects on the repetition coefficient of bus lines, per capita transfer time, bus line network coverage and station service rate. This has been recognized by the local authorities, which proves the practicality and scientificity of the optimization method of this study.

1. Introduction

In early urban construction planning, the conventional bus is often the most important one. Reasonable conventional bus line network planning plays a very important role in improving the service level and overall efficiency of the public transport system and optimizing the urban traffic structure [1]. However, the existing public transport system often suffers from congestion-prone roads, low route network density and long routes. The reason for these problems is largely due to the unreasonable placement of bus stops and the line network. Therefore, optimizing the placement and network of conventional bus stops is helpful to increase the share of public transport and fundamentally reduce the current urban road congestion. The worldwide spread of the COVID-19 virus has seriously affected the development of public transport. Most people believe that taking public transport carries the risk of infection [2]. Through a cross-sectional survey conducted in eight cities in China, we found that passengers’ satisfaction with public transport has decreased significantly in the epidemic. It is urgent for us to take measures to improve people’s happiness when using public transport [3]. The simplest way is to optimize the layout and network of existing bus stops.
Researchers at home and abroad have done a lot of research on the placement of conventional bus stops and the optimization of the line network. In terms of placement optimization of conventional bus stops, scholars have used various large models. Based on the principle of complementarity and by analyzing the relationship between rail transit and conventional bus transit, Bing [4] put forward a BP neural network model to solve the optimization problem of conventional bus transit lines under a collinear line operation. Herrera [5] used a gravity model to conduct quantitative research on the location of conventional bus stops. Chen [6] established a bilevel programming model to optimize the distance between bus stops. Stephen [7] constructed a location model based on an univariate density estimation and a multivariate density estimation; the results show that the result accuracy of the univariate density estimation location method is higher. Ns [8] used a particle swarm optimization algorithm and genetic algorithm to study the placement of bus stops on the GIS platform and modelled the location of bus stops on the GIS platform, which greatly reduced the complexity of research on the placement of bus stops due to the existence of complex streets; according to the results, the travel time and transfer time of passengers were compared in the actual streets to confirm the feasibility of the model. Other researchers focused on the impact of different traffic environments. Zhang [9] studied the impact of road space allocation on bus departure frequency and other operating conditions, and proposed the placement of bus demand–response stations and corresponding departure frequency under different road space conditions. Zamanian and Peiravian [10] proposed a new multi-step heuristic location method based on the existing network and other traffic factors, including the location of existing bus stops, adjacent land use, construction cost, node connectivity and system accessibility. Roy and Basu [11] studied the infrastructure of pedestrian transfer space between bus stops and between rail transit stops and bus stops; they identified the area by using a two-dimensional fuzzy c-means algorithm, and then studied the service level of passenger–pedestrian transfer. Li [12] studied the supply–demand relationship between the number and capacity of bus stops in urban areas, using the spatial statistical method to establish the coupling degree between potential activities in urban space and the distribution density of bus stops, and to evaluate the relationship between supply and demand. Some scholars have also carried out simulation research. Liu [13] carried out simulation research with analogic software, and combined with the delay model theory, provided an improved method for station placement. Liu [14] analyzed the bus tracks in different areas of urban road sections, intersections and station locations based on the time–distance track diagram, proposed staggered bus stop placement scheme and conducted a simulation analysis. Against the background of intelligent transportation, Duan [15] proposed an artificial intelligence algorithm, the ik-NN algorithm, to optimize the setting of urban bus stops and reduce the technical complexity and high cost of existing bus stop optimization.
In the field of optimization of conventional bus line networks, some scholars have studied the structure of road networks. Daganzo [16] and Sivakumaran [17] studied the optimal design of public transport networks against the background of rail transit in the square and radial road networks. Ting [18] established a multi-objective optimization model of public transport networks aimed at minimizing the operation cost of public transport and the average travel time of residents. Other scholars used genetic algorithms. Król [19] took a city in Poland as an example, and used a genetic algorithm and Taguchi method to calculate the optimal operation network structure of a bus, so as to achieve the goal of minimizing the total transportation demand time of vehicles. Dib [20] proposed using a genetic algorithm combined with a variable domain algorithm to solve the shortest path problem of the public transport network. At the same time, there are various models or mathematical functions. Based on the temporal and spatial distribution law of travellers, Zhao [21] applied the integer programming method to the network system planning of conventional bus transit and established a multi-objective optimization model to improve the operation efficiency of a conventional bus. Amirgholy [22] proposed a continuous approximate model based on the minimization of user travel cost and operator investment cost, and achieved the goal of minimizing the total cost of the transportation system through the scheme design of a public transport hybrid network and parallel network with rail transit. Shi [23,24] discussed the factors affecting the supply and demand of public transport services, put forward the evaluation index system of public transport route optimization effect, and established the comprehensive evaluation model of public transport route optimization by using the Analytic Hierarchy Process (AHP). In addition, scholars are constantly trying new research methods. To improve the operation efficiency of the public transport network, Hu [25] used the ACO method to design ideal road network indicators on existing bus lines to evaluate the performance of the road network, and introduced a punishment mechanism to eliminate infeasible lines, so as to realize the selection of the optimal bus network with efficient operations. Dakic [26] applied the three-dimensional macro basic diagram to solve the problem of optimal public transport network design under the condition of free-flow or saturated flow.
To sum up, there have been relatively mature research systems and methods on the coordinated development of rail transit and conventional public transport. Although different objective functions have been established according to different indicators, it is difficult to solve them mathematically. For conventional bus station layout optimization and line network optimization, researchers often only choose one of them for research at a time, and rarely propose optimization and adjustment methods for conventional bus networks from a global perspective with quantitative methods. This study introduces the concept of the Voronoi diagram into the optimization model, and takes the Voronoi diagram as the service area of bus stops. By establishing the evaluation model, the station with the smallest average walk time of regional passengers is regarded as the conventional bus stop. After determining the placement of the bus stop, the overall line network in the indirectly affected area of the stop is adjusted and optimized. Take the coverage rate of the conventional bus line network, the degree of collinearity with rail transit, the service rate of the line network station and the per capita travel time of residents from the bus to the rail transfer station as parameters to find the optimal solution. The optimization model and algorithm of the conventional bus line network in the affected area of the transfer hub are established by repeatedly iterating to minimize the value of the objective function. Finally, taking the Wuhan East Lake demonstration area as an example, two bus system optimization schemes are obtained, and the bus line repetition coefficient, per capita transfer time, bus line network coverage and station service rate before and after optimization are compared.

2. Research method

2.1. Division of Public Transport Service Community Based on Voronoi Diagram

A Voronoi diagram is a set of continuous polygons consisting of vertical bisectors connecting two adjacent point segments [27]. The specific production process of the Voronoi diagram is shown in Figure 1:
The concept of the “Voronoi diagram” was introduced into the field of public transport. The dividing line of two bus stops was the vertical bisector of the line between two points. The vertical bisector of two bus stops can divide the whole plane into two parts. The interval between any point in each part and the bus stop in the same part was smaller than the distance between this point and another bus stop. Therefore, when there were more than two pairs of bus stops in the optimized area, the whole plane can be divided into multiple Voronoi diagrams containing one bus stop, and the distance between any point in the polygon and the bus stop in the area was the smallest. Therefore, when dividing the optimized area into Voronoi diagram service areas, it is only necessary to input the coordinates of discrete points in the current area into the algorithm, and then the optimized area is divided into several polygon areas, which are the service areas of each bus stop.
In this study, it was assumed that all passengers in the area choose the closest bus stop to the starting point. Studies have shown that residents hope that the walking time from the travel point to the bus stop does not exceed 8 min, that is, the distance does not exceed 500 m [28]. When most travelers find that the nearest bus stop does not have a bus to their desired destination, but other stops need to travel longer distances, they prefer to choose the nearest stop and then transfer to their destination. The bus stops referred to here are a pair (i.e., stations in opposite directions). The midpoint of the connecting line between the two bus stops is taken as the specific coordinates of the discrete points. For one-way bus stops in some areas, the coordinates of this stop can be used as discrete point coordinates first. If the area of the Voronoi diagram established by this stop is too small, it can be combined with the surrounding polygon area according to the actual situation. Each passenger in the Voronoi diagram is the service object of the bus stop in the area. Each passenger can come from different starting points, and their distance to the bus stop may also be different. It is very difficult to understand the time and workload of each passenger at the bus stop in the area. Therefore, in order to simplify the workload of the optimization process, the passengers in the service area can be partitioned. The basis of zoning is mainly to understand the travel demand distribution of passengers in the service area through the land use in the service area, and then divide the distribution areas of passengers according to the distribution of passengers. These passenger distribution areas are called generation sources. By investigating the travel sources in each service area, we can determine the center of gravity of travel density distribution in the area, which is also the centroid of the community. Usually, for the convenience of calculation, the centroid of each community is set as the bus demand point. The occurrence source here can be a residential area, a commercial building, an office building or a school. If a residential area belongs to two different bus stop service areas, the occurrence source of the residential area can be divided according to the location of the entrance and exit of the residential area. Different occurrence sources can be numbered differently. The travel time from different occurrence sources to the bus station can be regarded as the travel time of all passengers in the area to the bus station.

2.2. Generation of Candidate Station Set for Conventional Buses

This study evaluates the convenience of passengers in the service area by taking the average walking arrival time of these passengers as the main index. When the average arrival time of passengers in a public transport service community cannot reach the optimization goal, this community was called a public transport expansion area. Adjusting the station location in the bus expansion area can shorten the average arrival time of passengers in the area and achieve the expected optimization goal. For the optimization and adjustment of station location in the public transport expansion area, the set of candidate station location points can be established by combining discrete points and continuous locations. The limited bus candidate sites were analyzed and evaluated, and the station with the smallest average pedestrian arrival time in the area selected by the evaluation model was regarded as the final construction point.
According to whether the candidate conventional bus stations exist in the existing conventional bus line network, the candidate stations can be divided into existing candidate stations and new candidate stations. In this study, in addition to ensuring that the starting and ending stations of each bus line remain unchanged, on the premise of ensuring the expected optimization effect, the original bus stops are retained as much as possible according to the principle of economy, and unreasonable stops are optimized. For service areas where the land placement has not changed significantly, new candidate stations are generally not considered. The location selection of candidate stations for the conventional bus should fully consider the surrounding land use and development intensity, and make a comprehensive decision in combination with the specific conditions of the road section, the laying of signal lights, the walking distance of passengers and other factors. For the site selection of candidate bus stations, the following principles should be followed:
  • The location of candidate bus stations should give priority to the main sources of passengers, such as urban rail stations, business centers, transportation hubs, schools, hospitals, administrative units, residential areas, long-distance passenger stations, railway stations, etc.
  • To facilitate passengers’ ride and transfer, the candidate stations are preferred near the intersection, but the delay time of bus vehicles, the interference to the intersection capacity and traffic flow, and the impact on pedestrian safety need to be fully demonstrated.
  • If a station is set at the intersection of high-level and low-level roads, the station of its turning line shall be preferentially set on high-grade roads.
  • The distance between the intermediate stops of the urban line and the suburban line of the conventional bus is 500–600 m and 800–1000 m, respectively, and the distance between the urban line and the suburban line of the large bus stop express is 1500–2000 m and 1500–2500 m, respectively.
  • Within the polygonal service area, the repetition rate of 500 m coverage of two discrete points shall not exceed 40%. In the actual site selection process, after the alternative bus stop location is determined, the actual situation at the stop is known. The more passengers at the alternative station and the shorter the distance for passengers to reach the alternative station, the more reasonable the location and traffic direction of the road section.

2.3. Establishment of Optimization Model

2.3.1. Optimization Model for Conventional Bus Stop Placement

The denser the distribution of passengers around the bus station and the shorter the time for passengers to arrive at the bus station, the shorter the average walking time of passengers in the community is. Therefore, the location of the bus station should give priority to the main source of passengers.
In the transfer community, a candidate station for conventional buses is established at the rail transit station. By comparing the average walking arrival time of passengers in the two site selection schemes, it was decided whether to choose this point as the connecting and transfer hub between rail transit and conventional bus. Passengers in the area include passengers from existing sources and indirect passengers transported to the area by rail stations.
According to the actual situation, the arrival time of passengers in the area was directly proportional to the travel speed of passengers and inversely proportional to the distance, that is:
t i = S i V i
where t i —the time required for the i t h passenger to reach the discrete point;
V i —the average speed of the i t h passenger reaching the discrete point, and the walking speed is 5 km/h;
S i —the walking distance of the i t h passenger to the discrete point.
Assuming that there are n passengers in the polygonal area who choose bus travel, the calculation formula of the average pedestrian arrival time of passengers in this area is as follows:
t r = 1 n i = 1 n t i
Since the workload of understanding the time of each passenger to the bus station in the area was very large, this study took the walking time from the source to the bus station as the walking time of all passengers from the source to the bus station through the division of the source of passengers in the service area. Through the investigation and analysis of the service area, we can understand the distribution of passengers in the area and divide the source of passengers. The influencing factors considered in the model mainly include the number of passengers in the service area and the time from each source to the bus stop. Among them, the number of passengers was mainly related to the land use nature, floor area and land development intensity of the source. The land development intensity was mainly expressed by the plot ratio index. The time from each source to the bus stop was mainly related to the distribution of the source.
The number of passengers from all sources in the community is:
m = j = 1 S j × γ j × μ j + η × n t
where S j —the floor area of the j t h source;
γ j —plot ratio of the j t h generation source;
μ j —the occurrence coefficient of the j t h generation source can be obtained after the investigation and summary of similar buildings;
n t —average daily passenger flow of rail station;
η —proportion of indirect passenger flow of rail transit.
The passenger flow snatched by the rail station was related to the degree of collinearity of the bus line passing through the bus station. The higher the degree of collinearity of the bus line and rail transit, the greater the passenger flow snatched. The calculation formula of collinearity is:
ϕ = collinear   length   with   track total   line   length = i = 1 l i i = 1 S i
Proportion φ = ω ϕ of passenger flow snatched by rail stations, where ω is the influence coefficient of passenger flow on the same line, which is related to the passenger flow distribution of conventional bus lines. The average pedestrian arrival time of passengers in the service area is:
t r = j = 1 ( 1 φ ) S j × γ j × μ j × t j + η × n t × t t j = 1 ( 1 φ ) S j × γ j × μ j + η × n t
where t j —the time for the j t h generation source to walk to the conventional bus stop;
t t —time to walk from rail station to conventional bus stop;
φ —the proportion of passenger flow occupied by rail stations in conventional bus transit.
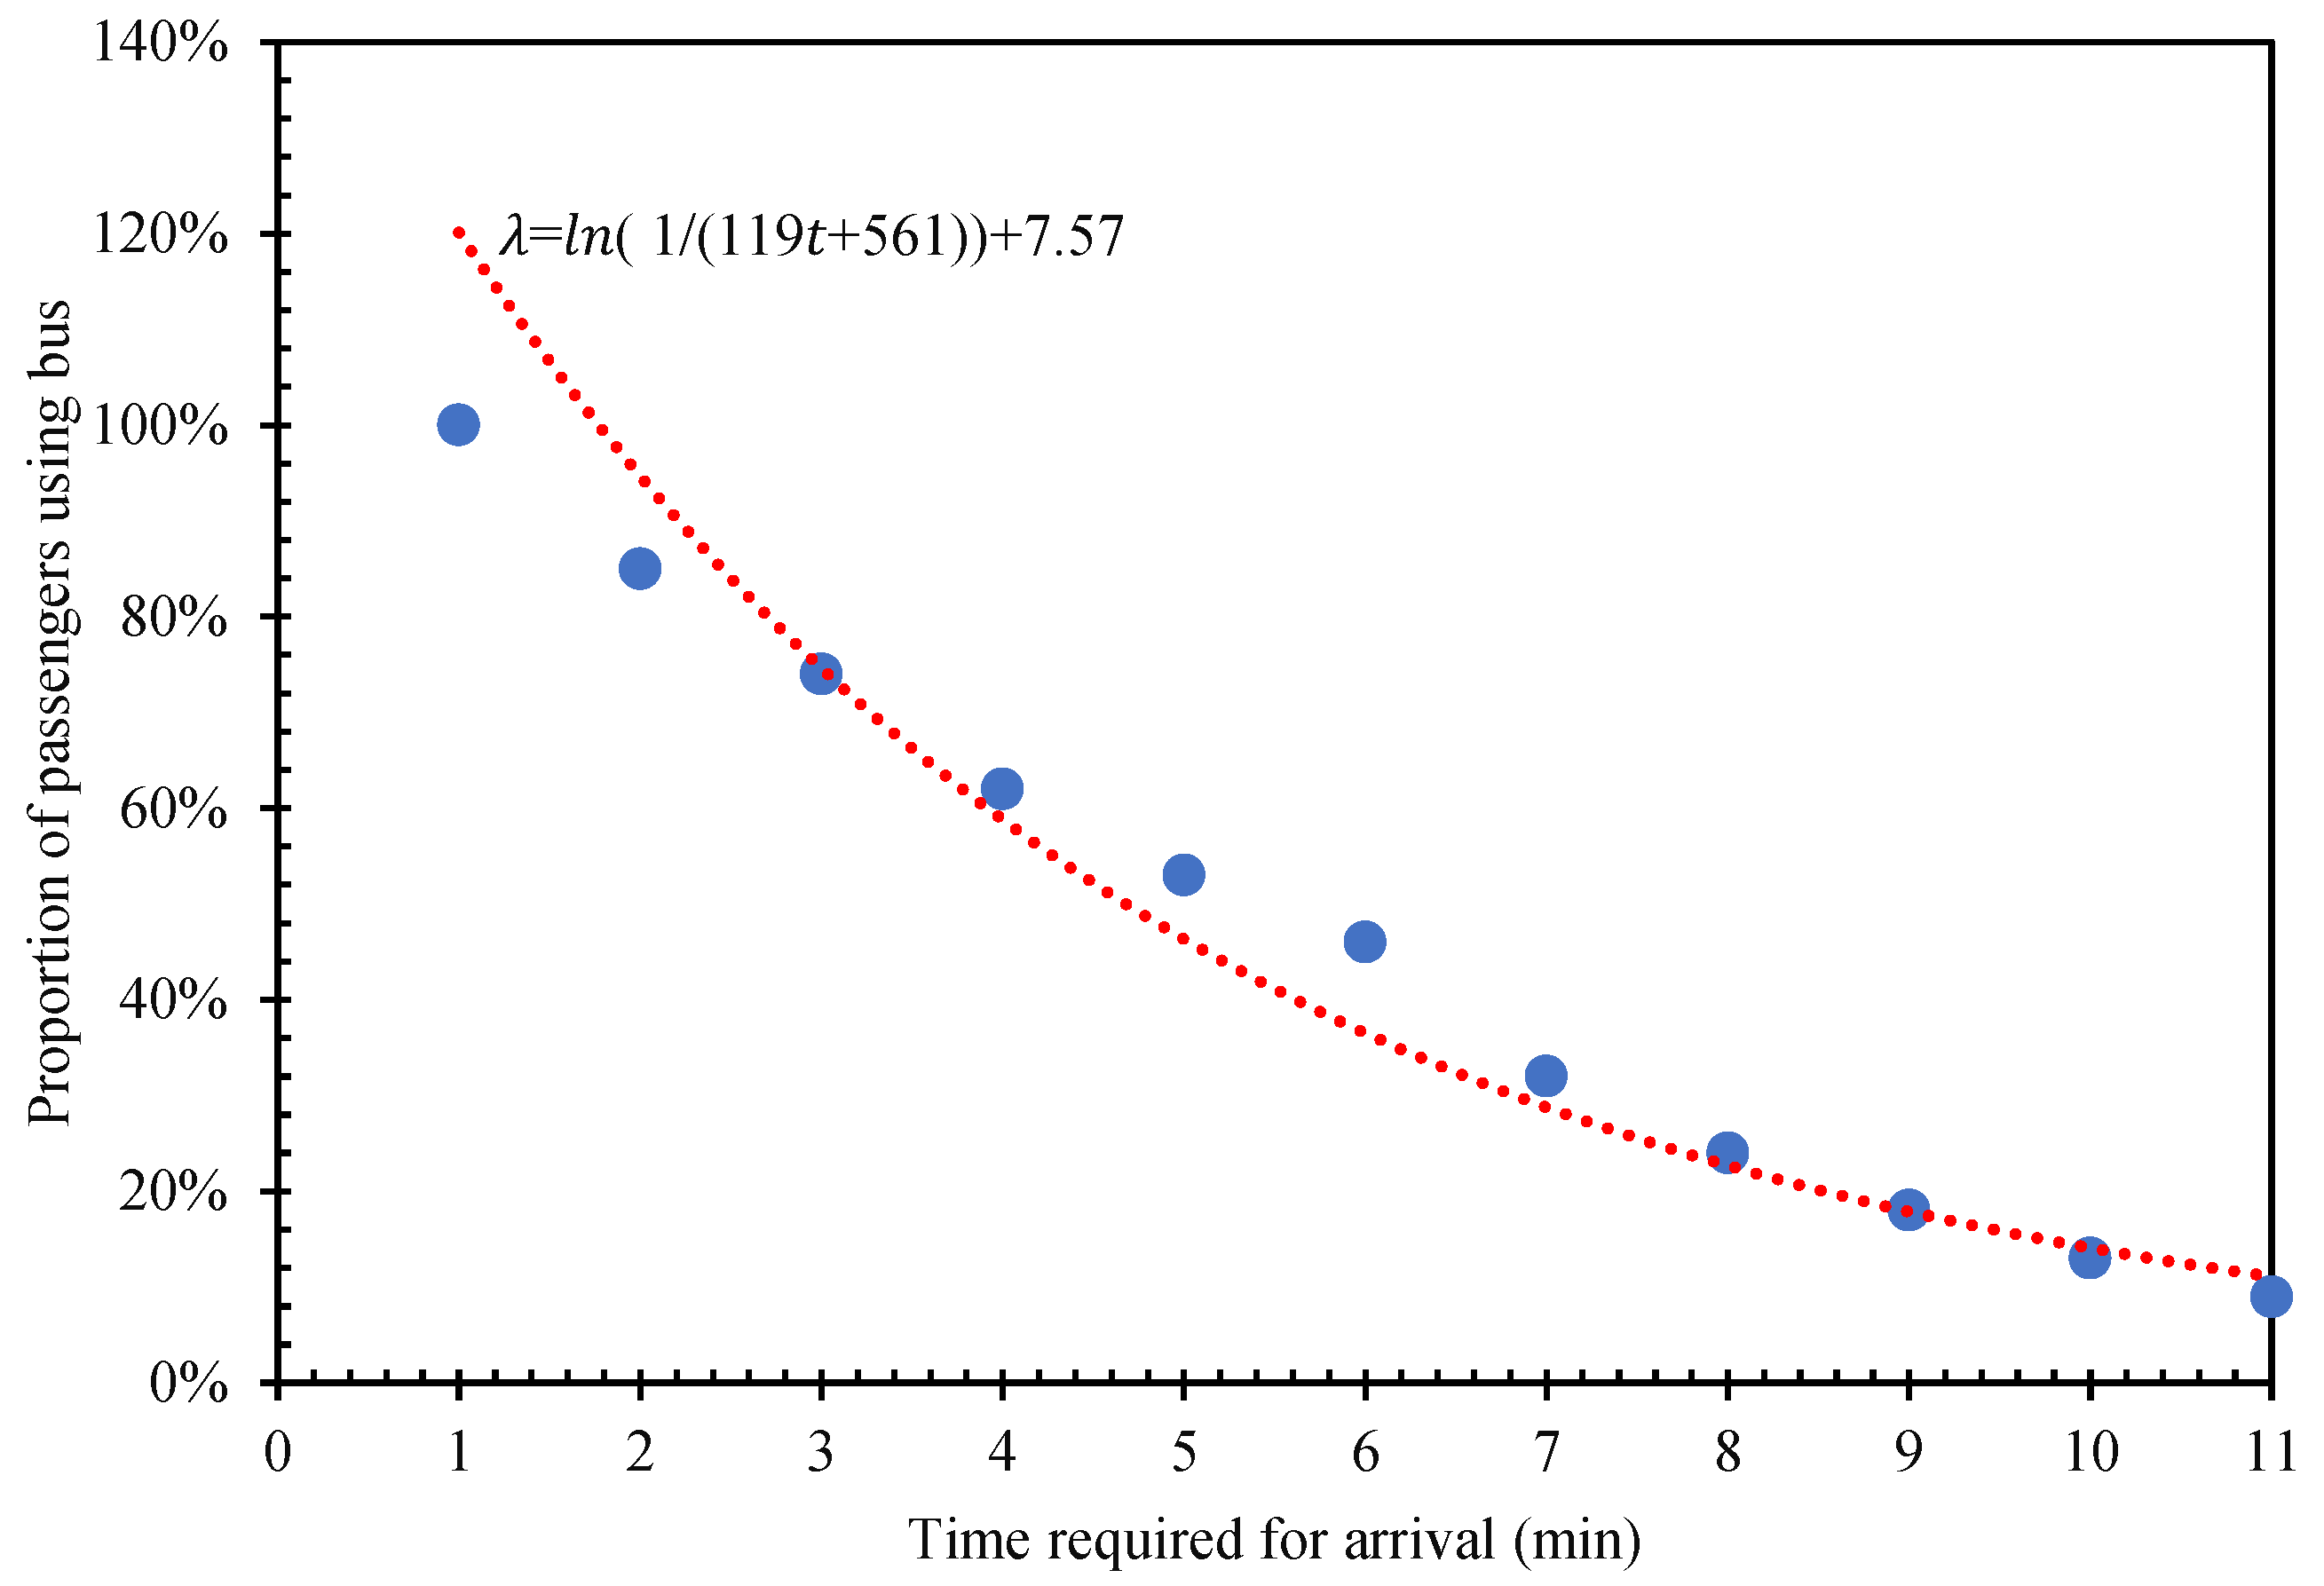
The closer the passenger departure point is to the bus stop, the more convenient it is to take the bus, and the higher the travel sharing rate of regional buses is. In the study of bus service radius and service level, it was assumed that there was a logarithmic relationship between bus travel rate and the time required for passengers to walk to the station. The relationship between bus travel rate and walking to the station is established as follows:
λ = l n ( 1 r t + α ) + β
where t is the time required to walk to the bus stop, λ is the share rate of public transport in the area and r , α and β are the influence coefficients, which need to be determined according to the survey data.
In the non-transfer area, after calculating the average walking arrival time of passengers in the area through Formula (5), the bus sharing rate in the service area can be obtained according to Formula (6). If the optimization goal can be achieved, the service area is positioned as a built-up bus area. If the optimization goal is not achieved, it is positioned as a bus expansion area. For the bus expansion area, the location of bus stops can be adjusted or new bus stops can be added according to the actual situation to establish a collection of candidate conventional bus stations, and the optimal bus stop placement scheme can be selected through the evaluation model.

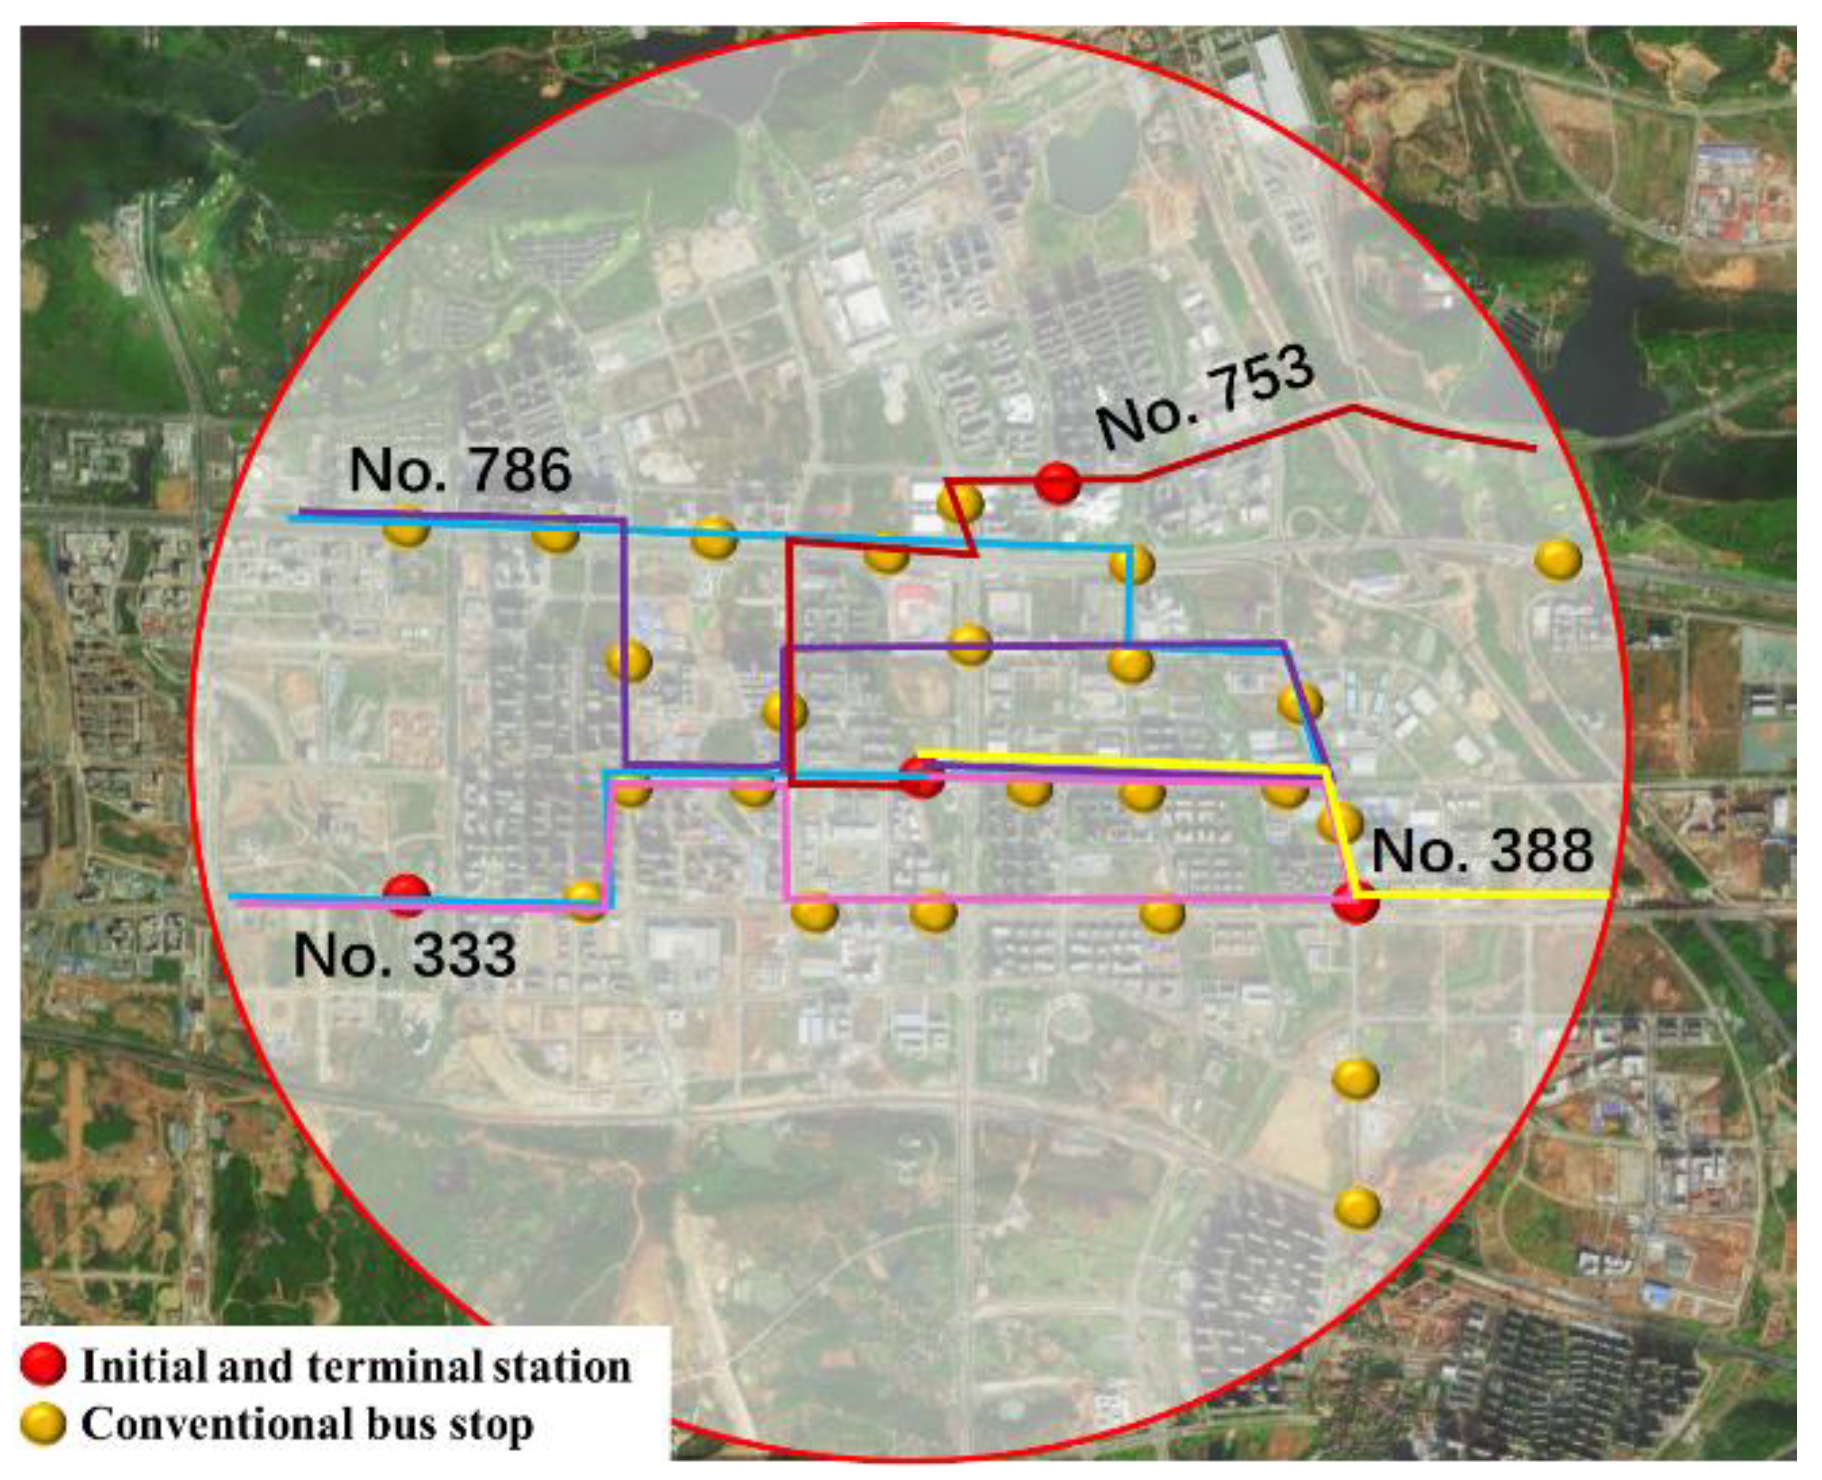
2.3.2. Optimization Model for Conventional Bus Line Network

After determining the connection and transfer hub station, it was also necessary to adjust and optimize the overall network in the area indirectly affected by the station. During the optimization and adjustment of the conventional bus line network, the passenger OD matrix of these lines was obtained through investigation, and the lines that can transport a large number of direct passengers were regarded as reserved lines. Some lines that were not in good competition with rail transit were adjusted, some other lines whose direction was inconsistent with the passenger flow direction were cancelled, and the new bus lines were determined and optimized into a network. This study aims to minimize the per capita travel time of residents going to rail transfer stations by bus, to maximize the service area rate of line network stations and minimize the collinearity with rail transit. Under certain constraints, the optimal solution or approximate optimal solution of the objective function can be obtained through local adjustment of the line.
The public transit network is a compound concept. The target model of the public transit network mainly includes the following four parameters:
  • Line network coverage
Line network coverage refers to the proportion of conventional bus line network in the length of urban roads.
Max   χ = total   length   of   existing   bus   lines total   length   of   passable   road
2.
Collinearity with rail transit
When the conventional bus line is perpendicular to the rail line, they form a complete cooperative relationship. At this time, the conventional bus provides the role of gathering or evacuating passenger flow for rail transit. The lower the collinearity between conventional bus transit and rail transit, the weaker the competitive relationship and the cooperative relationship between them becomes.
Min   ϕ = collinear   length   with   track total   line   length = i = 1 l i i = 1 S i
3.
Network station service rate
The station service rate of the conventional bus line network reflects the possible ratio of residents to choose bus travel.
Max   γ = i L m s i S
where γ —network station service rate;
L m —collection of conventional bus lines connected with rail transit;
Si—number of bus trips in community served by conventional bus stop i ;
S—total travel volume in rail transit affected area;
4.
Per capita travel time of residents from bus to rail transfer station
Min   T = i B j G ( z i + T i j + h j ) m i i B m i
where T—per capita travel time of bus transfer;
m i —passenger flow of service area i ;
T i j —time from the first service community i to the transfer station j by bus;
z i —average walking time of service community i to station;
h j —time from transfer station j to transfer track station;
B—collection of conventional bus stops in the area affected by the transfer hub;
G—collection of conventional bus stops for transfer with rail transit.
The goal of this study is to reasonably adjust the existing conventional bus line network structure, enhance the competitiveness of bus travel and attract more passengers to choose bus travel. Therefore, this study takes Equations (7)–(10) as the objective function and weights the four parameters to find the optimal solution. Since Equations (7) and (9) seek the maximum and Equations (8) and (10) seek the minimum, this study takes the reciprocal of Equations (7) and (9) to make its optimization direction consistent.
The mathematical model is as follows:
Min   Z = λ 1 χ + λ 2 ϕ + λ 3 γ + λ 4 T
where λ 1 , λ 2 , λ 3 , λ 4 are the weight coefficients of four parameters, which shall be determined according to the personal will of the decision maker.
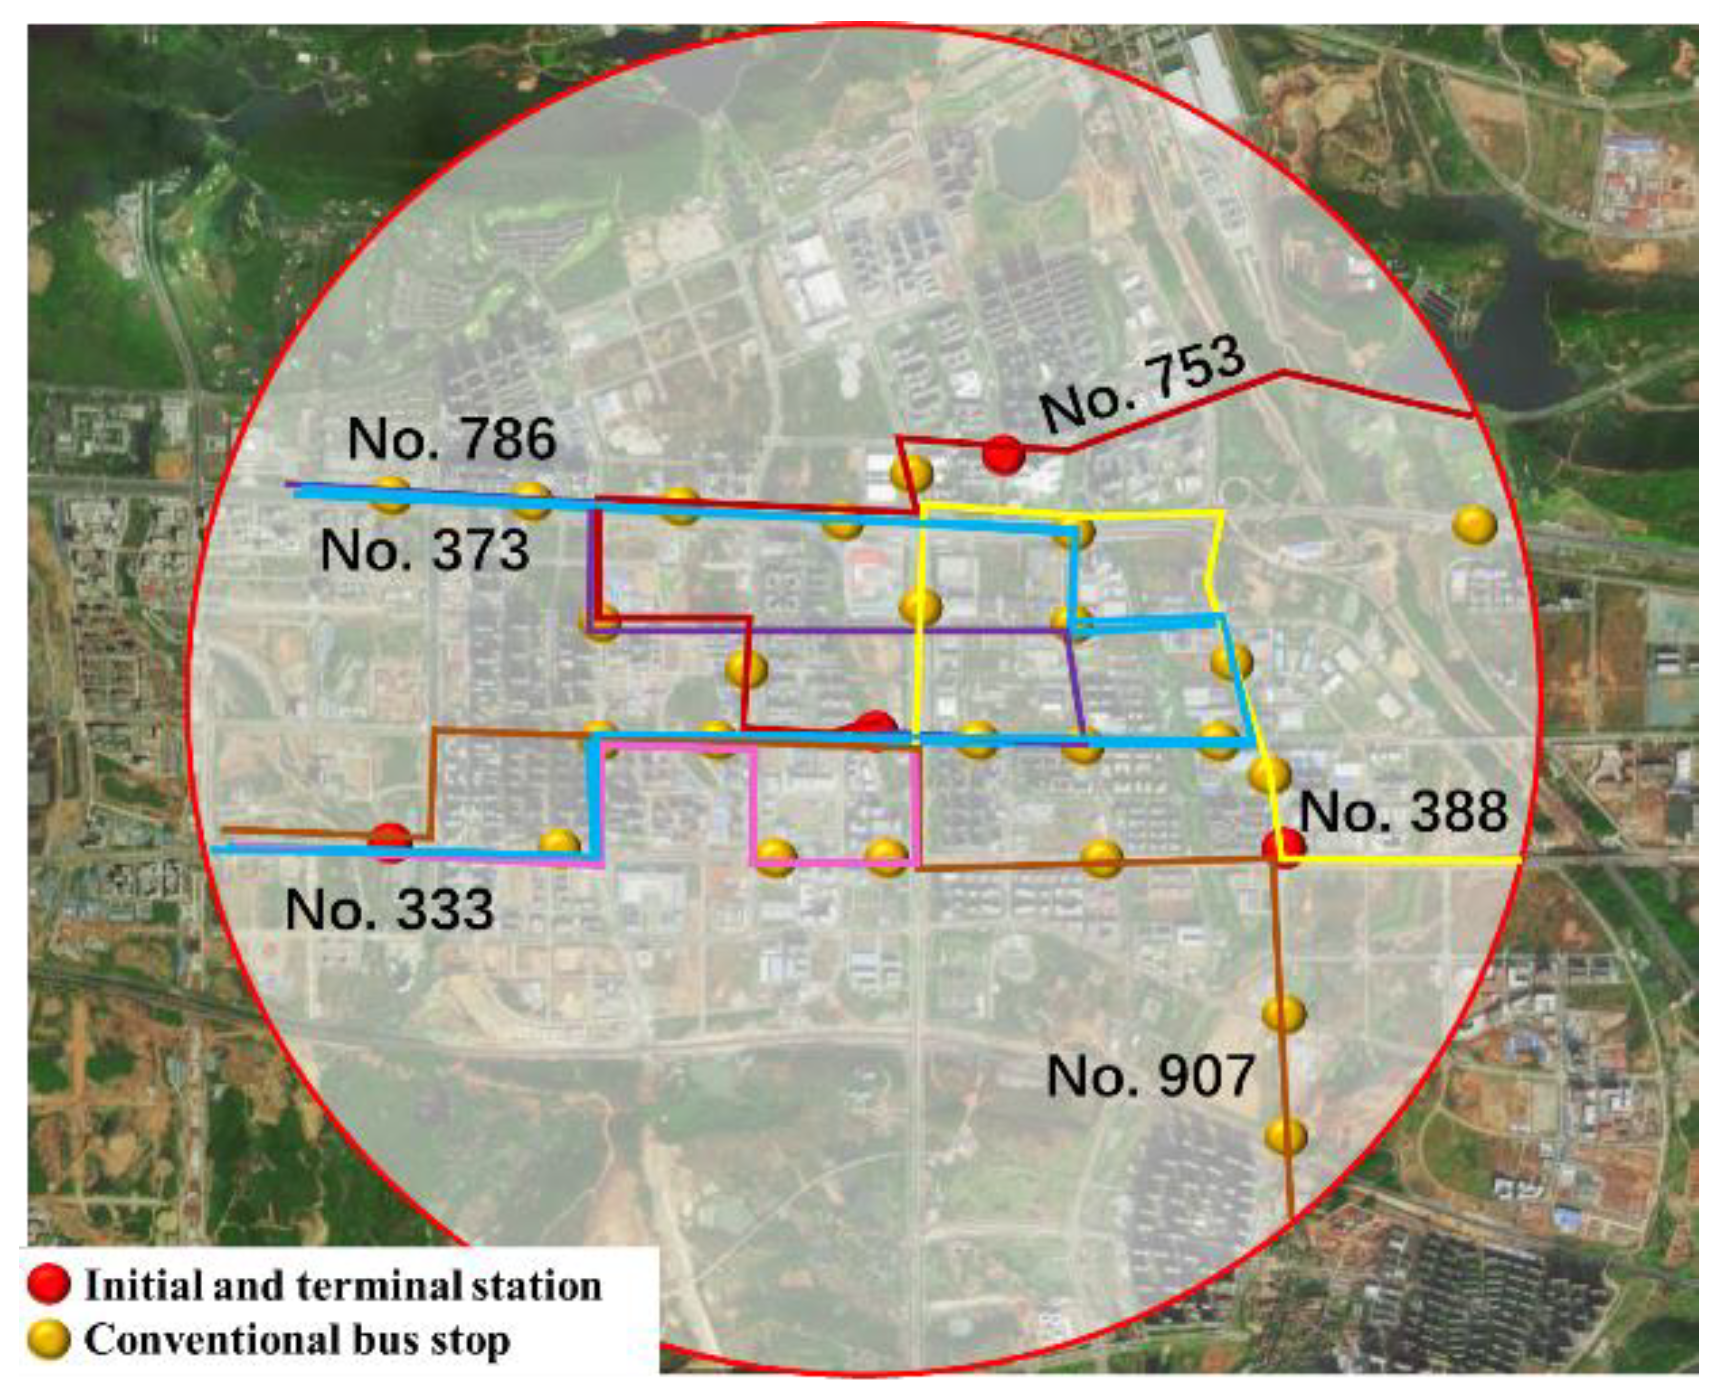
This study adopted the heuristic optimization method based on the current bus network. After the optimization of the layout of conventional bus stops, the starting point and ending point of each connecting bus line remains unchanged. Through different combinations of conventional bus stops, the candidate line set of bus lines was established, and the minimum combination of the target model was selected as the optimal solution of the line.
There are too many possible combinations of a bus line. To reduce the workload of finding the optimal line, it was necessary to set some constraints to screen the candidate lines, so as to make the obtained optimal line more practical. This study mainly restricts the candidate lines through the line length, non-linear coefficient and direct passenger flow.
5.
Line length
According to The Code for Planning and Design of Urban Road Traffic, the maximum limit calculation formula of conventional bus lines is:
L m a x = V × T m a x
where T m a x —maximum one-way travel time consumption of 95% of urban residents,
V —average travel speed of urban public transport.
According to the research and statistics of some scholars, small cities can generally be set at 6–10 km and large cities at 10~15 km.
6.
Non-linear coefficient of line
The non-linear coefficient refers to the ratio between the actual line length between the initial and terminal stations of the bus line and its spatial straight-line distance. According to The Code for Urban Road Traffic Planning and Design, the non-linear coefficient of the line is U i 1.4 .
7.
Direct passenger flow of the line
A good bus line should meet the needs of more direct passenger flow as much as possible, and a relatively direct line can meet the needs of more direct passenger flow. From the perspective of bus line service function, it is obvious that it should be the first choice of bus line. The direct passenger flow served by a bus line is:
Q L D = i = o D j i D d i j       i , j X O D
where Q D L —direct passenger flow of bus line L,
d i j —Travel demand from service area i to service area j ,
X O D —Conventional bus lines from starting point to finishing point.
According to the above formula, the direct passenger flow of each candidate line can be calculated. Combined with planning experience and actual conditions, the minimum direct passenger flow of bus line l is taken as the condition for filtering, so as to further reduce the solution space of bus candidate lines, i.e., Q D L Q D L m i n .
Based on the above discussion and analysis, the final optimization model is as follows:
Min   Z = λ 1 χ + λ 2 ϕ + λ 3 γ + λ 4 T s . t . { L m a x V × T m a x U i 1.4 Q D L Q D L m i n
where χ represents the coverage of the network, ϕ refers to the collinearity between the conventional bus line network and rail transit, γ is the service rate of line network stations, T represents the per capita travel time of residents from bus to rail transfer station, Z is the target value of network optimization, λ 1 , λ 2 , λ 3 , λ 4 represent the weight coefficient of the target, and the selection of the weight coefficient is determined according to the will of the decision maker.

3. Empirical Research

3.1. Instance Background

The Wuhan East Lake National Independent Innovation Demonstration Zone (hereinafter replaced by East Lake demonstration area) is a rapidly developing new area in Wuhan. The scope of this study was the whole East Lake demonstration area in Wuhan, covering an area of about 518 square kilometers. Taking the public transport network in the East Lake demonstration area as the research object, taking the opened subway line 2 and tram lines T1 and T2 as the background, and focusing on the optimization of conventional bus transit, this study established the optimization model for bus stops and network, and put forward the optimization design scheme based on the detailed investigation and analysis of the general situation, bus placement and passenger flow of the region. The optimization scope and regional road networks of this sub-region are shown in Figure 2:
The population distribution of the optimized area is shown in Figure 3:
According to the Wuhan traffic information system and the statistics of passenger boarding and alighting information at various bus stops in the East Lake demonstration area, the current daily average regular bus passenger flow in the East Lake demonstration area is about 906,700 persons. In terms of time, the public transport passenger flow in the East Lake demonstration area has an obvious peak in the morning and evening. In terms of space, the passenger flow inside the third ring road of Wuhan is large, and the passenger flow outside the third ring road of Wuhan is small. There is an obvious imbalance in the intensity of passenger occurrence at each bus stop, as shown in Figure 4.
By investigating and analyzing the location of 692 conventional bus stops in the East Lake demonstration area, and according to the method of dividing the district with the Voronoi diagram, as described above, the specific coordinates of 311 discrete points, that is, 311 conventional bus stop service districts, can be determined. The public transport service community in the East Lake demonstration area is shown in Figure 5:

3.2. Application of Optimization Method

3.2.1. Placement Optimization of Conventional Bus Stops

In the East Lake demonstration area, the conventional bus station not only needs to solve the travel and distribution problems of residents in the area, but also needs to provide transfer services for the passenger flow of rail transit stations. After a detailed investigation of the existing conventional and rail transit stations, the service areas to which the rail transit stations belong were identified, named and numbered as bus interchange areas. Then, the land use layout and land use intensity of the transfer district were fully investigated and divided in detail. Since there are many entrances and exits of subway stations, there can be different conventional bus stations to transfer with them. Therefore, a subway station can belong to multiple service communities. The distribution of bus transfer communities in the East Lake demonstration area is shown in Figure 6:
The acceptable arrival time of residents in the East Lake demonstration area is investigated. The survey results are shown in Table 1:
According to the relationship model between bus trip rate and pedestrian arrival time established above, combined with the survey data, the relationship function between the proportion of passenger bus trips and arrival time in the East Lake demonstration area is as follows:
λ = l n ( 1 119 t + 561 ) + 7.57
The function image is shown in Figure 7:
This optimization aims at 45% of the bus travel proportion. Strictly control the time spent by each community passenger walking to the bus stop, and optimize the location of the community bus stop that does not meet the target requirements to ensure that the overall travel of the region meets the 45% bus travel target.
We took the No.20 transfer community as an example to optimize the bus service community. As shown in Figure 8 below, the community has two tram stops and one conventional bus stop. Considering that Engineering University Liufang tram station is located on the Third Ring Road and cannot be accessed by conventional bus, the station is only used for transfer between tram and tram, which has no impact on the site selection of conventional bus stops. Therefore, the optimization of conventional bus stops in the community only considers the impact of Liufangyuan Henglu tram station. According to the internal land placement of the community and the location of the entrance and exit, the occurrence sources of the community can be numbered. It can be divided into five occurrence sources, in which the occurrence source 1 and the occurrence source 2 have multiple entrances and exits, and the occurrence sources 3, 4 and 5 have only one entrance and exit, as shown in Figure 8. Assuming that the passengers in each origin are evenly distributed, the number of passengers served by origins 1 and 2 at the bus stop can be calculated according to the area of its service community, and the number of passengers in origin 3, 4 and 5 is all passengers in these three origins.
Investigate the floor area, plot ratio and walking time to discrete points of each source in the service area. Through calculation, we can get the average walking arrival time and bus travel sharing rate of the service area. The economic and technical indicators of the service area are shown in Table 2:
Without considering the rail station, the number of passengers and walking arrival time were brought into the model. It was found that the average walking arrival time of the service community was about 3.22 min, which can meet the requirements of 62% of passengers for walking arrival time and achieved the goal of 45% bus sharing rate.
After the tram is put into operation, the conventional bus stop not only needs to solve the travel and distribution problems of residents in the region, but also needs to provide transfer services for the passenger flow of rail transit stations. According to the survey, there were 781 and 788 buses stopping at the conventional bus stop. The collinearity between the conventional bus line and the tram line was 0.38, and the influence coefficient was 0.93. The relevant indicators are shown in Table 3.
The candidate stations of conventional bus transit were selected to be established at rail transit stations, and the relevant indicators at the candidate stations are shown in Table 4:
According to the data analysis in the table, compared with the original passenger flow of the community, there were fewer passengers who chose to transfer here. It was meaningless to use this point as a transfer hub for connecting rail transit and conventional bus. According to the model, the average walk to the station time of the original service community was about 3.13 min. If the conventional bus stop of the community was transferred to the candidate station, the average walking time to the station of the service community was about 3.86 min. Through comparison, we chose to keep the location of the original conventional bus stop unchanged.
The locations of bus stops in each transfer community were optimized. By comparing the average walking arrival time of passengers in the area before and after the connection, it was decided whether to set up rail transit and conventional bus transfer hubs there. Finally, it was determined to set up rail transit and conventional bus transfer hubs in seven transfer districts: 2, 5, 8, 15, 17, 23 and 32. When it was necessary to take the conventional bus to the rail transit station, the service radius of the rail transit station was generally 2.6–4.1 km. Combined with the actual situation of the East Lake demonstration area, it was determined that the service radius of the rail station of Metro Line 2 was 4 km and the service radius of the rail power station was 2.6 km.
From the display and analysis of the optimization results of the bus stops in the above single service community, it can be seen that the design optimization method in this study has an obvious effect on selecting the connection and transfer hub between rail transit and conventional bus, and on improving the proportion of bus travel.

3.2.2. Optimization of Conventional Bus Line Network

In this study, we used the test algorithm method to optimize the conventional public transport network, that is, the method of generating the optimal design scheme of the public transport network through line optimization. After the connection and transfer hub between rail transit and the conventional bus is determined, the overall connection network needs to be adjusted and optimized.
Within the indirect influence of rail transit, some lines that were less competitive with rail transit should be adjusted one by one, optimized into a network, and repeated iteratively until the objective function value reaches the minimum value and does not change.
  • Display and analysis of optimization results of single service cell
Taking the No. 32 transfer service area as an example, the conventional bus lines that stop at the transfer hub were selected, and the OD matrix of the passenger flow of these lines was obtained through investigation. The lines that can transport a large number of direct passengers were reserved, and the remaining lines were the main optimization objects. According to the field survey, there were 27 conventional bus stops within the indirect influence range of the No. 32 transfer hub, as shown in Figure 9:
According to the survey, five conventional bus lines stopped at the transfer hub. In this optimization, No.373 (inner ring) lines were retained, No.333, No.388, No.753 and No.786 were taken as the main optimization objects, and the bus network was established, as shown in Figure 10 below. The data in the network were the bus travel time (including traffic lights and parking time), the average interval speed of the bus is 20 km/h, and station 1 was the transfer hub between the tram and the conventional bus.
Bus lines No.333, No.388, No.753 and No.786 all started from station 1 and ended at the most peripheral conventional bus stop in the affected area. The bus lines of 333, 388, 753 and 786 were optimized, while the starting and ending points remain unchanged. Among them, the route of bus No.333 was 1—P—Q—R—S—T—U—V—W—O—N—X—Y, the route of bus No.388 was 1—P—Q—R—S—T, the route of bus No.753 was1—L—D—E—F and the route of bus No.786 was 1—P—Q—R—M—K—J—L—O—N—I—B—A. The direction of conventional bus lines passing through this transfer station in the indirect impact area of the track is shown in Figure 11 below:
The line length constraint and non-linear coefficient constraint of the four lines were tested with the starting and ending points unchanged. The results are shown in Table 5:
In the affected area, the lower limit of the length of the bus line was 2 km and the upper limit was 4 km, which was taken as the length constraint of the bus line. Judge whether the direct passenger flow of the line meets the conditions according to the planning experience and the investigation of public transport companies. After screening, the candidate line set between each starting and ending point is obtained as shown in Table 6:
The goal was to maximize the line network coverage, minimize the collinearity with rail transit, maximize the line network station service rate and minimize the average transfer time from residents to rail stations. Taking λ 1 = 0.3 ,     λ 2 = 0.2 ,     λ 3 = 0.1 ,     λ 4 = 0.4 , the evaluation model of the conventional bus line network was established, the new scheme was evaluated by establishing the evaluation function, and after repeated iterations until the objective function reached the minimum and did not change, the final optimized public transit network was obtained.

3.3. Optimization Results and Evaluation Analysis

Among the five conventional bus lines passing through the rail transit transfer station, the line 373 (inner ring) remained unchanged. Under the premise of keeping the starting and ending points of other lines unchanged, the existing bus network was optimized in the affected area, and all parameters were brought into the program to obtain the optimized network with the smallest evaluation function value. According to the opinions of the local competent department, the optimization schemes of five conventional bus lines were obtained, as shown in Figure 12:
Figure 13 shows the improved optimized line network based on the existing lines. Compared with the current situation, the optimization scheme has obvious improvement effects on the repetition coefficient of bus lines and per capita transfer time. However, it can be seen that the improvement effect of this optimization scheme on online network coverage and the online site service rate is not obvious. The main reason is that few conventional bus lines were stopping at the transfer station, and the bus coverage in this area cannot be effectively improved under the line length and non-linear coefficient constraints. After systematic analysis, bus No. 907 was selected from the conventional bus lines that were not connected to rail transit, so that it connects with the transfer station and serves as a connection line for rail transit to increase the transportation efficiency of rail transit in this area. The scheme 2 is shown in Figure 13:
After comparing the two optimization schemes, it can be found that after adding a connecting bus line, the bus line network coverage rate and station service rate were significantly improved. The technical indexes of the bus network before and after optimization are shown in Table 7:
This optimization scheme was mainly aimed at the improvement of line network coverage and the reduction of per capita transfer time. If it is necessary to significantly improve the collinearity with the track and the station service rate, it only needs to increase the weight coefficient of these two parameters in the optimization model.

4. Conclusions

By introducing the concept and model of the Voronoi diagram, this study puts forward the optimization method for the conventional bus transit system based on the Tyson model, and draws the following conclusions:
  • The concept of the Voronoi diagram was introduced into the field of public transport, and the average pedestrian arrival time of passengers was taken as the main consideration in setting up bus stops. A placement optimization method of conventional bus stops based on the Tyson model was proposed.
  • Choosing the traditional test algorithm, aiming at the maximum coverage of the line network, the minimum collinearity with rail transit, the maximum service rate of line network stations and the minimum average transfer time from residents to rail stations, this study established the optimization model of the conventional bus network and puts forward the optimization method of the conventional bus network.
  • Taking the Wuhan East Lake demonstration area as an example, the optimization method for the conventional bus transit system proposed in this study was applied to the study. The results show that this optimization method has obvious effects on selecting the connection and transfer hub between rail transit and conventional bus transit, and increasing the proportion of public transport travel.
  • Two optimization schemes of five conventional bus lines in the Wuhan East Lake demonstration area are given. The results show that the bus line network coverage and station service rate have been significantly improved after optimization, and the bus route repetition coefficient and per capita transfer time have been significantly reduced. This shows that the research results of this study have practical reference value.
For the optimization of the conventional bus system, only the layout optimization of conventional bus stops and the optimization of conventional bus network were considered. However, in practice, the departure frequency and amount of the conventional public transport cannot be ignored. Therefore, the prediction of public transport demand will be the focus of the next exploration and research. In addition, the screening conditions of the optimization method selected in this study when constructing the set of conventional bus candidate lines largely depend on the experience of planners and the opinions of local competent departments. If the screening conditions can be quantified, the results will be more convincing, which is also a direction of follow-up research.

Author Contributions

Conceptualization, F.W.; Data curation, M.Y.; Formal analysis, H.Z.; Methodology, F.W. and D.G.; Project administration, F.W.; Software, H.Z.; Visualization, D.G.; Writing—original draft, M.Y. and H.Z.; Writing—review and editing, F.W. and D.G. All authors have read and agreed to the published version of the manuscript.

Funding

This research received no external funding.

Institutional Review Board Statement

Not applicable.

Informed Consent Statement

Not applicable.

Data Availability Statement

All data covered in this paper are available from the corresponding author upon request.

Conflicts of Interest

The authors declare no existing or potential conflict of interest.

References

  1. Kashani, Z.N.; Ronald, N.; Winter, S. Comparing demand responsive and conventional public transport in a low demand context. In Proceedings of the IEEE International Conference on Pervasive Computing & Communication Workshops, Sydney, NSW, Australia, 14–18 March 2016. [Google Scholar]
  2. Turoń, K.; Kubik, A. Business Innovations in the New Mobility Market during the COVID-19 with the Possibility of Open Business Model Innovation. JOItmC 2021, 7, 195. [Google Scholar] [CrossRef]
  3. Dong, H.; Ma, S.; Jia, N.; Tian, J. Understanding public transport satisfaction in post COVID-19 pandemic. Transp. Policy 2021, 101, 81–88. [Google Scholar] [CrossRef]
  4. Bing, H.; Zuo, Z.; Yi, C. Research of Complementary between Rail Transit and Conventional Bus. In Proceedings of the Fifth International Conference on Transportation Engineering, Beijing, China, 11–13 September 2015. [Google Scholar]
  5. Herrera, R.; Kalcsics, J.; Nickel, S. Reliability Models for the Uncapacitated Facility Location Problem with User Preferences. DBLP 2008, 2007, 135–140. [Google Scholar]
  6. Chen, J.; Wang, S.; Liu, Z.; Chen, X. Network-level optimization of bus stop placement in urban areas. KSCE J. Civ. Eng. 2018, 22, 1446–1453. [Google Scholar] [CrossRef]
  7. Robinson, S.P. Determining London Bus Stop Locations by Means of an Automatic Vehicle Location System. Transp. Res. Rec. 2008, 2064, 24–32. [Google Scholar] [CrossRef]
  8. Ns, A.; Ao, B.; Aq, B. Optimization of Bus Stops Locations Using GIS Techniques and Artificial Intelligence. Procedia Manuf. 2020, 44, 52–59. [Google Scholar]
  9. Zhang, F.; Zheng, N.; Yang, H.; Geroliminis, N. A systematic analysis of multimodal transport systems with road space distribution and responsive bus service. Transp. Res. Part C Emerg. Technol. 2018, 96, 208–230. [Google Scholar] [CrossRef]
  10. Zamanian, M.H.; Peiravian, F. Multi-Step Heuristic Method for Bus Terminal Location Problem. Transp. Res. Rec. J. Transp. Res. Board 2019, 2673, 361–369. [Google Scholar] [CrossRef]
  11. Roy, S.; Basu, D. An evaluation of in-service infrastructural facilities of walk-access feeder paths to urban local bus stops. Transp. Res. Procedia 2020, 48, 3824–3831. [Google Scholar] [CrossRef]
  12. Li, B.; Huang, Z.; Xia, J.; Li, W.; Zhang, Y. Coupling Degree between the Demand and Supply of Bus Services at Stops: A Density-Based Approach. Int. J. Geo-Inf. 2021, 10, 173. [Google Scholar] [CrossRef]
  13. Liu, W.; Wang, F.; Zhang, C.; Zhang, J.; Wang, L. A Simulation Study of Urban Public Transport Transfer Station Based on Anylogic. Ksii Trans. Internet Inf. Syst. 2021, 15, 1216–1231. [Google Scholar]
  14. Liu, Z.; Xu, C.; He, Y.; Li, K. Optimisation of Bus Stop Layout Based on Time Distance Trajector. IOP Conf. Ser. Earth Environ. Sci. 2019, 252, 052075. [Google Scholar] [CrossRef] [Green Version]
  15. Duan, G.; Ma, X.; Wang, J.; Wang, Z.; Wang, Y. Optimization of Urban Bus Stops Setting Based on Data Mining. Int. J. Pattern Recognit. Artif. Intell. 2021, 35, 2159028. [Google Scholar] [CrossRef]
  16. Daganzo, C.F. Structure of Competitive Transit Networks. Inst. Transp. Stud. Res. Rep. Work. Pap. Proc. 2009, 44, 434–446. [Google Scholar] [CrossRef] [Green Version]
  17. Sivakumaran, K. Access and the Choice of Transit Technology; University of California: Berkeley, CA, USA, 2012. [Google Scholar]
  18. Ting, X.U.; Jiang, R.; Hongqing, L.I.; Qing, L.I.; Chen, G.; Automobile, S.O.; University, C. Layout Optimization of Rectangular Grid Road Multi-mode Bus Network. J. Chongqing Jiaotong Univ. (Nat. Sci.) 2019, 38, 108–115. [Google Scholar]
  19. Król, A. Application of the Genetic Algorithm for Optimization of the Public Transportation Lines; Springer International Publishing: New York, NY, USA, 2017. [Google Scholar]
  20. Dib, O.; Moalic, L.; Manier, M.A.; Caminada, A. An advanced GA-VNS combination for multicriteria route planning in public transit networks. Expert Syst. Appl. 2017, 72, 67–82. [Google Scholar] [CrossRef] [Green Version]
  21. Zhao, J.; Qiang, Q.; Fan, Z.; Xu, C.; Liu, S. Spatio-Temporal Analysis of Passenger Travel Patterns in Massive Smart Card Data. IEEE Trans. Intell. Transp. Syst. 2017, 18, 3135–3146. [Google Scholar] [CrossRef]
  22. Amirgholy, M.; Shahabi, M.; Gao, H.O. Optimal design of sustainable transit systems in congested urban networks: A macroscopic approach. Transp. Res. Part E Logist. Transp. Rev. 2017, 103, 261–285. [Google Scholar] [CrossRef]
  23. Shi, Q.; Weng, J.; Ma, S.; Jing, Y. Evaluation Method of Bus Line Optimization Scheme Based on Multidimensional Indicators. In Proceedings of the 20th COTA International Conference of Transportation Professionals, Xi’an, China, 16–19 December 2020. [Google Scholar]
  24. Shi, Q.; Zhang, K.; Weng, J.; Dong, Y.; Zhang, M. Evaluation model of bus routes optimization scheme based on multi-source bus data. Transp. Res. Interdiscip. Perspect. 2021, 10, 100342. [Google Scholar] [CrossRef]
  25. Hu, W.; Wang, C.; Zuo, X. An Ant Colony Optimization based Approach to Adjust Public Transportation Network. In Proceedings of the 2019 IEEE Congress on Evolutionary Computation (CEC), Wellington, New Zealand, 10 June 2019. [Google Scholar]
  26. Dakic, I.; Leclercq, L.; Menendez, M.; Mannering, F. On the optimization of the bus network design: An analytical approach based on the three-dimensional macroscopic fundamental diagram. Transp. Res. Part B Methodol. 2021, 149, 393–417. [Google Scholar] [CrossRef]
  27. Jian-Ping, Y.U. A Method of Cell Grid Process and Network Optimization with Tyson Polygon. J. Shandong Agric. Univ. (Nat. Sci. Ed.) 2019, 50, 492–494. [Google Scholar]
  28. Portilla, A.I.; Dell’Olio, L. The Problem of the Location of Bus-Stops in Urban Public Transport. In Proceedings of the World Conference on Transport Research, Istanbul, Turkey, 4–6 July 2004. [Google Scholar]
Figure 1. Voronoi diagram production flow chart.
Sustainability 14 07918 g001
Figure 2. Regional status map of Wuhan East Lake demonstration area. (a). The optimization scope. (b). The regional road networks.
Sustainability 14 07918 g002
Figure 3. Distribution of population density in the Wuhan East Lake demonstration area.
Sustainability 14 07918 g003
Figure 4. Passenger flow distribution map of conventional bus stops in the Wuhan East Lake demonstration area.
Sustainability 14 07918 g004
Figure 5. Voronoi diagram service zoning map of the East Lake demonstration area.
Sustainability 14 07918 g005
Figure 6. Distribution map of transfer communities between rail transit and conventional bus in the East Lake demonstration area.
Sustainability 14 07918 g006
Figure 7. Fitting diagram of the relationship between the proportion of passengers using the bus and the time required for arrival in the East Lake demonstration area.
Sustainability 14 07918 g007
Figure 8. Current land use distribution map of Liufangyuan Road community. (a). The current stations. (b). The range of origins.
Sustainability 14 07918 g008
Figure 9. Distribution of conventional bus stops within the affected area of the No. 32 transfer community.
Sustainability 14 07918 g009
Figure 10. Schematic diagram of conventional bus network data within the influence range of the No. 32 transfer community.
Sustainability 14 07918 g010
Figure 11. Distribution map of conventional bus feeder network within the influence area of the No. 32 transfer community.
Sustainability 14 07918 g011
Figure 12. Conventional bus connection network optimization scheme 1.
Sustainability 14 07918 g012
Figure 13. Conventional bus connection network optimization scheme 2.
Sustainability 14 07918 g013
Table 1. Statistical table of survey data of residents in the East Lake demonstration area.
The Acceptable Walking Time for Resident (Min) 1 234567891011 12
Proportion100%85%74%62%53%46%32%24%18%13%9%7%
Table 2. Current economic and technical indicators of the Liufangyuan Road community.
Source Serial NumberNature of Land UseFloor Area (HA)Plot RatioIncidence (Person/HA)Number of Passengers (Person)Time to Walk to the Bus Stop (Min)
1Land for scientific research and education31.61.6821011,1483.6
2Land for scientific research and education12.41.5517032672.8
3Office land5.62.4316021771
4Office land5.32.6515021064.2
5Office land6.12.1215019393.2
Table 3. Attraction index of the Liufangyuan road bus station after tram operation.
Source Serial Number12345Rail Station
Number of passengers (person)735721561436139012801321
Walk to station time (min)3.62.814.23.22.2
Table 4. Attraction index table of candidate sites in the Liufangyuan Road community.
Source Serial Number12345Rail Station
Number of passengers (person)735721561436139012801321
Walking time to station (min)4.94.62.15.310
Table 5. Index table of conventional bus feeder network within the affected area of the No. 32 transfer community.
Line NameOrigin–DestinationStraight Line Distance × 1.4 (km)Shortest PathShortest Line Length (km)Time of Minimum Line (Min)
No.3331Y3.081-O-N-X-Y2.415
No.3881T2.381-P-U-T211
No.7531F1.961-J-E-F1.610
No.7861A3.51-J-I-B-A316
Table 6. List of candidate routes of the conventional bus feeder network within the influence range of the No. 32 transfer community.
Line NameOrigin–DestinationCandidate LineLine LengthLine Number
3331Y1-O-N-X-Y2.41a
1-V-W-X-Y2.91b
1-V-W-O-N-X-Y3.61c
1-J-L-O-N-Y3.71d
3881T1-P-U-T22a
1-P-Q-U-T2.22b
1-V-U-T2.32c
1-J-G-M-S-T3.72d
7531F1-J-K-G-F33a
1-L-D-E-F3.23b
1-P-Q-K-G-F3.83c
7861A1-J-I-B-A34a
1-L-I-B-A3.24b
1-O-N-I-B-A3.24c
1-J-L-C-B-A3.44d
1-P-Q-K-J-I-B-A3.94e
Table 7. Comparison of technical indexes before and after optimization.
Network CoverageCollinearity with Rail TransitLine Network Station Service RatePer Capita Transfer Time (min)
Original wire network39%2%89%19.6
Scheme 143%19%81%16.4
Scheme 251%16%95%14.7
Publisher’s Note: MDPI stays neutral with regard to jurisdictional claims in published maps and institutional affiliations.

