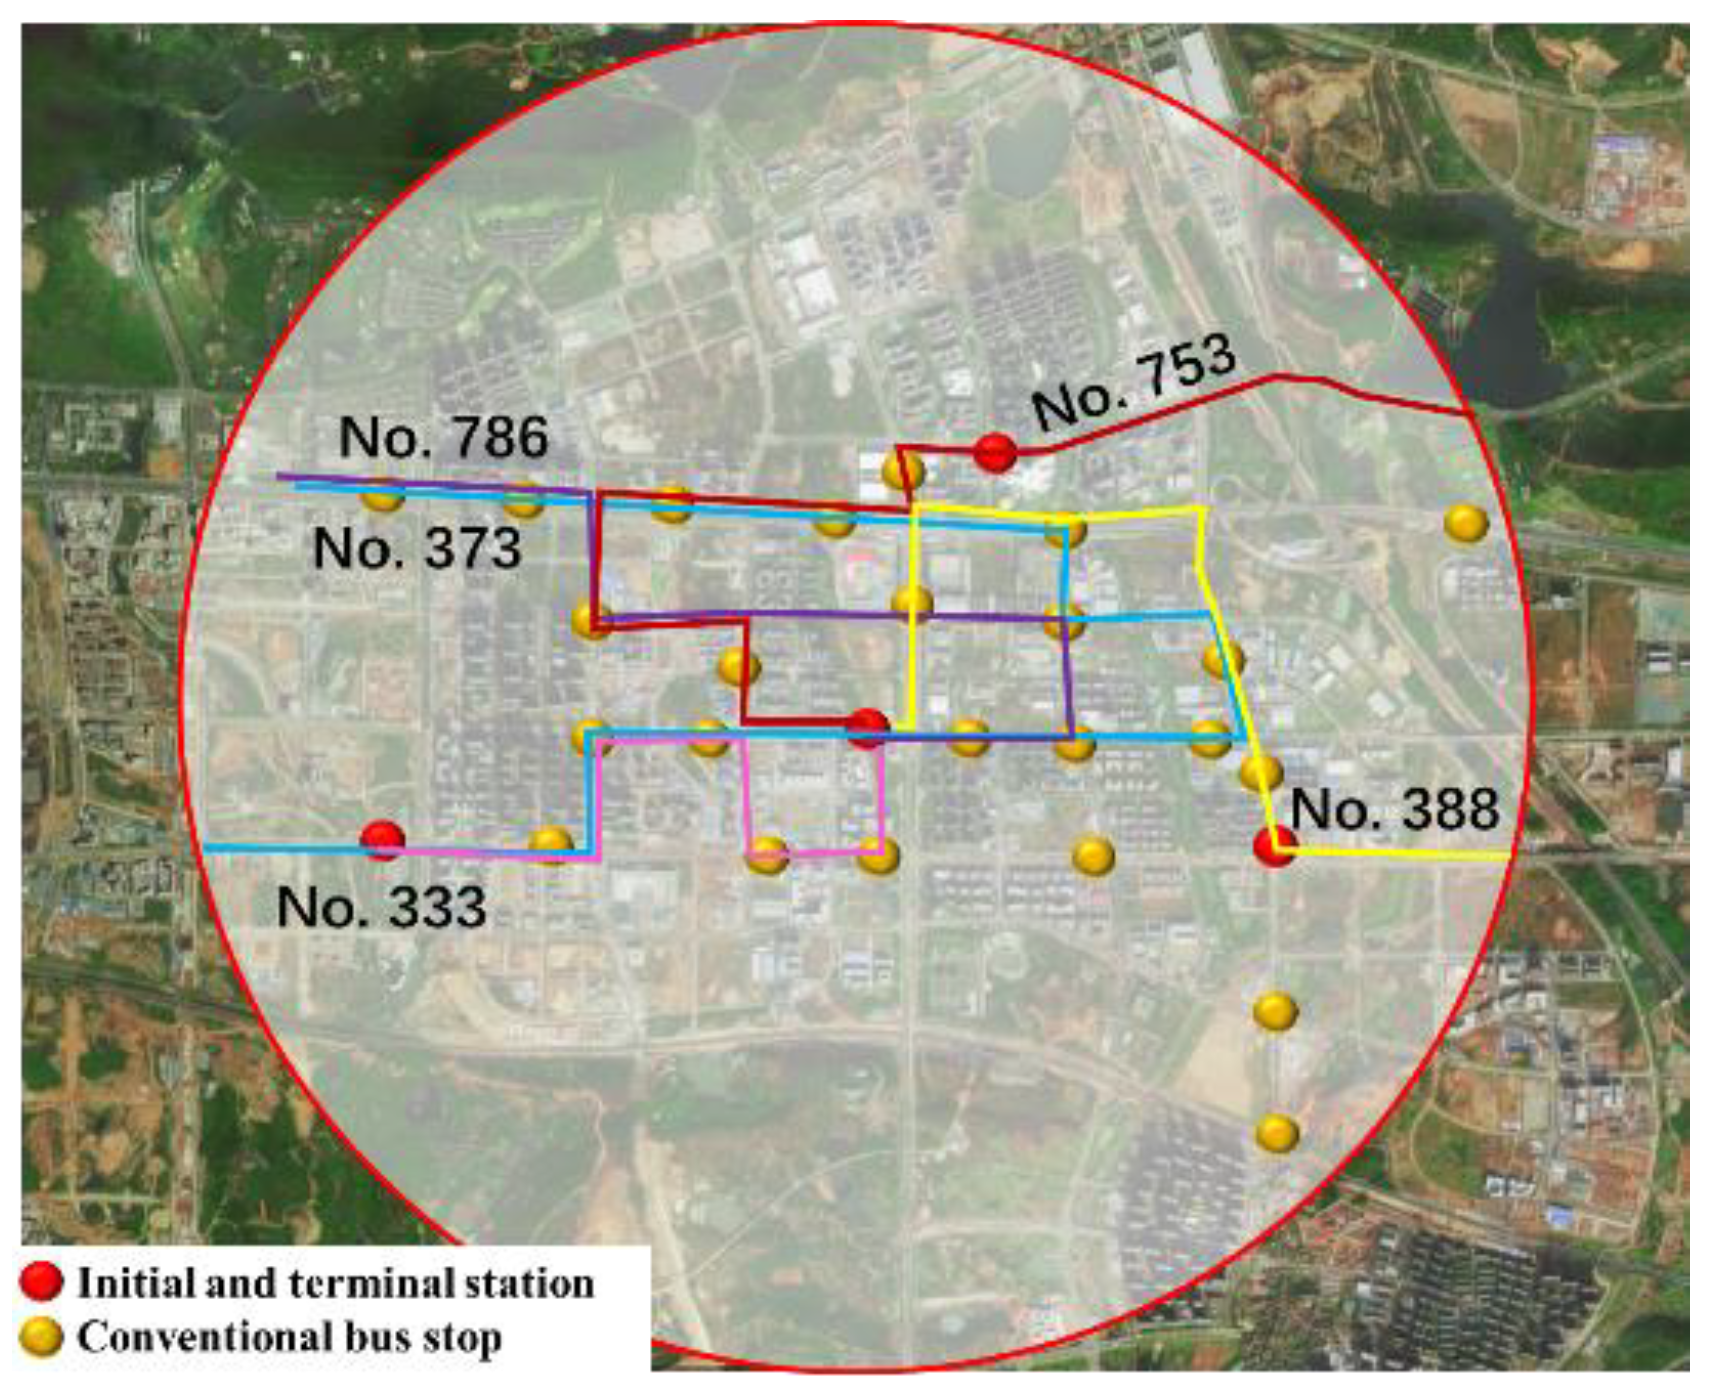
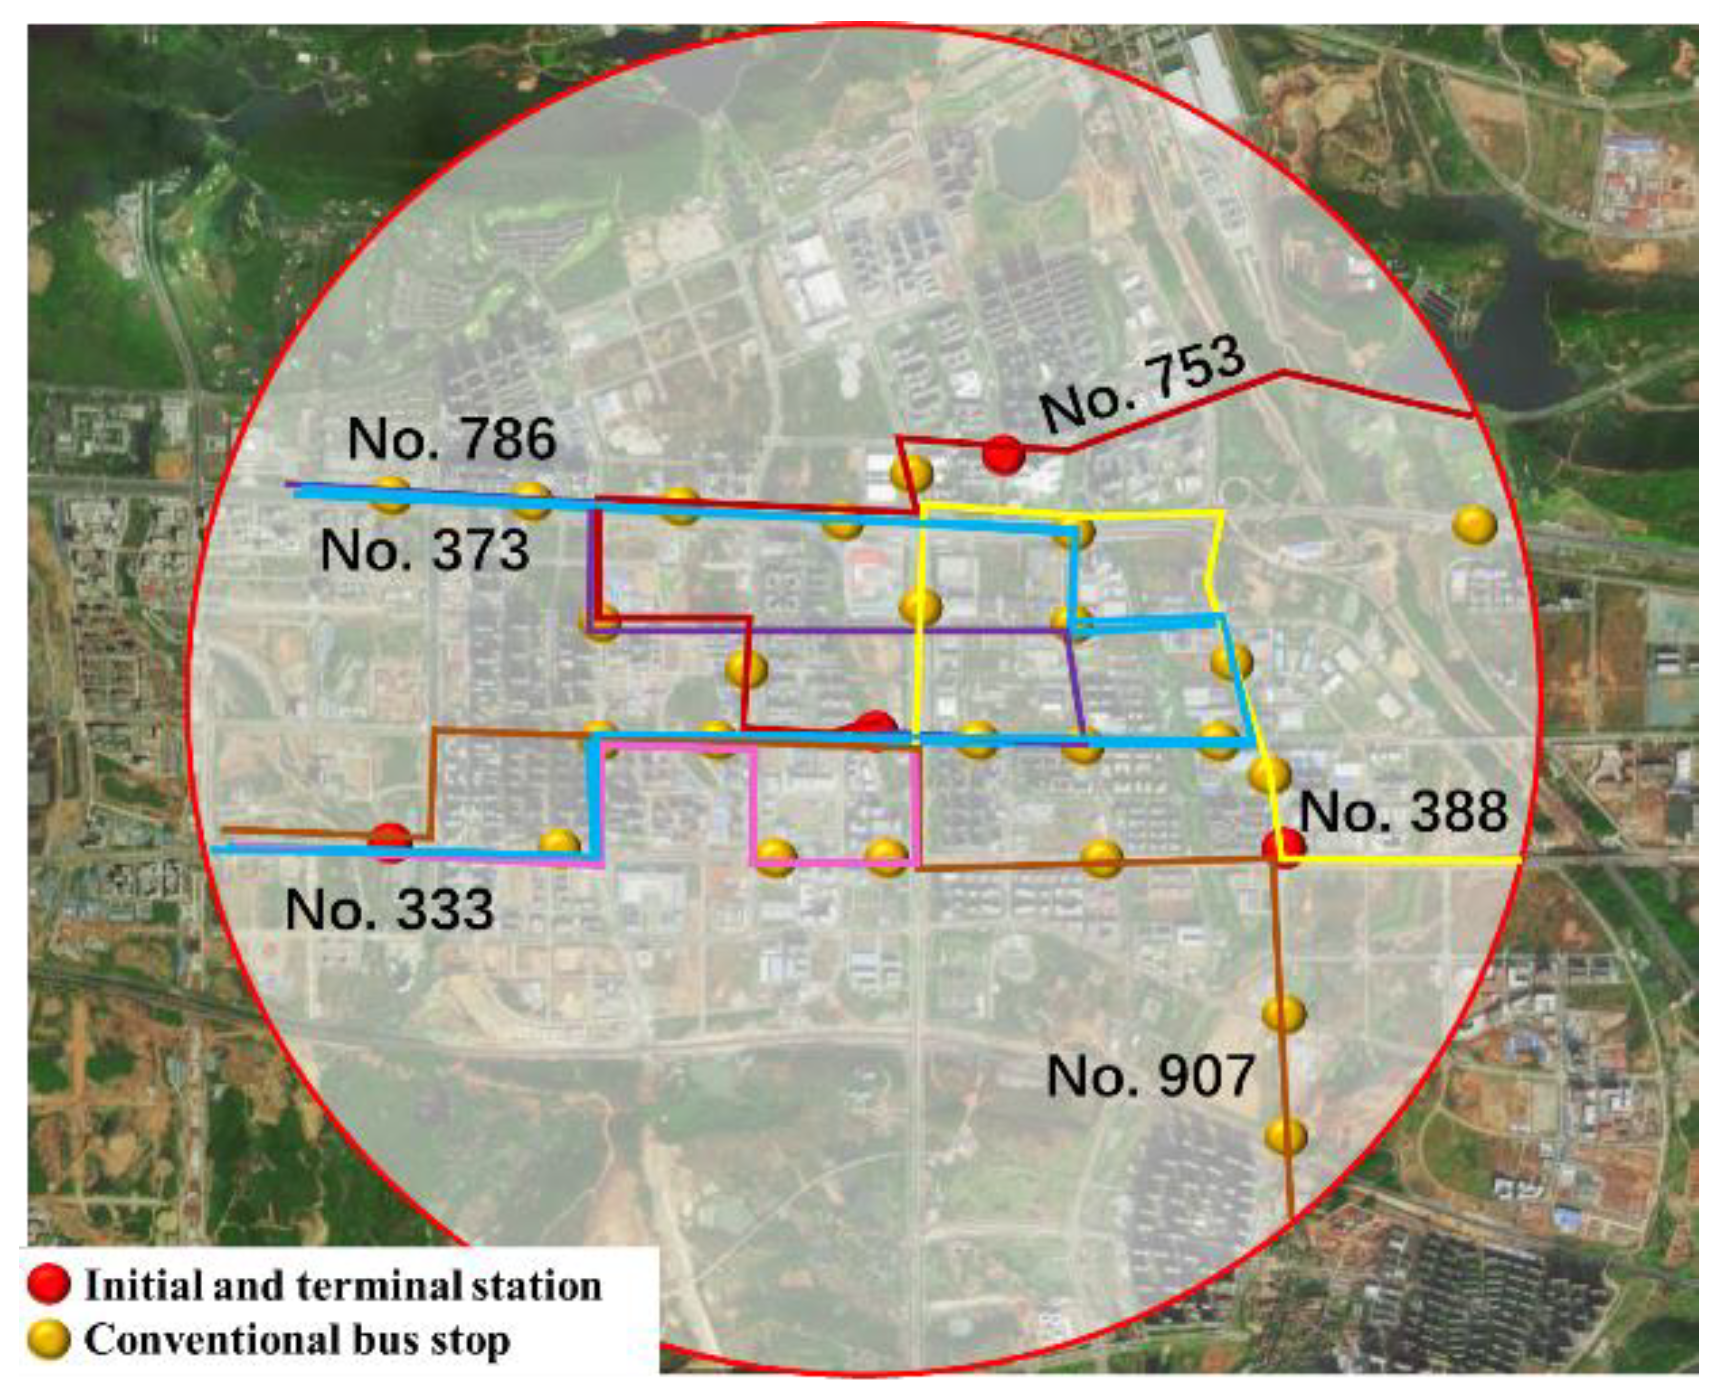
2.3.1. Optimization Model for Conventional Bus Stop Placement
The denser the distribution of passengers around the bus station and the shorter the time for passengers to arrive at the bus station, the shorter the average walking time of passengers in the community is. Therefore, the location of the bus station should give priority to the main source of passengers.
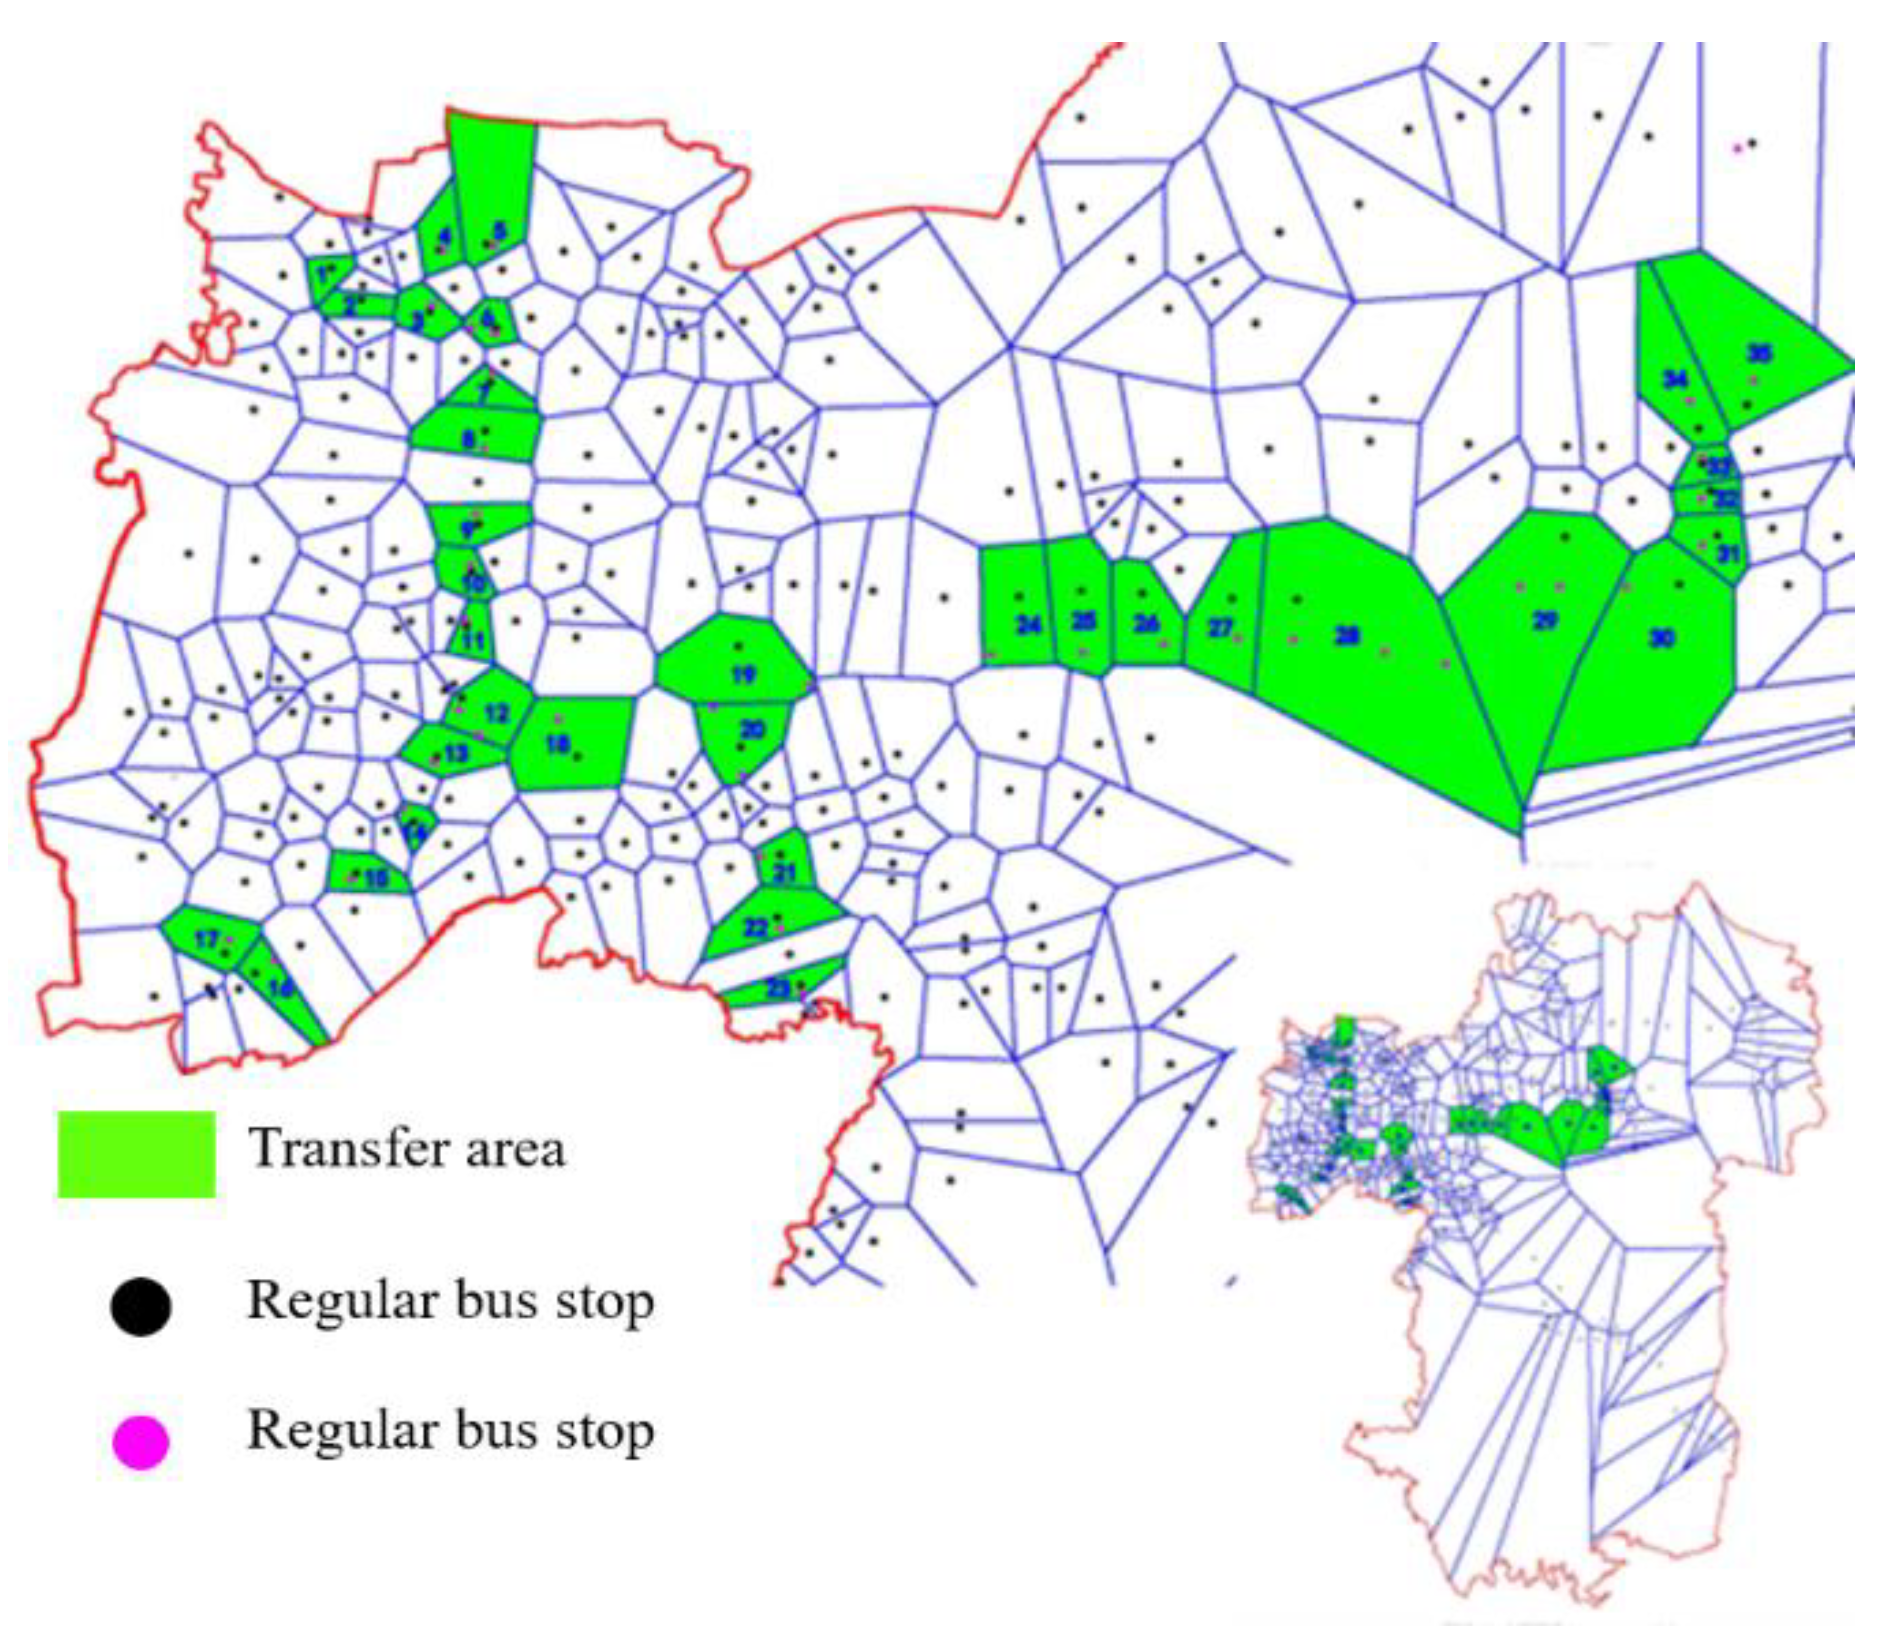
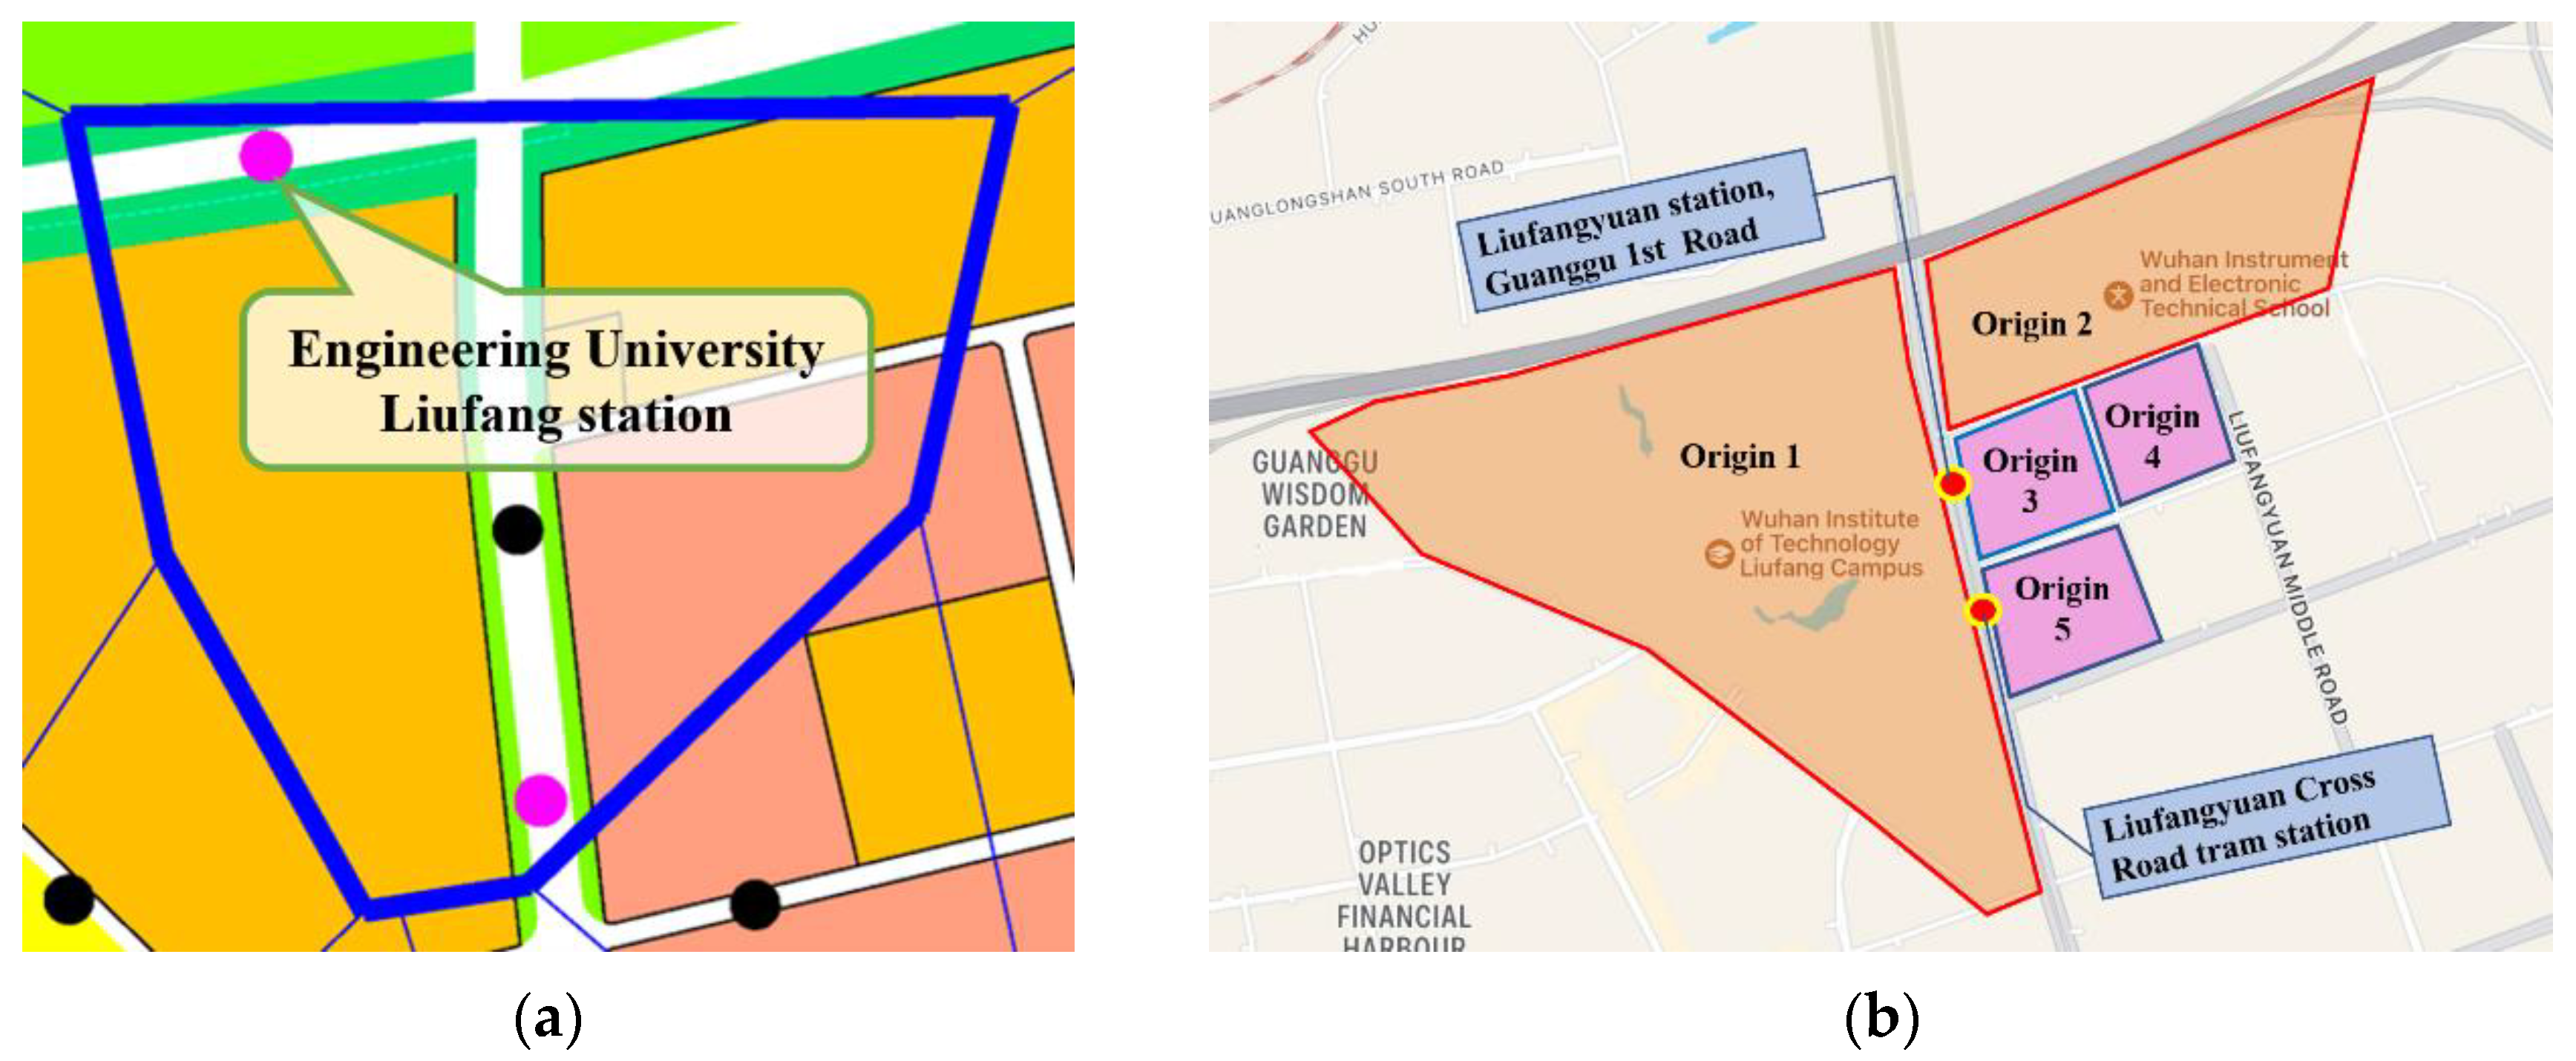
In the transfer community, a candidate station for conventional buses is established at the rail transit station. By comparing the average walking arrival time of passengers in the two site selection schemes, it was decided whether to choose this point as the connecting and transfer hub between rail transit and conventional bus. Passengers in the area include passengers from existing sources and indirect passengers transported to the area by rail stations.
According to the actual situation, the arrival time of passengers in the area was directly proportional to the travel speed of passengers and inversely proportional to the distance, that is:
where
—the time required for the
passenger to reach the discrete point;
—the average speed of the passenger reaching the discrete point, and the walking speed is 5 km/h;
—the walking distance of the passenger to the discrete point.
Assuming that there are
n passengers in the polygonal area who choose bus travel, the calculation formula of the average pedestrian arrival time of passengers in this area is as follows:
Since the workload of understanding the time of each passenger to the bus station in the area was very large, this study took the walking time from the source to the bus station as the walking time of all passengers from the source to the bus station through the division of the source of passengers in the service area. Through the investigation and analysis of the service area, we can understand the distribution of passengers in the area and divide the source of passengers. The influencing factors considered in the model mainly include the number of passengers in the service area and the time from each source to the bus stop. Among them, the number of passengers was mainly related to the land use nature, floor area and land development intensity of the source. The land development intensity was mainly expressed by the plot ratio index. The time from each source to the bus stop was mainly related to the distribution of the source.
The number of passengers from all sources in the community is:
where
—the floor area of the
source;
—plot ratio of the generation source;
—the occurrence coefficient of the generation source can be obtained after the investigation and summary of similar buildings;
—average daily passenger flow of rail station;
—proportion of indirect passenger flow of rail transit.
The passenger flow snatched by the rail station was related to the degree of collinearity of the bus line passing through the bus station. The higher the degree of collinearity of the bus line and rail transit, the greater the passenger flow snatched. The calculation formula of collinearity is:
Proportion
of passenger flow snatched by rail stations, where
is the influence coefficient of passenger flow on the same line, which is related to the passenger flow distribution of conventional bus lines. The average pedestrian arrival time of passengers in the service area is:
where
—the time for the
generation source to walk to the conventional bus stop;
—time to walk from rail station to conventional bus stop;
—the proportion of passenger flow occupied by rail stations in conventional bus transit.
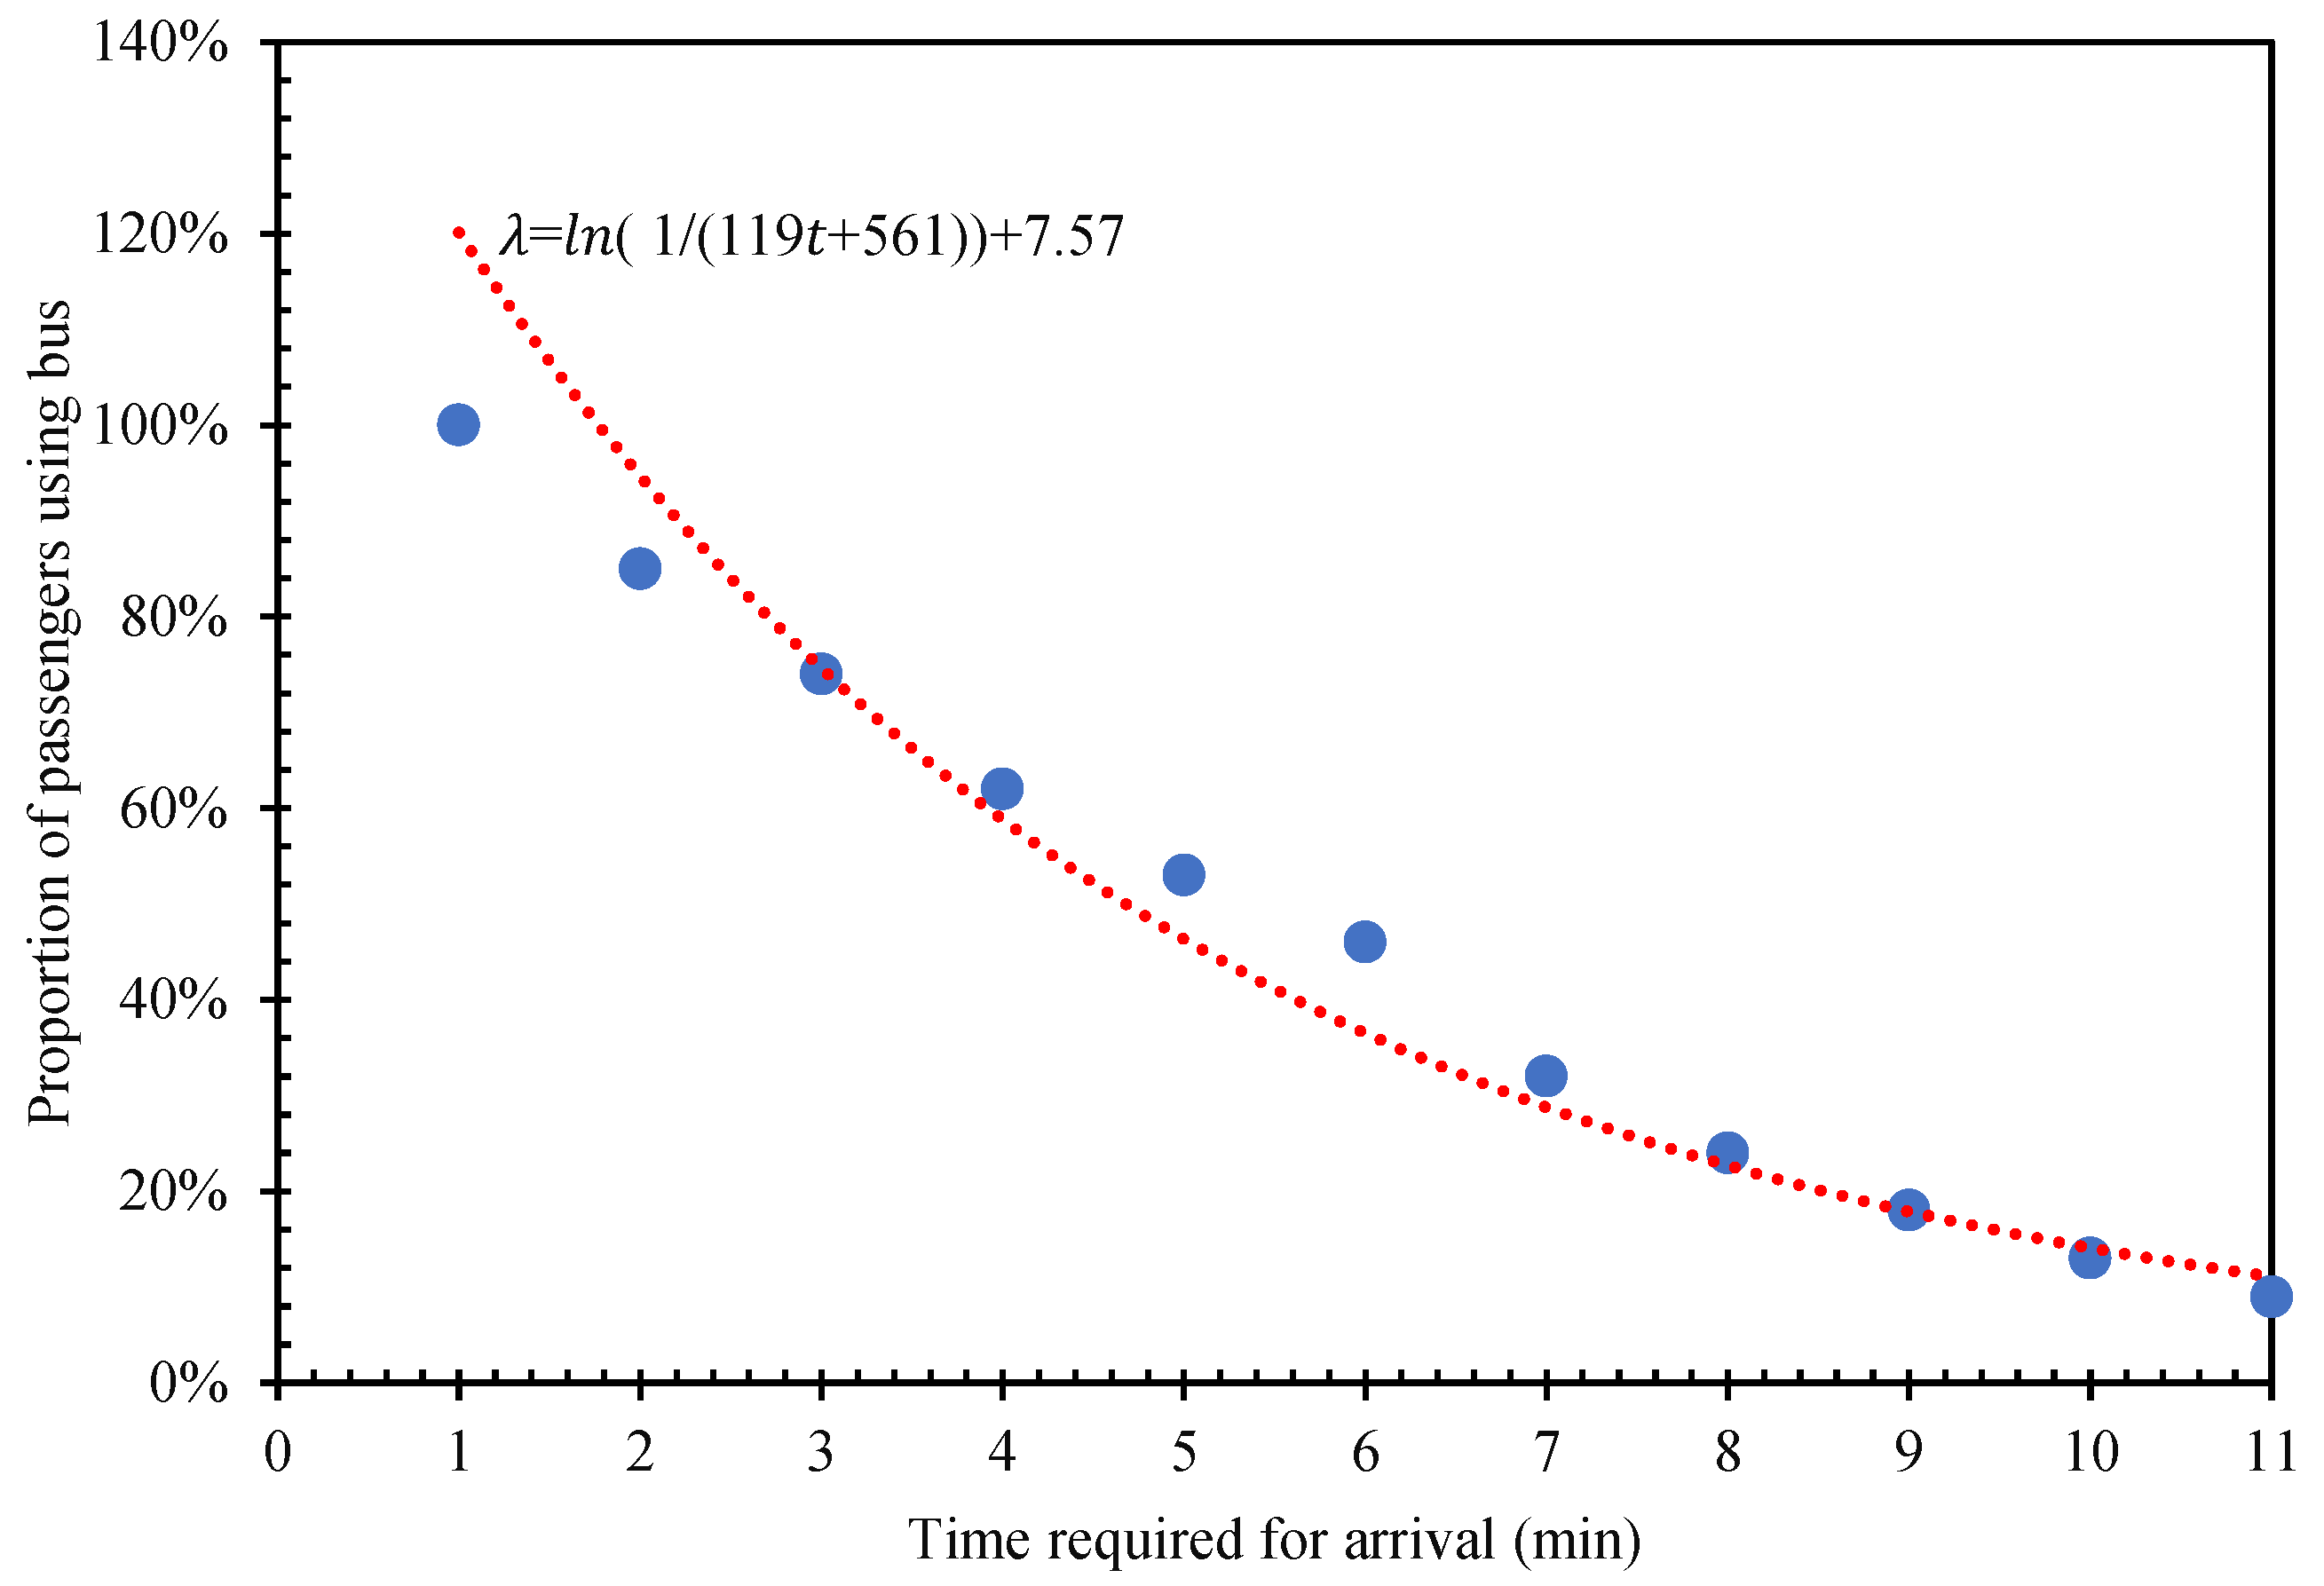
The closer the passenger departure point is to the bus stop, the more convenient it is to take the bus, and the higher the travel sharing rate of regional buses is. In the study of bus service radius and service level, it was assumed that there was a logarithmic relationship between bus travel rate and the time required for passengers to walk to the station. The relationship between bus travel rate and walking to the station is established as follows:
where
t is the time required to walk to the bus stop,
λ is the share rate of public transport in the area and
,
and
are the influence coefficients, which need to be determined according to the survey data.
In the non-transfer area, after calculating the average walking arrival time of passengers in the area through Formula (5), the bus sharing rate in the service area can be obtained according to Formula (6). If the optimization goal can be achieved, the service area is positioned as a built-up bus area. If the optimization goal is not achieved, it is positioned as a bus expansion area. For the bus expansion area, the location of bus stops can be adjusted or new bus stops can be added according to the actual situation to establish a collection of candidate conventional bus stations, and the optimal bus stop placement scheme can be selected through the evaluation model.
2.3.2. Optimization Model for Conventional Bus Line Network
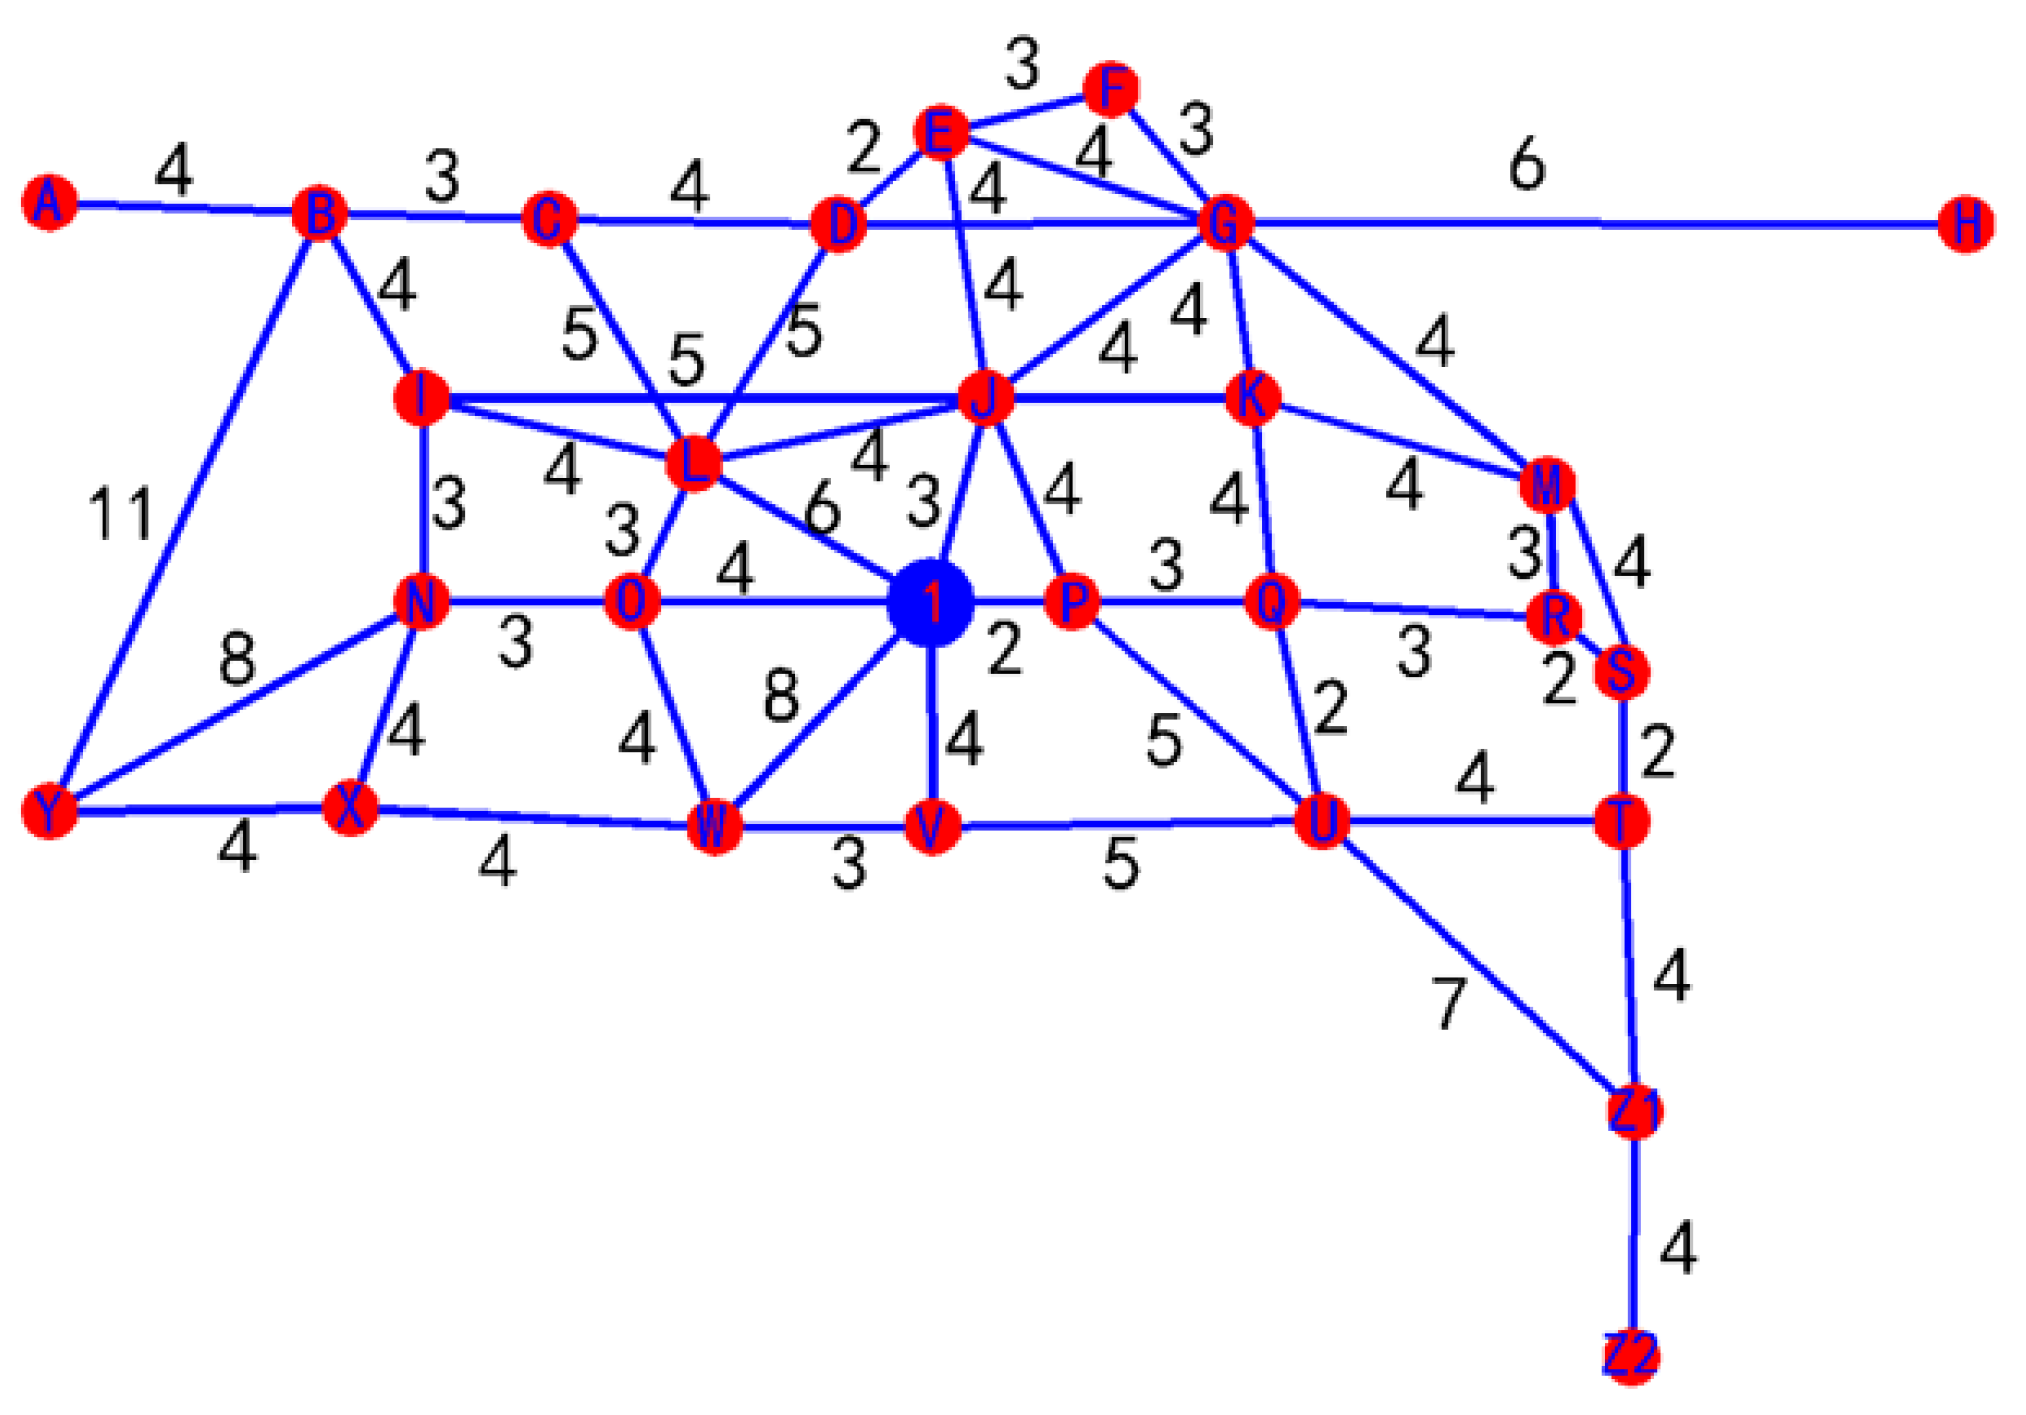
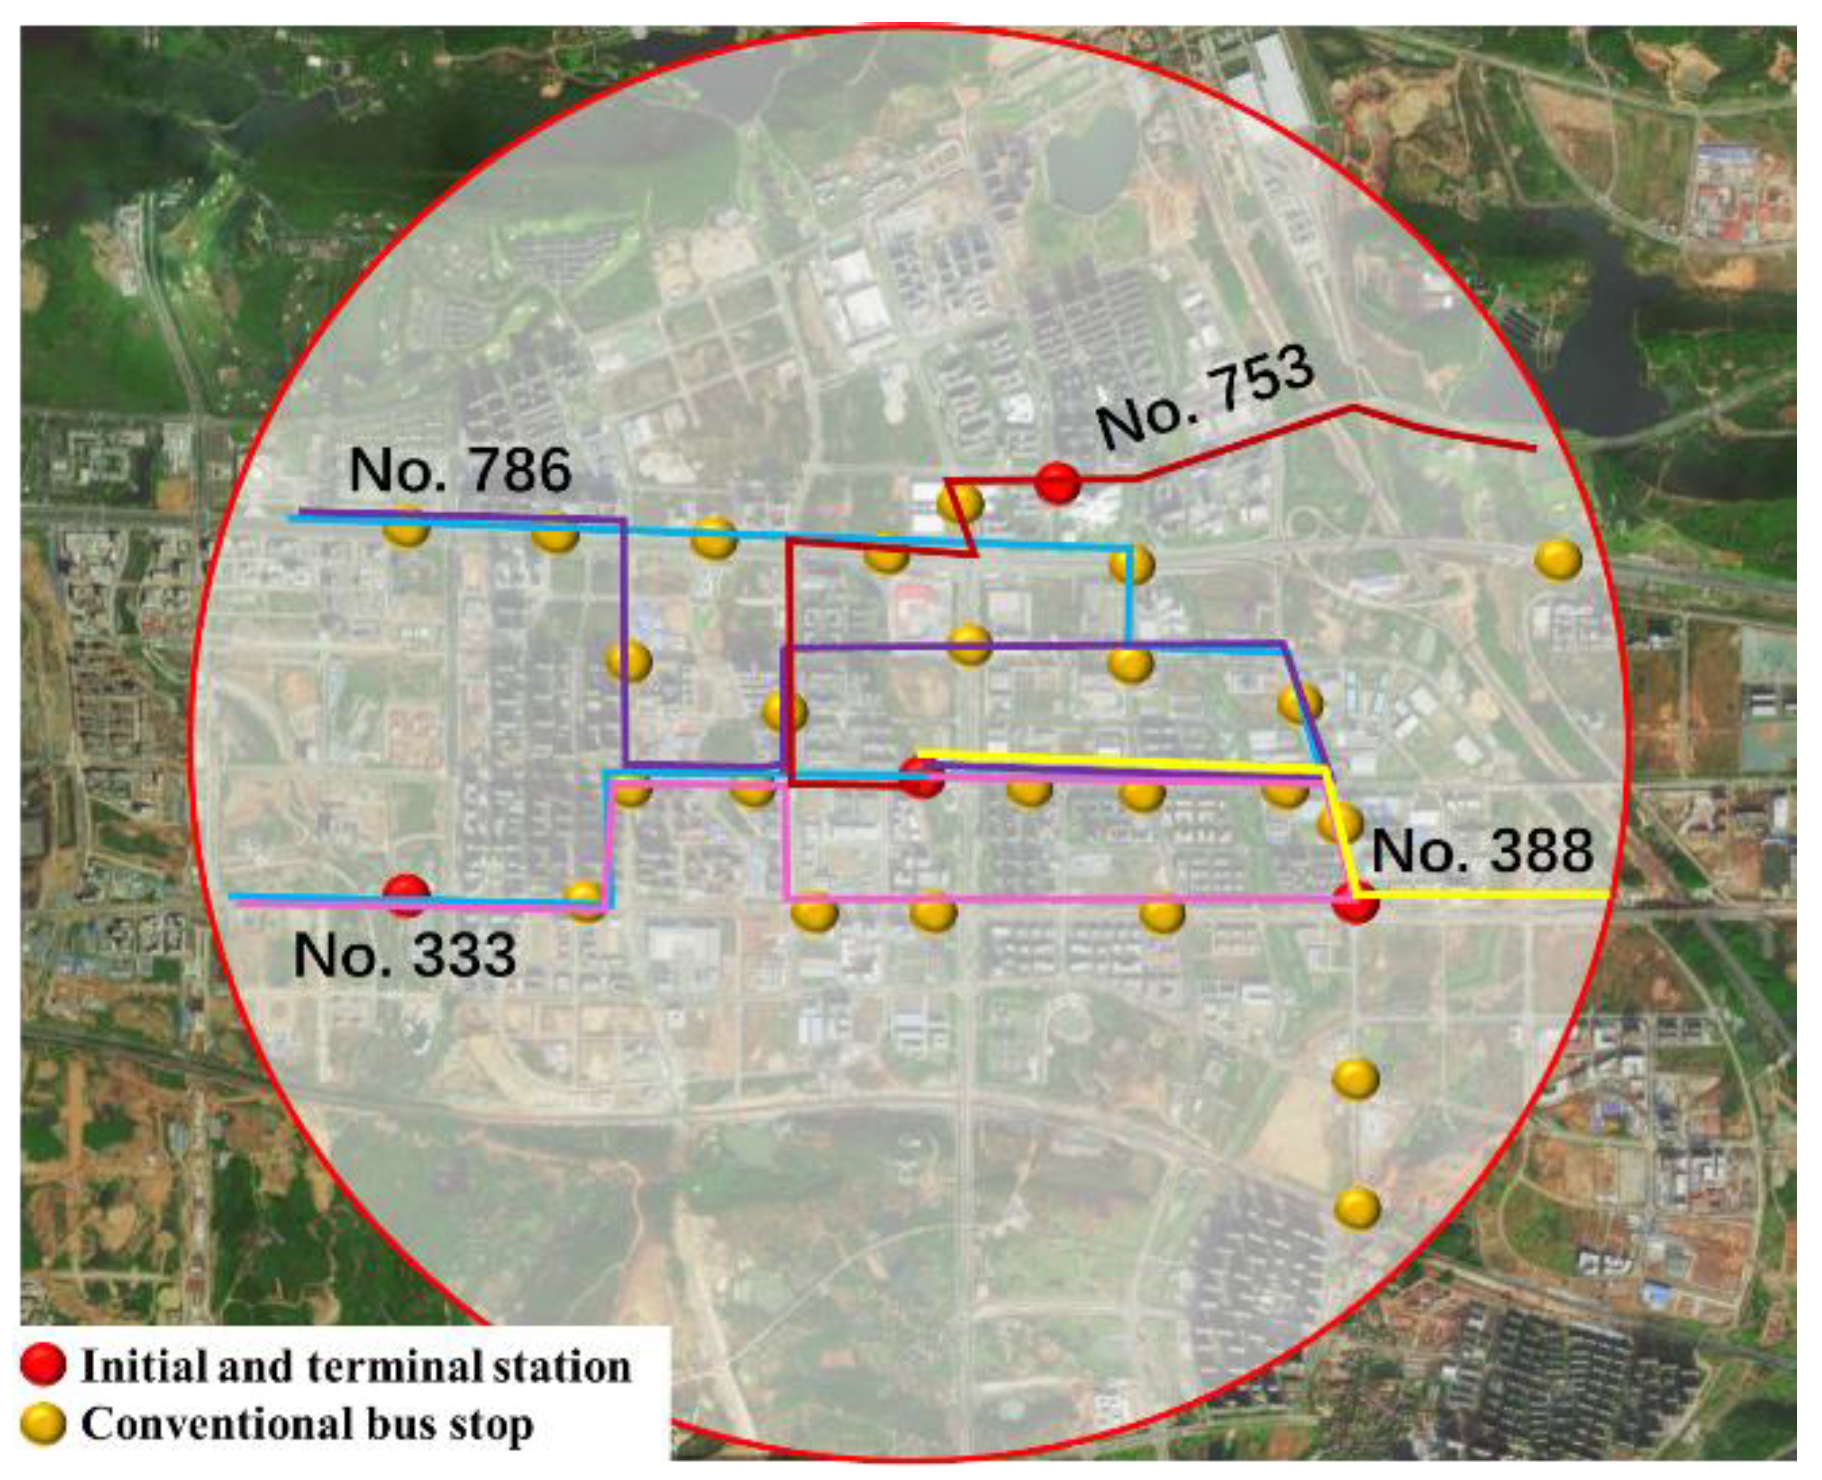
After determining the connection and transfer hub station, it was also necessary to adjust and optimize the overall network in the area indirectly affected by the station. During the optimization and adjustment of the conventional bus line network, the passenger OD matrix of these lines was obtained through investigation, and the lines that can transport a large number of direct passengers were regarded as reserved lines. Some lines that were not in good competition with rail transit were adjusted, some other lines whose direction was inconsistent with the passenger flow direction were cancelled, and the new bus lines were determined and optimized into a network. This study aims to minimize the per capita travel time of residents going to rail transfer stations by bus, to maximize the service area rate of line network stations and minimize the collinearity with rail transit. Under certain constraints, the optimal solution or approximate optimal solution of the objective function can be obtained through local adjustment of the line.
The public transit network is a compound concept. The target model of the public transit network mainly includes the following four parameters:
Line network coverage refers to the proportion of conventional bus line network in the length of urban roads.
- 2.
Collinearity with rail transit
When the conventional bus line is perpendicular to the rail line, they form a complete cooperative relationship. At this time, the conventional bus provides the role of gathering or evacuating passenger flow for rail transit. The lower the collinearity between conventional bus transit and rail transit, the weaker the competitive relationship and the cooperative relationship between them becomes.
- 3.
Network station service rate
The station service rate of the conventional bus line network reflects the possible ratio of residents to choose bus travel.
where
—network station service rate;
—collection of conventional bus lines connected with rail transit;
Si—number of bus trips in community served by conventional bus stop ;
S—total travel volume in rail transit affected area;
- 4.
Per capita travel time of residents from bus to rail transfer station
where
T—per capita travel time of bus transfer;
—passenger flow of service area ;
—time from the first service community to the transfer station by bus;
—average walking time of service community to station;
—time from transfer station to transfer track station;
B—collection of conventional bus stops in the area affected by the transfer hub;
G—collection of conventional bus stops for transfer with rail transit.
The goal of this study is to reasonably adjust the existing conventional bus line network structure, enhance the competitiveness of bus travel and attract more passengers to choose bus travel. Therefore, this study takes Equations (7)–(10) as the objective function and weights the four parameters to find the optimal solution. Since Equations (7) and (9) seek the maximum and Equations (8) and (10) seek the minimum, this study takes the reciprocal of Equations (7) and (9) to make its optimization direction consistent.
The mathematical model is as follows:
where
,
,
,
are the weight coefficients of four parameters, which shall be determined according to the personal will of the decision maker.
This study adopted the heuristic optimization method based on the current bus network. After the optimization of the layout of conventional bus stops, the starting point and ending point of each connecting bus line remains unchanged. Through different combinations of conventional bus stops, the candidate line set of bus lines was established, and the minimum combination of the target model was selected as the optimal solution of the line.
There are too many possible combinations of a bus line. To reduce the workload of finding the optimal line, it was necessary to set some constraints to screen the candidate lines, so as to make the obtained optimal line more practical. This study mainly restricts the candidate lines through the line length, non-linear coefficient and direct passenger flow.
- 5.
Line length
According to
The Code for Planning and Design of Urban Road Traffic, the maximum limit calculation formula of conventional bus lines is:
where
—maximum one-way travel time consumption of 95% of urban residents,
—average travel speed of urban public transport.
According to the research and statistics of some scholars, small cities can generally be set at 6–10 km and large cities at 10~15 km.
- 6.
Non-linear coefficient of line
The non-linear coefficient refers to the ratio between the actual line length between the initial and terminal stations of the bus line and its spatial straight-line distance. According to The Code for Urban Road Traffic Planning and Design, the non-linear coefficient of the line is .
- 7.
Direct passenger flow of the line
A good bus line should meet the needs of more direct passenger flow as much as possible, and a relatively direct line can meet the needs of more direct passenger flow. From the perspective of bus line service function, it is obvious that it should be the first choice of bus line. The direct passenger flow served by a bus line is:
where
—direct passenger flow of bus line
L,
—Travel demand from service area to service area ,
—Conventional bus lines from starting point to finishing point.
According to the above formula, the direct passenger flow of each candidate line can be calculated. Combined with planning experience and actual conditions, the minimum direct passenger flow of bus line l is taken as the condition for filtering, so as to further reduce the solution space of bus candidate lines, i.e., .
Based on the above discussion and analysis, the final optimization model is as follows:
where
represents the coverage of the network,
refers to the collinearity between the conventional bus line network and rail transit,
is the service rate of line network stations,
T represents the per capita travel time of residents from bus to rail transfer station,
Z is the target value of network optimization,
,
,
,
represent the weight coefficient of the target, and the selection of the weight coefficient is determined according to the will of the decision maker.

