
Fusion of Remote Sensing Data Using GIS-Based AHP-Weighted Overlay Techniques for Groundwater Sustainability in Arid Regions

 , ,
, , 
Abstract
:1. Introduction
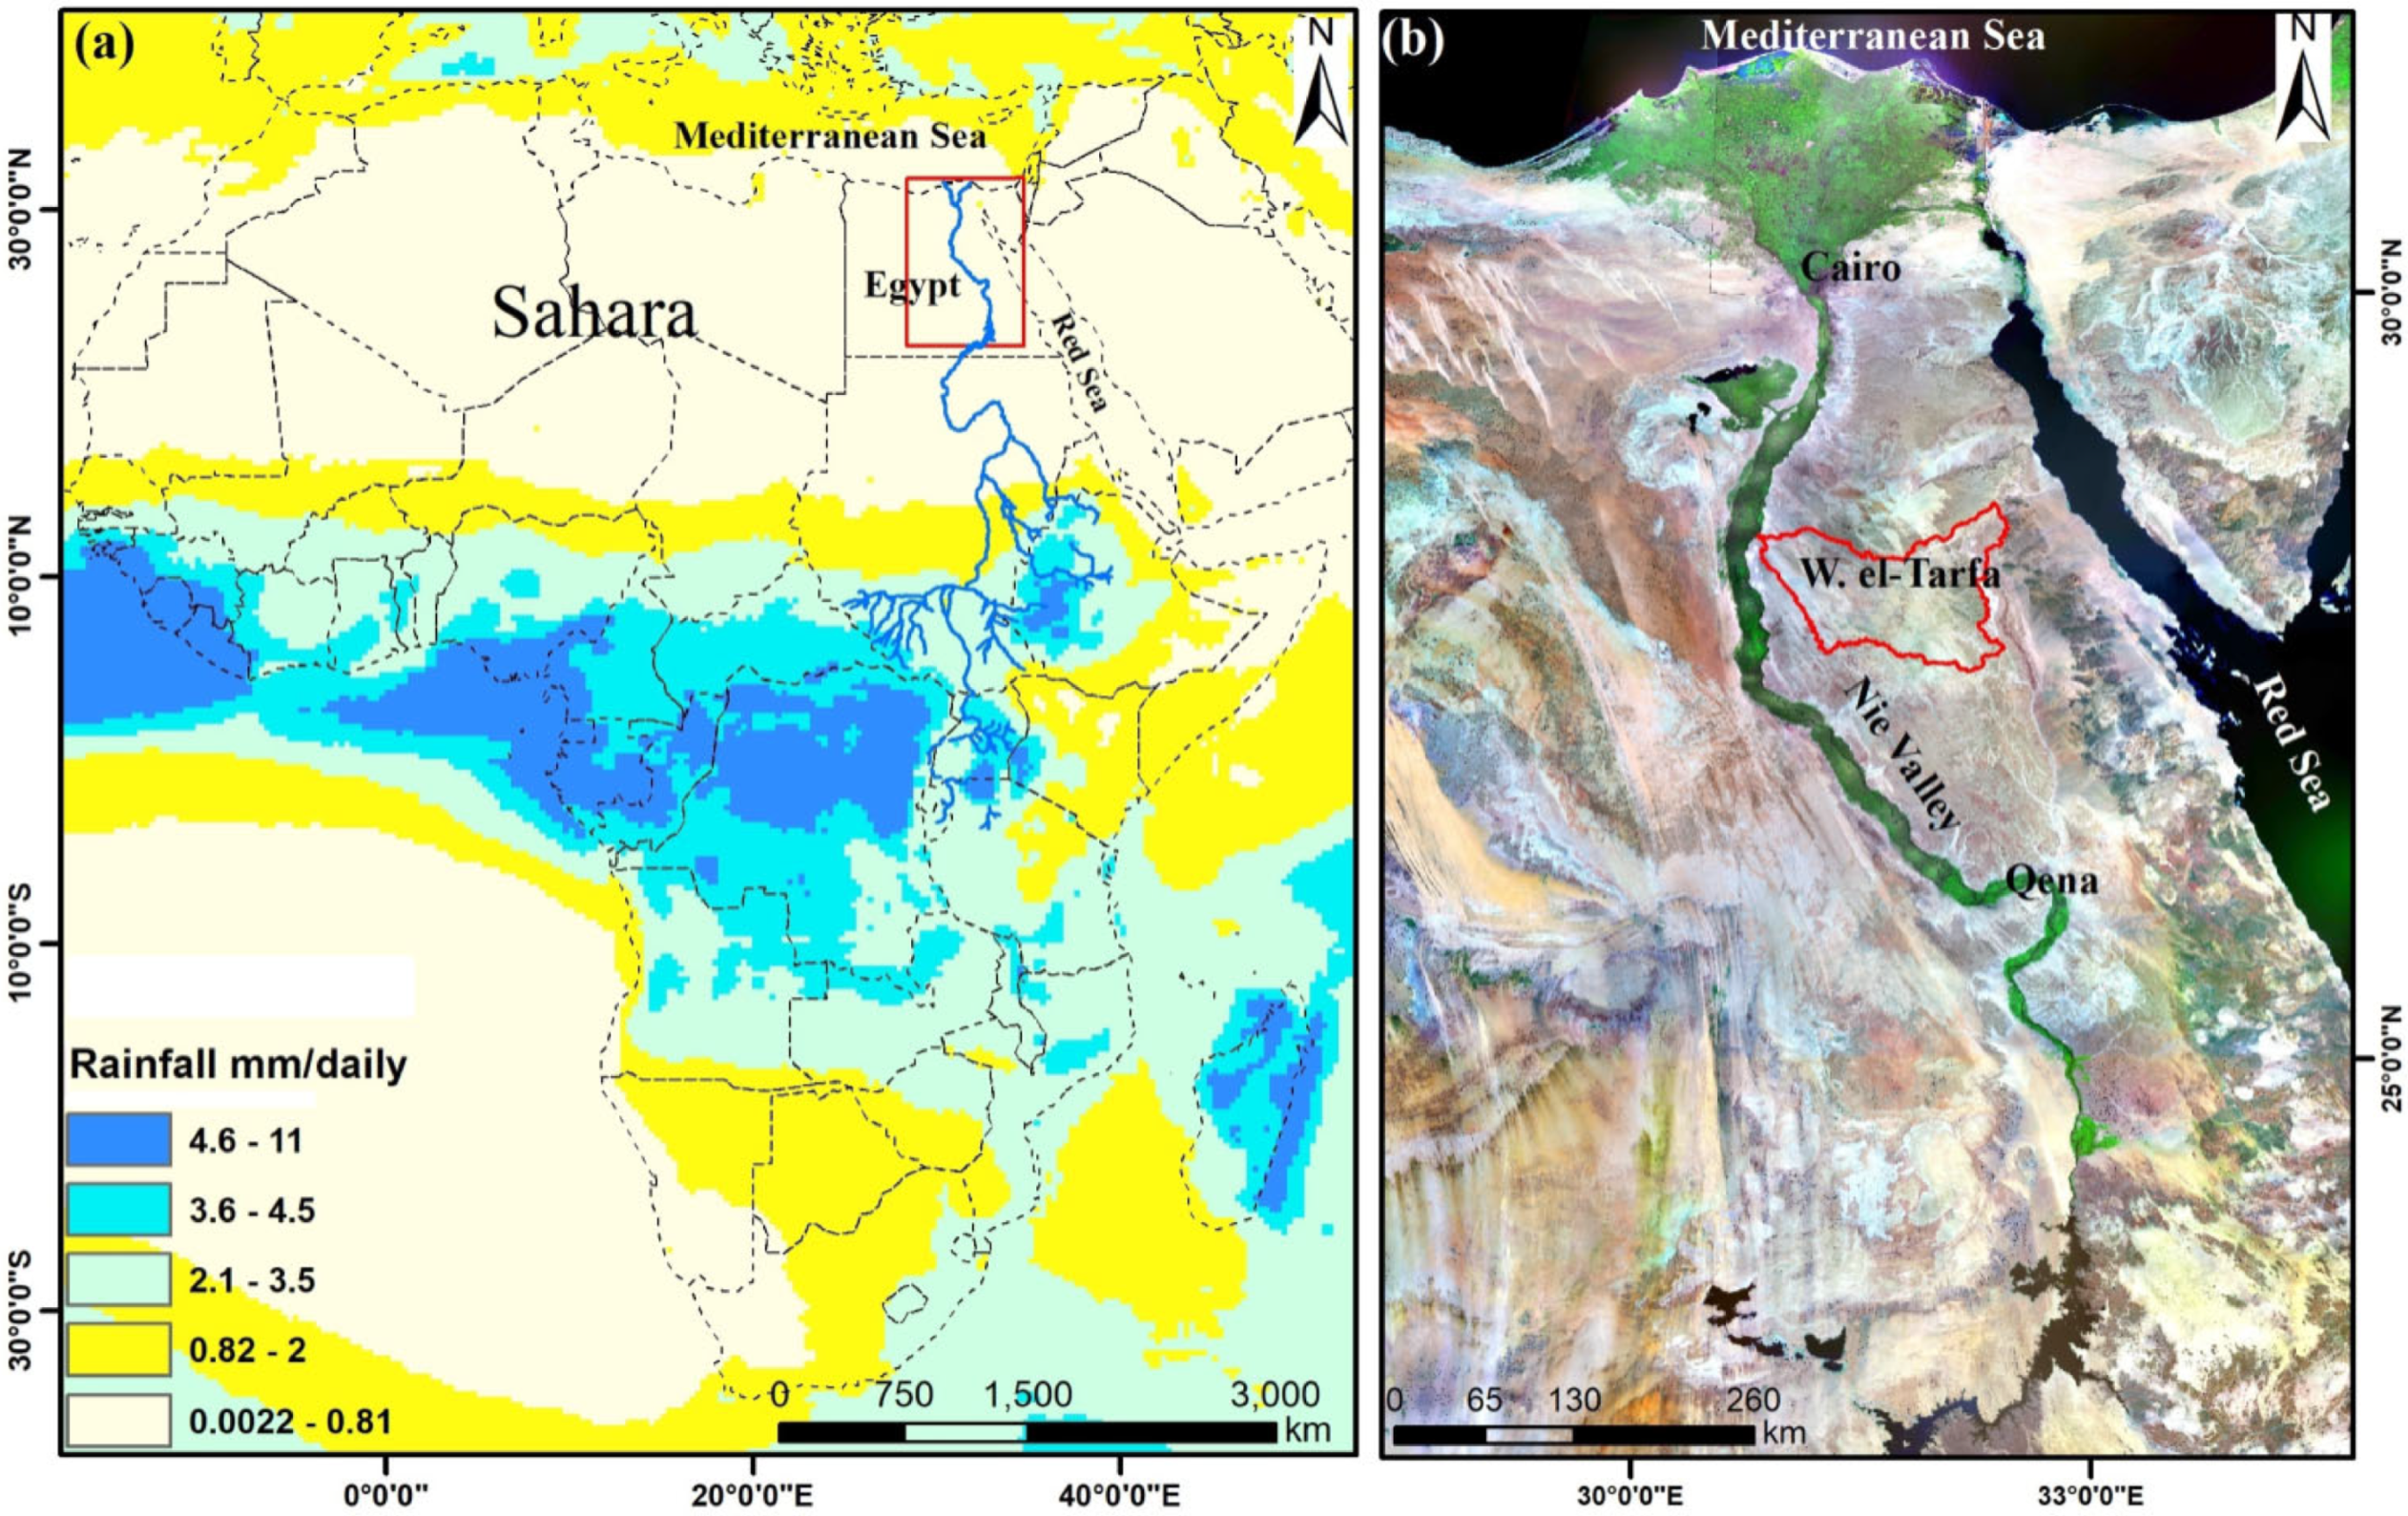
2. Study Area
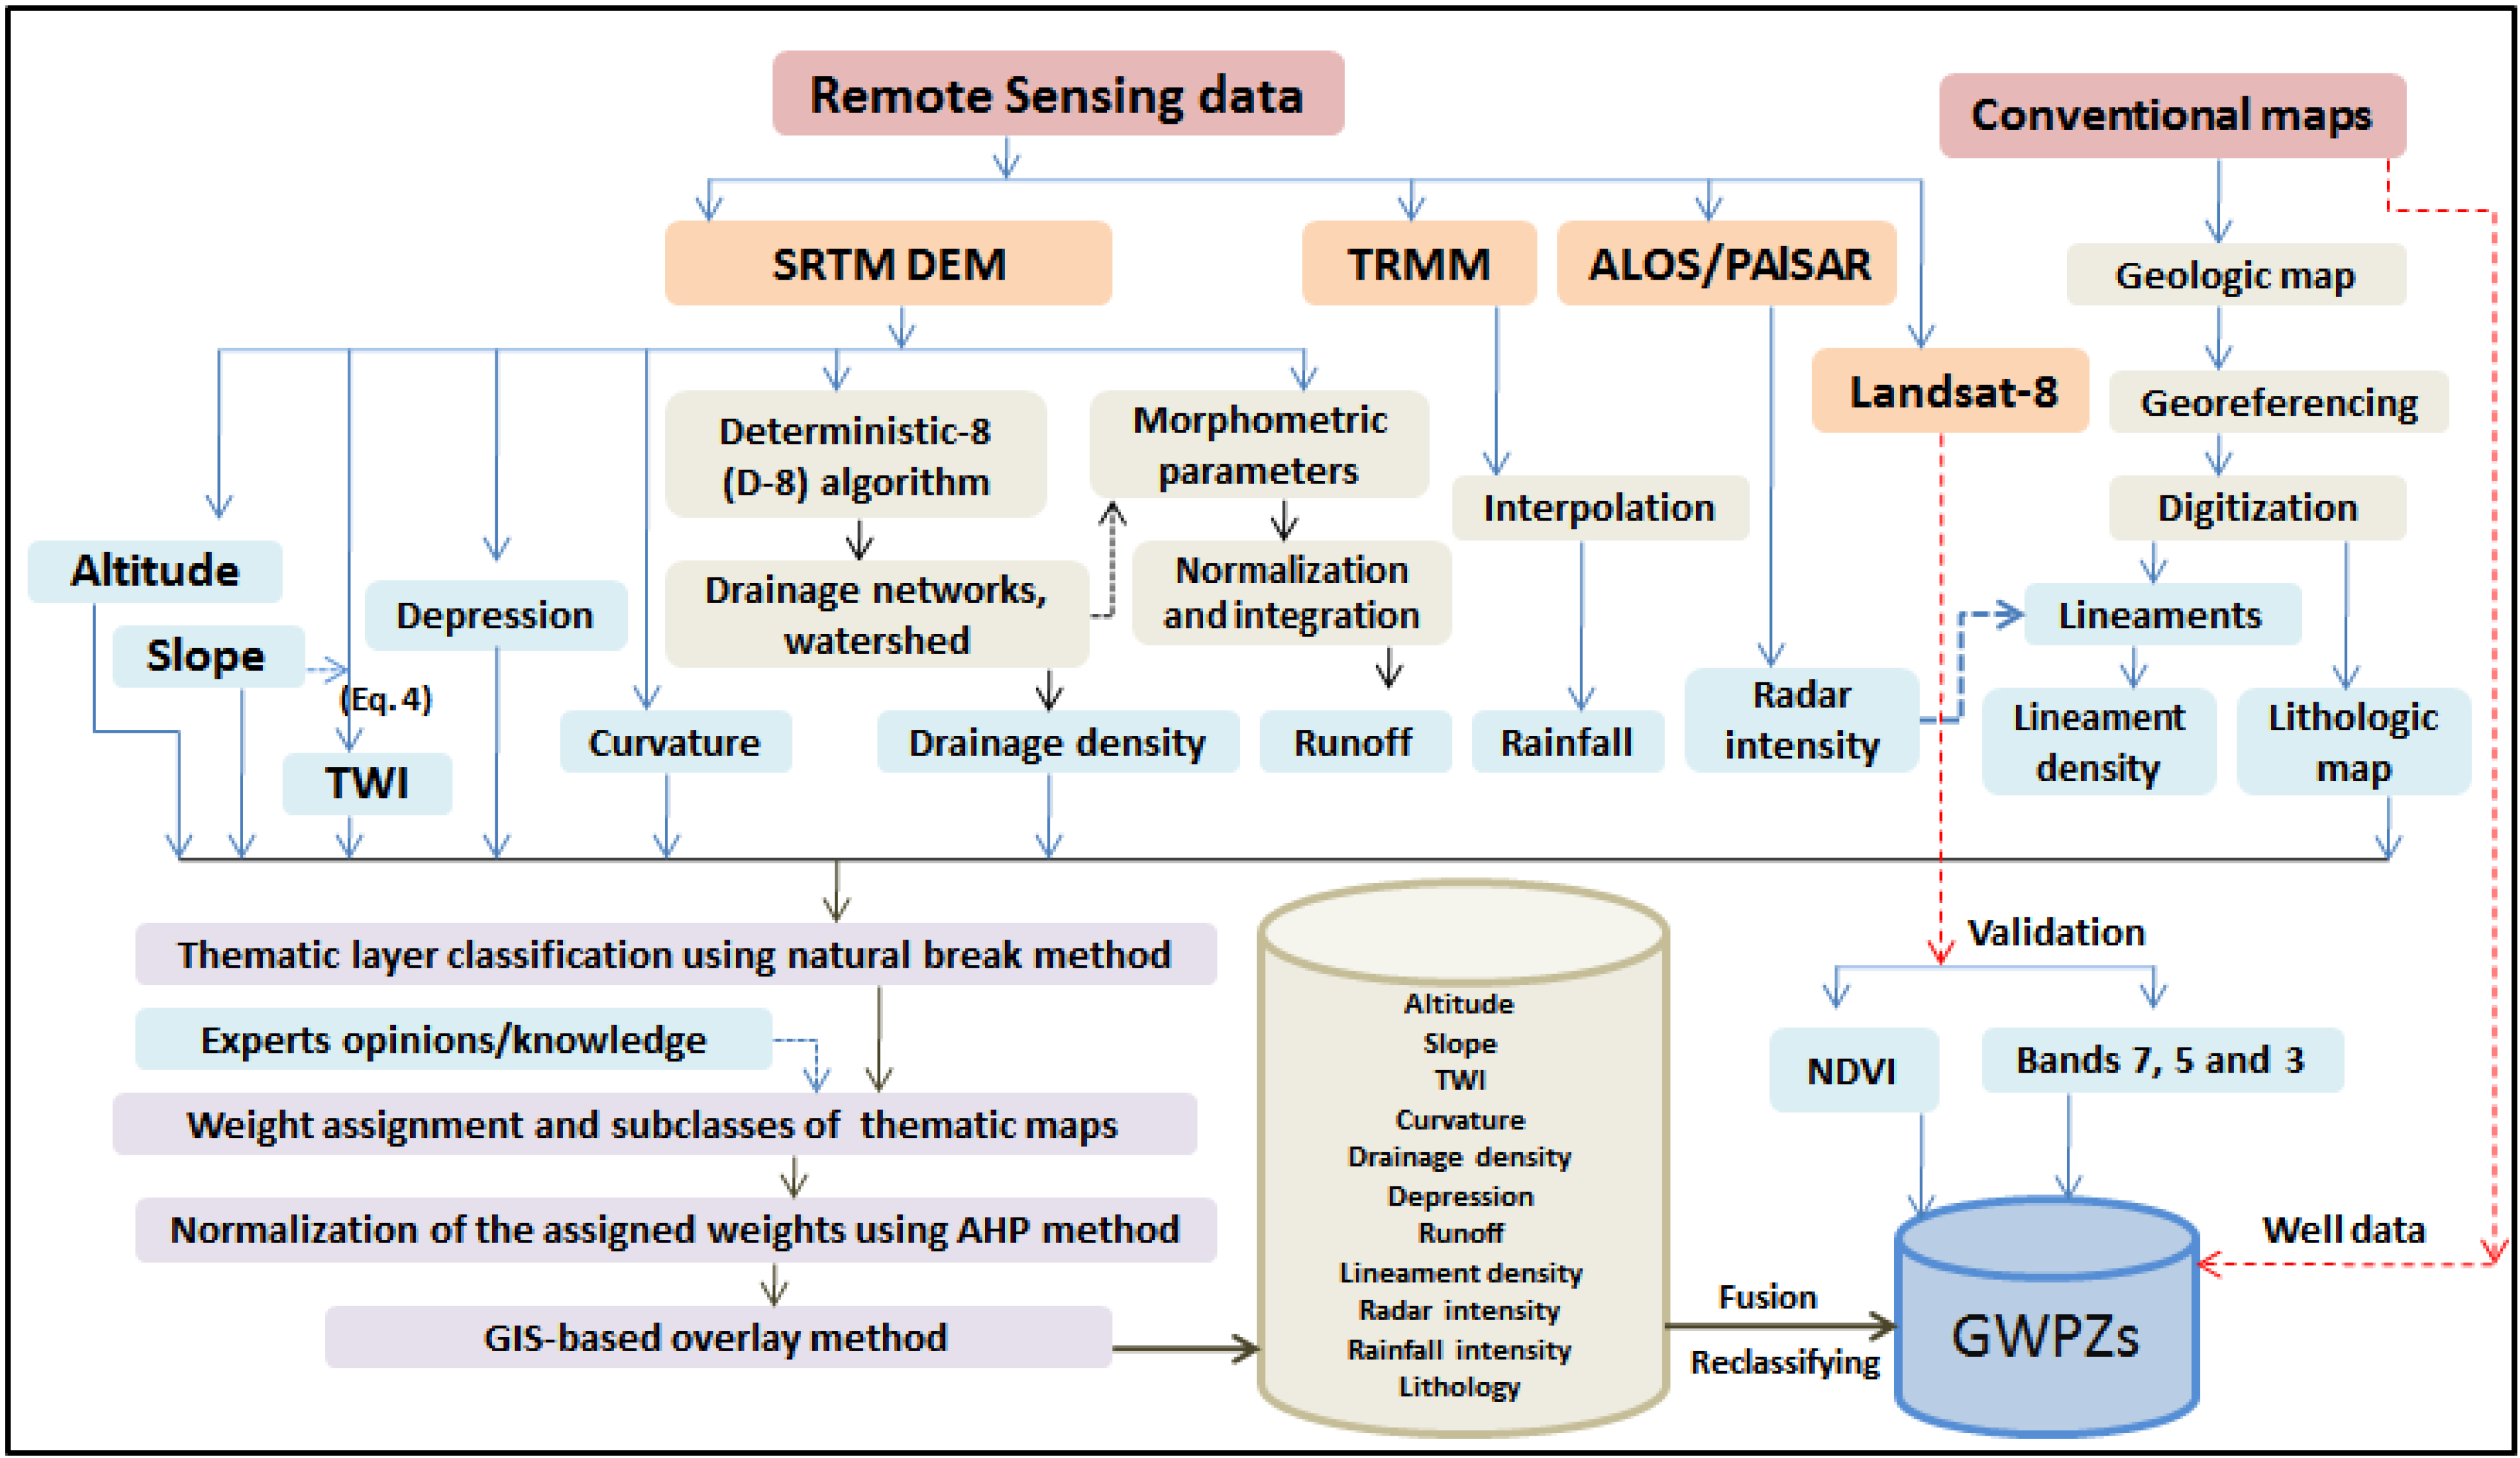
3. Data Used and Methods
4. Factors Influencing GWPZs
4.1. Lithology
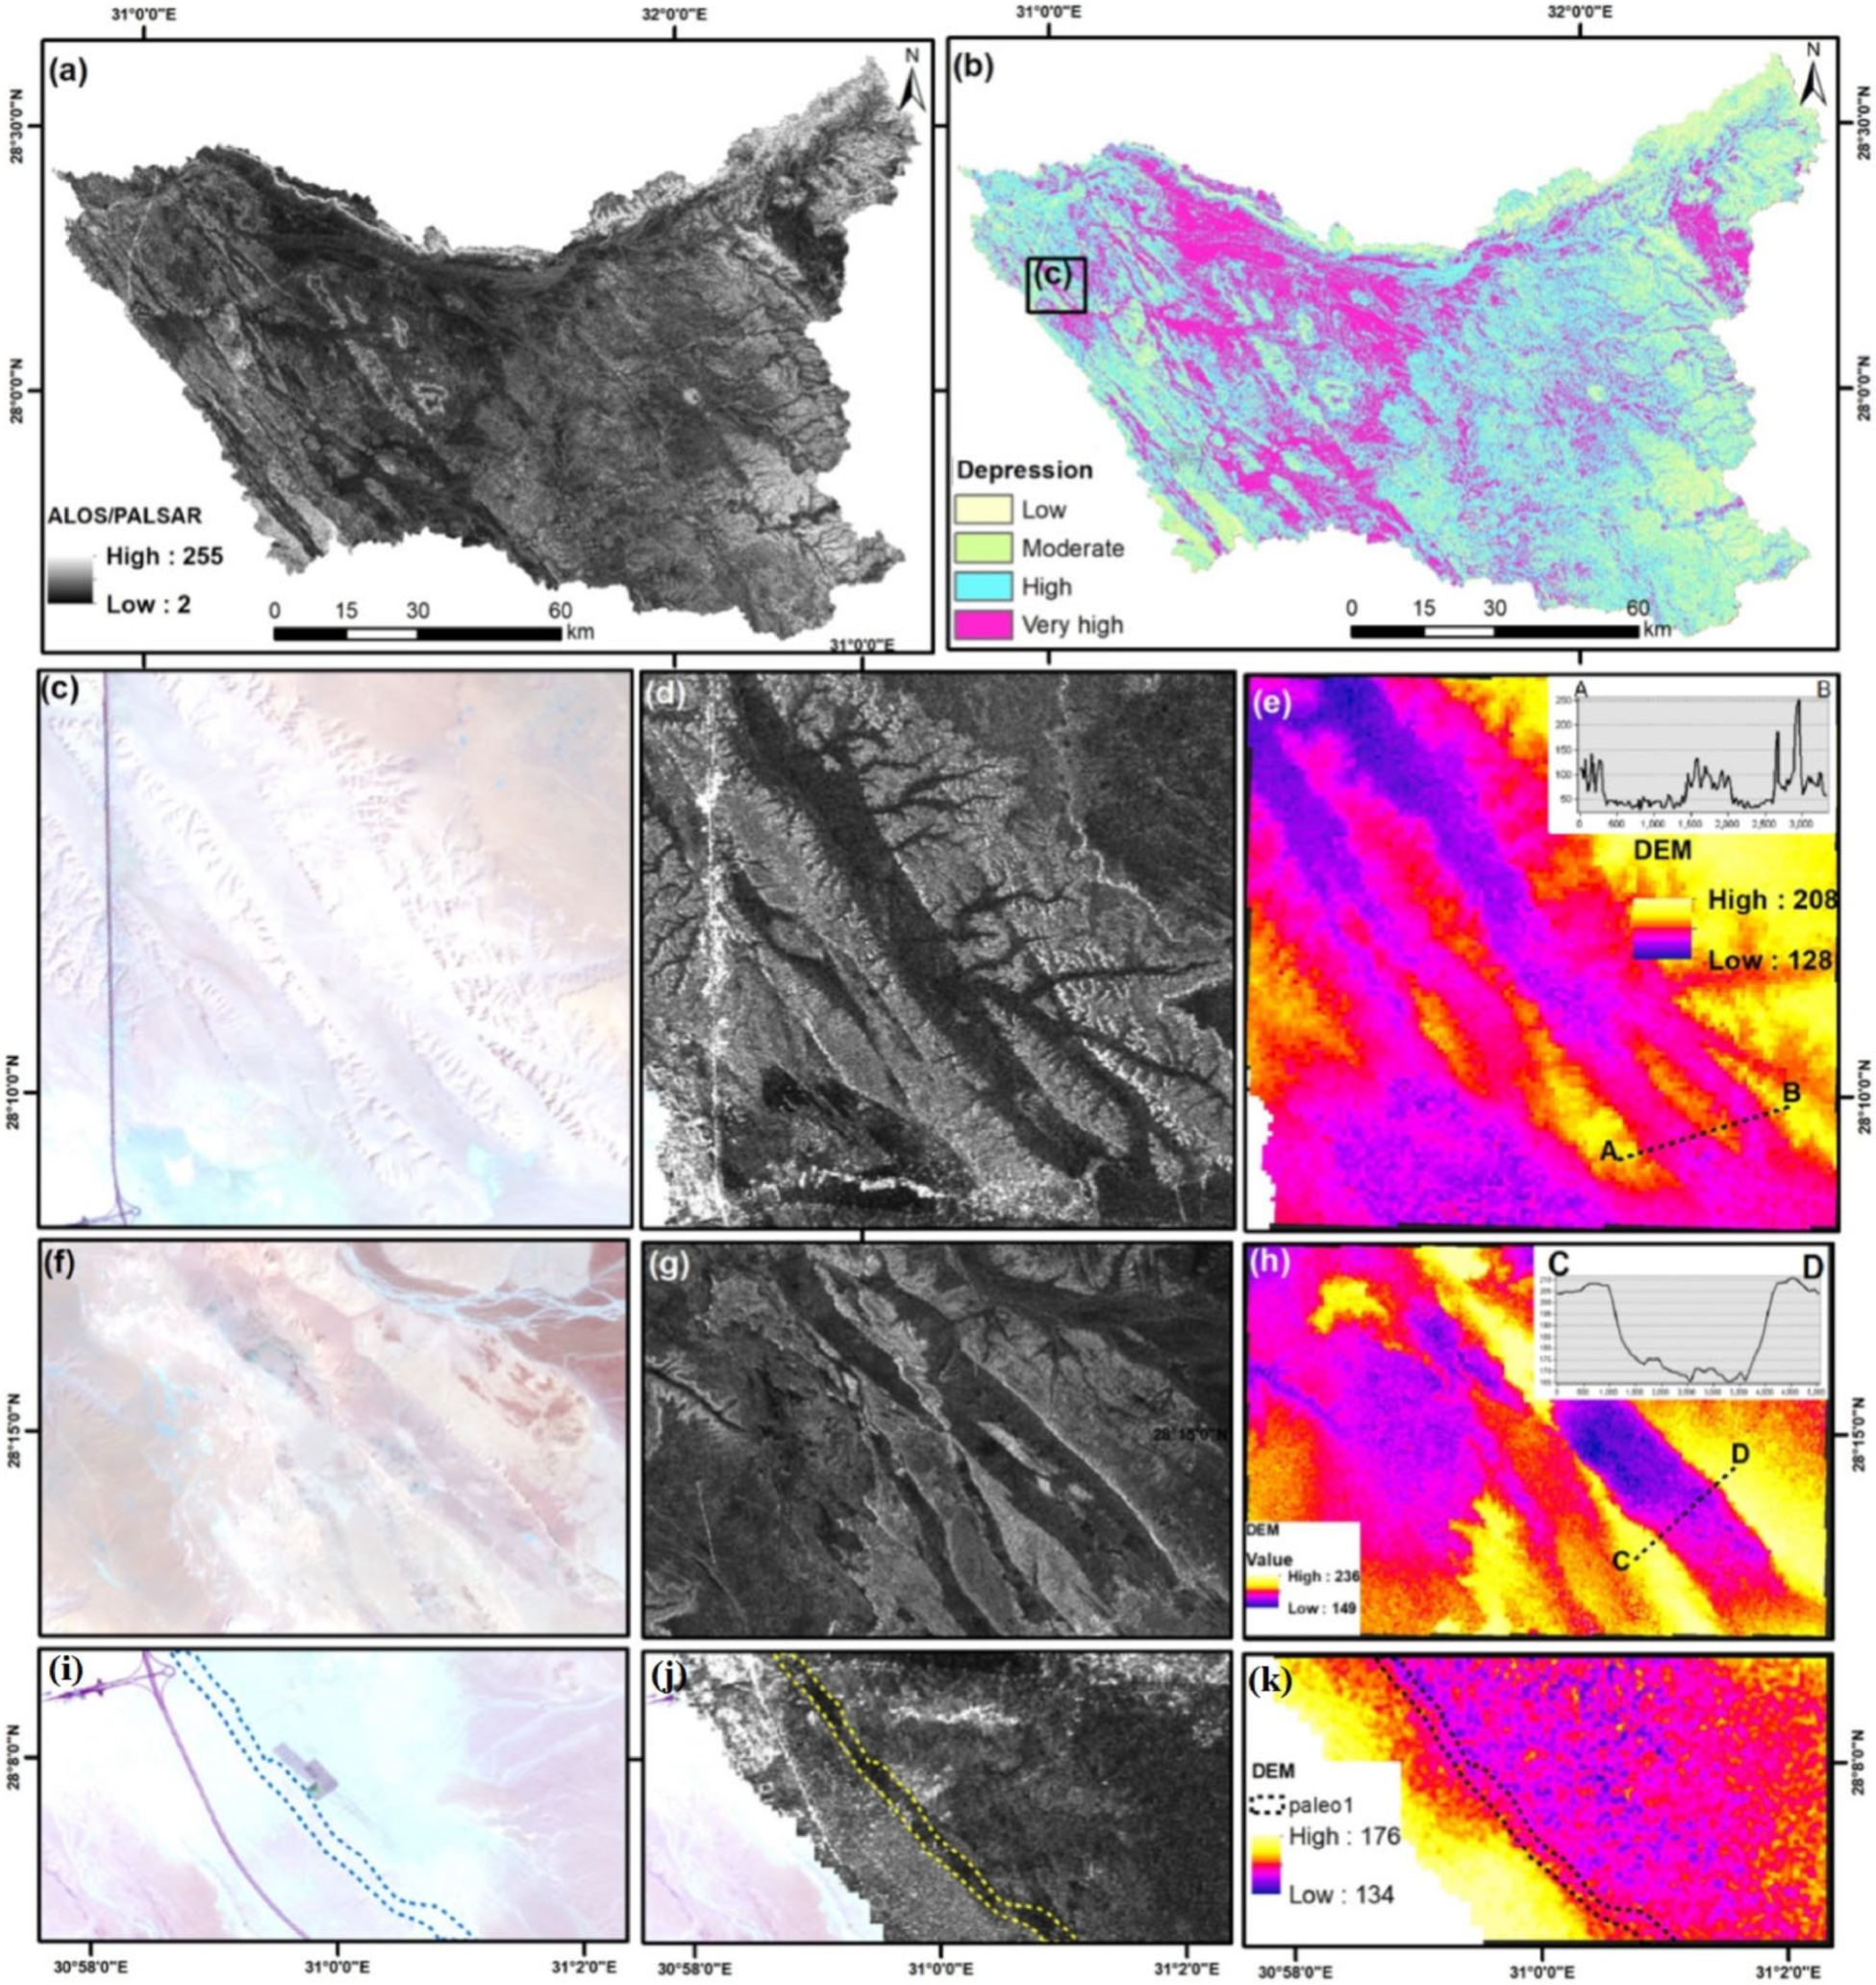
4.2. Radar Intensity
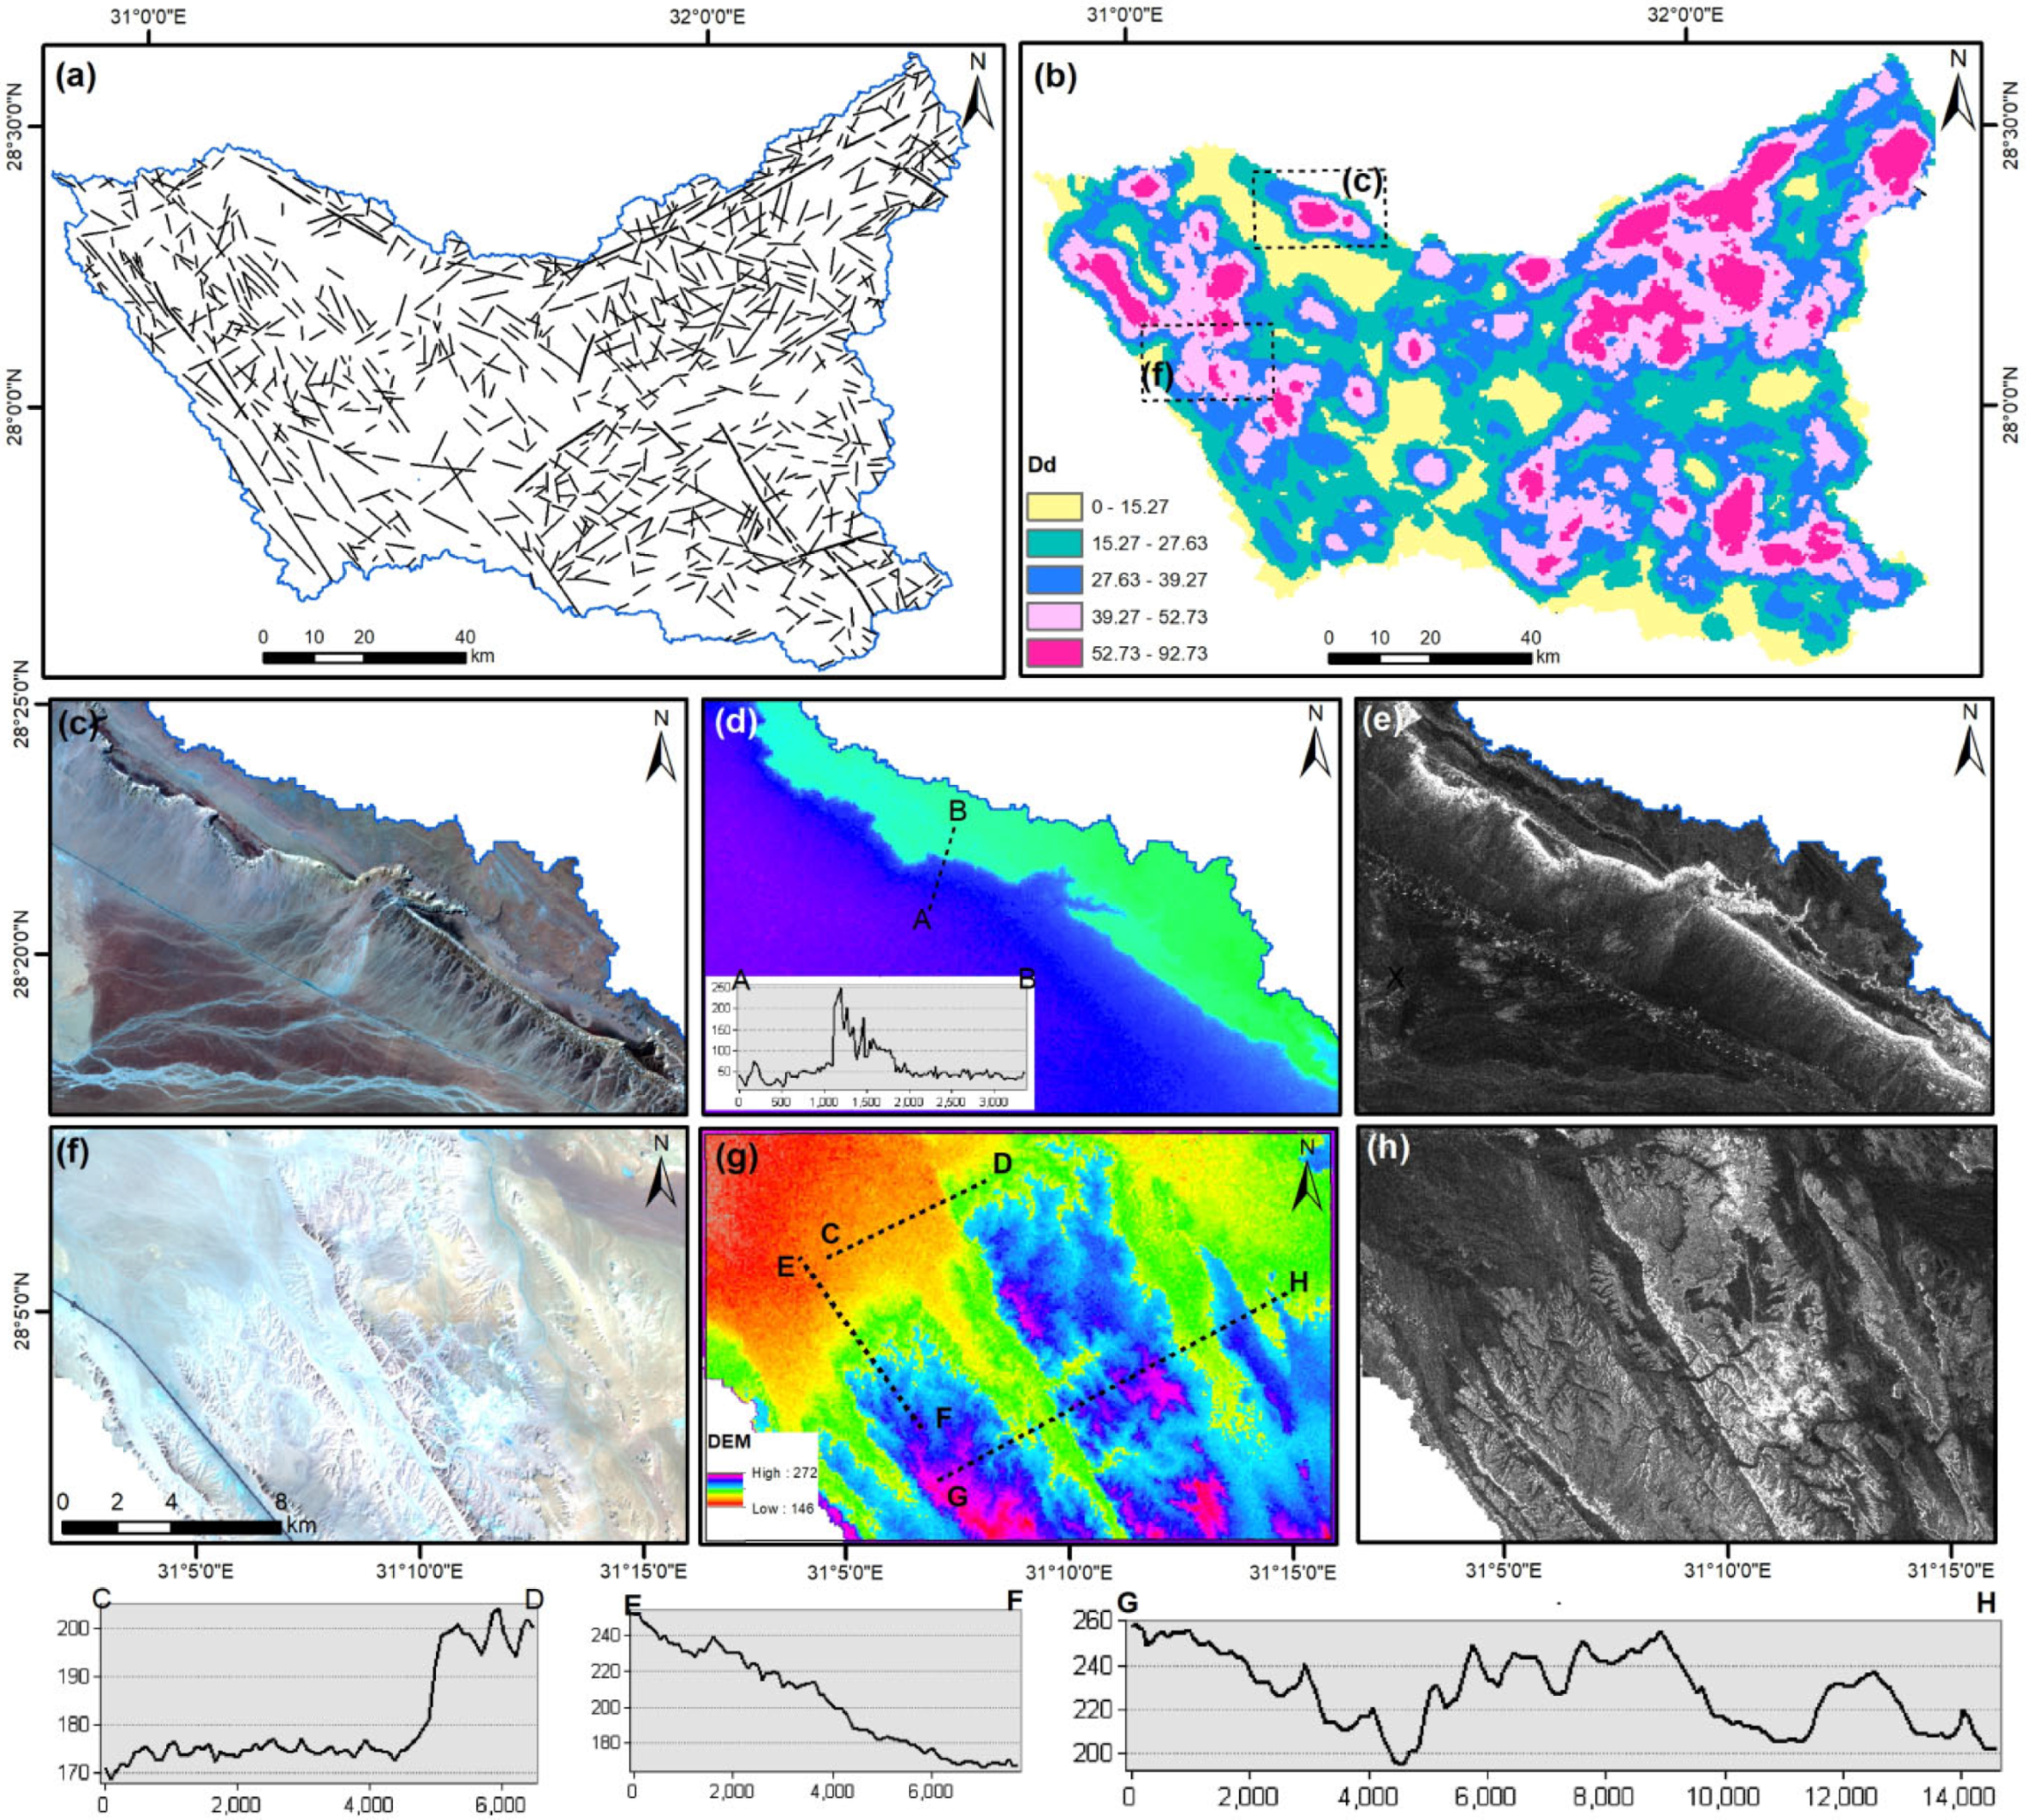
4.3. Lineaments
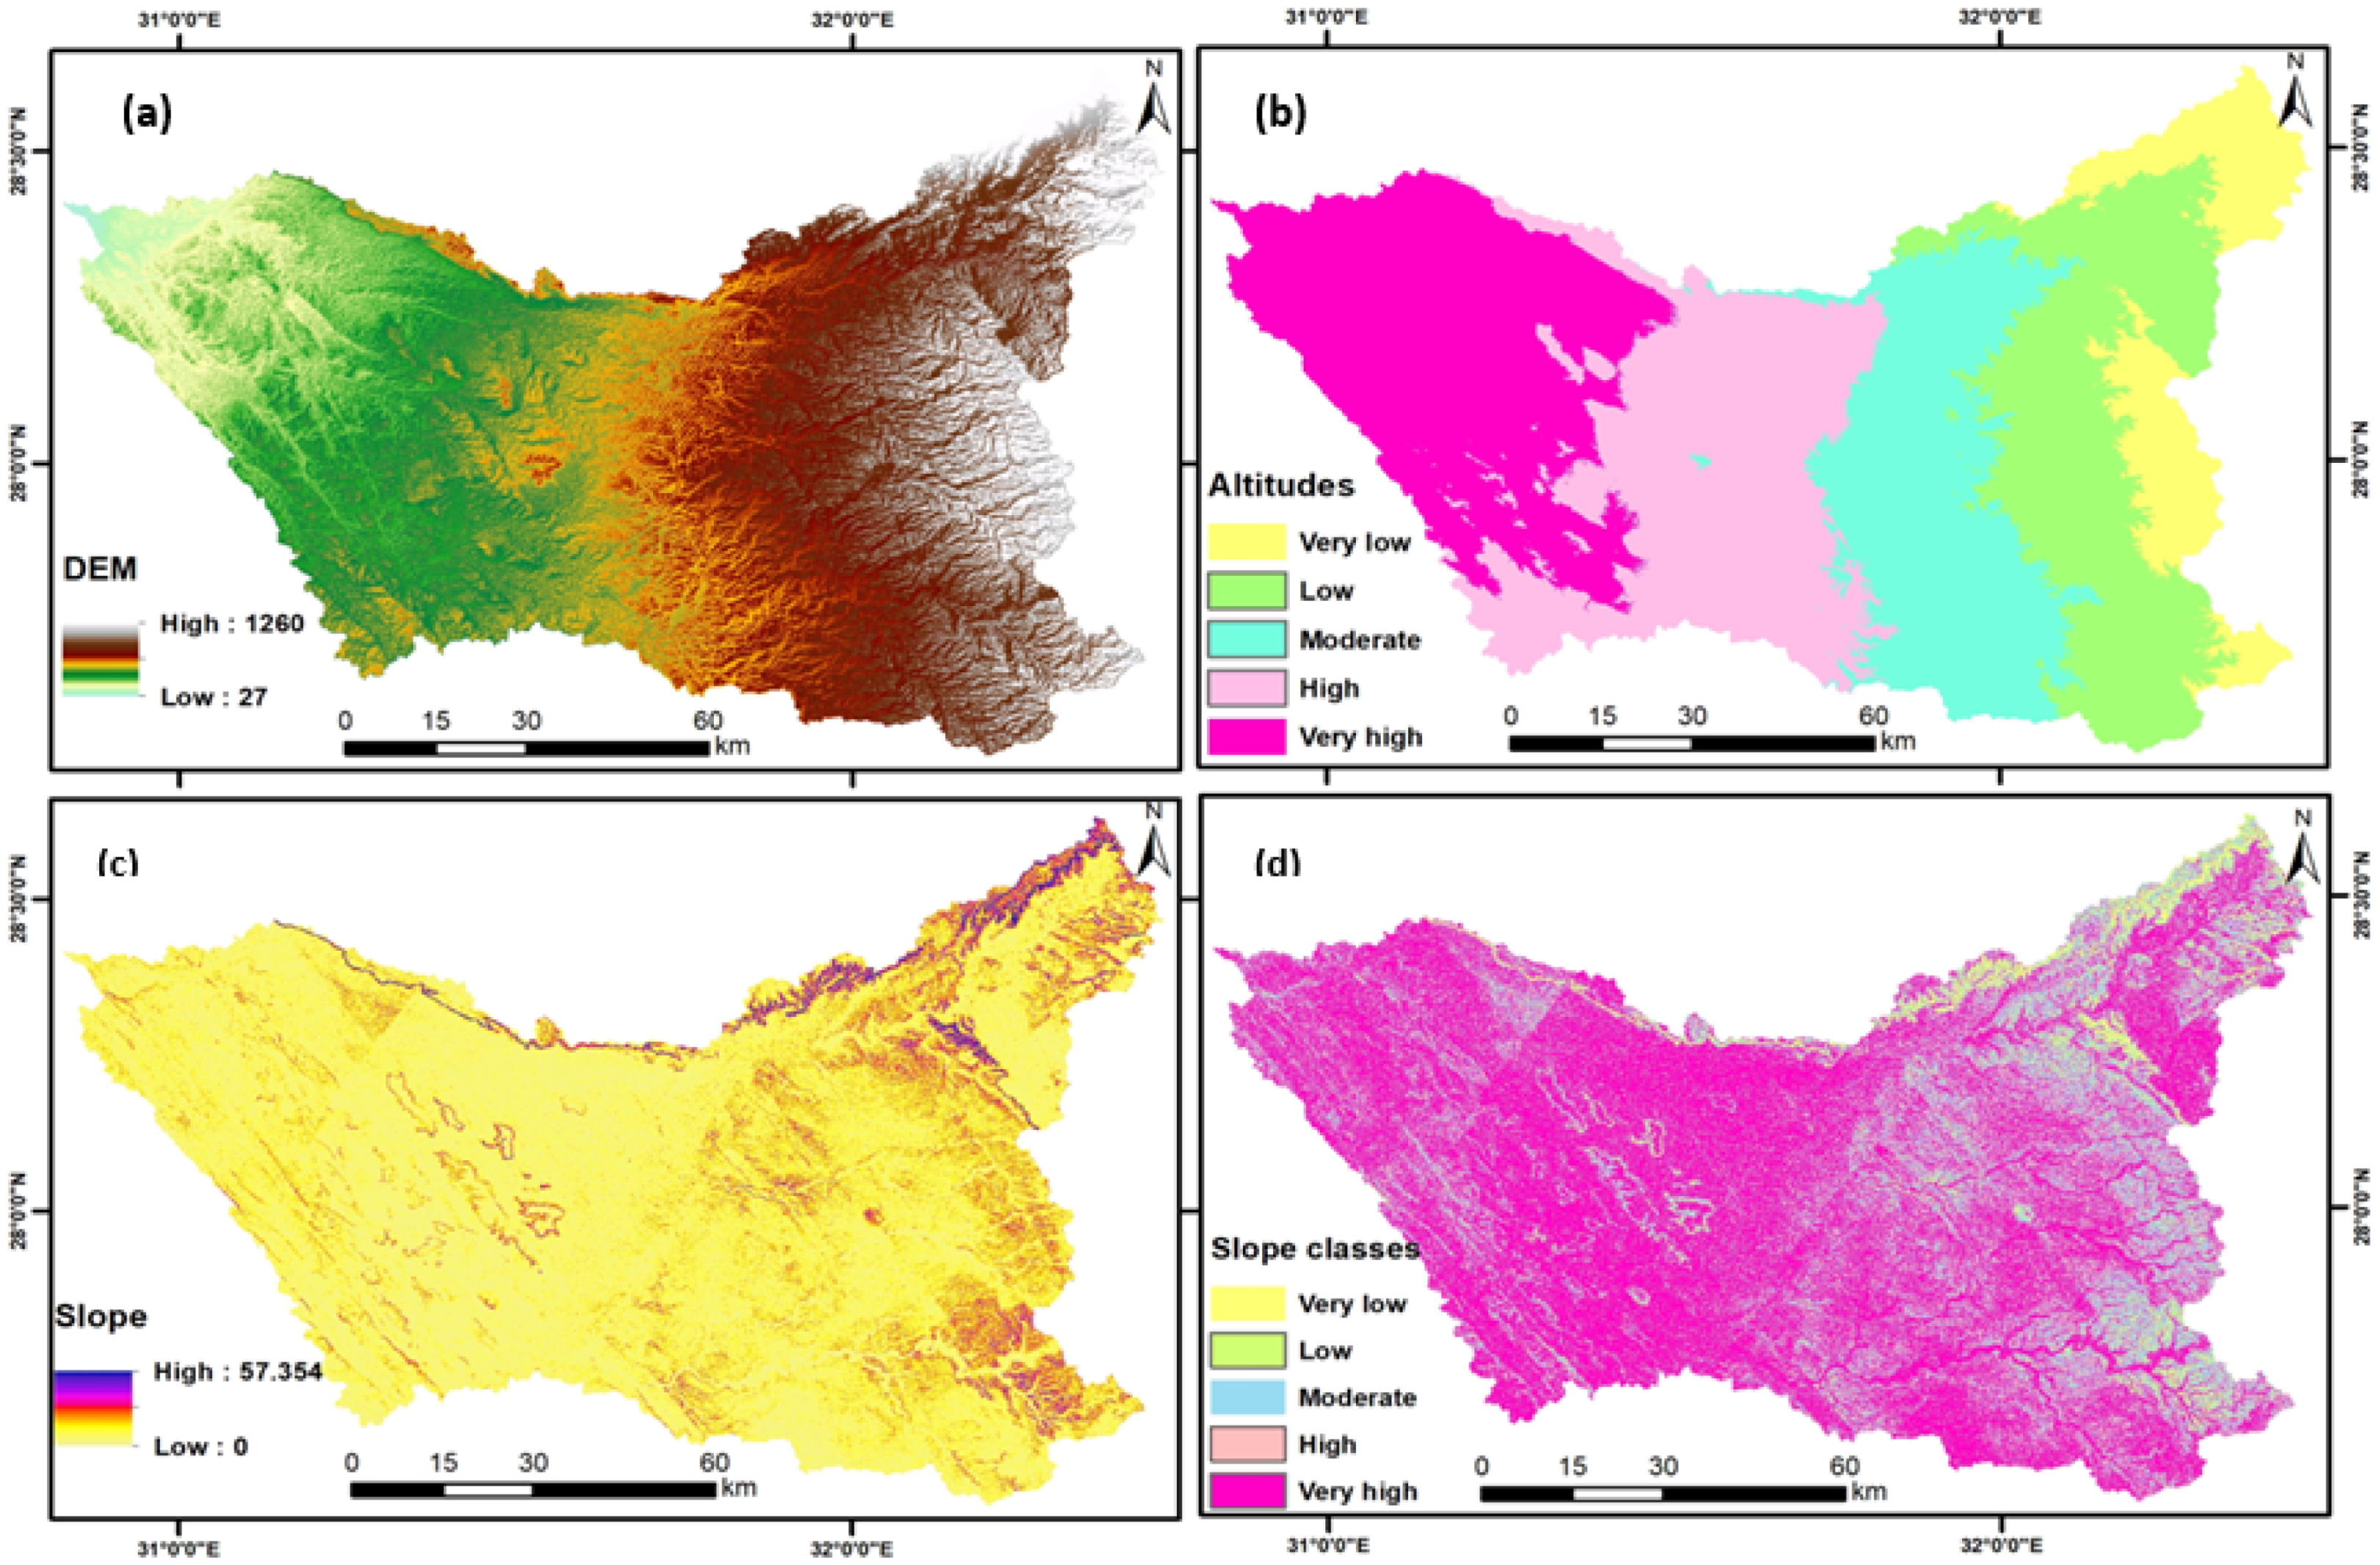
4.4. Altitude
4.5. Slope

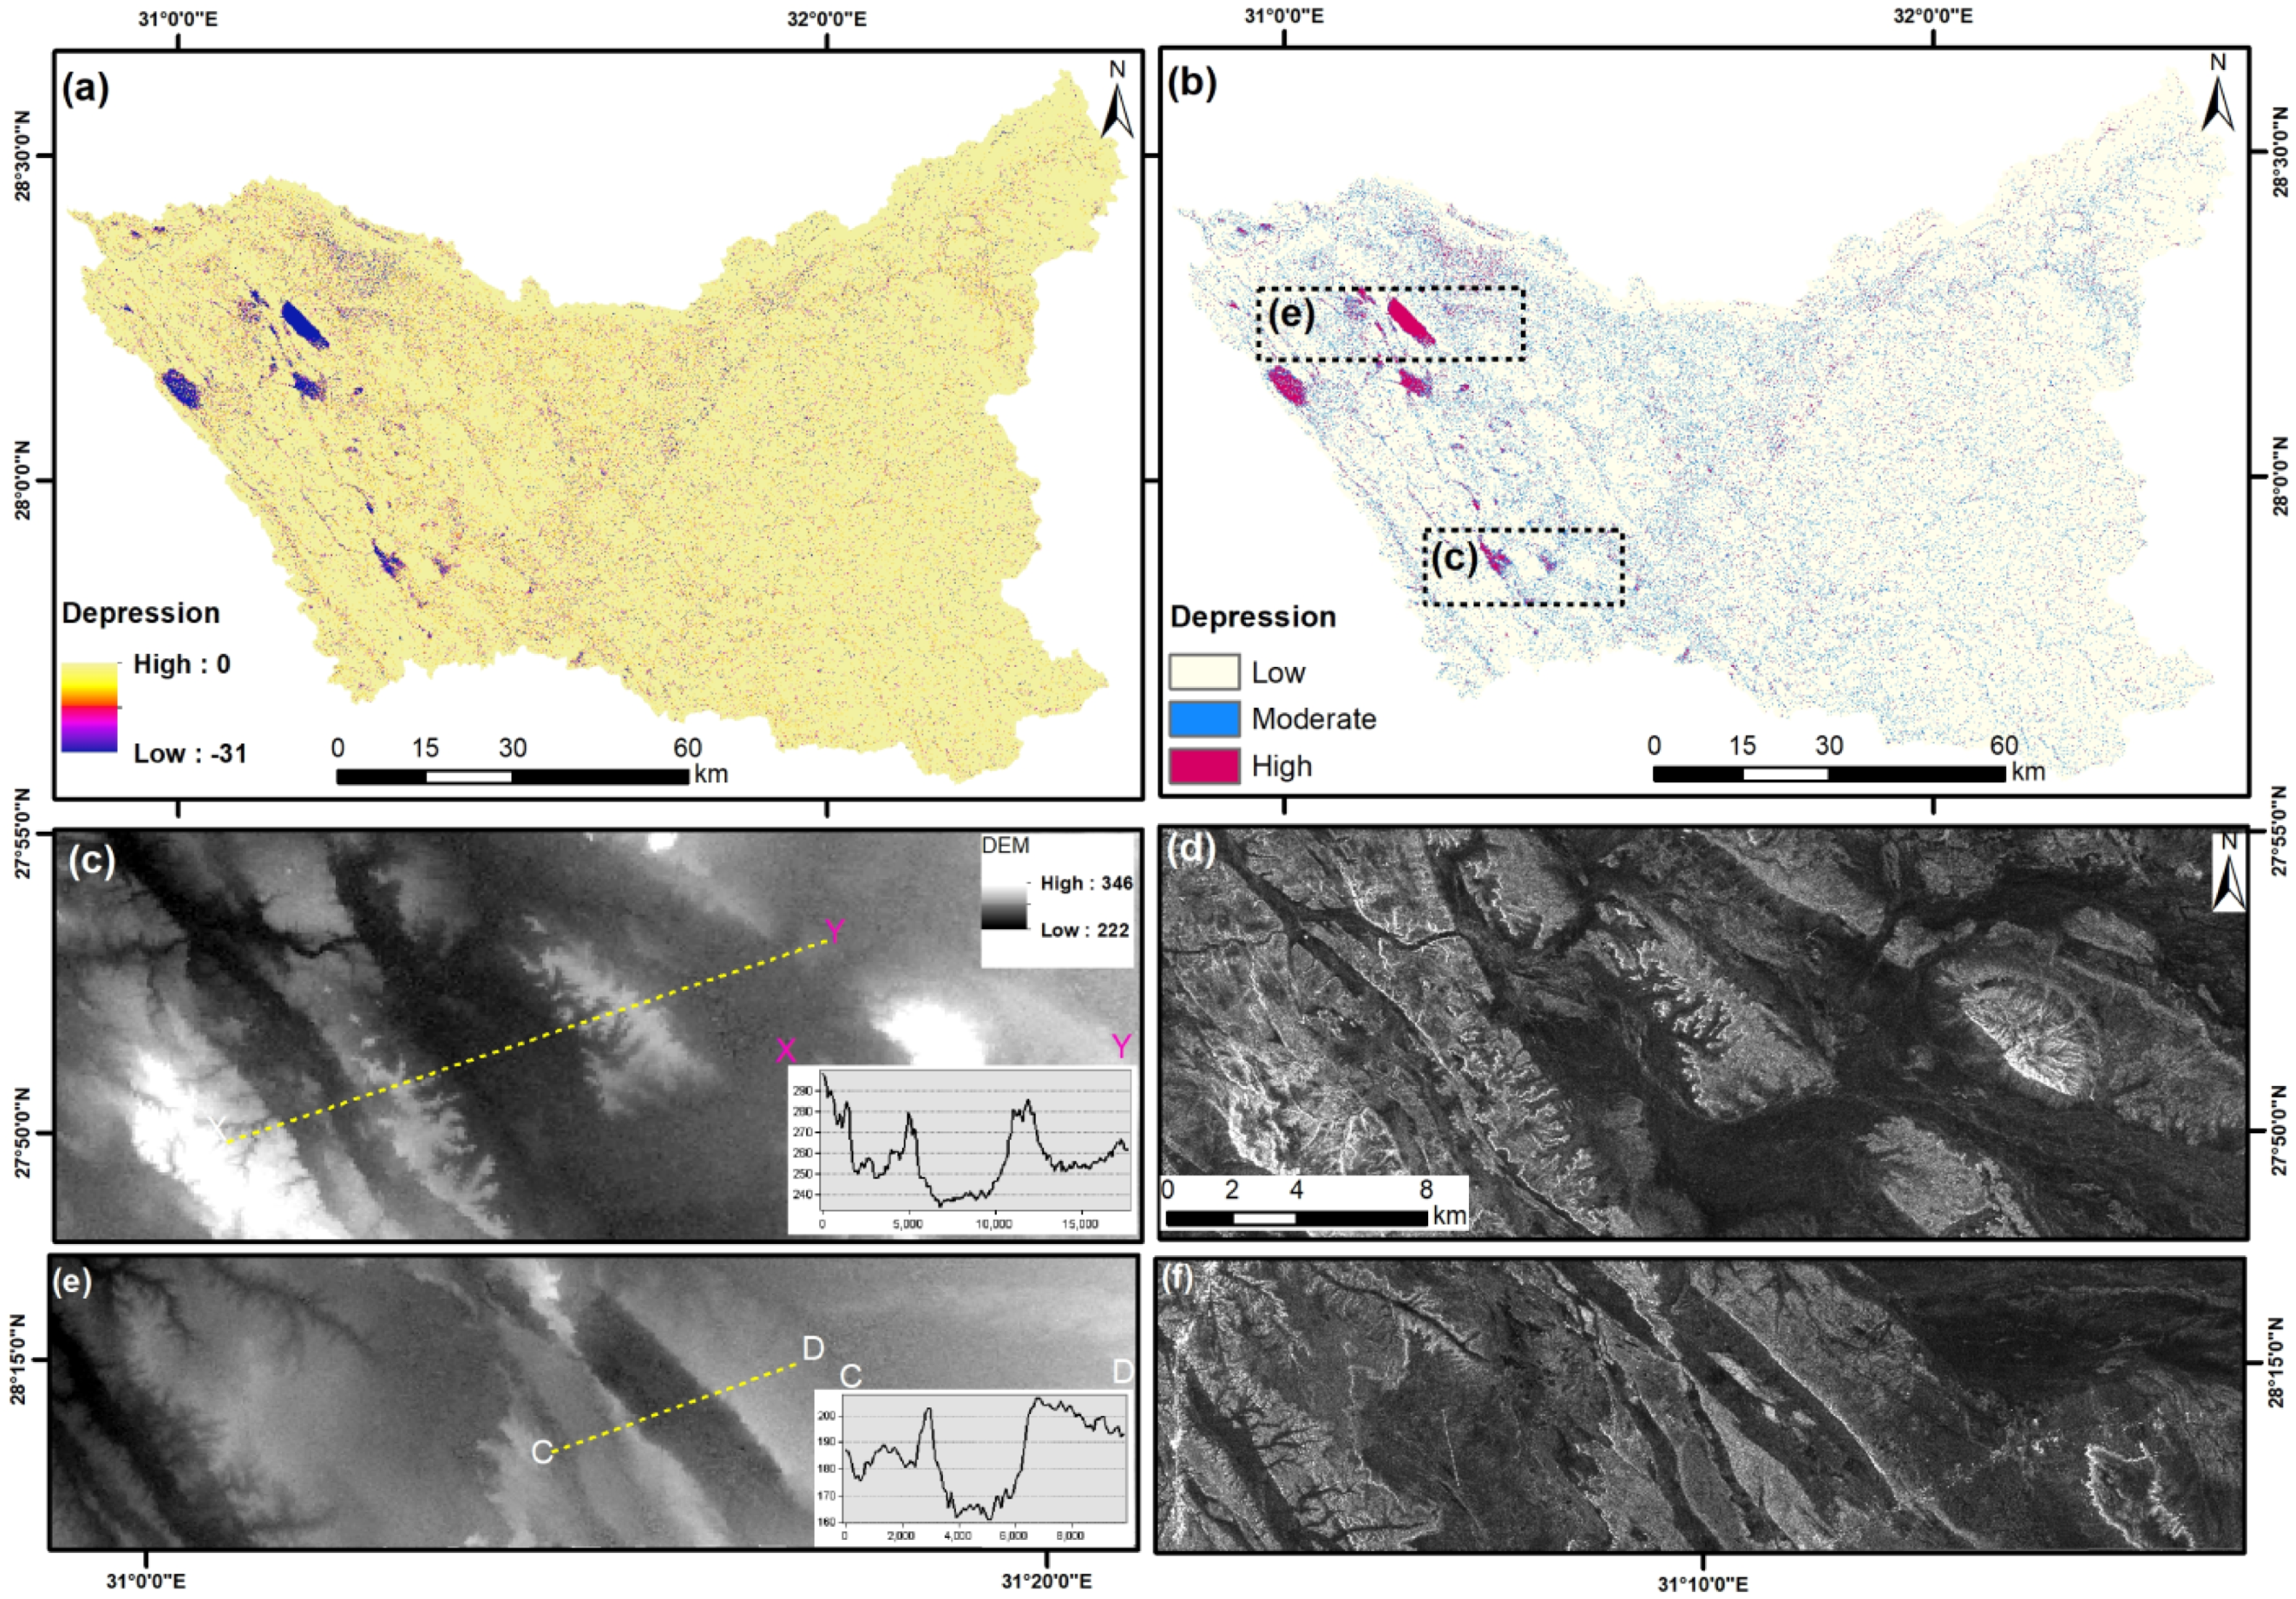
4.6. Depressions
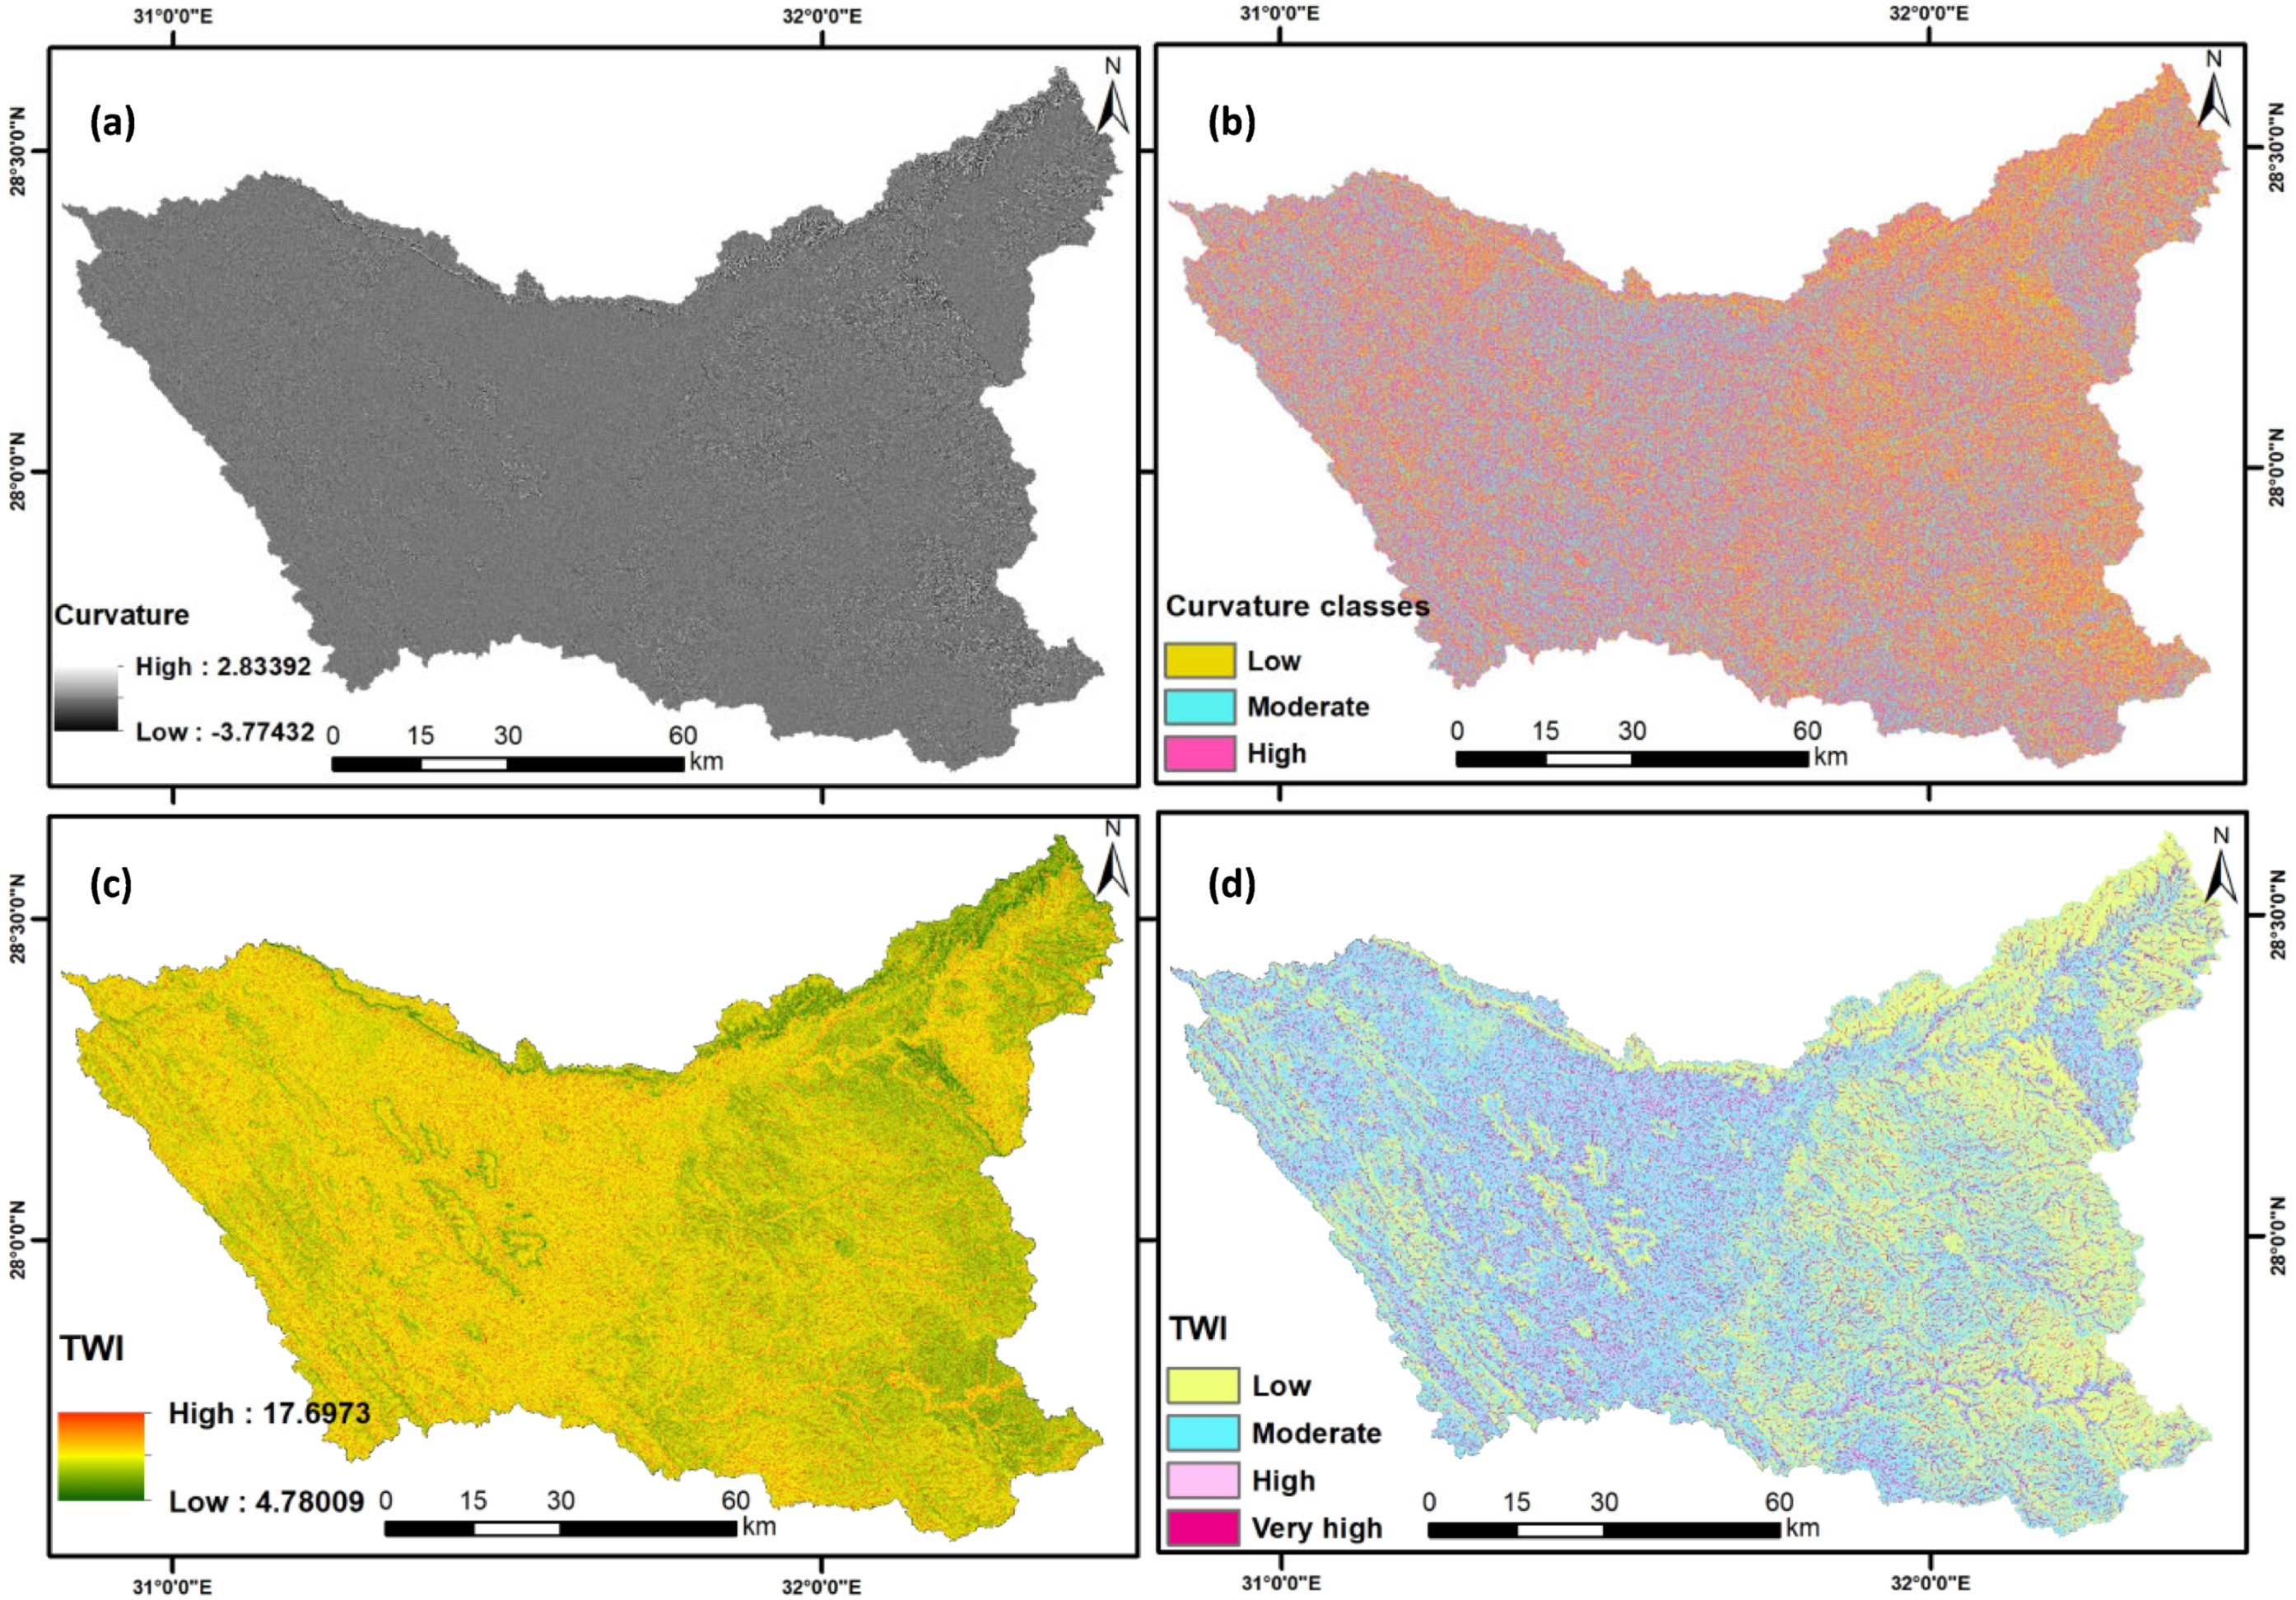
4.7. Surface Curvature
4.8. Topographic Wetness Index (TWI)
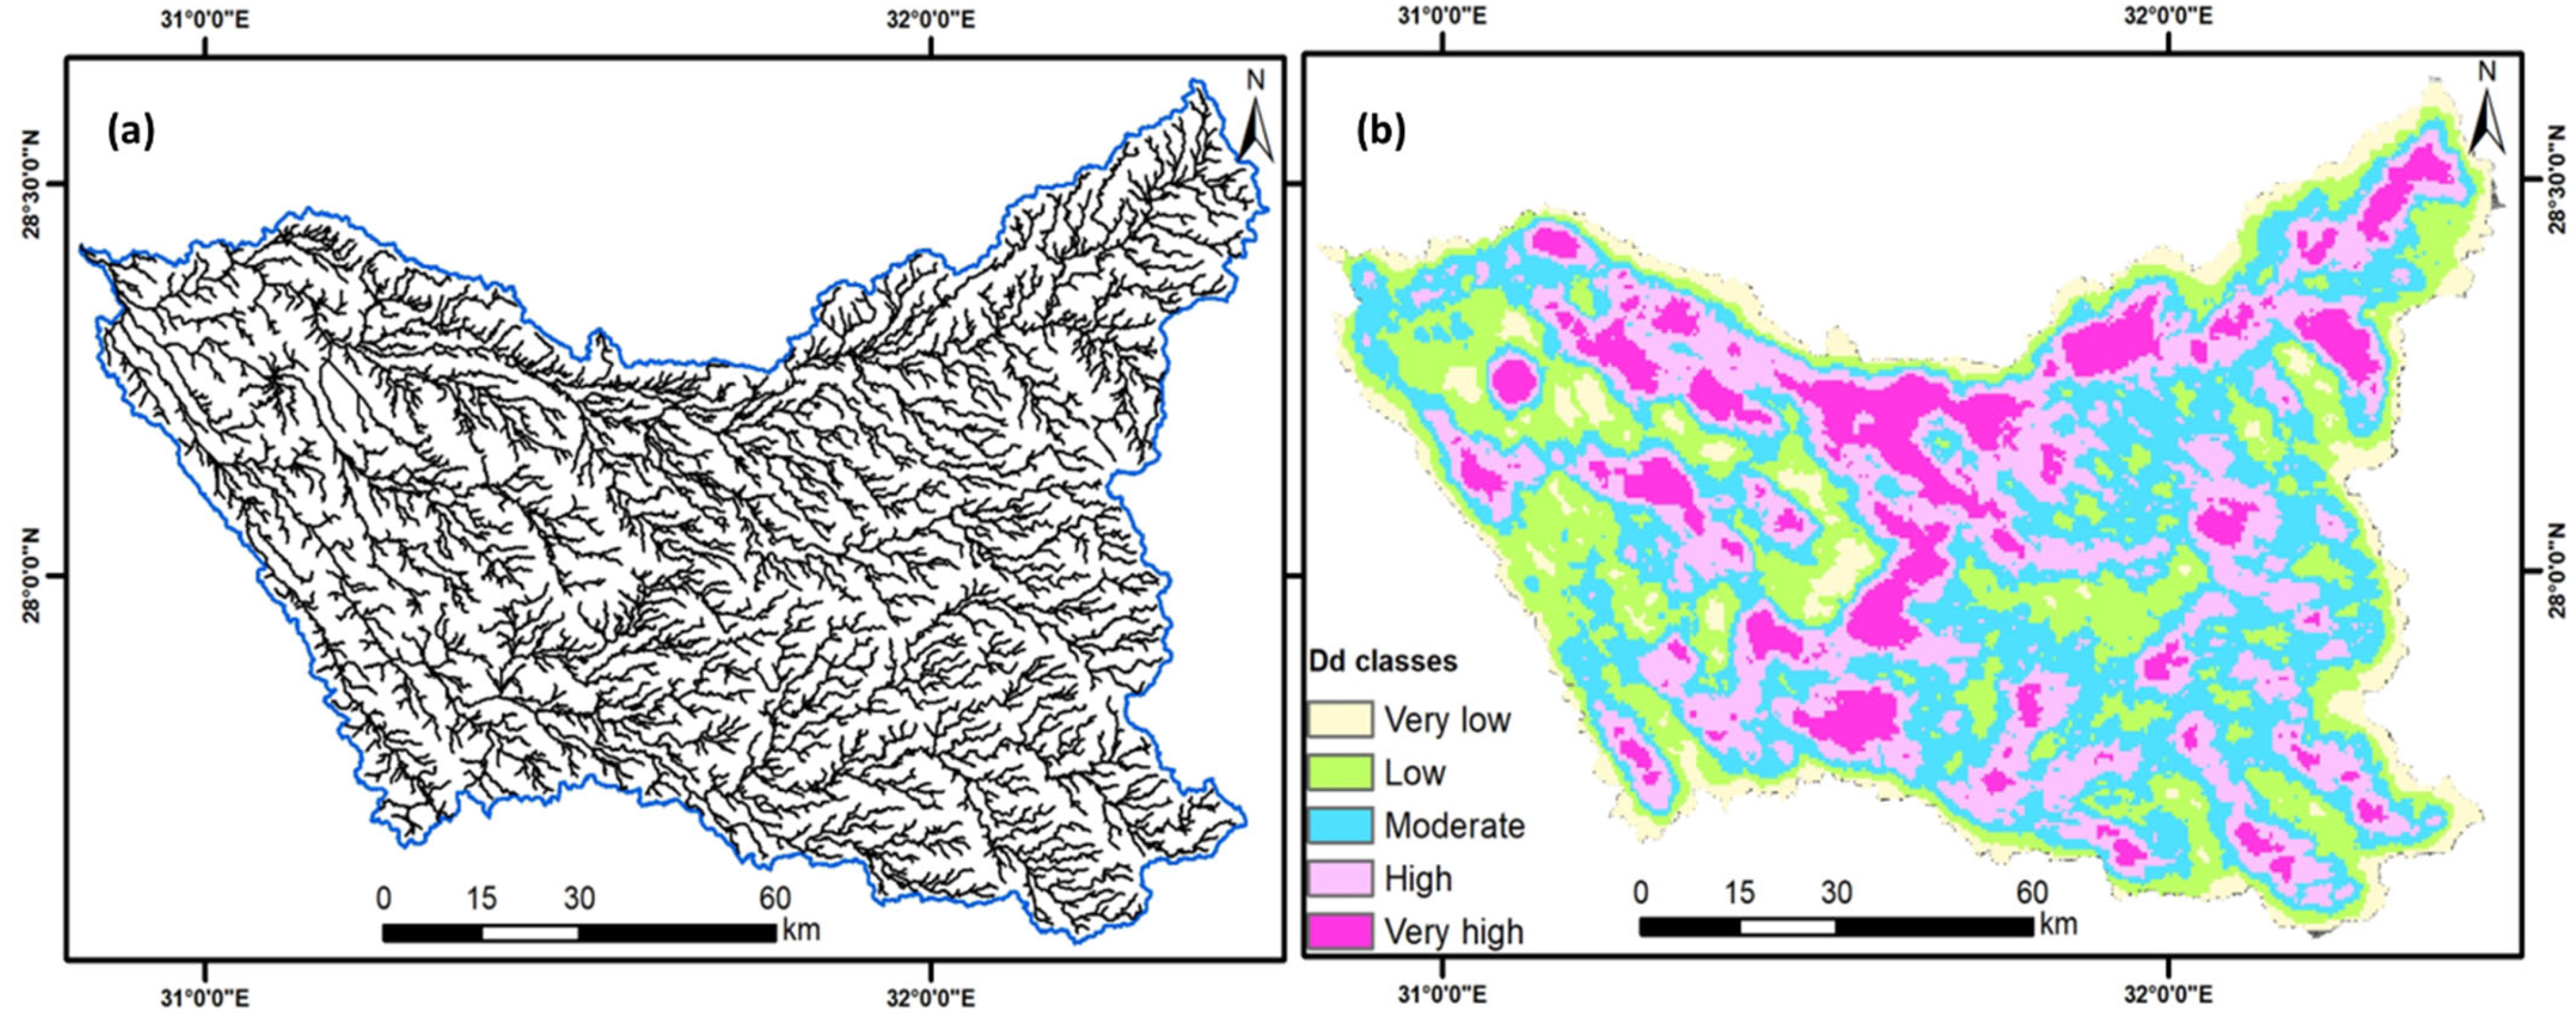
4.9. Drainage Density
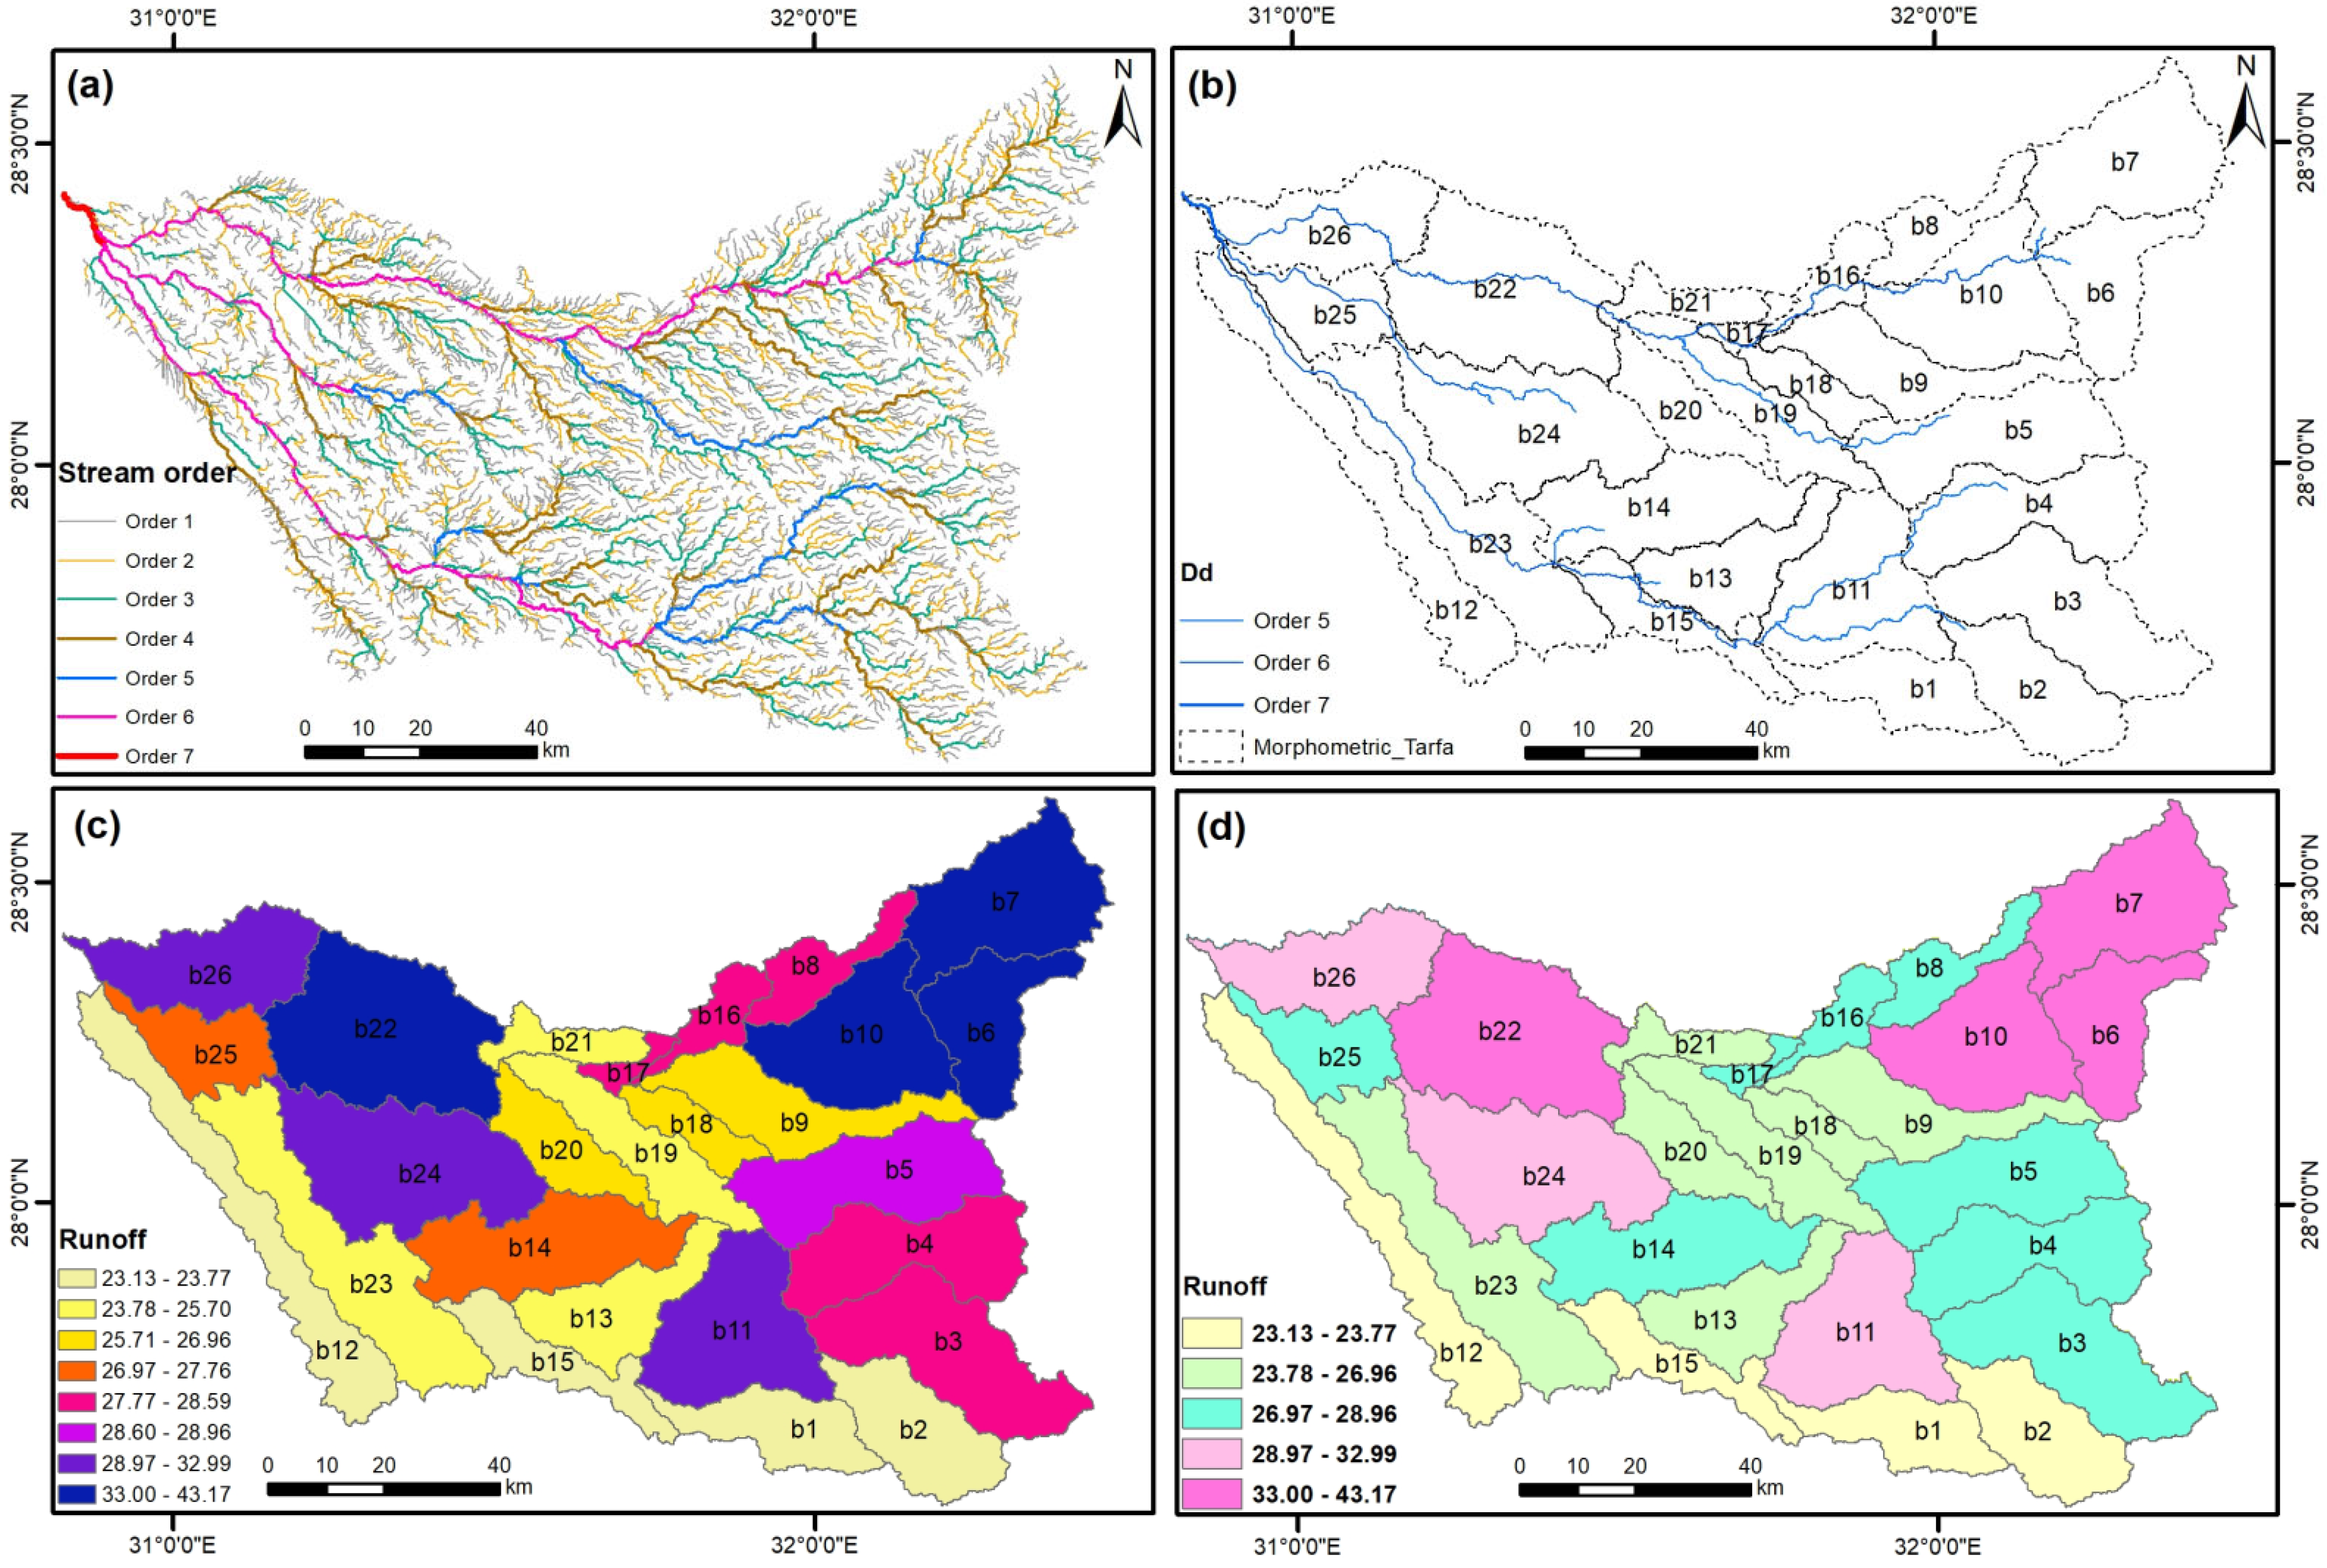
4.10. Runoff Using Physical Characteristics of Catchments
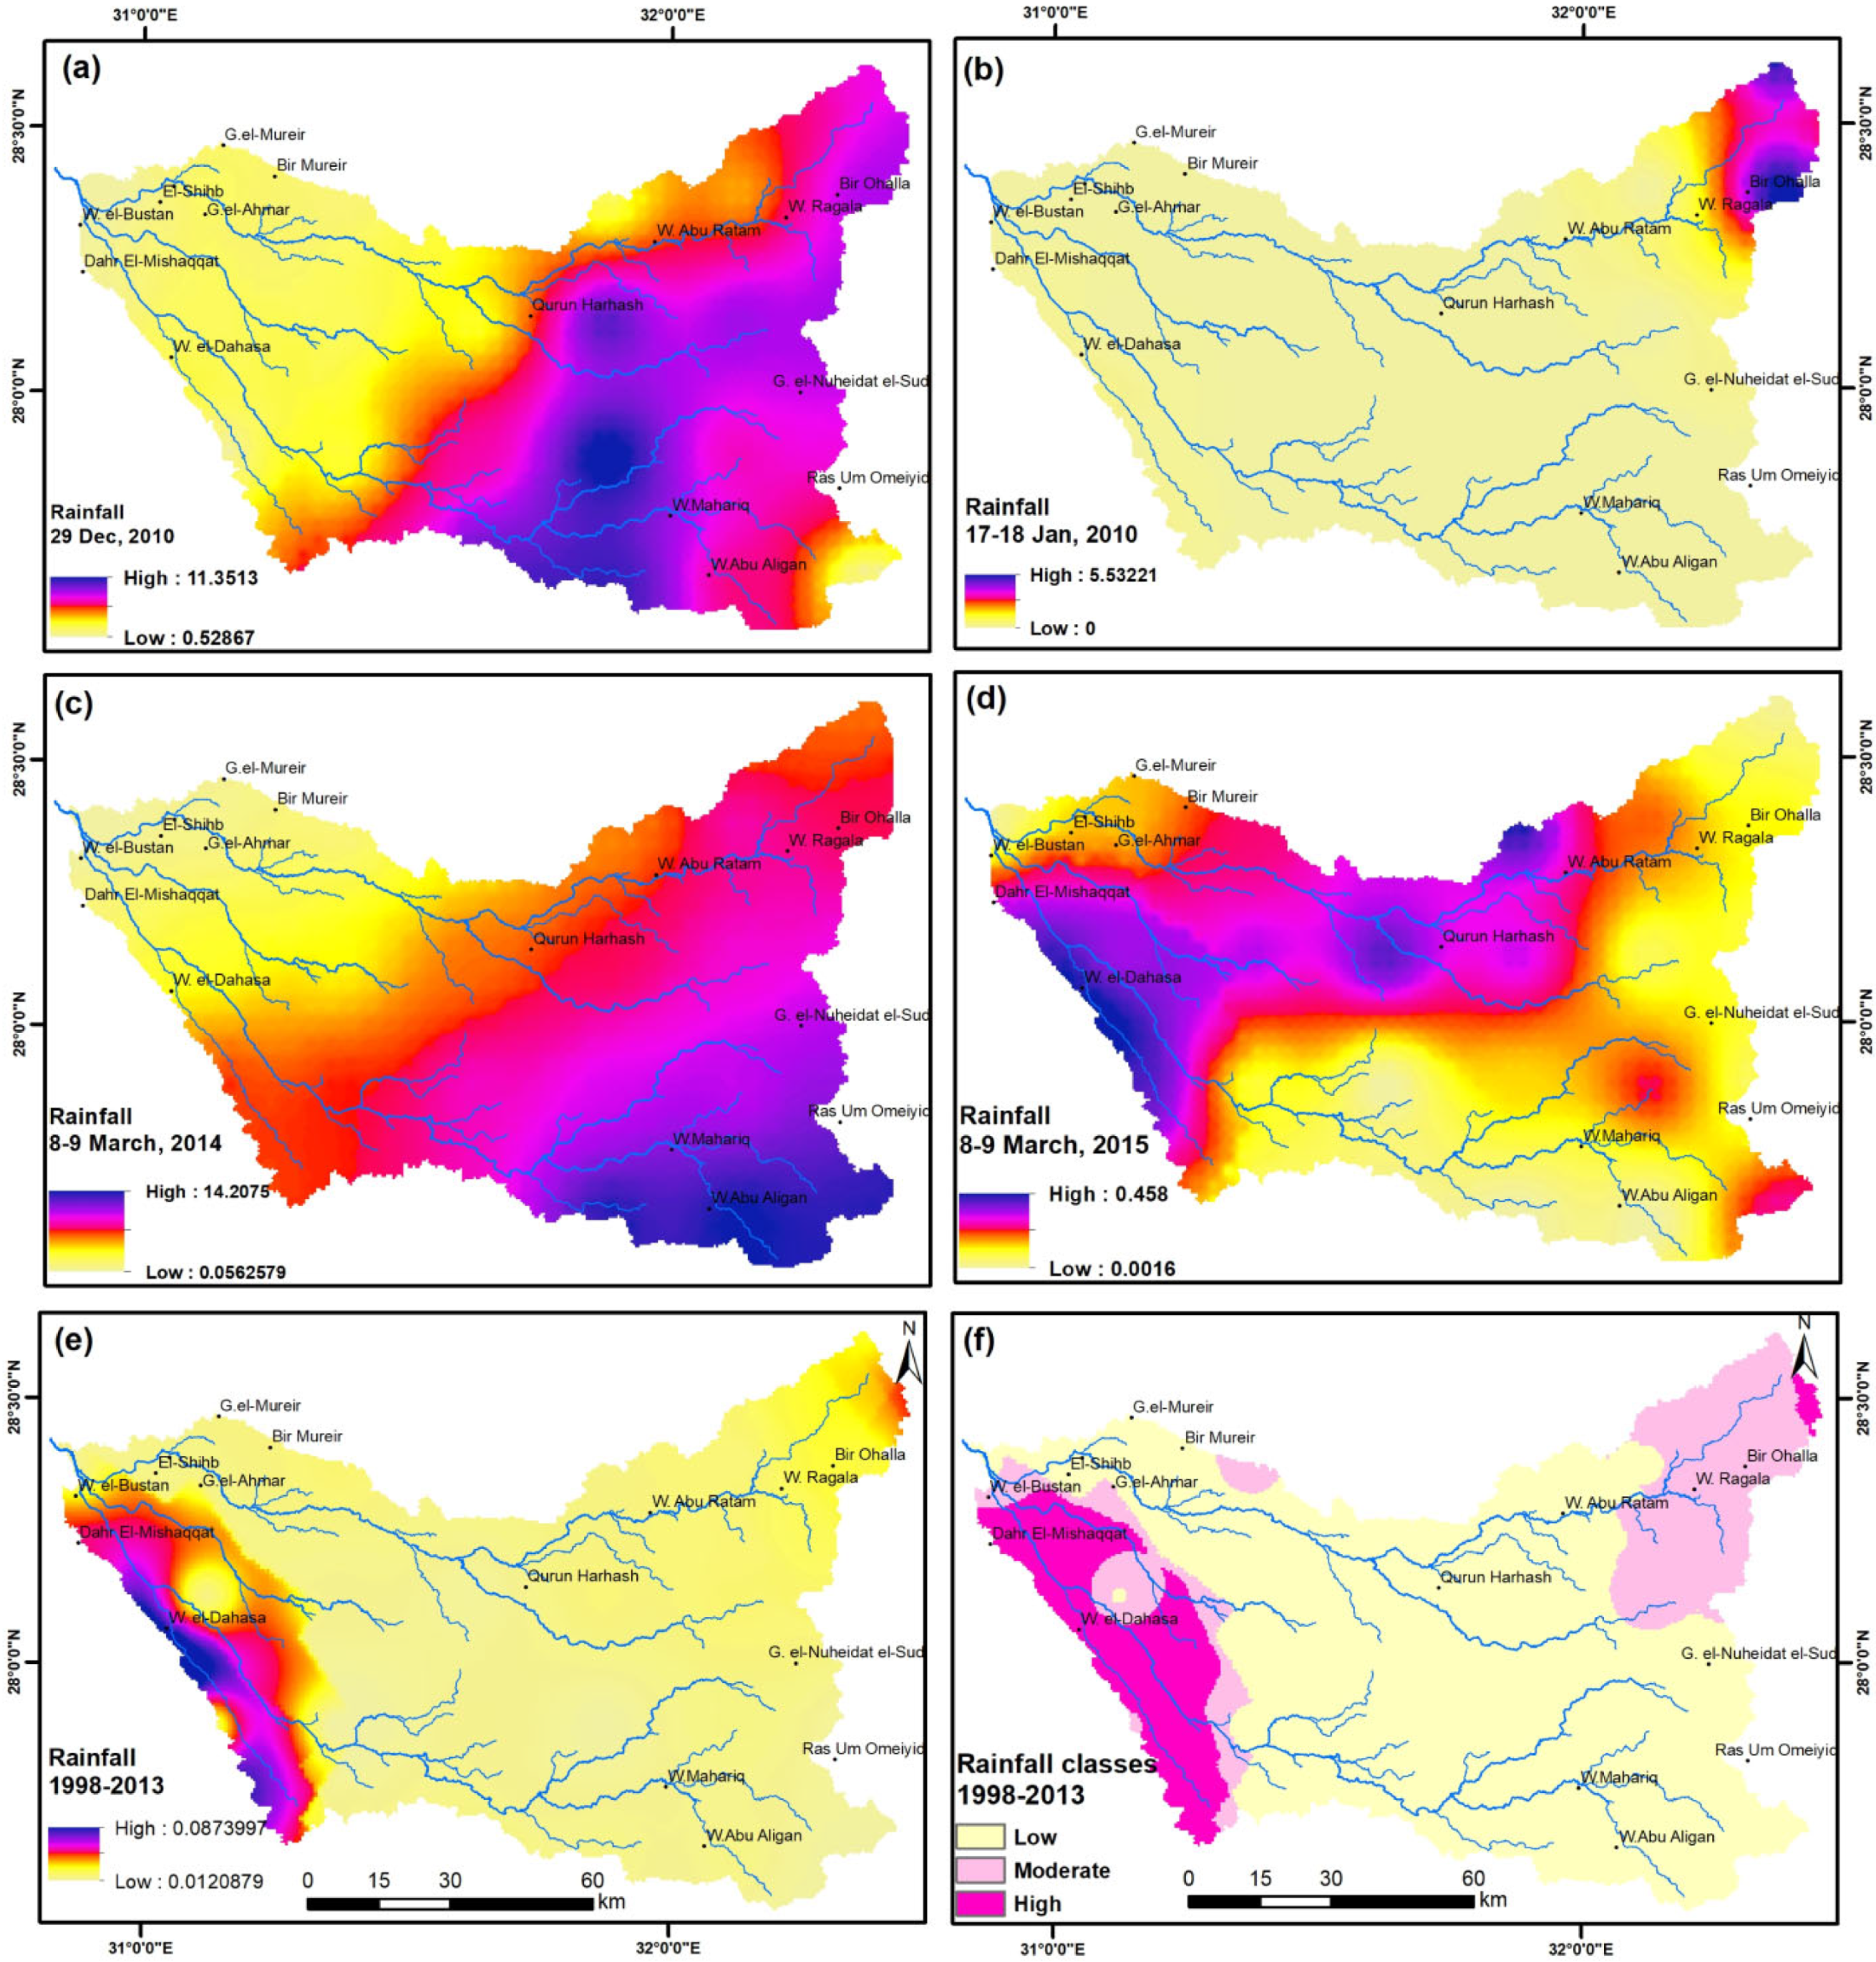
4.11. Rainfall
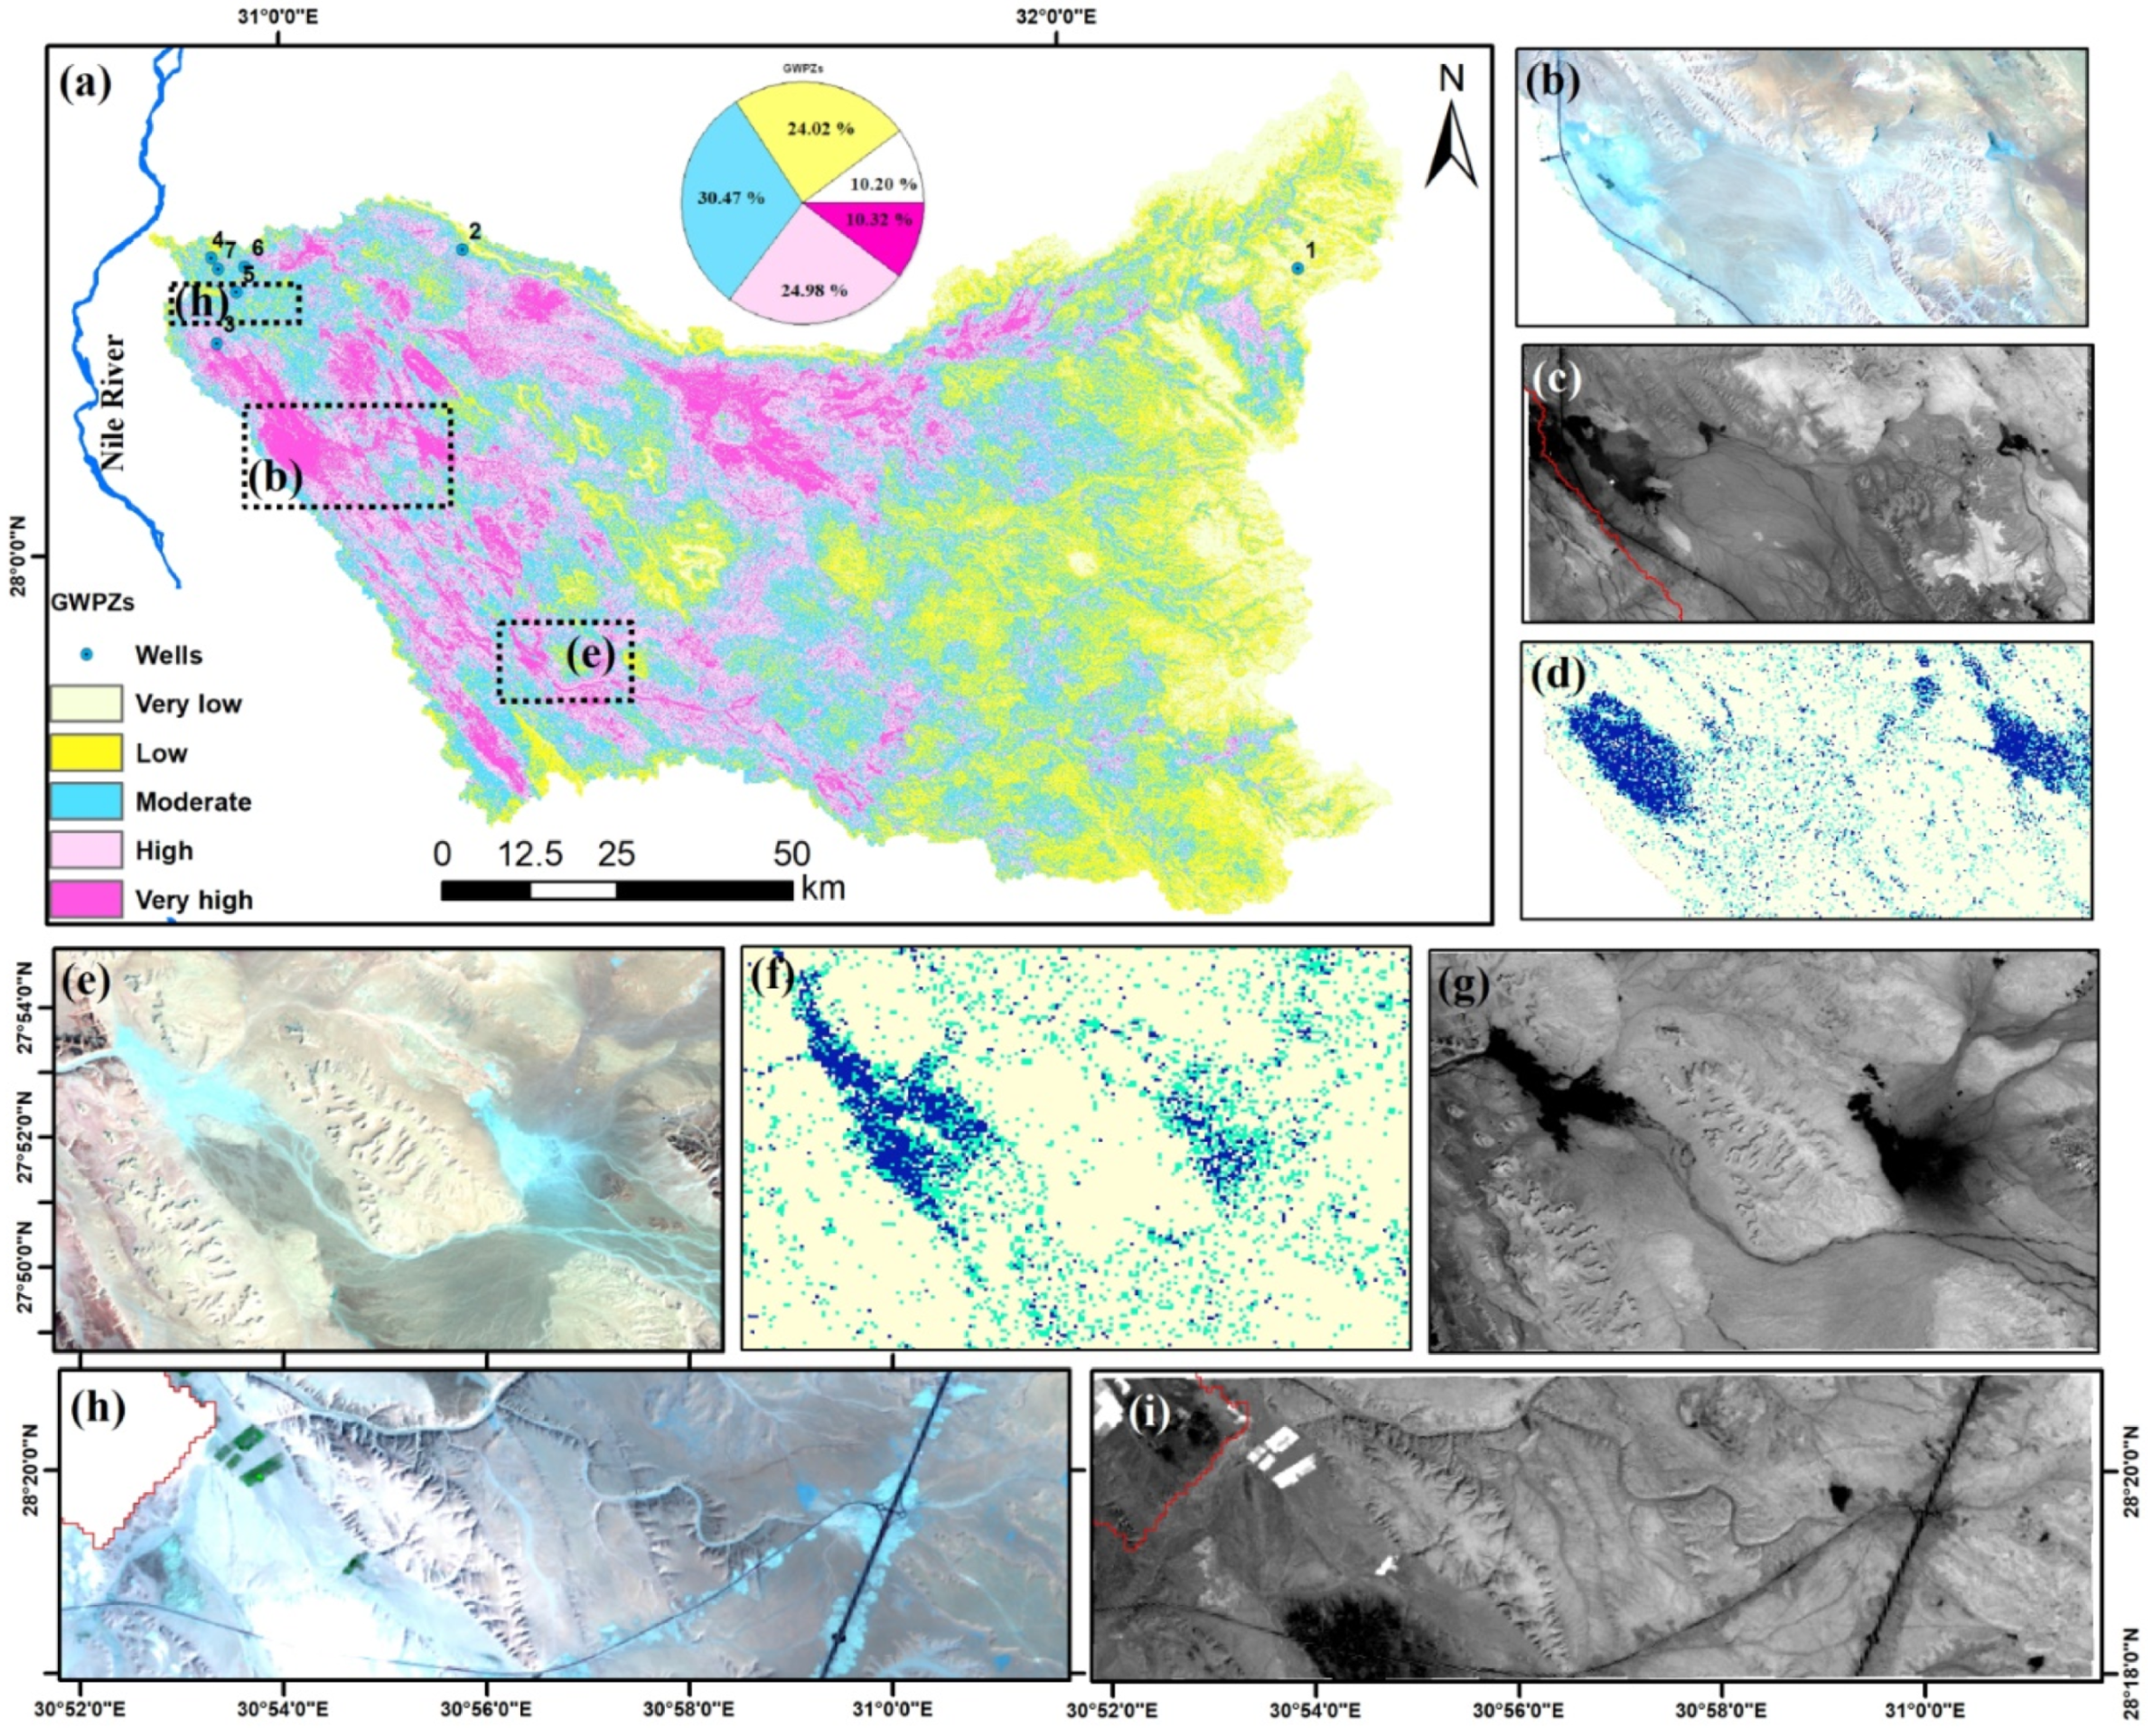
5. Groundwater Prospective Zones (GWPZs)
6. Discussion
7. Conclusions
Author Contributions
Funding
Data Availability Statement
Acknowledgments
Conflicts of Interest
Appendix A

| Basin# | U-Order | Nu | Lu | Area (km2) | P (km) | Lb (km) | Rb | Re | Rf | Rc | Rt | Fs | Dd | Lg | If | Bh (km) | Rh | Rn | Cm | W |
|---|---|---|---|---|---|---|---|---|---|---|---|---|---|---|---|---|---|---|---|---|
| 1 | 5 | 403 | 469.10 | 301.93 | 146.68 | 41.04 | 4.30 | 0.48 | 0.18 | 0.18 | 2.75 | 1.33 | 1.55 | 0.32 | 2.07 | 0.26 | 0.01 | 0.40 | 0.64 | 14.19 |
| 2 | 5 | 469 | 588.46 | 387.68 | 141.07 | 35.89 | 4.54 | 0.62 | 0.30 | 0.24 | 3.32 | 1.21 | 1.52 | 0.33 | 1.84 | 0.27 | 0.01 | 0.41 | 0.66 | 16.71 |
| 3 | 5 | 812 | 952.20 | 599.45 | 191.78 | 44.01 | 5.09 | 0.63 | 0.31 | 0.20 | 4.23 | 1.35 | 1.59 | 0.31 | 2.15 | 0.38 | 0.01 | 0.61 | 0.63 | 19.25 |
| 4 | 6 | 624 | 775.99 | 492.72 | 173.37 | 38.91 | 3.79 | 0.64 | 0.33 | 0.21 | 3.60 | 1.27 | 1.57 | 0.32 | 1.99 | 0.38 | 0.01 | 0.60 | 0.63 | 19.02 |
| 5 | 6 | 681 | 832.26 | 533.35 | 177.33 | 42.77 | 3.74 | 0.61 | 0.29 | 0.21 | 3.84 | 1.28 | 1.56 | 0.32 | 1.99 | 0.41 | 0.01 | 0.64 | 0.64 | 18.72 |
| 6 | 5 | 526 | 642.08 | 361.41 | 144.44 | 17.65 | 4.50 | 1.22 | 1.16 | 0.22 | 3.64 | 1.46 | 1.78 | 0.28 | 2.59 | 0.40 | 0.02 | 0.71 | 0.56 | 32.26 |
| 7 | 6 | 775 | 886.75 | 559.80 | 181.24 | 35.71 | 3.80 | 0.75 | 0.44 | 0.21 | 4.28 | 1.38 | 1.58 | 0.32 | 2.19 | 0.67 | 0.02 | 1.06 | 0.63 | 22.63 |
| 8 | 5 | 270 | 318.49 | 198.50 | 131.28 | 34.82 | 4.05 | 0.46 | 0.16 | 0.14 | 2.06 | 1.36 | 1.60 | 0.31 | 2.18 | 0.48 | 0.01 | 0.77 | 0.62 | 11.24 |
| 9 | 5 | 495 | 642.66 | 390.41 | 193.40 | 53.41 | 4.58 | 0.42 | 0.14 | 0.13 | 2.56 | 1.27 | 1.65 | 0.30 | 2.09 | 0.52 | 0.01 | 0.86 | 0.61 | 15.81 |
| 10 | 6 | 717 | 858.52 | 537.91 | 160.51 | 27.04 | 3.64 | 0.97 | 0.74 | 0.26 | 4.47 | 1.33 | 1.60 | 0.31 | 2.13 | 0.40 | 0.01 | 0.64 | 0.63 | 28.27 |
| 11 | 6 | 746 | 918.95 | 567.57 | 165.66 | 33.29 | 3.84 | 0.81 | 0.51 | 0.26 | 4.50 | 1.31 | 1.62 | 0.31 | 2.13 | 0.23 | 0.01 | 0.38 | 0.62 | 33.98 |
| 12 | 5 | 840 | 963.70 | 559.43 | 318.50 | 84.96 | 5.18 | 0.31 | 0.08 | 0.07 | 2.64 | 1.50 | 1.72 | 0.29 | 2.59 | 0.28 | 0.00 | 0.49 | 0.58 | 13.23 |
| 13 | 6 | 447 | 556.70 | 344.05 | 167.99 | 36.56 | 3.49 | 0.57 | 0.26 | 0.15 | 2.66 | 1.30 | 1.62 | 0.31 | 2.10 | 0.27 | 0.01 | 0.44 | 0.62 | 18.32 |
| 14 | 5 | 752 | 952.81 | 535.75 | 213.08 | 43.26 | 5.16 | 0.60 | 0.29 | 0.15 | 3.53 | 1.40 | 1.78 | 0.28 | 2.50 | 0.25 | 0.01 | 0.45 | 0.56 | 18.53 |
| 15 | 6 | 362 | 429.79 | 256.57 | 183.20 | 44.08 | 3.41 | 0.41 | 0.13 | 0.10 | 1.98 | 1.41 | 1.68 | 0.30 | 2.36 | 0.19 | 0.00 | 0.32 | 0.60 | 10.06 |
| 16 | 5 | 197 | 241.33 | 139.73 | 111.35 | 28.67 | 3.69 | 0.47 | 0.17 | 0.14 | 1.77 | 1.41 | 1.73 | 0.29 | 2.43 | 0.32 | 0.01 | 0.55 | 0.58 | 9.30 |
| 17 | 4 | 72 | 98.61 | 52.07 | 68.98 | 16.18 | 3.89 | 0.50 | 0.20 | 0.14 | 1.04 | 1.38 | 1.89 | 0.26 | 2.62 | 0.20 | 0.01 | 0.38 | 0.53 | 6.40 |
| 18 | 5 | 188 | 265.06 | 149.97 | 97.85 | 26.00 | 3.66 | 0.53 | 0.22 | 0.20 | 1.92 | 1.25 | 1.77 | 0.28 | 2.22 | 0.25 | 0.01 | 0.44 | 0.57 | 8.78 |
| 19 | 5 | 452 | 615.83 | 347.69 | 185.91 | 49.38 | 4.35 | 0.43 | 0.14 | 0.13 | 2.43 | 1.30 | 1.77 | 0.28 | 2.30 | 0.31 | 0.01 | 0.55 | 0.56 | 12.83 |
| 20 | 5 | 364 | 443.10 | 251.98 | 142.73 | 36.76 | 4.27 | 0.49 | 0.19 | 0.16 | 2.55 | 1.44 | 1.76 | 0.28 | 2.54 | 0.19 | 0.01 | 0.34 | 0.57 | 11.04 |
| 21 | 4 | 199 | 264.88 | 142.94 | 110.19 | 26.42 | 6.14 | 0.51 | 0.20 | 0.15 | 1.81 | 1.39 | 1.85 | 0.27 | 2.58 | 0.25 | 0.01 | 0.46 | 0.54 | 9.29 |
| 22 | 6 | 1202 | 1503.34 | 790.38 | 216.23 | 39.33 | 3.97 | 0.81 | 0.51 | 0.21 | 5.56 | 1.52 | 1.90 | 0.26 | 2.89 | 0.26 | 0.01 | 0.50 | 0.53 | 28.40 |
| 23 | 6 | 1030 | 1109.50 | 679.14 | 285.34 | 65.66 | 4.01 | 0.45 | 0.16 | 0.10 | 3.61 | 1.52 | 1.63 | 0.31 | 2.48 | 0.20 | 0.00 | 0.33 | 0.61 | 16.23 |
| 24 | 6 | 1096 | 1244.68 | 715.30 | 225.40 | 48.45 | 3.93 | 0.62 | 0.30 | 0.18 | 4.86 | 1.53 | 1.74 | 0.29 | 2.67 | 0.25 | 0.01 | 0.43 | 0.57 | 26.58 |
| 25 | 5 | 411 | 422.21 | 262.08 | 140.21 | 30.98 | 4.28 | 0.59 | 0.27 | 0.17 | 2.93 | 1.57 | 1.61 | 0.31 | 2.53 | 0.16 | 0.01 | 0.26 | 0.62 | 19.43 |
| 26 | 5 | 683 | 781.07 | 453.86 | 187.74 | 39.69 | 4.84 | 0.61 | 0.29 | 0.16 | 3.64 | 1.50 | 1.72 | 0.29 | 2.59 | 0.32 | 0.01 | 0.55 | 0.58 | 19.15 |
| El-Tarfa | 7 | 4749 | 10,597.40 | 10,611.68 | 962.35 | 177.89 | 3.97 | 0.65 | 0.34 | 0.14 | 4.93 | 0.45 | 1.00 | 0.50 | 0.45 | 1.24 | 0.01 | 1.23 | 1.00 | 123.81 |
Appendix B
| Basin # | Rt | Rb | Lg | Re | Rf | Rc | Fs | If | Bh | Rh | Rn | Runoff Weight |
|---|---|---|---|---|---|---|---|---|---|---|---|---|
| 1 | 2.51 | 3.69 | 1.46 | 1.73 | 1.38 | 2.93 | 2.39 | 1.90 | 1.76 | 1.67 | 1.71 | 23.13 |
| 2 | 3.02 | 3.34 | 1.00 | 2.35 | 1.83 | 4.58 | 1.00 | 1.00 | 1.83 | 1.91 | 1.73 | 23.59 |
| 3 | 3.83 | 2.54 | 1.88 | 2.39 | 1.86 | 3.62 | 2.62 | 2.19 | 2.72 | 2.15 | 2.72 | 28.52 |
| 4 | 3.26 | 4.43 | 1.72 | 2.46 | 1.92 | 3.64 | 1.63 | 1.60 | 2.74 | 2.40 | 2.71 | 28.51 |
| 5 | 3.48 | 4.50 | 1.54 | 2.31 | 1.79 | 3.82 | 1.75 | 1.59 | 2.95 | 2.34 | 2.89 | 28.96 |
| 6 | 3.30 | 3.41 | 3.88 | 5.00 | 5.00 | 3.92 | 3.74 | 3.84 | 2.85 | 5.00 | 3.23 | 43.17 |
| 7 | 3.86 | 4.43 | 1.83 | 2.92 | 2.34 | 3.84 | 2.95 | 2.35 | 5.00 | 4.23 | 5.00 | 38.75 |
| 8 | 1.90 | 4.06 | 2.07 | 1.63 | 1.32 | 2.17 | 2.68 | 2.31 | 3.48 | 3.19 | 3.52 | 28.33 |
| 9 | 2.34 | 3.28 | 2.54 | 1.46 | 1.22 | 1.84 | 1.65 | 1.95 | 3.82 | 2.38 | 3.98 | 26.46 |
| 10 | 4.03 | 4.65 | 1.97 | 3.90 | 3.43 | 5.00 | 2.37 | 2.10 | 2.85 | 3.39 | 2.87 | 36.56 |
| 11 | 4.06 | 4.36 | 2.24 | 3.19 | 2.61 | 4.94 | 2.17 | 2.10 | 1.56 | 1.81 | 1.58 | 30.62 |
| 12 | 2.41 | 2.41 | 3.35 | 1.00 | 1.00 | 0.36 | 4.26 | 3.84 | 1.95 | 1.06 | 2.13 | 23.77 |
| 13 | 2.43 | 4.87 | 2.23 | 2.15 | 1.66 | 2.37 | 2.00 | 2.01 | 1.86 | 1.90 | 1.89 | 25.37 |
| 14 | 3.20 | 2.43 | 3.90 | 2.29 | 1.77 | 2.26 | 3.16 | 3.50 | 1.72 | 1.58 | 1.95 | 27.76 |
| 15 | 1.83 | 5.00 | 2.86 | 1.43 | 1.20 | 1.00 | 3.24 | 3.00 | 1.22 | 1.26 | 1.29 | 23.33 |
| 16 | 1.64 | 4.59 | 3.40 | 1.67 | 1.34 | 2.10 | 3.23 | 3.27 | 2.24 | 2.66 | 2.45 | 28.59 |
| 17 | 1.00 | 4.29 | 4.93 | 1.84 | 1.45 | 2.00 | 2.93 | 3.96 | 1.31 | 2.92 | 1.60 | 28.23 |
| 18 | 1.78 | 4.63 | 3.80 | 1.96 | 1.53 | 3.42 | 1.49 | 2.44 | 1.68 | 2.34 | 1.89 | 26.96 |
| 19 | 2.23 | 3.61 | 3.83 | 1.50 | 1.24 | 1.73 | 2.01 | 2.77 | 2.18 | 1.67 | 2.45 | 25.22 |
| 20 | 2.33 | 3.74 | 3.71 | 1.77 | 1.40 | 2.43 | 3.62 | 3.67 | 1.24 | 1.45 | 1.39 | 26.75 |
| 21 | 1.68 | 1.00 | 4.58 | 1.87 | 1.47 | 2.25 | 3.04 | 3.82 | 1.68 | 2.31 | 2.00 | 25.7 |
| 22 | 5.00 | 4.17 | 5.00 | 3.19 | 2.60 | 3.80 | 4.47 | 5.00 | 1.79 | 1.74 | 2.18 | 38.94 |
| 23 | 3.27 | 4.12 | 2.40 | 1.59 | 1.30 | 1.21 | 4.42 | 3.43 | 1.30 | 1.00 | 1.33 | 25.37 |
| 24 | 4.38 | 4.24 | 3.53 | 2.37 | 1.84 | 2.94 | 4.60 | 4.14 | 1.68 | 1.42 | 1.85 | 32.99 |
| 25 | 2.67 | 3.72 | 2.14 | 2.22 | 1.72 | 2.72 | 5.00 | 3.61 | 1.00 | 1.45 | 1.00 | 27.25 |
| 26 | 3.30 | 2.90 | 3.34 | 2.29 | 1.78 | 2.58 | 4.29 | 3.85 | 2.25 | 2.03 | 2.45 | 31.06 |
References
- El-Baz, F. Sand accumulation and groundwater in the eastern Sahara. Episodes 1998, 21, 147–151. [Google Scholar] [CrossRef]
- Zhu, Q.; Abdelkareem, M. Mapping Groundwater Potential Zones Using a Knowledge-Driven Approach and GIS Analysis. Water 2021, 13, 579. [Google Scholar] [CrossRef]
- Abdelkareem, M.; El-Baz, F.; Askalany, M.; Akawy, A.; Ghoneim, E. Groundwater prospect map of Egypt’s Qena Valley using data fusion. Int. J. Image Data Fusion 2012, 3, 169–189. [Google Scholar] [CrossRef]
- Arulbalaji, P.; Padmalal, D.; Sreelash, K. GIs and AHP techniques Based Delineation of Groundwater Potential Zones: A case study from southern Western Ghats, India. Sci. Rep. 2019, 9, 2082. [Google Scholar] [CrossRef]
- Abdelkareem, M.; Abdalla, F. Revealing potential areas of water resources using integrated remote-sensing data and GIS-based analytical hierarchy process. Geocarto Int. 2021, 1–25. [Google Scholar] [CrossRef]
- Abdelkareem, M.; El-Baz, F. Analyses of optical images and radar data reveal structural features and predict groundwater accumulations in the central Eastern Desert of Egypt. Arab. J. Geosci. 2014, 8, 2653–2666. [Google Scholar] [CrossRef]
- Abdelkareem, M.; Al-Arifi, N. The use of remotely sensed data to reveal geologic, structural, and hydrologic features and predict potential areas of water resources in arid regions. Arab. J. Geosci. 2021, 14, 704. [Google Scholar] [CrossRef]
- Yariyan, P.; Avand, M.; Omidvar, E.; Pham, Q.B.; Linh, N.T.T.; Tiefenbacher, J.P. Optimization of statistical and machine learning hybrid models for groundwater potential mapping. Geocarto Int. 2020, 11, 2282–2314. [Google Scholar] [CrossRef]
- Scheuer, S.; Haase, D.; Volk, M. Integrative assessment of climate change for fast-growing urban areas: Measurement and recommendations for future research. PLoS ONE 2017, 12, e0189451. [Google Scholar] [CrossRef] [Green Version]
- Ullah, K.; Zhang, J. GIS-based flood hazard mapping using relative frequency ratio method: A case study of Panjkora River Basin, eastern Hindu Kush, Pakistan. PLoS ONE 2020, 15, e0229153. [Google Scholar] [CrossRef] [Green Version]
- Zhang, D.-W.; Quan, J.; Zhang, H.-B.; Wang, F.; Wang, H.; He, X.-Y. Flash flood hazard mapping: A pilot case study in Xiapu River Basin, China. Water Sci. Eng. 2015, 8, 195–204. [Google Scholar] [CrossRef] [Green Version]
- Abdelkareem, M. Targeting flash flood potential areas using remotely sensed data and GIS techniques. Nat. Hazards 2016, 85, 19–37. [Google Scholar] [CrossRef]
- Waqas, H.; Lu, L.; Tariq, A.; Li, Q.; Baqa, M.F.; Xing, J.; Sajjad, A. Flash Flood Susceptibility Assessment and Zonation Using an Integrating Analytic Hierarchy Process and Frequency Ratio Model for the Chitral District, Khyber Pakhtunkhwa, Pakistan. Water 2021, 13, 1650. [Google Scholar] [CrossRef]
- Avtar, R.; Singh, C.K.; Shashtri, S.; Singh, A.; Mukherjee, S. Identification and analysis of groundwater potential zones in Ken–Betwa river linking area using remote sensing and geographic information system. Geocarto Int. 2010, 25, 379–396. [Google Scholar] [CrossRef]
- Singh, C.K.; Shashtri, S.; Singh, A.; Mukherjee, S. Quantitative modeling of groundwater in Satluj River basin of Rupnagar district of Punjab using remote sensing and geographic information system. Environ. Earth Sci. 2010, 62, 871–881. [Google Scholar] [CrossRef]
- Gaber, A.; Abdelkareem, M.; Abdelsadek, I.S.; Koch, M.; El-Baz, F. Using InSAR Coherence for Investigating the Interplay of Fluvial and Aeolian Features in Arid Lands: Implications for Groundwater Potential in Egypt. Remote Sens. 2018, 10, 832. [Google Scholar] [CrossRef] [Green Version]
- Mallick, J.; Khan, R.A.; Ahmed, M.; Alqadhi, S.D.; Alsubih, M.; Falqi, I.; Hasan, M.A. Modeling Groundwater Potential Zone in a Semi-Arid Region of Aseer Using Fuzzy-AHP and Geoinformation Techniques. Water 2019, 11, 2656. [Google Scholar] [CrossRef] [Green Version]
- Mukherjee, I.; Singh, U. Delineation of groundwater potential zones in a drought-prone semi-arid region of east India using GIS and analytical hierarchical process techniques. CATENA 2020, 194, 104681. [Google Scholar] [CrossRef]
- Lettenmaier, D.P.; Alsdorf, D.; Dozier, J.; Huffman, G.J.; Pan, M.; Wood, E.F. In roads of remote sensing into hydrologic science during the WRR era. Water Resour Res. 2015, 51, 7309–7342. [Google Scholar] [CrossRef]
- Melese, T.; Belay, T. Groundwater Potential Zone Mapping Using Analytical Hierarchy Process and GIS in Muga Watershed, Abay Basin, Ethiopia. Glob. Chall. 2021, 6, 2100068. [Google Scholar] [CrossRef]
- Abdelkareem, M.; El-Baz, F. Remote sensing of paleodrainage systems west of the Nile River, Egypt. Geocarto Int. 2016, 32, 541–555. [Google Scholar] [CrossRef]
- Abdelkareem, M.; Gaber, A.; Abdalla, F.; El-Din, G.K. Use of optical and radar remote sensing satellites for identifying and monitoring active/inactive landforms in the driest desert in Saudi Arabia. Geomorphology 2020, 362, 107197. [Google Scholar] [CrossRef]
- Roth, L.E.; Elachi, C. Coherent electromagnetic losses by scattering from volume in homogenities. IEEE Trans. Antennas Propag. 1975, 23, 674–675. [Google Scholar] [CrossRef]
- Paillou, P.; Schuster, M.; Tooth, S.; Farr, T.; Rosenqvist, A.; Lopez, S.; Malezieux, J.-M. Mapping of a major paleodrainage system in eastern Libya using orbital imaging radar: The Kufrah River. Earth Planet. Sci. Lett. 2009, 277, 327–333. [Google Scholar] [CrossRef]
- Saaty, T. A scaling method for priorities in hierarchical structures. J. Math. Psychol. 1977, 15, 234–281. [Google Scholar] [CrossRef]
- Saaty, T.L. The Analytic Hierarchy Process: Planning, Priority Setting, Resource Allocation; McGraw-Hill: New York, NY, USA, 1980. [Google Scholar]
- Razandi, Y.; Pourghasemi, H.R.; Neisani, N.S.; Rahmati, O. Application of analytical hierarchy process, frequency ratio, and certainty factor models for groundwater potential mapping using GIS. Earth Sci. Inform. 2015, 8, 867–883. [Google Scholar] [CrossRef]
- Saaty, T.L. Decision Making for Leaders: The Analytic Hierarchy Process for Decisions in a Complex World; RWS Publications: Pittsburgh, PA, USA, 1990. [Google Scholar]
- Yeh, H.-F.; Cheng, Y.-S.; Lin, H.-I.; Lee, C.-H. Mapping groundwater recharge potential zone using a GIS approach in Hualian River, Taiwan. Sustain. Environ. Res. 2016, 26, 33–43. [Google Scholar] [CrossRef] [Green Version]
- Benjmel, K.; Amraoui, F.; Boutaleb, S.; Ouchchen, M.; Tahiri, A.; Touab, A. Mapping of Groundwater Potential Zones in Crystalline Terrain Using Remote Sensing, GIS Techniques, and Multicriteria Data Analysis (Case of the Ighrem Region, Western Anti-Atlas, Morocco). Water 2020, 12, 471. [Google Scholar] [CrossRef] [Green Version]
- Murmu, P.; Kumar, M.; Lal, D.; Sonker, I.; Singh, S. Delineation of groundwater potential zones using geospatial techniques and analytical hierarchy process in Dumka district, Jharkhand, India. Groundw. Sustain. Dev. 2019, 9, 1002392. [Google Scholar] [CrossRef]
- Kumar, V.A.; Mondal, N.C.; Ahmed, S. Identification of Groundwater Potential Zones Using RS, GIS and AHP Techniques: A Case Study in a Part of Deccan Volcanic Province (DVP), Maharashtra, India. J. Indian Soc. Remote Sens. 2020, 48, 497–511. [Google Scholar] [CrossRef]
- Shaban, A.; Khawlie, M.; Abdallah, C. Use of remote sensing and GIS to determine recharge potential zones: The case of Occidental Lebanon. Appl. Hydrogeol. 2005, 14, 433–443. [Google Scholar] [CrossRef]
- Rahmati, O.; Samani, A.N.; Mahdavi, M.; Pourghasemi, H.R.; Zeinivand, H. Groundwater potential mapping at Kurdistan region of Iran using analytic hierarchy process and GIS. Arab. J. Geosci. 2014, 8, 7059–7071. [Google Scholar] [CrossRef]
- Achu, A.L.; Reghunath, R.; Thomas, J. Mapping of Groundwater Recharge Potential Zones and Identification of Suitable Site-Specific Recharge Mechanisms in a Tropical River Basin. Earth Syst. Environ. 2019, 4, 131–145. [Google Scholar] [CrossRef]
- Abdalla, F.; Moubark, K.; Abdelkareem, M. Groundwater potential mapping using GIS, linear weighted combination techniques and geochemical processes identification, west of the Qena area, Upper Egypt. J. Taibah Univ. Sci. 2020, 14, 1350–1362. [Google Scholar] [CrossRef]
- Pham, B.T.; Phong, T.V.; Nguyen, H.D.; Qi, C.; Al-Ansari, N.; Amini, A.; Ho, L.S.; Tuyen, T.T.; Yen, H.P.; Ly, H.B.; et al. A Comparative Study of Kernel Logistic Regression, Radial Basis Function Classifier, Multinomial Naïve Bayes, and Logistic Model Tree for Flash Flood Susceptibility Mapping. Water 2020, 12, 239. [Google Scholar] [CrossRef] [Green Version]
- Youssef, A.M.; Pradhan, B.; Sefry, S.A. Flash flood susceptibility assessment in Jeddah city (Kingdom of Saudi Arabia) using bivariate and multivariate statistical models. Environ. Earth Sci. 2015, 75, 12. [Google Scholar] [CrossRef]
- Moore, I.D.; Grayson, R.B.; Ladson, A.R. Digital terrain modelling: A review of hydrological, geomorphological, and biological applications. Hydrol. Process. 1991, 5, 3–30. [Google Scholar] [CrossRef]
- Souissi, D.; Msaddek, M.H.; Zouhri, L.; Chenini, I.; El May, M.; Dlala, M. Mapping groundwater recharge potential zones in arid region using GIS and Landsat approaches, southeast Tunisia. Hydrol. Sci. J. 2018, 63, 251–268. [Google Scholar] [CrossRef]
- Sharma, T.P.; Zhang, J.; Raj Khanal, N.; Prodhan, F.A.; Nanzad, L.; Zhang, D.; Nepal, P. A Geomorphic Approach for Identifying Flash Flood PotentialAreas in the East Rapti River Basin of Nepal. ISPRS Int. J. Geo-Inf. 2021, 10, 247. [Google Scholar] [CrossRef]
- Conoco. Geological Map of Egypt, Scale 1:500,000; The Egyptian General Petroleum Corporation: Cairo, Egypt, 1987. [Google Scholar]
- O’Callaghan, J.F.; Mark, D.M. The extraction of drainage networks from digital elevation data. Comput. Vis. Graph. Image Process. 1984, 28, 323–3444. [Google Scholar] [CrossRef]
- Strahler, A.N. Quantitative analysis of watershed geomorphology. Eos Trans. Am. Geophys. Union 1957, 38, 913–920. [Google Scholar] [CrossRef] [Green Version]
- Strahler, A.N. Quantitative geomorphology of drainage basins and channel networks. In Handbook of Applied Hydrology; Chow, V.T., Ed.; McGraw Hill Book Company: New York, NY, USA, 1964; Section 4II. [Google Scholar]
- Shukla, G.; Tiwari, P.; Dugesar, V.; Srivastava, P.K. Estimation of evapotranspiration using surface energy balance system and satellite datasets. In Agricultural Water Management Theories and Practices; Srivastava, P.K., Gupta, M., Tsakiris, G., Quinn, N., Eds.; Academic Press: Cambridge, MA, USA, 2021; Chapter 9; pp. 157–183. [Google Scholar]
- ALOS-2 (Advanced Land Observing Satellite-2; SAR Mission)/Daichi-2. Available online: https://earth.esa.int/web/eoportal/satellite-missions/a/alos-2 (accessed on 15 November 2019).
- Global PALSAR-2/PALSAR/JERS-1 Mosaic and Forest/Non-Forest Map. Available online: https://www.eorc.jaxa.jp/ALOS/en/palsar_fnf/data/2017/map.htm (accessed on 15 November 2019).
- Jensen, J.R. Remote Sensing of the Environment: An Earth Resource Perspective; Prentice-Hall: Englewood Cliffs, NJ, USA, 2000; p. 544. [Google Scholar]
- Saaty, T.L. Fundamentals of Decision Making and Priority Theory with the AHP; RWS Publications: Pittsburgh, PA, USA, 1994. [Google Scholar]
- Gannouni, S.; Gabtni, H. Structural Interpretation of Lineaments by Satellite Image Processing (Landsat TM) in the Region of Zahret Medien (Northern Tunisia). J. Geogr. Inf. Syst. 2015, 7, 119–127. [Google Scholar] [CrossRef] [Green Version]
- Assatse, W.T.; Nouck, P.N.; Tabod, C.T.; Akame, J.M.; Biringanine, G.N. Hydrogeological activity of lineaments in Yaoundé Cameroon region using remote sensing and GIS techniques. Egypt. J. Remote Sens. Space Sci. 2016, 19, 49–60. [Google Scholar]
- Berhanua, K.; Hatiye, S.D. Identification of Groundwater Potential Zones Using Proxy Data: Case study of Megech Watershed, Ethiopia Kibrit Gedam Berhanua, Samuel Dagalo Hatiye. J. Hydrol. Reg. Stud. 2020, 28, 100676. [Google Scholar] [CrossRef]
- Ramu Mahalingam, B.; Vinay, M. Identification of ground water potential zones using GIS and Remote sensing Techniques: A case study of Mysore taluk-Karnataka. Int. J. Geomat. Geosci. 2010, 5, 2014. [Google Scholar]
- Tehrany, M.S.; Pradhan, B.; Jebur, M.N. Flood susceptibility mapping using a novel ensemble weights-of-evidence and support vector machine models in GIS. J. Hydrol. 2014, 512, 332–343. [Google Scholar] [CrossRef]
- Tehrany, M.S.; Pradhan, B.; Mansor, S.; Ahmad, N. Flood susceptibility assessment using GIS-based support vector machine model with different kernel types. CATENA 2015, 125, 91–101. [Google Scholar] [CrossRef]
- Andualem, T.G.; Demeke, G.G. Groundwater potential assessment using GIS and remote sensing: A case study of Guna tana landscape, upper blue Nile Basin, Ethiopia. J. Hydrol. Reg. Stud. 2019, 24, 100610. [Google Scholar] [CrossRef]
- Elewa, H.H.; Qaddah, A.A. Groundwater potentiality mapping in the Sinai Peninsula, Egypt, using remote sensing and GIS-watershed-based modeling. Appl. Hydrogeol. 2011, 19, 613–628. [Google Scholar] [CrossRef] [Green Version]
- Ghorbani Nejad, S.; Falah, F.; Daneshfar, M.; Haghizadeh, A.; Rahmati, O. Delineation of groundwater potential zones using remote sensing and GIS-based data driven models. Geocarto Int. 2017, 32, 167–187. [Google Scholar] [CrossRef]
- Pourtaghi, Z.S.; Pourghasemi, H.R. GIS-based groundwater spring potential assessment and mapping in the Birjand Township, southern Khorasan Province, Iran. Appl. Hydrogeol. 2014, 22, 643–662. [Google Scholar] [CrossRef]
- Al-Abadi, A.M.; Shahid, S.; Ghalib, H.B.; Handhal, A.M. A GIS-Based Integrated Fuzzy Logic and Analytic Hierarchy Process Model for Assessing Water-Harvesting Zones in Northeastern Maysan Governorate, Iraq. Arab. J. Sci. Eng. 2017, 42, 2487–2499. [Google Scholar] [CrossRef]
- Prasad, R.K.; Mondal, N.; Banerjee, P.; Nandakumar, M.V.; Singh, V.S. Deciphering potential groundwater zone in hard rock through the application of GIS. Environ. Earth Sci. 2007, 55, 467–475. [Google Scholar] [CrossRef]
- Magesh, N.S.; Chandrasekar, N.; Soundranayagam, J.P. Delineation of groundwater potential zones in Theni district, Tamil Nadu, using remote sensing, GIS and MIF techniques. Geosci. Front. 2012, 3, 189–196. [Google Scholar] [CrossRef] [Green Version]
- Pande, C.B.; Khadri, S.F.R.; Moharir, K.N.; Patode, R.S. Assessment of groundwater potential zonation of Mahesh River basin Akola and Buldhana districts, Maharashtra, India using remote sensing and GIS techniques. Sustain. Water Resour. Manag. 2017, 4, 965–979. [Google Scholar] [CrossRef]
- Lentswe, G.B.; Lentswe, M. Delineation of potential groundwater recharge zones using analytic hierarchy process-guided GIS in the semi-arid Motloutse watershed, eastern Botswana. J. Hydrol. Reg. Stud. 2020, 28, 100674. [Google Scholar] [CrossRef]
- Schumn, S.A. Evaluation of drainage systems and slopes in badlands at Perth Amboy, New Jersey. Bull. Geol. Soc. Am. 1956, 67, 597–646. [Google Scholar] [CrossRef]
- Horton, R.E. Drainage-basin characteristics. Trans. Am. Geophys. Union 1932, 13, 350–361. [Google Scholar] [CrossRef]
- Faniran, A. The index of drainage intensity—A provisional new drainage factor. Aust. J. Sci. 1968, 31, 328–330. [Google Scholar]
- Strahler, A.N. Hypsometric analysis of erosional topography. Bull. Geol. Soc. Am. 1952, 63, 1117–1142. [Google Scholar] [CrossRef]
- Davis, J.C. Statics and Data Analysis in Geology; Wiley: New York, NY, USA, 1975. [Google Scholar]
- Brooks, H.E.; Stensrud, D.J. Climatology of Heavy Rain Events in the United States from Hourly Precipitation Observations. Mon. Weather Rev. 2000, 128, 1194–1201. [Google Scholar] [CrossRef] [Green Version]
- Jaafarzadeh, M.S.; Tahmasebipour, N.; Haghizadeh, A.; Pourghasemi, H.R.; Rouhani, H. Groundwater recharge potential zonation using an ensemble of machine learning and bivariate statistical models. Sci. Rep. 2021, 11, 5587. [Google Scholar] [CrossRef] [PubMed]
- Kotb, A.; Mosaad, S.; Kehew, A.E. Geophysical and hydrogeological applications for groundwater evaluation, east El-Minia area, upper Egypt. J. Afr. Earth Sci. 2021, 184, 104384. [Google Scholar] [CrossRef]
- Abdelkareem, M.; El-Baz, F. Mode of formation of the Nile Gorge in northern Egypt: A study by DEM-SRTM data and GIS analysis. Geol. J. 2015, 51, 760–778. [Google Scholar] [CrossRef]
- Priya, U.; Iqbal, M.A.; Abdus Salam, M.; Nur-E-Alam, M.; Uddin, M.F.; Islam, A.T.; Sarkar, S.K.; Imran, S.I.; Eh Rak, A. Sustainable Groundwater Potential Zoning with Integrating GIS, Remote Sensing, and AHP Model: A Case from North-Central Bangladesh. Sustainability 2022, 14, 5640. [Google Scholar] [CrossRef]
- Todd, D.K.; Mays, L.W. Groundwater Hydrology, 3rd ed.; John Wiley & Sons: Hoboken, NJ, USA, 2013. [Google Scholar]
- Vijith, H.; Dodge-Wan, D. Modelling terrain erosion susceptibility of logged and regenerated forested region in northern Borneo through the Analytical Hierarchy Process (AHP) and GIS techniques. Geoenviron. Disasters 2019, 6, 8. [Google Scholar] [CrossRef]
- Pradhan, B. Groundwater potential zonation for basaltic watersheds Groundwater potential zonation for basaltic watersheds. Cent. Eur. J. Geosci. 2009, 1, 120–129. [Google Scholar]
- Fagbohun, B.J. Integrating GIS and multi-influencing factor technique for delineation of potential groundwater recharge zones in parts of Ilesha schist belt, southwestern Nigeria. Environ. Earth Sci. 2018, 77, 69. [Google Scholar] [CrossRef]
- Hong, Y.; Abdelkareem, M. Integration of remote sensing and a GIS-based method for revealing prone areas to flood hazards and predicting optimum areas of groundwater resources. Arab. J. Geosci. 2022, 15, 114. [Google Scholar] [CrossRef]
- Ahmed, A.A.; Shabana, A.R. Integrating of remote sensing, GIS and geophysical data for recharge potentiality evaluation in Wadi El Tarfa, eastern desert, Egypt. J. Afr. Earth Sci. 2020, 172, 103957. [Google Scholar] [CrossRef]
- Beven, K.J.; Kirkby, M.J. A physically based, variable contributing area model of basin hydrology/Un modele a base physique de zone d’appel variable de l’hydrologie du bassin versant. Hydrol. Sci. J. 1979, 24, 43–69. [Google Scholar] [CrossRef] [Green Version]
- Chen, W.; Li, Y.; Tsangaratos, P.; Shahabi, H.; Ilia, I.; Xue, W.; Bian, H. Groundwater Spring Potential Mapping Using Artificial Intelligence Approach Based on Kernel Logistic Regression, Random Forest, and Alternating Decision Tree Models. Appl. Sci. 2020, 10, 425. [Google Scholar] [CrossRef] [Green Version]
- Gheith, H.; Sultan, M. Construction of a hydrologic model for estimating Wadi runoff and groundwater recharge in the Eastern Desert, Egypt. J. Hydrol. 2002, 263, 36–55. [Google Scholar] [CrossRef]


| Litho | Rad | Lin | Top | Dep | Sl | Cur | TWI | Dd | Ruf | Rain | |
|---|---|---|---|---|---|---|---|---|---|---|---|
| Litho | 1.00 | 0.71 | 0.83 | 0.83 | 0.71 | 0.71 | 1.25 | 1.00 | 1.00 | 1.25 | 0.83 |
| Rad | 1.40 | 1.00 | 1.17 | 1.17 | 1.00 | 1.00 | 1.75 | 1.40 | 1.40 | 1.75 | 1.17 |
| Lin | 1.20 | 0.86 | 1.00 | 1.00 | 0.86 | 0.86 | 1.50 | 1.20 | 1.20 | 1.50 | 1.00 |
| Top | 1.20 | 0.86 | 1.00 | 1.00 | 0.86 | 0.86 | 1.50 | 1.20 | 1.20 | 1.50 | 1.00 |
| Dep | 1.40 | 1.00 | 1.17 | 1.17 | 1.00 | 1.00 | 1.75 | 1.40 | 1.40 | 1.75 | 1.17 |
| Sl | 1.40 | 1.00 | 1.17 | 1.17 | 1.00 | 1.00 | 1.75 | 1.40 | 1.40 | 1.75 | 1.17 |
| Cur | 0.80 | 0.57 | 0.67 | 0.67 | 0.57 | 0.57 | 1.00 | 0.80 | 0.80 | 1.00 | 0.67 |
| TWI | 1.00 | 0.71 | 0.83 | 0.83 | 0.71 | 0.71 | 1.25 | 1.00 | 1.00 | 1.25 | 0.83 |
| Dd | 1.00 | 0.71 | 0.83 | 0.83 | 0.71 | 0.71 | 1.25 | 1.00 | 1.00 | 1.25 | 0.83 |
| Ruf | 0.80 | 0.57 | 0.67 | 0.67 | 0.57 | 0.57 | 1.00 | 0.80 | 0.80 | 1.00 | 0.67 |
| Rain | 1.20 | 0.86 | 1.00 | 1.00 | 0.86 | 0.86 | 1.50 | 1.20 | 1.20 | 1.50 | 1.00 |
| Sum | 12.40 | 8.86 | 10.33 | 10.33 | 8.86 | 8.86 | 15.50 | 12.40 | 12.40 | 15.50 | 10.33 |
| Litho | Rad | Lin | Top | Dep | Sl | Cur | TWI | Dd | Ruf | Rain | Weighted Sum | Criteria Weights | ||
|---|---|---|---|---|---|---|---|---|---|---|---|---|---|---|
| Litho | 0.081 | 0.081 | 0.081 | 0.081 | 0.081 | 0.081 | 0.081 | 0.081 | 0.081 | 0.081 | 0.081 | 0.887 | 0.081 | 11 |
| Rad | 0.113 | 0.113 | 0.113 | 0.113 | 0.113 | 0.113 | 0.113 | 0.113 | 0.113 | 0.113 | 0.113 | 1.242 | 0.113 | 11 |
| Lin | 0.097 | 0.097 | 0.097 | 0.097 | 0.097 | 0.097 | 0.097 | 0.097 | 0.097 | 0.097 | 0.097 | 1.065 | 0.097 | 11 |
| Top | 0.097 | 0.097 | 0.097 | 0.097 | 0.097 | 0.097 | 0.097 | 0.097 | 0.097 | 0.097 | 0.097 | 1.065 | 0.097 | 11 |
| Dep | 0.113 | 0.113 | 0.113 | 0.113 | 0.113 | 0.113 | 0.113 | 0.113 | 0.113 | 0.113 | 0.113 | 1.242 | 0.113 | 11 |
| Sl | 0.113 | 0.113 | 0.113 | 0.113 | 0.113 | 0.113 | 0.113 | 0.113 | 0.113 | 0.113 | 0.113 | 1.242 | 0.113 | 11 |
| Cur | 0.065 | 0.065 | 0.065 | 0.065 | 0.065 | 0.065 | 0.065 | 0.065 | 0.065 | 0.065 | 0.065 | 0.710 | 0.065 | 11 |
| TWI | 0.081 | 0.081 | 0.081 | 0.081 | 0.081 | 0.081 | 0.081 | 0.081 | 0.081 | 0.081 | 0.081 | 0.887 | 0.081 | 11 |
| Dd | 0.081 | 0.081 | 0.081 | 0.081 | 0.081 | 0.081 | 0.081 | 0.081 | 0.081 | 0.081 | 0.081 | 0.887 | 0.081 | 11 |
| Ruf | 0.065 | 0.065 | 0.065 | 0.065 | 0.065 | 0.065 | 0.065 | 0.065 | 0.065 | 0.065 | 0.065 | 0.710 | 0.065 | 11 |
| Rain | 0.097 | 0.097 | 0.097 | 0.097 | 0.097 | 0.097 | 0.097 | 0.097 | 0.097 | 0.097 | 0.097 | 1.065 | 0.097 | 11 |
| Assigned Weight | Sub-Classes | Rank | Grade | Normalized Rank | Area % | |
|---|---|---|---|---|---|---|
| Lithology | 5 | Quaternary deposits | 6 | High | 0.55 | 11.78 |
| Eocene sediments | 3 | Moderate | 0.27 | 82.21 | ||
| Paleozoic/L-Tertiary | 2 | Low | 0.18 | 6.01 | ||
| Radar intensity | 7 | 22–44 | 8 | Very high | 0.44 | 27.74 |
| 44–85 | 5 | High | 0.28 | 47.18 | ||
| 85–173 | 3 | Moderate | 0.17 | 21.17 | ||
| 173–255 | 2 | Low | 0.11 | 3.91 | ||
| Lineaments (km/km2) | 6 | 0–15.27 | 2 | Very low | 0.29 | 14.50 |
| 15.27–27.63 | 4 | Low | 0.25 | 27.51 | ||
| 27.63–39.27 | 5 | Moderate | 0.21 | 27.30 | ||
| 39.27–52.73 | 6 | High | 0.17 | 21.45 | ||
| 52.73–92.73 | 7 | Very high | 0.08 | 9.23 | ||
| Altitude (m) | 6 | 27–264 | 8 | Very high | 0.31 | 25.45 |
| 264–413 | 7 | High | 0.27 | 24.65 | ||
| 413–574 | 5 | Moderate | 0.19 | 19.27 | ||
| 574–736 | 4 | Low | 0.15 | 20.91 | ||
| 736–1260 | 2 | Very low | 0.08 | 9.71 | ||
| Depression (m) | 7 | −31 to −2.64 | 8 | High | 0.50 | 2.64 |
| −2.64 to −0.72 | 5 | Moderate | 0.31 | 7.42 | ||
| −0.72 to 0 | 3 | Low | 0.19 | 89.94 | ||
| Slope (degree) | 7 | 0–3 | 5 | Very high | 0.33 | 54.72 |
| 3 to 5 | 4 | High | 0.27 | 26.48 | ||
| 5 to 10 | 3 | Moderate | 0.20 | 14.95 | ||
| 10 to 15 | 2 | Low | 0.13 | 2.68 | ||
| >15 | 1 | Very low | 0.07 | 1.18 | ||
| Curvature (radians/100 m) | 4 | −2.66 to −0.0889 | 2 | Low | 0.2 | 25.84 |
| −0.0889 to 0.139 | 3 | Moderate | 0.3 | 27.11 | ||
| 0.139 to 2.8339 | 5 | High | 0.5 | 47.05 | ||
| TWI | 5 | 4.78 to 8.07 | 1 | Very high | 0.09 | 27.92 |
| 8.07 to 9.48 | 2 | High | 0.18 | 41.58 | ||
| 9.84 to 11.31 | 3 | Moderate | 0.27 | 20.62 | ||
| 11.31 to 17.69 | 5 | Low | 0.45 | 9.88 | ||
| Drainage density (km/km2) | 5 | 6.55 to 47.79 | 2 | Very low | 0.10 | 9.1 |
| 47.79 to 66.80 | 3 | Low | 0.14 | 22.35 | ||
| 66.80 to 83.17 | 4 | Moderate | 0.19 | 31.66 | ||
| 83.17 to 100.60 | 5 | High | 0.24 | 25.39 | ||
| 100.60 to 141.27 | 7 | Very high | 0.33 | 11.51 | ||
| Runoff | 4 | 24.49–25.95 | 5 | Very high | 0.33 | 10.86 |
| 25.97–29.23 | 4 | High | 0.27 | 23.82 | ||
| 29.24–33.15 | 3 | Moderate | 0.20 | 33.79 | ||
| 33.16–40.43 | 2 | Low | 0.13 | 20.91 | ||
| 40.44–46.87 | 1 | Very low | 0.07 | 10.62 | ||
| Rainfall (mm/day) | 6 | 0.0120 to 0.0174 | 2 | Low | 0.20 | 70.31 |
| 0.0174 to 0.0307 | 3 | Moderate | 0.30 | 18.08 | ||
| 0.0307 to 0.0874 | 5 | High | 0.50 | 11.61 |
Publisher’s Note: MDPI stays neutral with regard to jurisdictional claims in published maps and institutional affiliations. |
© 2022 by the authors. Licensee MDPI, Basel, Switzerland. This article is an open access article distributed under the terms and conditions of the Creative Commons Attribution (CC BY) license (https://creativecommons.org/licenses/by/4.0/).
Share and Cite
Abdekareem, M.; Al-Arifi, N.; Abdalla, F.; Mansour, A.; El-Baz, F. Fusion of Remote Sensing Data Using GIS-Based AHP-Weighted Overlay Techniques for Groundwater Sustainability in Arid Regions. Sustainability 2022, 14, 7871. https://doi.org/10.3390/su14137871
Abdekareem M, Al-Arifi N, Abdalla F, Mansour A, El-Baz F. Fusion of Remote Sensing Data Using GIS-Based AHP-Weighted Overlay Techniques for Groundwater Sustainability in Arid Regions. Sustainability. 2022; 14(13):7871. https://doi.org/10.3390/su14137871
Chicago/Turabian StyleAbdekareem, Mohamed, Nasir Al-Arifi, Fathy Abdalla, Abbas Mansour, and Farouk El-Baz. 2022. "Fusion of Remote Sensing Data Using GIS-Based AHP-Weighted Overlay Techniques for Groundwater Sustainability in Arid Regions" Sustainability 14, no. 13: 7871. https://doi.org/10.3390/su14137871
APA StyleAbdekareem, M., Al-Arifi, N., Abdalla, F., Mansour, A., & El-Baz, F. (2022). Fusion of Remote Sensing Data Using GIS-Based AHP-Weighted Overlay Techniques for Groundwater Sustainability in Arid Regions. Sustainability, 14(13), 7871. https://doi.org/10.3390/su14137871