Article

Development and Optimization of Geopolymers Made with Desert Dune Sand and Blast Furnace Slag

Department of Civil and Environmental Engineering, UAE University, Al Ain P.O. Box 15551, United Arab Emirates
*
Author to whom correspondence should be addressed.
Sustainability 2022, 14(13), 7845; https://doi.org/10.3390/su14137845
Submission received: 17 May 2022 / Revised: 23 June 2022 / Accepted: 23 June 2022 / Published: 27 June 2022
(This article belongs to the Special Issue Use of Industrial Solid Wastes for Sustainable Construction)

Abstract

:
This study assesses the effect of mix design parameters on the fresh and hardened properties, cost, and carbon footprint of geopolymer mortar made with desert dune fines (DDF) and blast furnace slag (BFS). Taguchi method was employed in designing the experiments. Four factors were considered, each having three levels, leading to a total of nine geopolymer mortar mixes. The factors comprised the DDF replacement percentage, alkali-activator solution to binder ratio (AAS/B), sodium silicate-to-sodium hydroxide ratio (SS/SH), and sodium hydroxide (SH) molarity. Ten performance criteria were evaluated, including the flowability, final setting time, hardened density, 1, 7, and 28-day compressive strengths, water absorption, sorptivity, cost, and carbon footprint. ANOVA was carried out to estimate the contribution of each factor towards the response criteria. Further, TOPSIS analysis was utilized to optimize the mixture proportions of DDF-BFS blended geopolymer mortar. Experimental results showed that up to 25% DDF replacement enhanced the density, strength, and durability of the geopolymers with minor impact on the flowability and setting time. Higher replacement percentages had a detrimental impact on the performance but could still be utilized in specific mortar construction applications. The other factors had more limited contributions to the performance, evidenced by the ANOVA. TOPSIS method revealed the optimum mix to be made with DDF replacement of 25%, AAS/B of 0.5, SS/SH of 1.5, and SH molarity of 10 M. Different multivariable regression models were also developed to predict the fresh and hardened properties of the DDF-BFS geopolymer mortars using the mix design parameters.

1. Introduction

The increasing demand for infrastructure and civil engineering works in the modern developing economy has drastically increased the consumption of natural resources and led to excessive carbon dioxide emissions (CO2). As such, scientists have been continuously investigating alternatives that could alleviate the negative environmental impact associated with the production of cement-based materials [1,2]. Over the last decade, environmentalists have been advocating the use of industrial waste materials as supplementary cementitious materials or fillers in the production of mortars or concrete, as cement is an energy-intensive and resource-demanding material [3,4].
The current literature converges that incorporating fillers up to predefined concentrations in cement-based composites has contributed to enhancing strength and durability-related properties while preserving natural resources and reducing CO2 emissions [5,6,7]. This enhancement is mainly associated with these additives’ physical and chemical characteristics. Indeed, the integration of fillers in cement-based composites, such as limestone powder, quartz powder, and others, has gained popularity in the construction industry, owing to their inherent advantage of worldwide availability. Several studies have reported that the incorporation of fillers in concrete led to the refinement of the microstructure and reduction of the average pore diameter of the matrix [8,9]. Meanwhile, there has been devoted research on the incorporation of powder wastes in the manufacturing of inorganic alkali-activated polymers or “geopolymers,” given their remarkably lower ecological and environmental footprint and superior strength and durability performance compared to cement-based materials [10,11].
In the United Arab Emirates, the desert area occupies nearly three-quarters of the total land surface area. Desert dune sand has been used as an essential material in the construction industry [12,13]. Current literature converges that dune sand can be usefully employed as fine aggregates in concrete production [14,15]. This dune sand can be further treated to obtain ultrafine particles of desert dune fines (DDF). DDF has wide applications in manufacture of silicone and rubber and metal coating [16]. Compared to as-received dune sand, DDF has superior fineness that could act as a microfiller in cement-based materials [7].
Despite its abundance in the Arabian, Australian, and African deserts, dune sand has not been extensively incorporated in concrete proportioning. In some cases, its low fineness modulus and poor granular skeleton did not meet the gradation limits of fine aggregates [17,18]. Meanwhile, several studies reported that dune sand resulted in superior strength and durability properties when incorporated as a filler in concrete due to enhanced distribution of pore shapes and sizes in the microstructure [7,19,20]. Furthermore, Jia et al. [14] observed an improvement in hardened concrete properties upon inclusion of Australian desert dune sand, owing to its heterogeneous nucleation and pozzolanic effects. Mechti et al. [21] highlighted that finely ground sand resulted in a pozzolanic reactivity with a 15% increase in strength despite its crystalline nature. Also, it is noteworthy that a low-cost cement-based mortar made with dune sand and microfibers plant was formulated for construction applications [22].
In recent years, limited studies have assessed the effect of dune sand on the fresh and hardened properties of geopolymer mortar [23,24,25,26]. Brahimi et al. [27] showed that the coupled effect of using dune sand rich in silica and fly ash rich in calcium could achieve synthesized geopolymers having 49.7 MPa of compressive strength. Similarly, Rashad et al. [23] found that blast furnace slag (BFS) substitution by up to 30% quartz powder led to enhanced compressive strength, after which a gradual drop in the strength was noted. In fact, the utilization of calcium-rich materials in geopolymer composites seemed effective in enhancing the overall performance, particularly when BFS was incorporated as a precursor binder. In summary, the literature shows that dune sand incorporation improved the hardened properties of mortars and concrete up to a specific replacement rate. However, the optimization of the mixture proportions of DDF-BFS blended geopolymer mixtures intended for mortar applications has not been investigated yet.
Optimizing the fresh and hardened properties of geopolymer mortar/concrete is challenging. A wide variety of factors and related levels must be considered in the design phase. Advanced systematic design approaches, including the Taguchi method, have been successfully employed to find the optimum levels of factors [28,29,30]. In construction products, i.e., paste, mortar, and concrete, Fantous and Yahia [31] and Xu et al. [32] adopted the Taguchi method to optimize the mixture proportions for superior mechanical performance. While the Taguchi method is reliable in seeking a single optimum performance, it lacks the ability to simultaneously consider various performance characteristics. Hence, multicriteria optimization methods, including ordering preferences by similarity to the ideal solution (TOPSIS), have been frequently adopted in research due to their potential to determine the optimum design conditions [33,34]. Such methods have been effectively utilized to seek the optimum mix designs of cement-based materials, alkali-activated concrete, and other engineering materials application [34,35]. Nevertheless, no study has optimized the mixture proportions of DDF-BFS blended geopolymer mortar for superior fresh and hardened properties.
This paper aims to fill this research gap by examining the effect of mix design parameters on the fresh and hardened properties of geopolymer mortar made with a blended binder of DDF and BFS. The design of experiments was carried out using the L9 Taguchi orthogonal array. Four factors, each with three levels, were examined: DDF replacement rate, alkaline activator solution-to-binder ratio (AAS/B), sodium silicate-to-sodium hydroxide ratio (SS/SH), and SH molarity. The DDF-BFS blended geopolymer mortar properties were evaluated through the flowability, setting times, unit weight, compressive strength, water absorption, and sorptivity. The cost and CO2 footprint of the various mixes were also investigated. The Taguchi method was first used to optimize the mix design by discretely selecting different performance criteria. Then, the TOPSIS method was implemented to optimize the mix proportions while concurrently evaluating all quality criteria. Analytical regression models were also developed to predict different quality criteria based on the mixture proportions. Such data can benefit researchers and engineers seeking geopolymer mortar mixtures with optimum performance for various construction applications.

2. Experimental Program
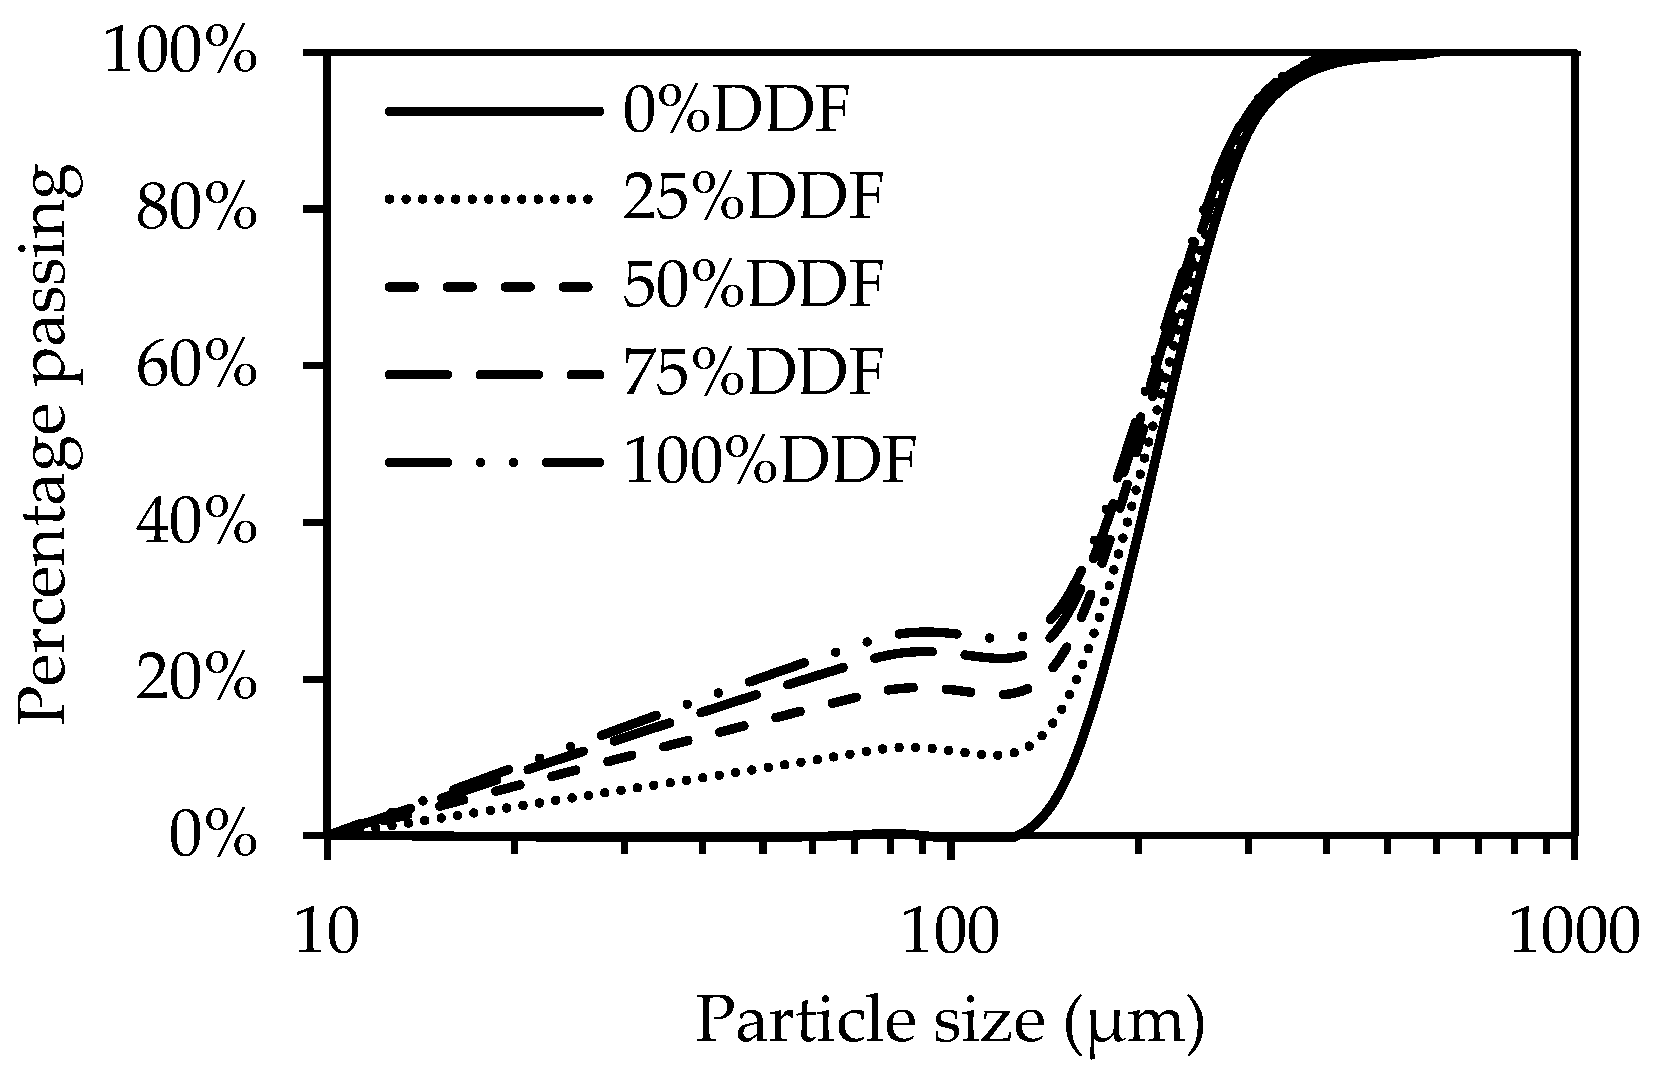
2.1. Materials

BFS was commercially obtained from Emirates Cement as a precursor binding material. Its physical and chemical properties are summarized in Table 1. Conversely, the DDF was collected by sieving as-received dune sand. It possesses a relatively wide range of particle sizes that can be divided into three different size fractions: 0–300, 0–150, and 0–75 microns. In this work, DDF served to replace 25, 50, and 75% BFS, by mass, as binder in geopolymer mortars. The morphology and mineralogy of BFS and DDF can be found elsewhere [36,37].
To determine the optimum size of DDF that would yield the highest compressive strength in geopolymer mortar mixtures, a series of preliminary tests were carried out. One control mixture (i.e., 100% BFS) and four DDF-BFS blended mixtures (i.e., 25% DDF replacement of BFS) with different particle sizes of DDF were tested. The preliminary results showed that using DDF with particle sizes of 0–300, 0–150, and 0–75 microns at 25% replacement of BFS achieved compressive strengths of 26.8, 32.4, and 46.5 MPa, respectively. Meanwhile, the 100% BFS control mix had a strength of 52.3 MPa. Hence, DDF having a size range of 0–75 microns was adopted in this study. Its chemical composition and physical properties are presented in Table 1.
The as-received desert dune sand, from which the DDF was extracted, served as the fine aggregates in the geopolymer mortar. It had similar microstructure characteristics as the DDF but had a specific surface area and specific gravity of 142 cm2/g and 2.77, respectively. The particle size distribution of the different fine materials (i.e., dune sand and DDF) is shown in Figure 1. The mixes having BFS replaced with 0, 25, 50, 75, and 100% DDF are denoted as 0% DDF, 25% DDF, 50% DDF, 75% DDF, and 100% DDF, respectively. Compared to the mix made with dune sand only (0% DDF), the inclusion of DDF improved the particle packing of the geopolymer mortar mixes.
The alkaline activator solution (AAS) was composed of sodium silicate (SS) and sodium hydroxide (SH). The SS solution was made of 26.3% SiO2, 10.3% Na2O, and 63.4% H2O, while the SH solution was prepared by dissolving 97–98% pure SH flakes in tap water to formulate different solutions having 6, 10, and 14 M molarity. Also, a polycarboxylate ether-based superplasticizer (SP) was incorporated at a fixed rate of 2% by binder mass to ensure a flowability above 140 mm in all mixes.

2.2. Development of Geopolymer Mortar Mixtures

Four factors were identified, each at three levels, to explore their influence on the performance of DDF-BFS blended geopolymer mortars. These four factors are the binder replacement percentage, AAS-to-binder ratio, SS/SH, and SH molarity. They have been selected in this work as past studies have identified them as key parameters that affect the fresh and hardened properties of geopolymer mortars [35,36]. As summarized in Table 2, the factors included the BFS replacement by DDF (25–75%), AAS-to-binder ratio or AAS/B (0.5–0.6), SS/SH ratio (1.0–2.0), and SH molarity (6–14 M). These levels were selected through preliminary trials and based on typical values in geopolymer mixes [11,15,29]. Mixes made with DDF replacement of 100% resulted in a compressive strength below 5 MPa, while those made with higher or lower AAS/B, SS/SH, and SH molarity either experienced flash setting or did not set within 24 h. Hence, an L9 orthogonal array was used to develop the experimental matrix by considering all levels and factors to the equivalent location in the matrix, resulting in nine DDF-BFS blended geopolymer mortar mixes.
The control mix C1 was designed based on previous work conducted by the authors [36]. It was made with 625 kg/m3 of binder, binder-to-aggregate ratio of 1.94, AAS-to-binder ratio of 0.5, SS/SH of 2.0, and SP content of 2%, by binder mass. Analogous mixture proportions were adopted for control mix C2 with the replacement of 100% BFS by DDF. The dune sand quantity was slightly modified to accommodate for the different specific gravities of BFS and DDF. In turn, mixes 1–9 were made with the same total binder content of 625 kg/m3 and SP content of 2%, by binder mass, while their BFS, DDF, SS, and SH contents were varied based on the matrix of Table 3.

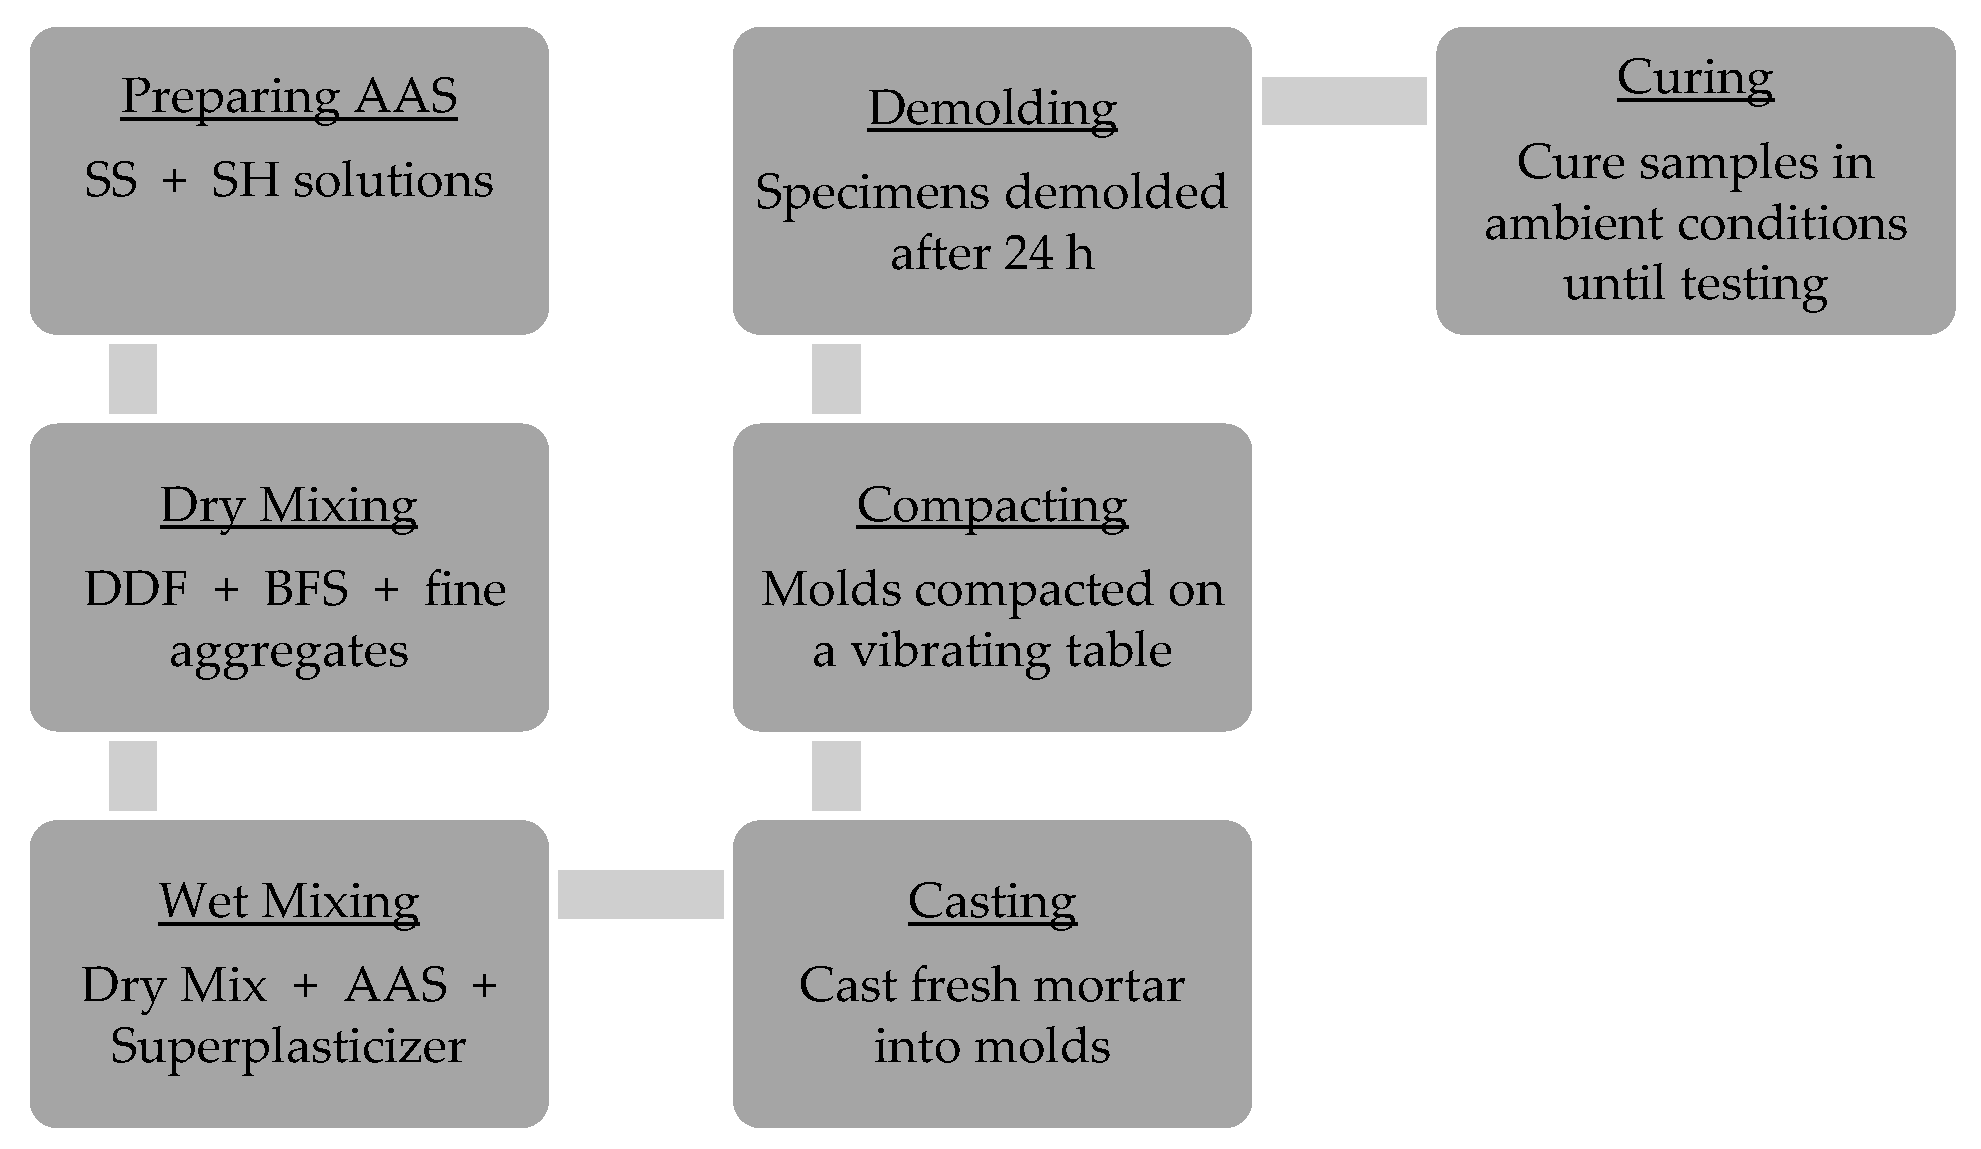
2.3. Sample Preparation

The procedure for preparing the geopolymer mortars is illustrated in Figure 2. The AAS made of SH and SS solutions was prepared 24 h prior to casting to dissipate the heat generated from the chemical reactions linked to the solution preparation. The mixing sequence consisted of mixing the as-received dune sand (i.e., fine aggregates), DDF, and BFS in a pan mixer for 5 min. Then, the AAS was gradually added along with the superplasticizer to the dry components and mixed for an additional 3 min. The freshly mixed geopolymer mortar was cast into 100 mm × 200 mm (diameter × height) cylindrical and 50 mm cubic molds to evaluate the mechanical and durability properties. The individual specimens were cast into two to three layers, compacted on a vibrating table for 10 s, demolded after 24 h, and cured in ambient air conditions until testing. The ambient temperature and relative humidity hovered around 25 ± 2 °C and 50 ± 5% during mixing and sampling.

2.4. Test Methods

The tests adopted in this work were selected to characterize the fresh, physical, mechanical, and durability properties of DDF-BFS blended geopolymer mortar. The flowability and the unit weight of the DDF-BFS blended geopolymer mortars were determined as per ASTM C230 and C138 test methods, respectively [38,39]. Meanwhile, the initial and final setting times were evaluated using the Vicat needle apparatus, as per ASTM C191 [40]. The compressive strength (f’c) of 1-, 7-, and 28-day geopolymer mortar mixtures was obtained following the ASTM C109 test method [41]. For all tests, triplicate specimens were tested per mix to obtain an average.
The water absorption and the sorptivity of DDF-BFS blended geopolymer mortar mixtures were determined following ASTM C642 and C1585 test methods [42,43]. In the former test, 50-mm thick discs extracted from 100 mm × 200 mm (diameter × height) cylinders were oven-dried at 105 °C until a mass variation of less than 0.5% was attained. Specimens were then immersed in water for 24 h. Hence, the “dry mass” and “SSD mass” were recorded, and the water absorption was computed, as per ASTM C642 [42]. In the sorptivity test, similar disc samples were oven-dried at 105 °C for 24 h, then left to attain ambient temperature prior to testing. An impermeable tape was used to cover and seal the sides and the top surface of the samples. Afterward, the exposed surface was immersed 3 ± 1 mm in water. The variation in mass was recorded for 6 h. The initial sorptivity, i.e., water absorption rate, was determined as the variation in mass divided by the exposed cross-sectional area and water density, as per ASTM C1585 [43].

2.5. Cost and CO2 Footprint Calculations

Table 4 summarizes the cost and carbon dioxide footprint (CO2(Ft)) of the materials used in producing the geopolymer mortar. The respective unit costs of materials are relevant to the United Arab Emirates (UAE) market in 2022 and could vary from one supplier to another. While several components, such as DDF, dune sand, BFS, and water, are relatively inexpensive, others are costly, including the alkaline activator solution and superplasticizer. Thus, the cost of various geopolymer mortar mixes was determined by calculating the individual cost of each constituent required to produce 1 m3 of mortar and then adding them to determine the total cost of the mix. Similarly, the potential environmental impact of geopolymer mortars was assessed by quantitatively comparing CO2(Ft). The corresponding CO2(Ft) values for the raw constituents of geopolymer mortars have been collected from previous research work [1,2] to calculate CO2(Ft) for 1 m3 of geopolymer mortar.

3. Optimization Methods

3.1. Taguchi Integration

Taguchi developed a robust design technique for adoption in different engineering applications to achieve optimum conditions while minimizing the influence of uncontrolled factors and reducing the number of required experiments [28,44]. In this technique, an orthogonal array is developed based on a loss function, which is transformed into a signal-noise (S/N) ratio to compute the difference between the targeted experimental and actual values. The S/N ratio should be increased to minimize the variation within the required target. The analysis of the S/N ratio is essentially carried out based on the required response optimization. Two different values are computed based on the targeted characteristic response: the “Smaller-is-better” and the “Larger-is-better”. For instance, the “Smaller-is-better” S/N characteristic is used for water absorption and sorptivity responses, as these properties are to be minimized, while the “Larger-is-better” S/N characteristic is used for flowability and compressive strength responses, which are to be maximized. The corresponding Equations (1) and (2) to calculate the S/N are given as follows:
S / N = 10   log 10 1 n i = 1 n y ij 2   Smaller - is - better
S / N = 10   log 10 1 n i = 1 n 1 y ij 2   Larger - is - better
where n is the number of a given experiment and yij is the measured experimental response to be optimized.

3.2. Optimization by TOPSIS Method

The Taguchi optimization method is mainly adopted to seek the optimum mix conditions and explore the significant factors while considering only one performance criteria at a time. Yet, several advanced methods showed promising results in finding the optimum conditions by considering various performance criteria simultaneously [36,45]. In this study, TOPSIS was adopted as a multicriteria performance optimization method to find the optimum mix design while concurrently satisfying the fresh and hardened properties, economic impact, and environmental impact of DDF-BFS blended geopolymer mortar. These performance criteria included the flowability, final setting time, hardened density, 1-, 7-, and 28-day compressive strengths, water absorption, sorptivity, cost, and CO2(ft), denoted as Q1-Q10, respectively. The TOPSIS and Taguchi methods were integrated to find the optimum mix through the following steps:
Step 1: Normalization of the decision matrix
The decision matrix was developed by adopting the S/N ratio for each experiment. Since each performance criterion relied on a specific measuring scale, the vector normalization of the decision matrix was carried out using Equation (3).
r ij = η ij i = 1 m η 2 ij .
where ηij is the S/N value for a specific response, and rij is the normalized vector equivalent to the ηij vector.
Step 2: Assigning normalized weights for the normalized decision matrix
Each performance criterion was assigned a specific weight based on its significance to the end-user. Accordingly, the normalization of each weight was computed and then multiplied by the corresponding vector from the normalized matrix. Hence, a new weighted normalized matrix was developed and used in the following steps. It is worth noting that the summation of all normalized weight was equal to 1.
Step 3: Computing the negative and positive ideal solutions
The negative and positive ideal solutions were calculated using Equations (4) and (5), respectively. These values were related to the weighted normalized matrix’s minimum and maximum values, where vij, J, and G are the weighted normalized decision matrix cell value, the benefit type criteria set, and the cost type criteria set, respectively.
A + = { ( max   v ij   j     J ) ,   ( min   v ij   j     G ) }
A = { ( max   v ij   j     J ) ,   ( max   v ij   j     G ) }
Step 4: Determining the distance from the ideal solutions
Using Equations (6) and (7), the corresponding distances from the ideal solutions (positive, Si+ and negative, Si) to the weighed normalized matrix were computed, where vj+ and vj− represent the positive and negative ideal normalized matrix values.
S i + = j = 1 n ( v ij   v j + ) 2  
S i = j = 1 n ( v ij v j ) 2  
Step 5: Calculating the closeness coefficient to the ideal solution
The closeness coefficient (Ci*) to the ideal solution or ranking score is calculated using Equation (8). It merged all experimental responses into a single criterion to identify the optimum factors.
C i * = S i + S i + S i +  
Step 6: Assigning the obtained closeness coefficient in Taguchi to find the S/N ratio
Using Equations (1) and (2), the S/N ratio for each experiment was computed. Then, the optimal mix design was determined by considering the highest S/N ratio.

4. Results and Discussion

4.1. Flowability and Setting Time

The effect of DDF content on the workability of geopolymer mortar is shown in Figure 3. The DDF-BFS blended geopolymer mortar mixes were categorized based on their BFS replacement rate by DDF. For instance, mixes 4, 5, and 6 were allotted in the 50% DDF category. Meanwhile, control mixes C1 and C2 were categorized separately with 0 and 100% DDF replacement, respectively. Geopolymer mortar mixes containing low concentrations of DDF (i.e., 25%) exhibited a similar consistency response to that of control mix C1, hovering around 210 mm. This can be directly linked to the increased mixture cohesiveness due to the 25% replacement of BFS by DDF [45,46,47]. However, the use of higher concentrations of DDF was coupled with lower flow responses, owing to the particle size distribution and high specific area of the DDF that may adsorb part of the wet components (i.e., SS, SH, or SP), increase the internal friction, and, consequently, hinder the flow of geopolymer mortar [20,48]. For instance, the flow decreased, on average, from 225 mm to 210, 181, 153, and 110 mm upon replacing BFS with 25, 50, 75, and 100% DDF, respectively. Similar findings were noted in other work on replacing fine natural aggregates with recycled counterparts [49,50].
In each DDF replacement category, the increase in the AAS/B led to a general increase in the workability (i.e., flow). This phenomenon is similar to that of the water-to-binder ratio in conventional cement-based materials, as reported in past work [51]. Furthermore, mixtures made with reduced SS/SH and SH molarity exhibited an increase in flow. Those having SS/SH in the range of 1–1.5 and molarity of SH between 6 and 10 M, such as mixtures 1, 6, and 8, yielded the highest workability among mixtures made with blended BFS and DDF. Such results are in line with other studies reflecting the reduction in viscosity of the AAS when less SS and low SH molarity are used [36].
The initial and final setting times of geopolymer mortar mixtures are illustrated in Figure 3. Since the two properties followed a similar trend, the focus hereafter was on analyzing the final setting time. In general, the addition of DDF led to an increase in geopolymer mortar setting time, suggesting that the DDF played a negative role in diluting the mix, which in turn caused retardation in the chemical reaction and lengthening of the setting time. For instance, the average final setting time increased from 14.1 to 14.2, 19.5, 24.3, and 32.8 min upon replacing BFS with 25, 50, 75, and 100% DDF, respectively. Similar findings have been observed in other works studying the effect of a silica filler on the hydration of cement [52]. Moreover, the use of SH solution molarity below 10 M was coupled with higher setting time responses in each category. Indeed, mixes 1, 4, and 9 had the longest setting times for each category. Such lower SH molarity may have caused a decrease in the dissolution rate of BFS, as noted elsewhere [53]. This phenomenon was also reported in alkali-activated ladle slag mortars [34]. Yet, it is worth noting that DDF replacement had a predominant effect on the workability and setting time compared to AAS/B, SS/SH, and SH molarity, evidenced by its significantly higher contribution shown in the ANOVA results later. From this point, an analytical model was developed to predict the flow and final setting time from the DDF replacement percentage. Linear relationships, with a correlation coefficient (R2) greater than 0.95, exist between DDF replacement and each of the flow and final setting time, as shown in Figure 4. Accordingly, it is possible to predict these two properties for DDF-BFS blended geopolymer mortars using the DDF replacement percentage with high accuracy.

4.2. Fresh and Hardened Densities

The fresh and hardened densities of geopolymer mortar mixes made with different mixture proportions are summarized in Table 5. The fresh density hovered around 2142 ± 140 kg/m3, with the highest value of 2250 kg/m3 recorded for the control mix C1 proportioned with 100% BFS. Regardless of AAS/B, SS/SH, and SH molarity, mixes 1, 2, and 3 containing 25% of DDF exhibited the highest fresh density values reaching up to 2240 kg/m3. Conversely, mixes containing higher DDF additions showed decreased fresh density responses, which can be related to the DDF nature that reduced the flow and created a more porous mortar, thereby, lowering the density. For example, the fresh density decreased from 2250 kg/m3 for control mix C1 to 2168 kg/m3 when 75% DDF was added.
After 28 days, the density decreased by up to 15%. The hardened density recorded for the control mix made with 100% BFS was 2065 kg/m3, while that made with 100% DDF was 1680 kg/m3. Mix 2 made with DDF of 25%, AAS/B of 0.55, SS/SH of 1.5, and SH molarity of 10 M exhibited the highest hardened density among all mixes, with a value of 2070 kg/m3. The corresponding response was comparatively similar to that of the control mix containing 100% BFS (mix C1), suggesting that low concentrations of DDF (i.e., 25%) did not significantly affect the density of geopolymer mortars. This can be attributed to the particle size distribution and reactive nature of DDF, particularly when it is incorporated at low concentrations [7,54]. Conversely, the use of higher rates of DDF significantly reduced the density responses; for example, the hardened density reached 1888, 1800, and 1680 kg/m3 for mixes containing 50, 75, and 100% DDF, respectively. The high concentrations of DDF diluted the mortar matrix, creating a more porous microstructure, as observed in the water absorption later. Also, the workability of the mixes was reduced by increasing DDF replacement, which may have affected the compactability.

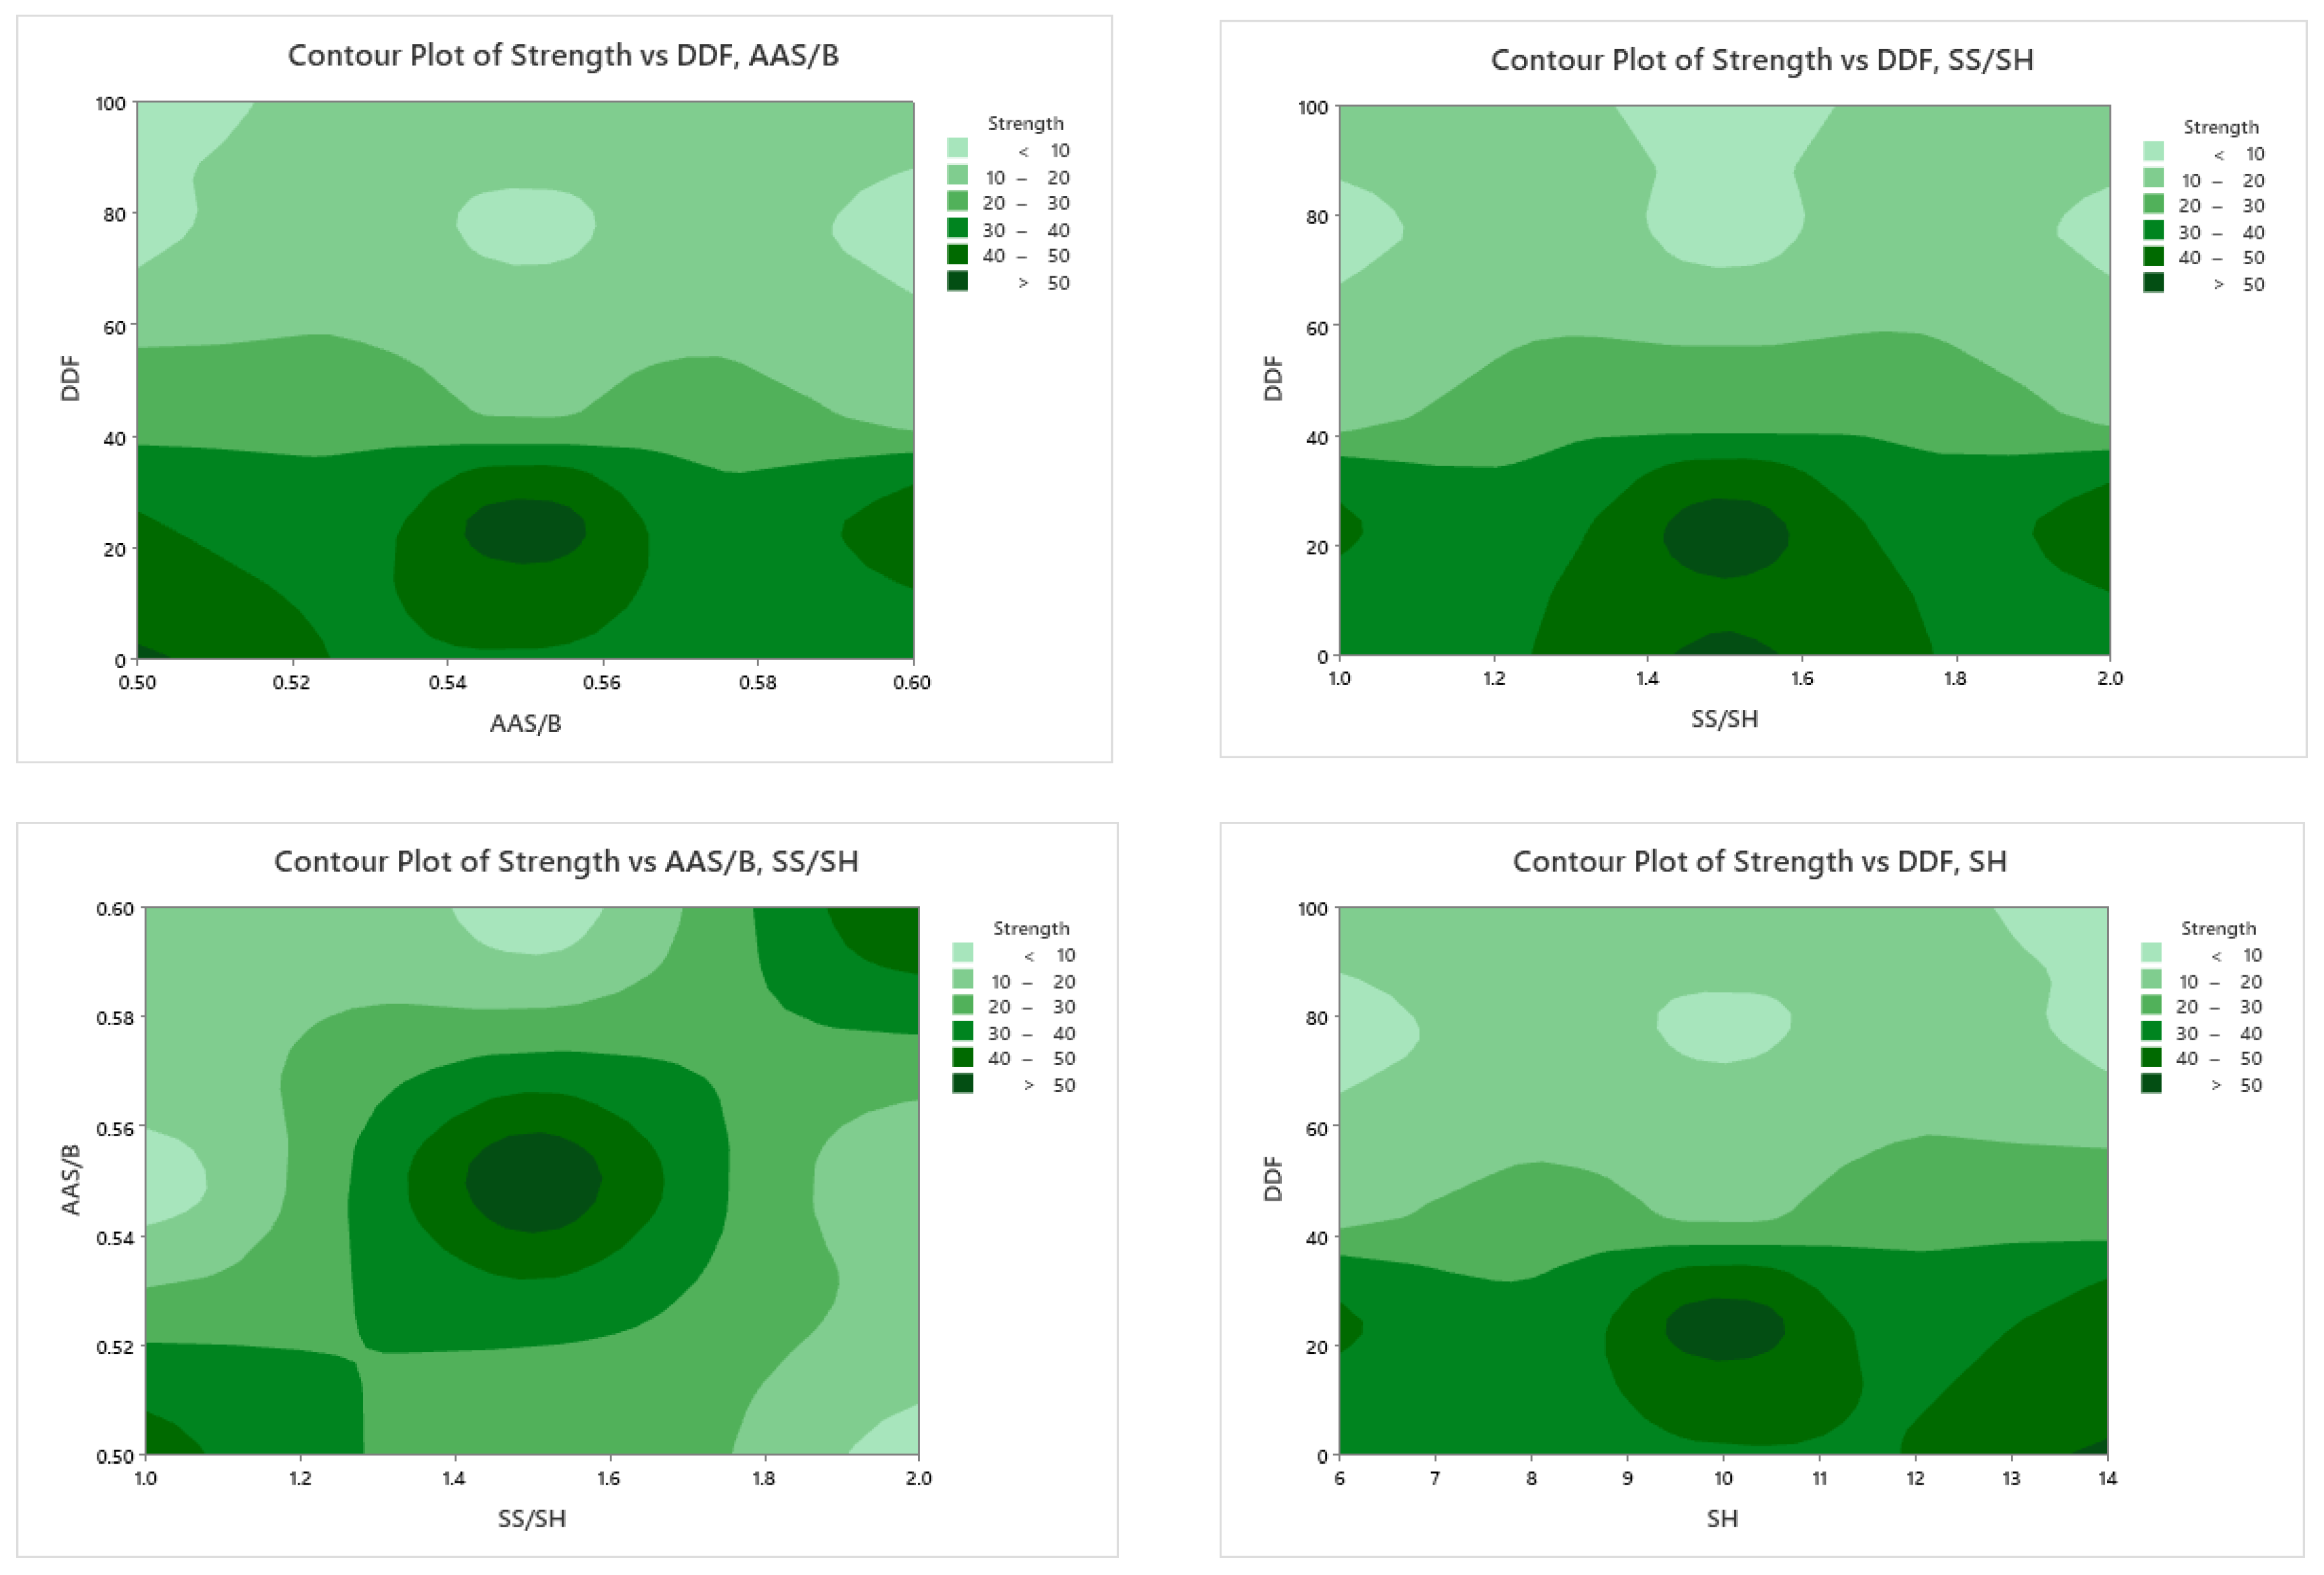
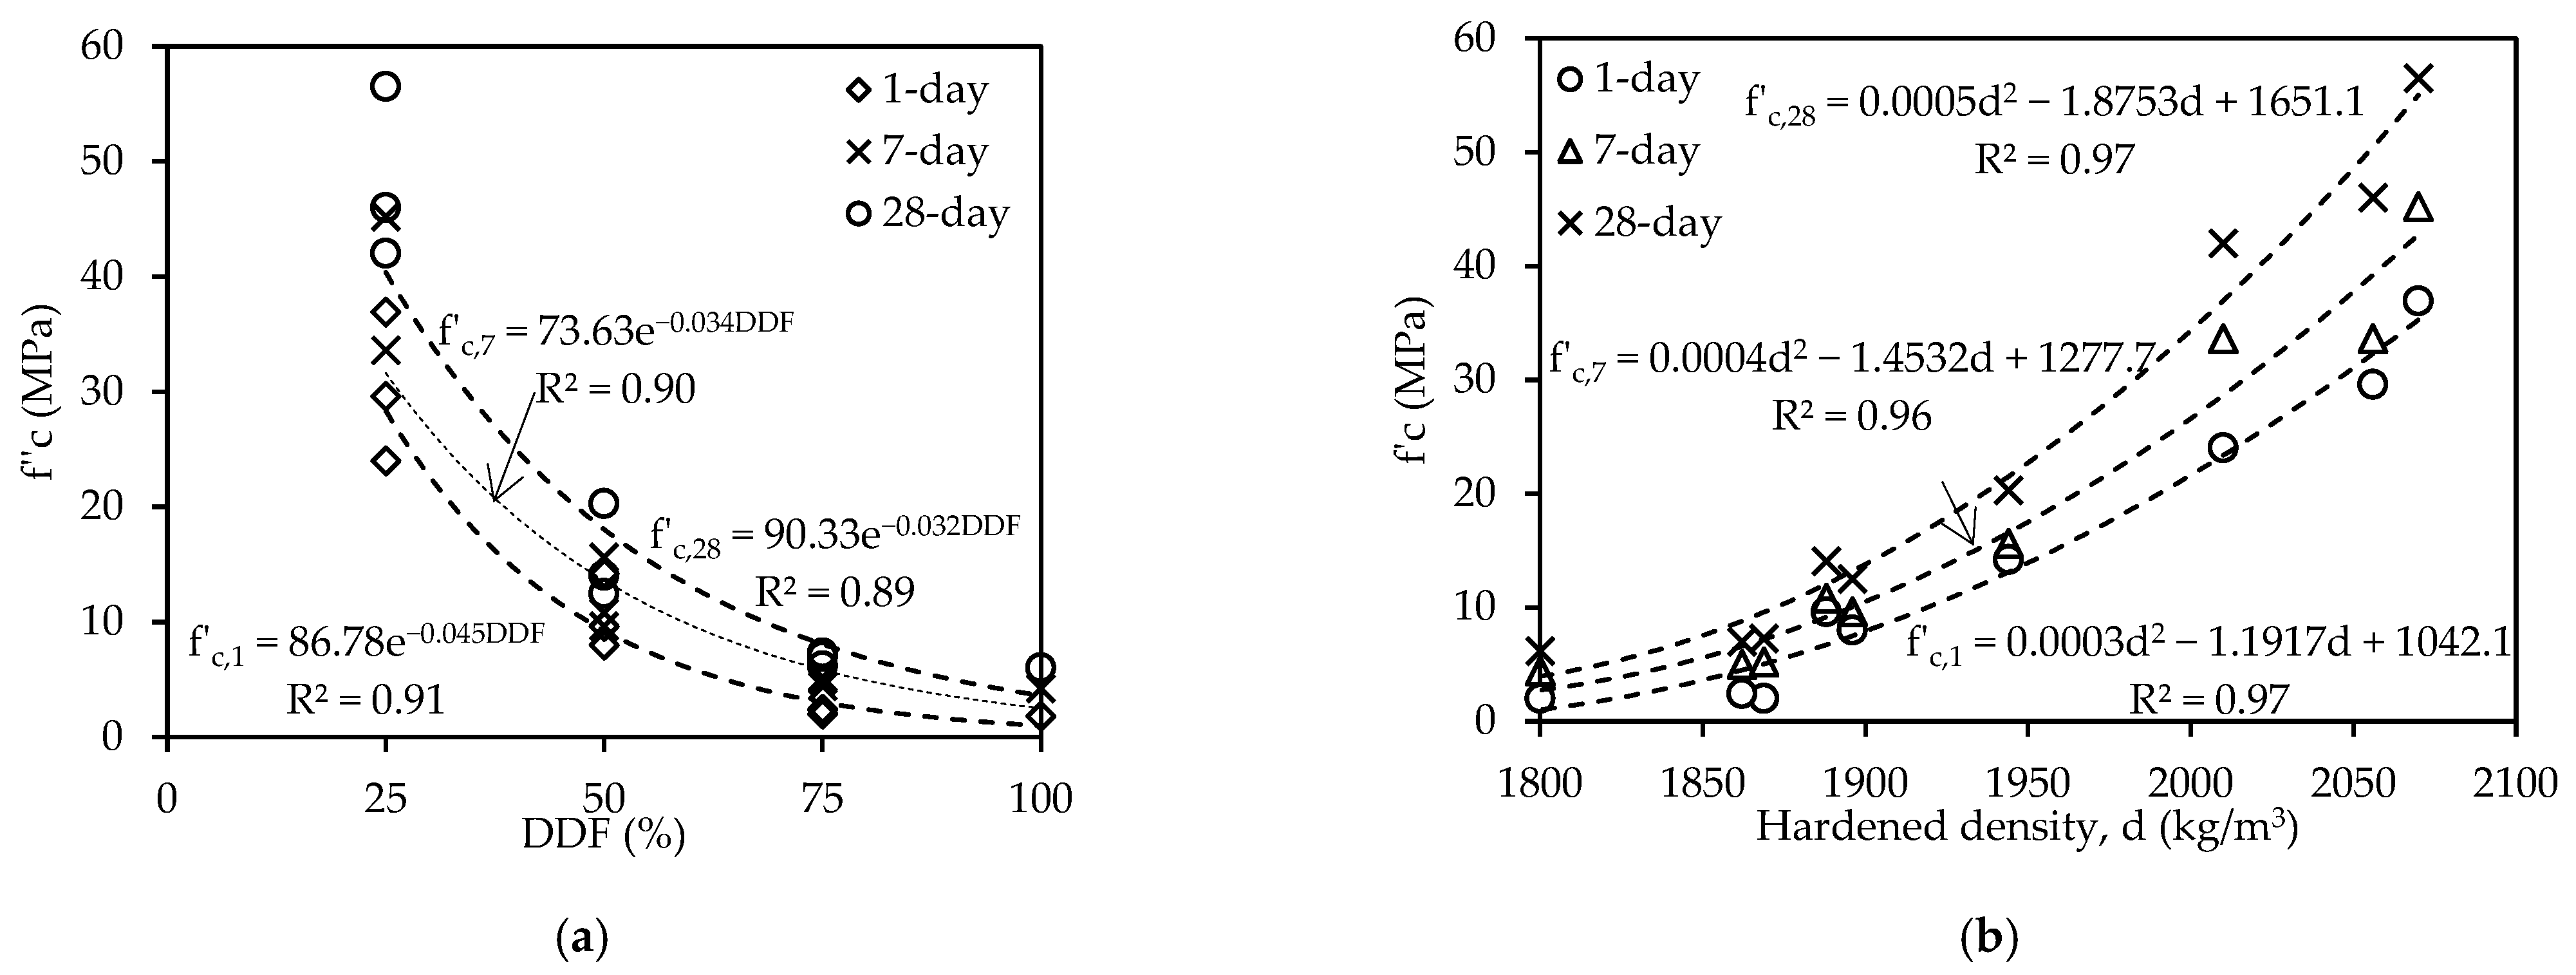
4.3. Compressive Strength

Figure 5 shows the compressive strength (f’c) development of geopolymer mortar mixtures at 1, 7, and 28 days. The strength results showed similar trends at different ages. Hence, the analysis focused on the 28-day responses. The geopolymer mortar mixes were arranged based on their DDF replacement category. For example, mixes 4, 5, and 6 were allotted in the 50% DDF category. Meanwhile, C1 and C2 mixes containing 0 or 100% DDF were categorized separately. Results show that mix 2, containing 25% DDF, yielded the highest compressive strength response of 56.5 MPa. Compared to control mix C1, made with 100% BFS, the replacement of BFS by 25% DDF seemed to slightly enhance the strength response. This enhancement in strength is attributed to the improved particle packing density and particle gradation, as shown in Figure 1. Others have also noticed enhanced distribution of pore shapes and sizes in the microstructure [7,19,20]. Furthermore, it is possible that the heterogeneous nucleation and pozzolanic nature (i.e., high silica content) of DDF may have promoted the geopolymerization process and densified the interfacial transition zone characteristics of the geopolymer mortars [21,55,56]. Such results are in agreement with those of other work [7,50,55].
In contrast, geopolymer mortars containing higher DDF contents (i.e., 50 to 75%) exhibited reduced strength responses. On average, the compressive strength decreased from 48.2 to 15.6 and 6.8 MPa when the DDF replacement increased from 25% to 50 and 75%, respectively. This may be attributed to the dilution effect of DDF with a high replacement level that resulted in a reduction in compressive strength [52]. Also, the lower activation reaction efficiency of DDF at ambient temperature may have negatively impacted the strength as the less reactive DDF replaced BFS. It is worth noting that a previous study that substituted more than 35% binder with quartz powder observed similar strength reductions due to higher silica/alumina ratios in the geopolymeric matrix [55].
In each DDF replacement category, mixes 2, 4, and 7 attained the highest 28-day compressive strength of 56.5, 20.3, and 7.3 MPa, respectively. Two-dimensional contour plots were established to highlight the effect of dual factors on the compressive strength response, as shown in Figure 6. Mixtures proportioned with 0–25% of DDF, 0.5–0.55 of AAS/B, 1.5–2.0 of SS/SH, and 10–14 M of SH solution attained compressive strength responses above 40 MPa. These proportions improved the particle packing density, reduced the porosity, increased the density, led to the dissolution of hydroxide ions, and consequently higher strength [57]. Further increasing the addition of DDF coupled with high AAS/B, low SS/SH, and low SH molarity led to the reduction in compressive strength, reflecting the dilution effect linked with the lower dissolution of hydroxide ions [35]. Nevertheless, the performance was not as significantly impacted due to variations in AAS/B, SS/SH, and SH molarity as when DDF replacement changed. Indeed, such a finding is evident by the high contribution (90%) of DDF towards strength, as described in the ANOVA section later. Meanwhile, incorporating higher BFS content in the DDF-BFS geopolymer mortar was associated with higher strength. This could be attributed to its impressive activation capabilities and granular structure that could foster the production of calcium silicate hydrate and aluminosilicate hydrate gels [58]. Still, despite mixtures made with at least 50% DDF exhibiting strength responses in the range of 6.0–20.3 MPa, these compressive strength values are considered sufficient for specific applications based on BS EN 413–1 [59]. Thus, it is possible to maximize DDF replacement while maintaining adequate performance for specific mortar construction applications.
Based on the findings presented herein, the compressive strength results were correlated to the percentage replacement of BFS by DDF. Figure 7a. shows that a good relationship exists between compressive strength at various ages and DDF replacement with correlation coefficients (R2) greater than 0.89. Similarly, the results of f’c are well-aligned to the hardened density (d). Analytical models were developed to correlate f’c at various ages and the hardened density (d), as shown in Figure 7b. Accurate relationships were proposed with high correlation coefficients (R2) exceeding 0.90. Thus, it is possible to predict the compressive strength of DDF-BFS geopolymer mortar at 1, 7, or 28 days using the DDF replacement percentage or the 28-day hardened density values.

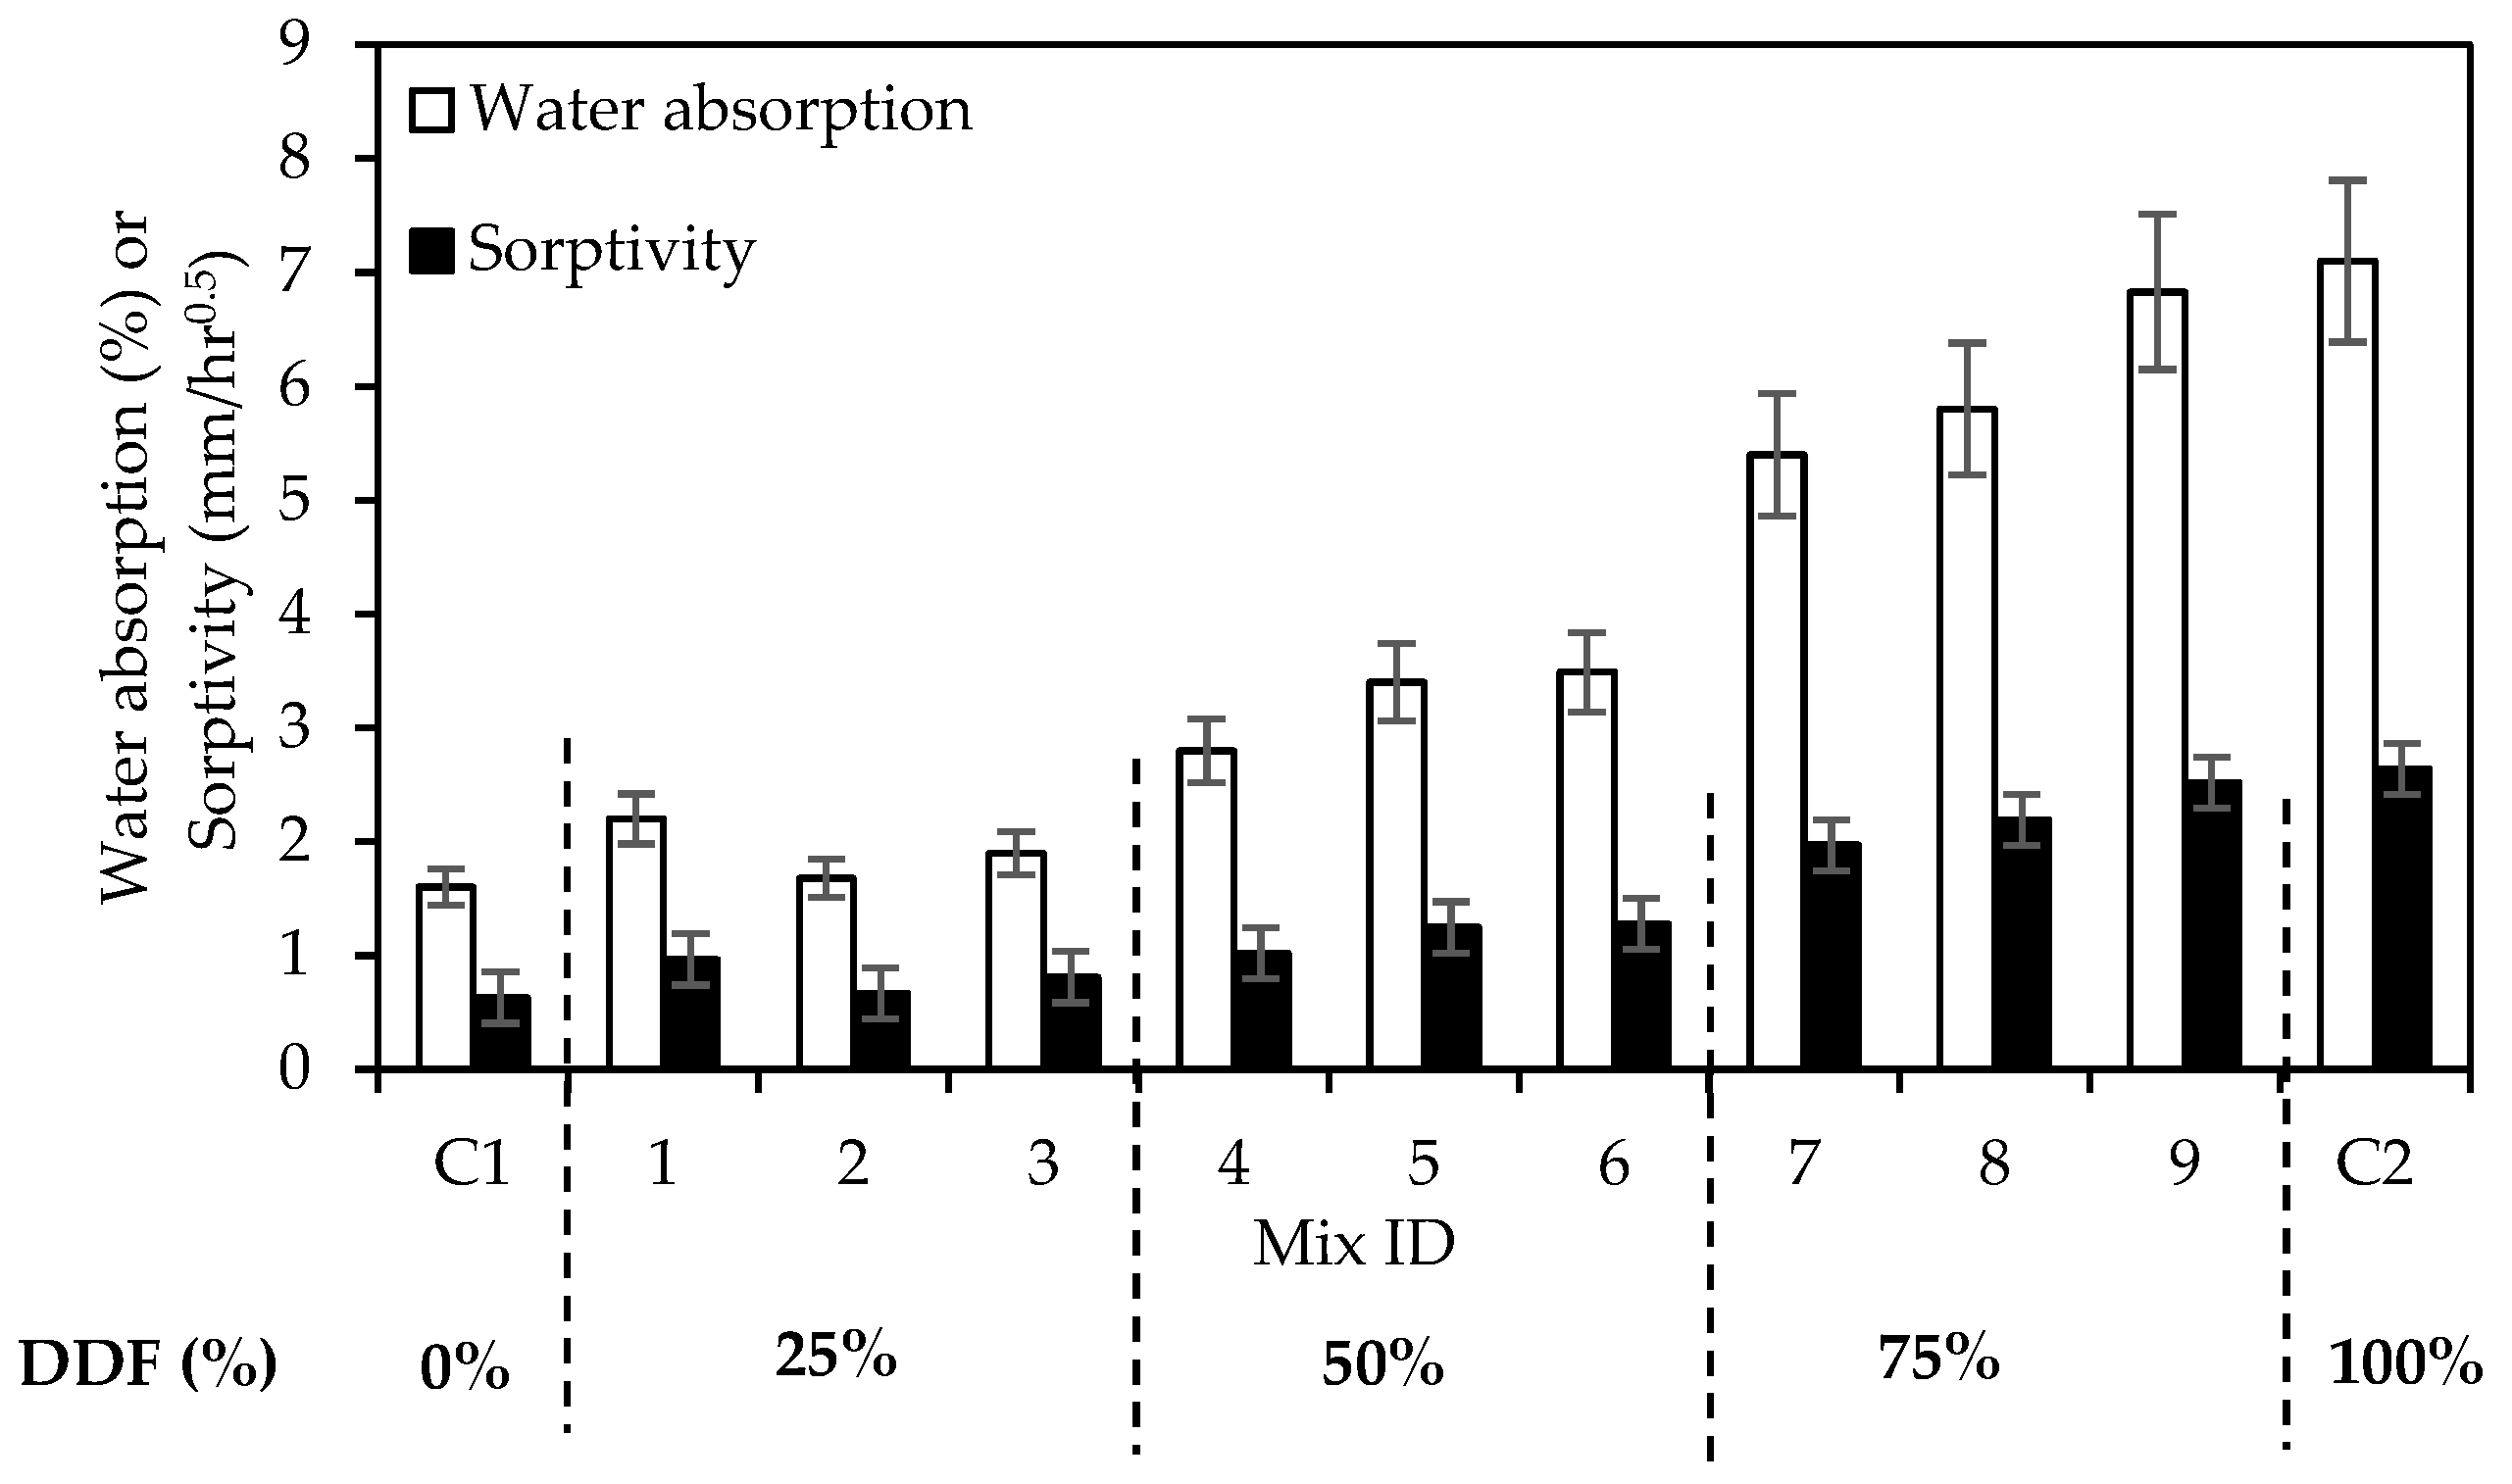
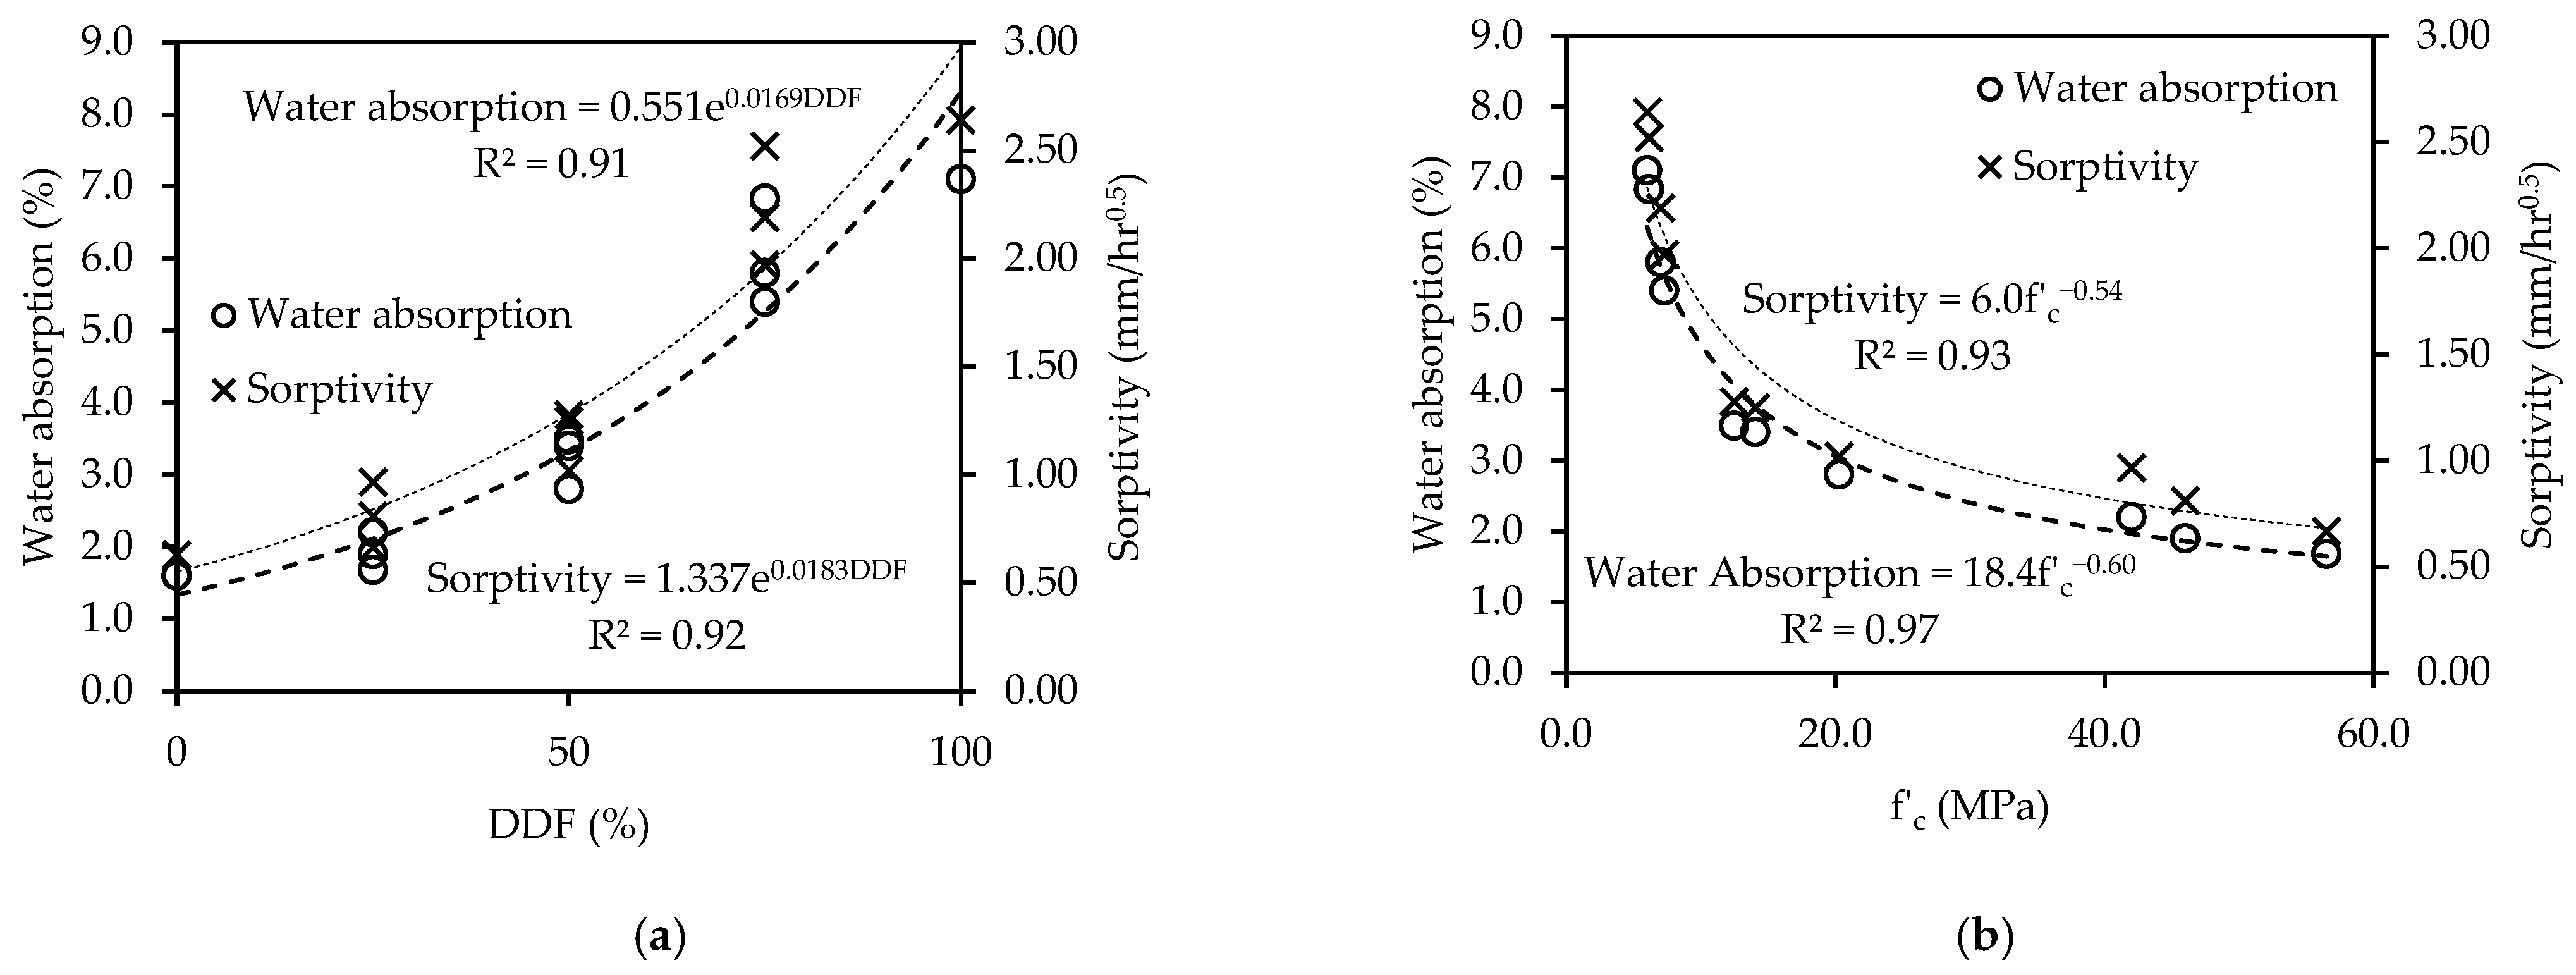
4.4. Water Absorption

The effect of BFS replacement by DDF on the water absorption and sorptivity is shown in Figure 8. Values ranged between 1.6 and 7.1%, with the lowest and highest values being attributed to the control mixes made with 100% BFS and 100% DDF. Geopolymer mortar mixes prepared with 25% DDF achieved analogous water absorption responses as those of control mix C1. Such finding is in line with those of compressive strength and hardened density, which can be attributed to the enhanced particle packing density and pozzolanic reactivity of DDF in the binding matrix [54,60,61]. Compared to the other mix design factors, i.e., AAS/B, SH/SS, and SH solution, it is apparent that DDF replacement had a more significant impact on the water absorption, similar to its impact on hardened density and compressive strength. Increasing the DDF replacement from 25% to 50 and 75% led to, on average, 67 and 210% higher water absorption, respectively. These results are consistent with the decrease in strength in mixes incorporating higher DDF replacement. Apparently, higher DDF replacement led to the dilution of the geopolymeric matrix, creating a more porous microstructure, and reduction in workability, resulting in a less compactable mortar mix.

4.5. Sorptivity

The sorptivity values are presented in Figure 8. Concurrent with water absorption findings, DDF-BFS blended geopolymer concrete mixtures made with 25% DDF exhibited the lowest absorption at 150 s0.5 ranging between 1.8 and 2.7 mm and sorptivity values between 0.67 to 0.97 mm/hr0.5. Such findings were comparable to the control mix C1 containing 100% BFS. As noted earlier, this can be related to the conjunction of two phenomena, including the enhanced particle size distribution and packing density and pozzolanic reactivity of DDF, which could physically refine the capillary pores and reduce the water absorption capacity [23,55]. In other work, the high SiO2 content of the quartz powder was effective in reducing the porosity in fly ash-based geopolymers, owing to its reactive nature at ambient conditions [54]. Yet, mixes made with higher DDF replacement experienced higher sorptivity, especially when 75–100% BFS was replaced by DDF. Such a finding reflects the vulnerability of adopting DDF as a major or sole precursor binder in resisting water percolation. Furthermore, it is worth noting that the effect of AAS/B, SH/SS, and SH solution factors on sorptivity was limited compared to the DDF replacement percentage.
The absorption and sorptivity findings were correlated to the DDF replacement percentage, as shown in Figure 9a. The high correlation factors (R2 > 0.91) reflect their dependence on this mix design factor (i.e., DDF replacement percentage). Also, the results of compressive strength (f’c) and each of absorption and sorptivity were found to be analogous. The corresponding properties were correlated in Figure 9b. Hence, the water absorption and sorptivity can be predicted from f’c with high accuracy, as the respective correlation coefficients (R2) reached 0.97 and 0.93.

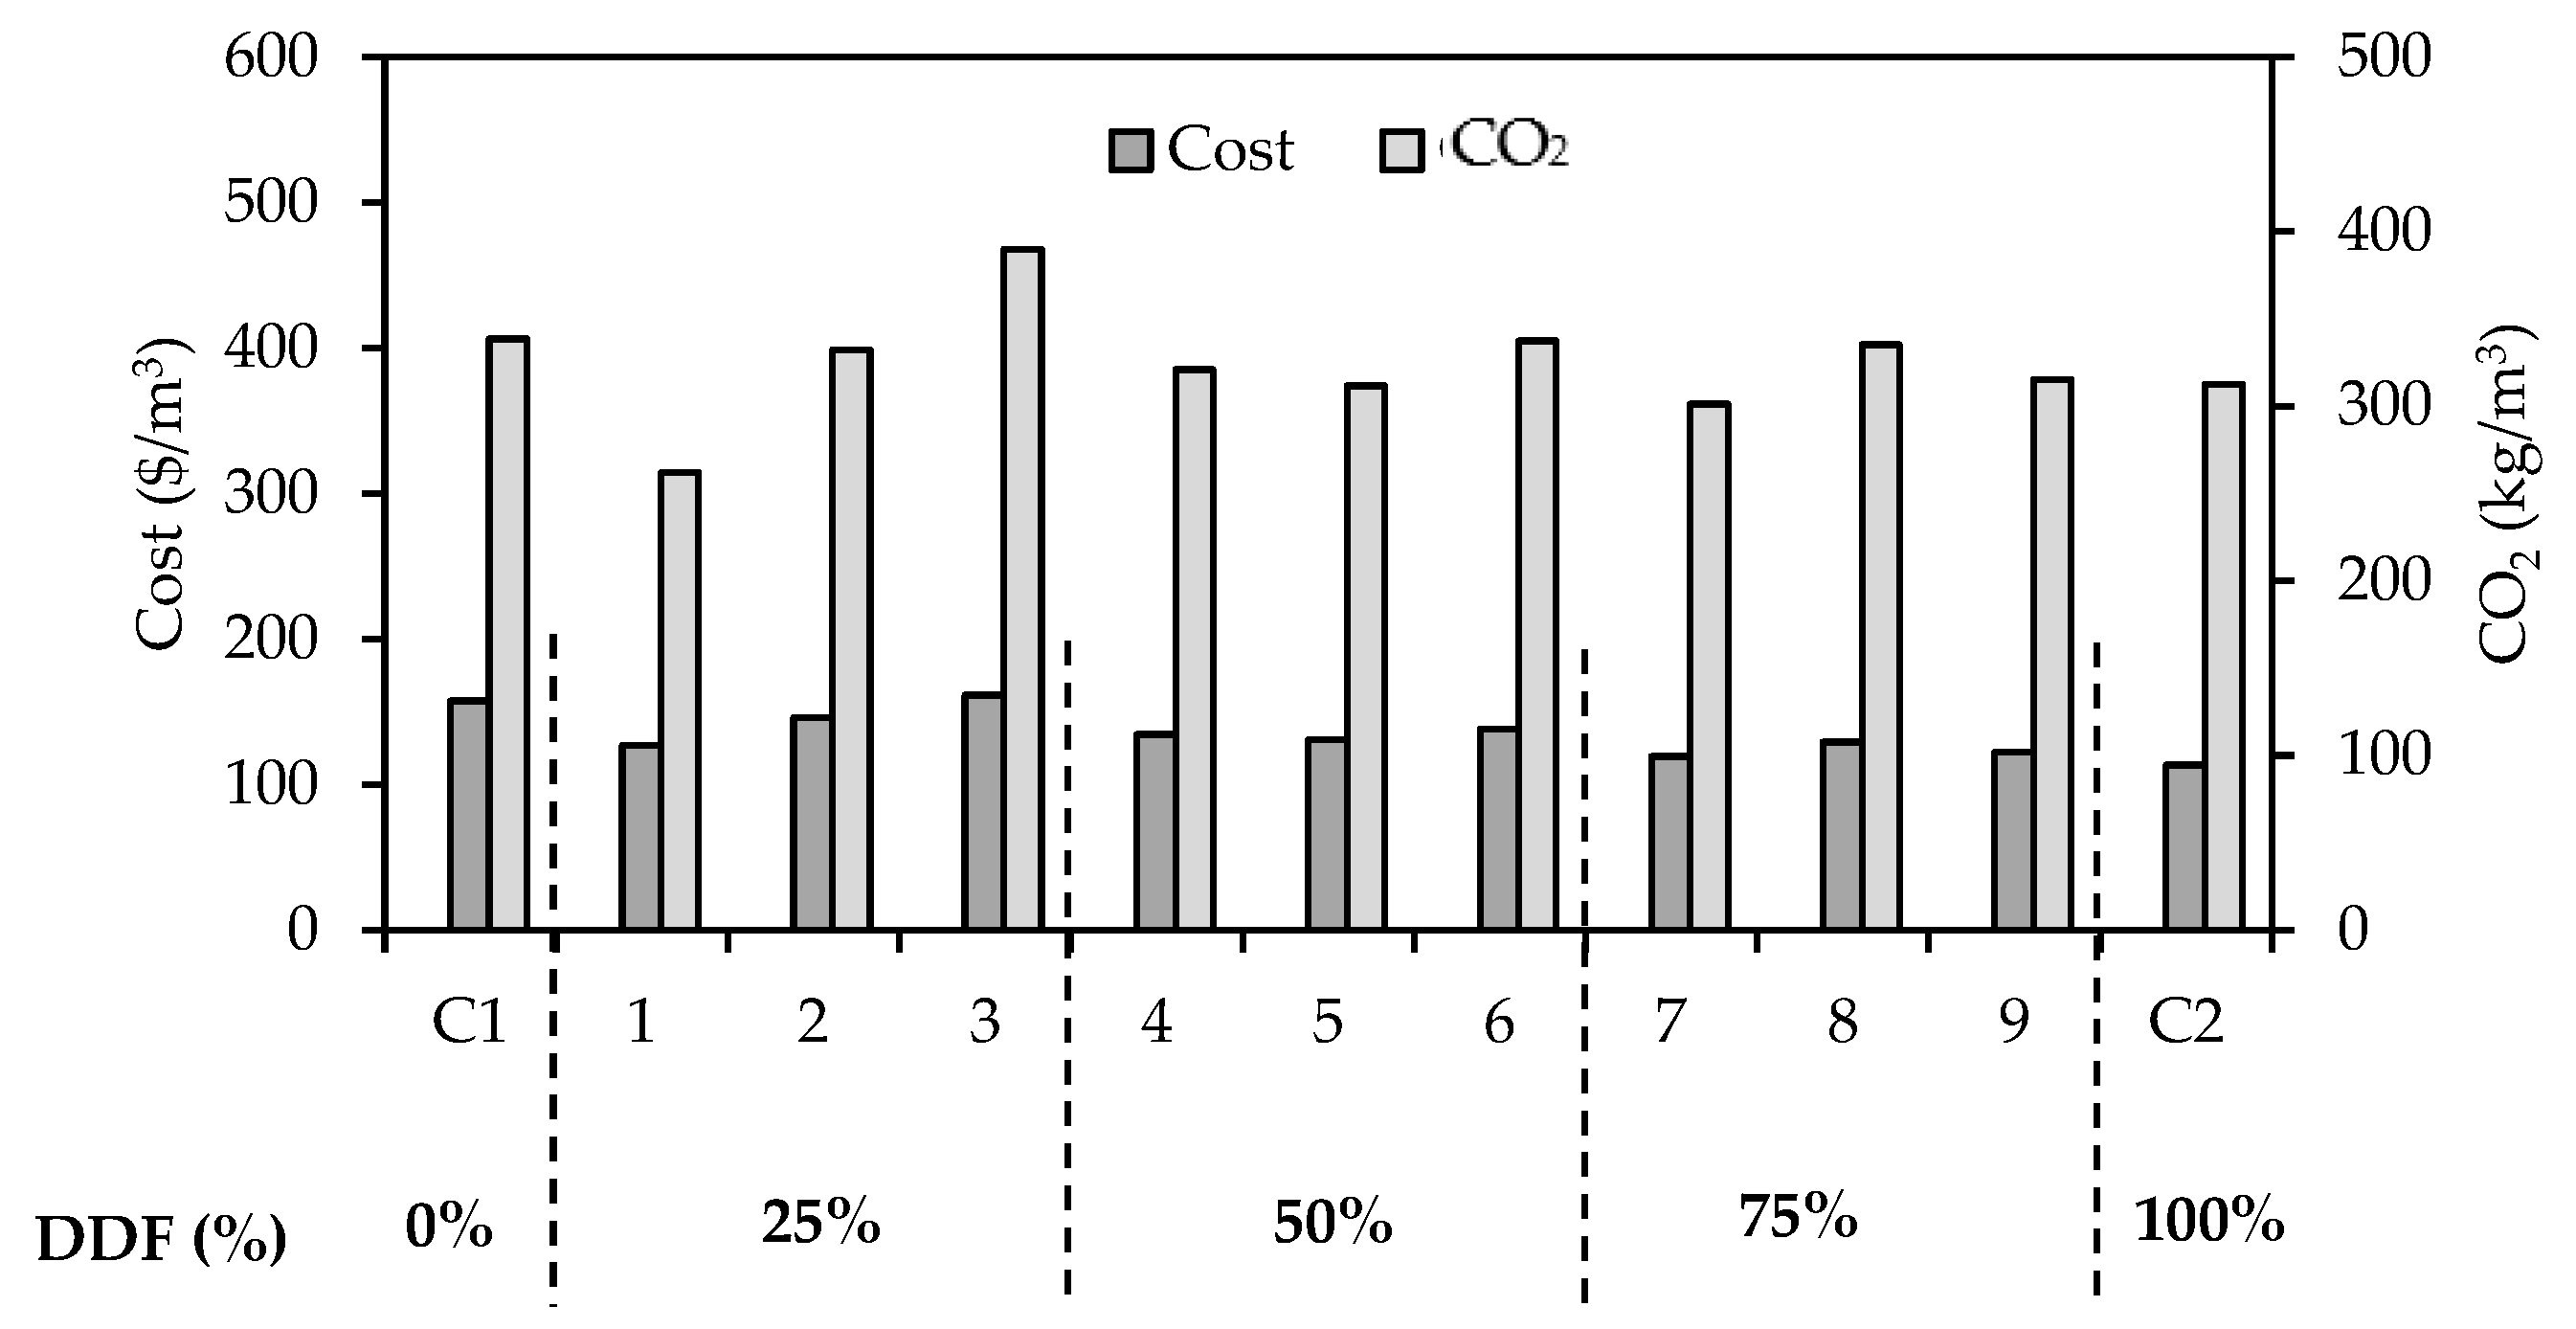
4.6. Environmental and Economic Impact Analysis

The effect of mix design parameters on the carbon footprint of DDF-BFS blended geopolymer mortar was evaluated while seeking the optimum mix proportions. Figure 10 shows that the DDF concentration slightly impacted the CO2(ft), with values decreasing from, on average, 328 kg/m3 to 323 and 317 kg/m3 as DDF replacement percentage increased from 25 to 75 and 100%, respectively. This is attributed to the low CO2(ft) of DDF compared to other constituents (Table 5), reflecting a lower impact on the total CO2(ft) of mortar mixes. Conversely, increasing the AAS content, SS/SH, and SH molarity led to increased CO2(ft), owing to their higher carbon footprint (Table 5). Nevertheless, among the three mix design parameters, the AAS/B and SH molarity seemed to have a slightly more prominent impact, as revealed in the ANOVA results later.
Figure 10 also presents the cost of DDF-BFS blended geopolymer mortar mixes. For the control mixes C1 and C2 made with either BFS or DDF as the sole binder, the corresponding unit prices were 157 and 114 $/m3. The replacement of BFS with DDF reduced the cost. In fact, the cost reduced by, on average, 7% for every 25% DDF replacement. Furthermore, it is important to note that for blended mortar mixes, the average unit price of the wet components, including SS, SH, and superplasticizer, was significantly higher than the powder materials. Thus, minimizing the use of solutions was a key factor in achieving a cost-effective geopolymer mix. Hence, the replacement of BFS with DDF and reduced AAS/B ratio and SH molarity resulted in a lower cost for 1 m3.

4.7. Analysis of Variance (ANOVA) Analysis

To further understand the effect of each mixture parameter on the fresh and hardened properties of geopolymer mortars, its contribution to a specific criterion was calculated by adopting the analysis of variance (ANOVA). This statistical approach was carried out based on the uncontrolled nuisance and independent variables. The separation of these variables as “sum-of-squares” could predict the contribution of each parameter to the required criteria [62,63,64]. In this section, the Taguchi method was used to optimize only one single criterion.
The contribution of factors to different criteria was determined at a confidence level of 95%, as summarized in Table 6. In general, the BFS replacement by DDF was the key factor to the fresh and hardened properties of geopolymer mortar, i.e., flow, setting time, density, compressive strength, water absorption, and sorptivity, yielding contributions above 90%. The other factors, including AAS/B, SS/SH, and SH molarity, exhibited much lower contribution (i.e., below 10%). Such findings are well-aligned with the experimental test results shown earlier. Contrarily, the carbon footprint was mainly impacted by the AAS/B and SH molarity, with contributions reaching up to 46%. This is primarily due to the much higher carbon footprint of the alkaline activator solution than the binder materials. As for the cost, the DDF replacement percentage had the highest contribution of 51% followed by each of AAS/B and SH molarity with respective contributions of 21 and 25%.

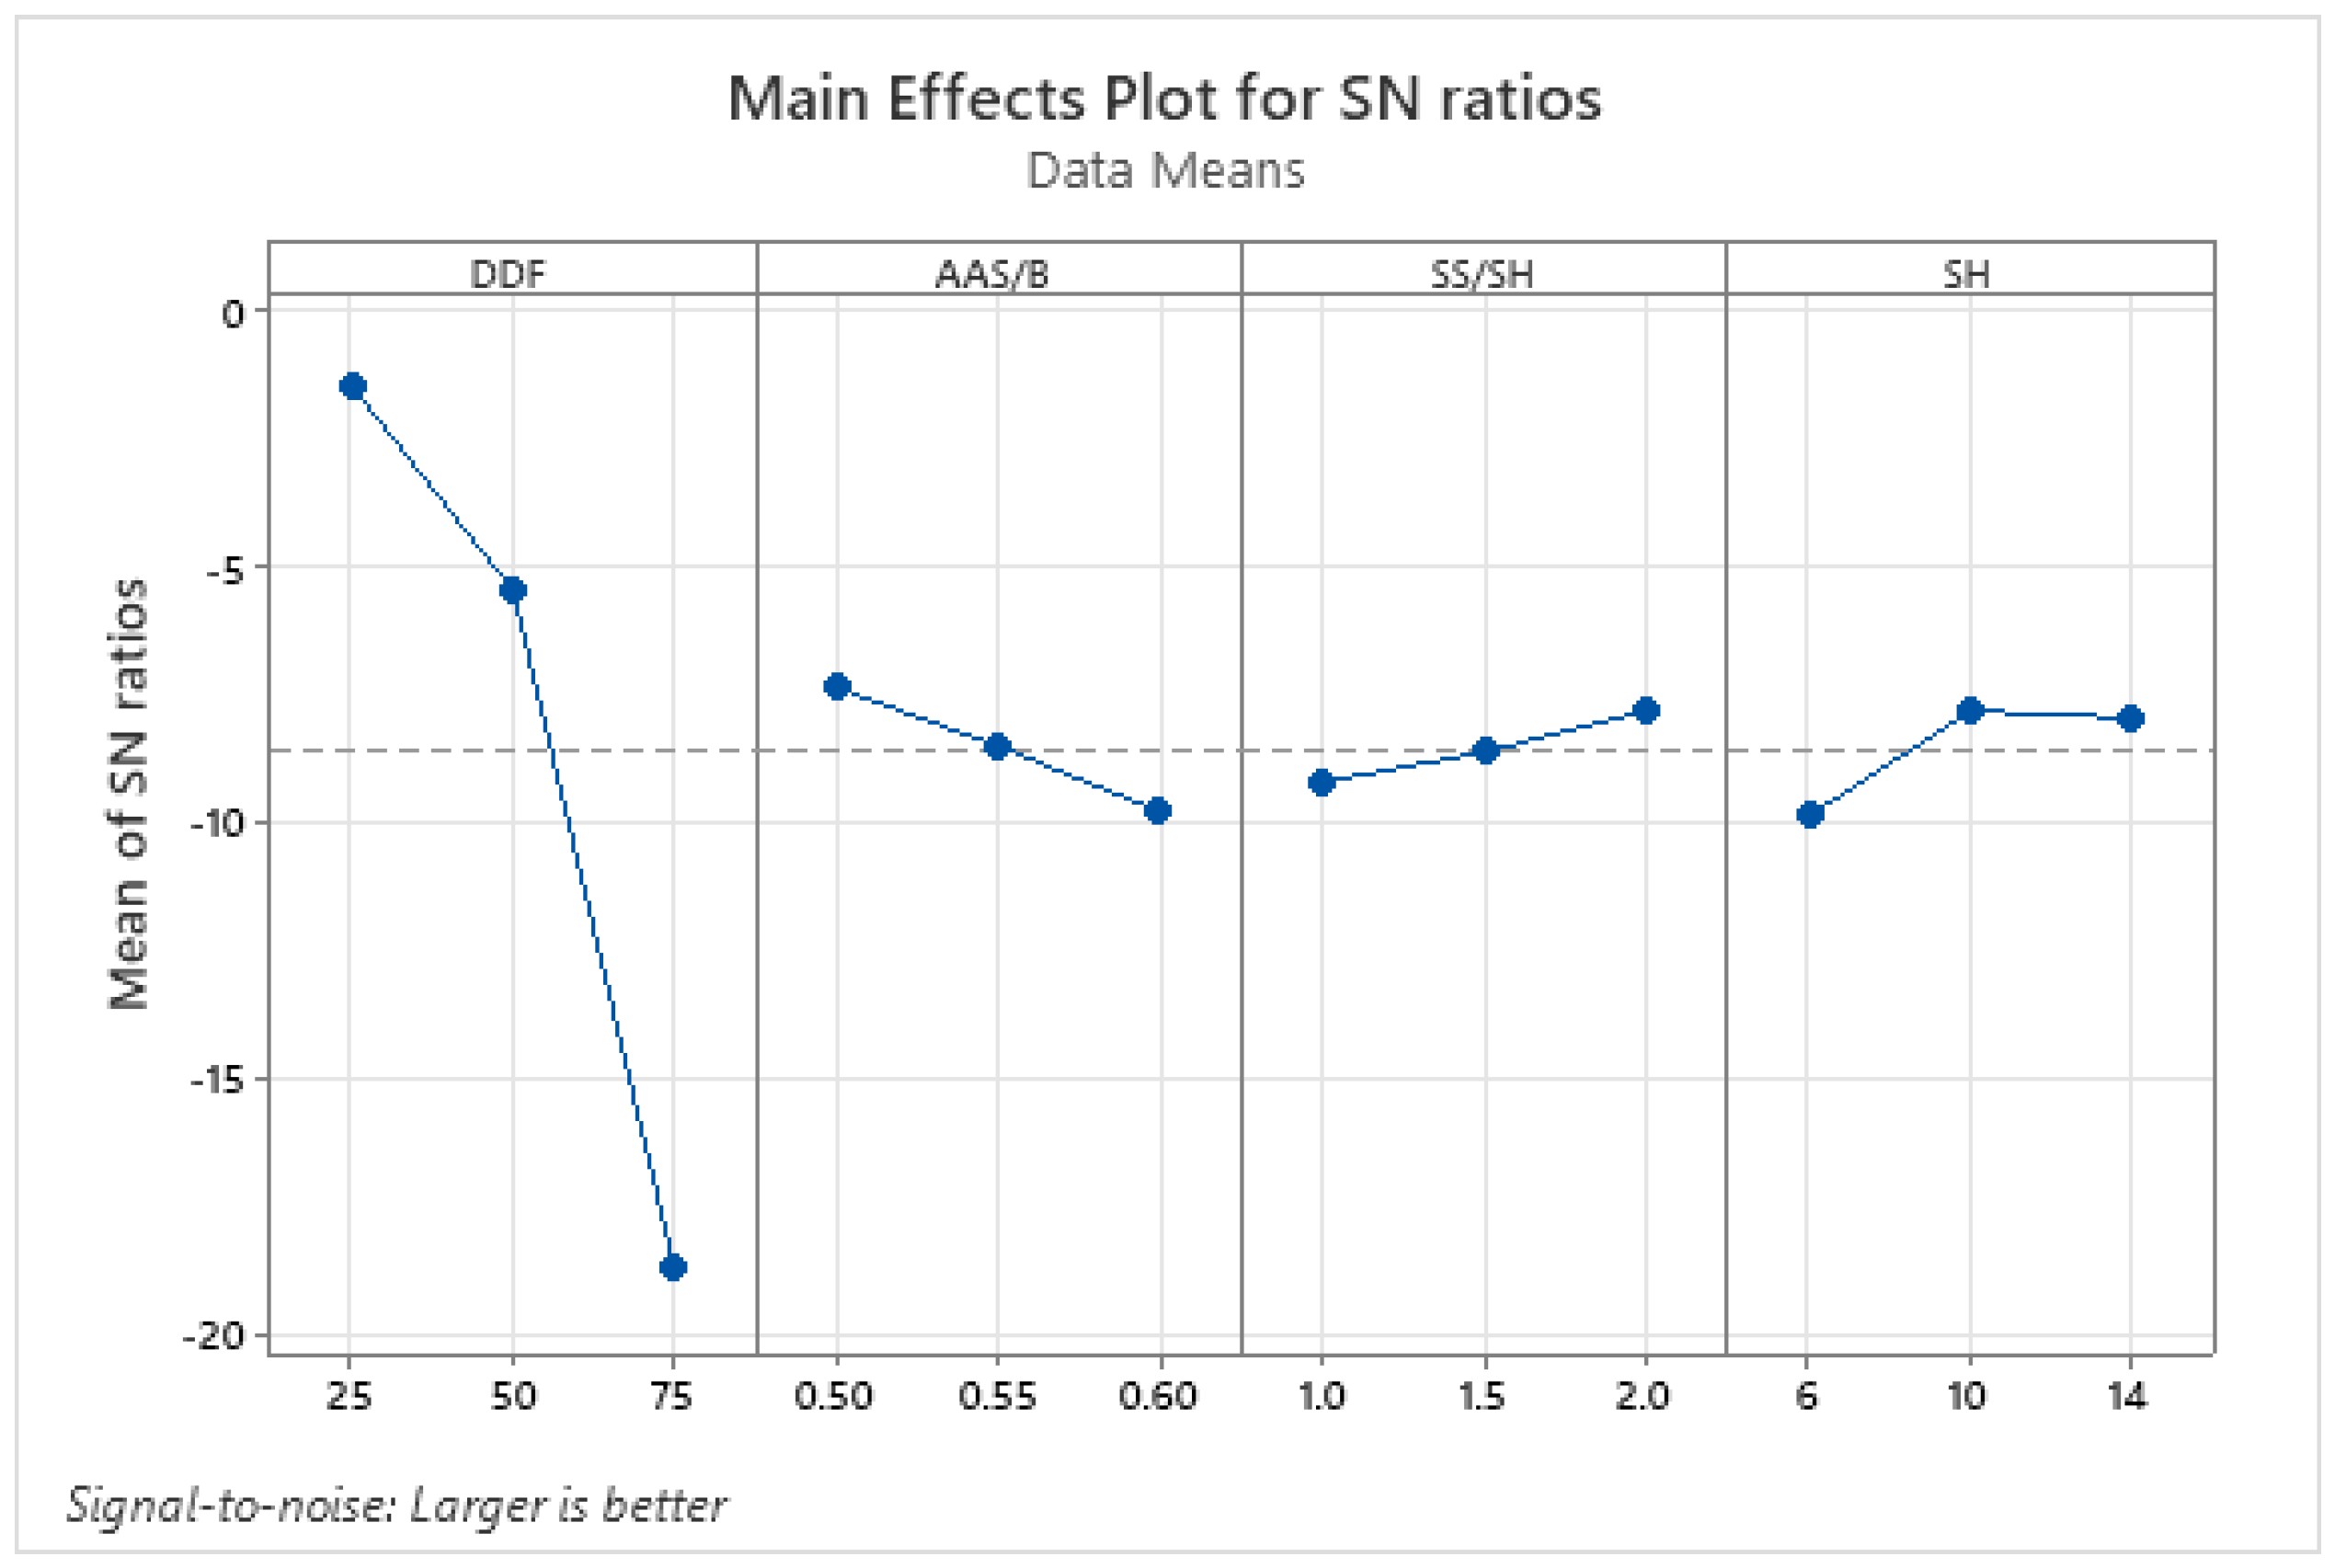
4.8. Taguchi Optimization

The optimum levels of factors for geopolymer mortar were determined based on the signal-to-noise ratio computed for the desired quality criteria. The “Larger is better” criterion was adopted to maximize flowability responses, final setting time, hardened density, and strength, while the “Smaller is better” principle was used to minimize the responses for water absorption and sorptivity, cost, and CO2 footprint. Accordingly, the optimum levels of factors for individual criterion were determined, as shown in Table 7.
Results showed that the optimum mix for the superior final setting time, cost, and CO2 footprint was made with DDF replacement of 75%, AAS/B of 0.50, SS/SH of 1.0, and SH molarity of 6 M (A3B1C1D1). Such results reflect the marked influence of high DDF content (i.e., 75%) and low AAS/B, SS/SH, and SH molarity on increasing the setting time and decreasing the cost and carbon footprint. While the flowability was optimized when the mix had a DDF replacement of 25%, AAS/B of 0.60, SS/SH of 1.0, and SH molarity of 6 M (A1B3C1D1). This finding aligns well with obtained experimental results, whereby lower DDF replacement, SS/SH, and SH molarity and higher AAS/B rendered more flowable DDF-BFS blended geopolymer mortar mixes. Conversely, the compressive strength (at all ages), water absorption, and sorptivity were optimized when the geopolymer mortar mix was made with DDF replacement of 25%, AAS/B of 0.50, SS/SH of 2.0, and SH molarity of 14 M (A1B1C2D3). Experimental test results confirm this optimization, as mixtures proportioned with 0–25% of DDF, 0.50–0.55 of AAS/B, 1.5–2.0 of SS/SH, and 10–14 M of SH solution were noted to attain the highest compressive strength responses.

4.9. TOPSIS Optimization

Optimization using the Taguchi method was restricted to optimizing one quality criteria at a time. For this reason, the TOPSIS optimization process was adopted to optimize multiple criteria simultaneously. The characteristic values of flow, final setting time, hardened density, and compressive strength at all ages were maximized through “Larger-is-better”, as given in Equation (2). Meanwhile, the water absorption, sorptivity, cost, and CO2 were minimized through “Smaller-is-better”, as given in Equation (1). The S/N values, shown in Table 8, were considered in developing the normalized decision matrix.
Different weights were assigned to the quality criteria based on technical experts in the field. The criteria were ranked from 1 to 10 based on their significance to construction applications. Table 9 summarizes the weights and normalized weights computed for the optimization process. These normalized weights were then used to find the closeness coefficient, shown in the last column of Table 10. Subsequently, the optimum mixture proportions were found by computing the S/N ratios of the closeness coefficient and the mean S/N value of the corresponding levels for each factor. The maximum S/N value represents the optimum level of each factor. As shown in Figure 11, the optimum mix requires DDF replacement of 25%, AAS/B of 0.50, SS/SH of 2.0, and SH molarity of 10 M (A1B1C3D2).

4.10. Prediction of the DDF-BFS Geopolymer Mortar Properties

A series of multivariable regression models were developed to predict the effect of DDF replacement percentage, AAS/B, SS/SH, and SH solution molarity on the properties of DDF-BFS blended geopolymer mortars, including flow, final setting time, compressive strength, water absorption, and sorptivity. The boundaries of factors varied from 0 to 100% for DDF replacement rate, 0.5 to 0.6 for AAS/B, 1.0 to 2.0 for SS/SH, and 6 to 14 M for SH solution molarity. It is worth noting that prediction equations were not developed for the cost and carbon footprint, as they could be determined by simple calculation (see Section 4.6). The generalized form of the proposed models is as per Equation (9).
Property = α0(DDF) + α1(AAS/B) + α2(SS/SH) + α3(SH) + α4
The coefficients of the developed models are summarized in Table 11. The predicted-to-actual responses exhibited accurate relationships, reflecting R2 values ranging between 0.83 and 0.98, while the root-mean-square error (RMSE) ranged from 0.32 to 48.36. It is important to note that the positive/negative signs of the coefficients reflect their positive/negative influence on the property. For instance, an increase in DDF replacement will decrease strength and flowability responses. Conversely, an increase in the SH molarity will enhance strength and resistance to water absorption. These findings are synonymous with those reported earlier in the analysis of the experimental results. Furthermore, the developed regression models could be employed in predicting the properties of the optimum mix (A1B1C3D2). Indeed, it is characterized by a flow of 204 mm, final setting time of 17.4 min, hardened density of 2021 kg/m3, 1-day f’c of 27.3 MPa, 7-day f’c of 34.7 MPa, 28-day f’c of 41.6 MPa, water absorption of 1.99%, and sorptivity of 0.85 mm/hr0.5.

5. Conclusions

This study carried out an extensive experimental program to study the effect of mix design parameters on the fresh and hardened properties, cost, and carbon footprint of DDF-BFS blended geopolymer mortars. In the process, the mix proportions were optimized for superior performance using Taguchi-based TOPSIS method. Based on the obtained results, the following conclusions can be drawn:
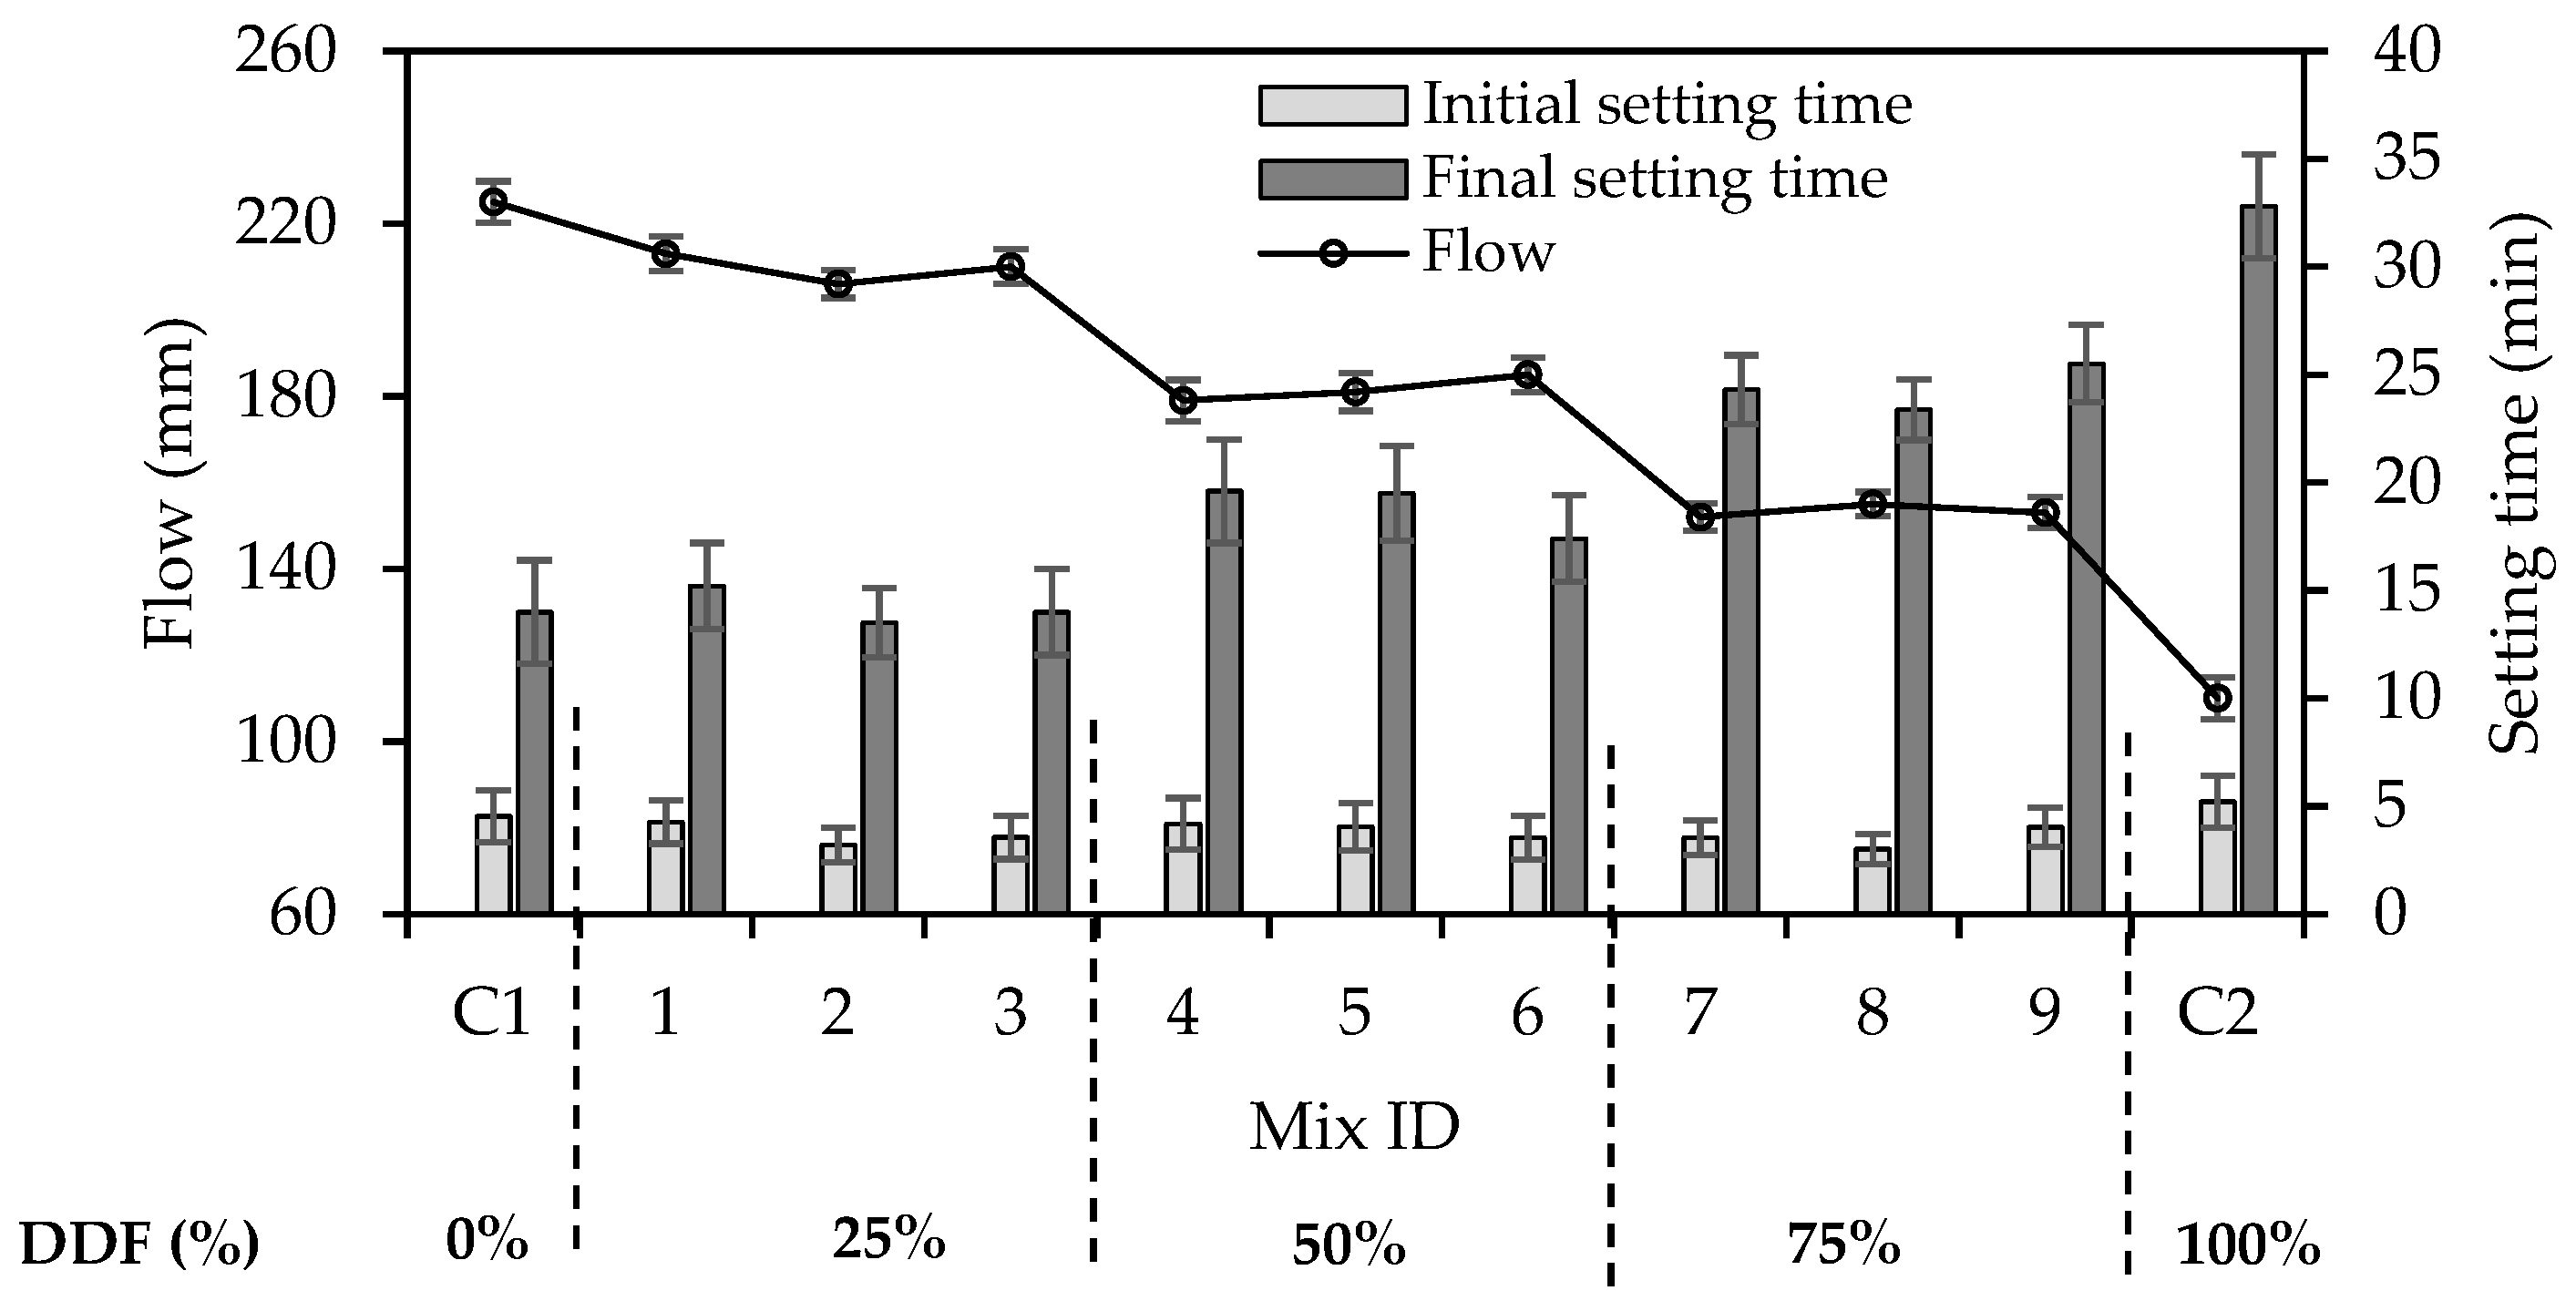
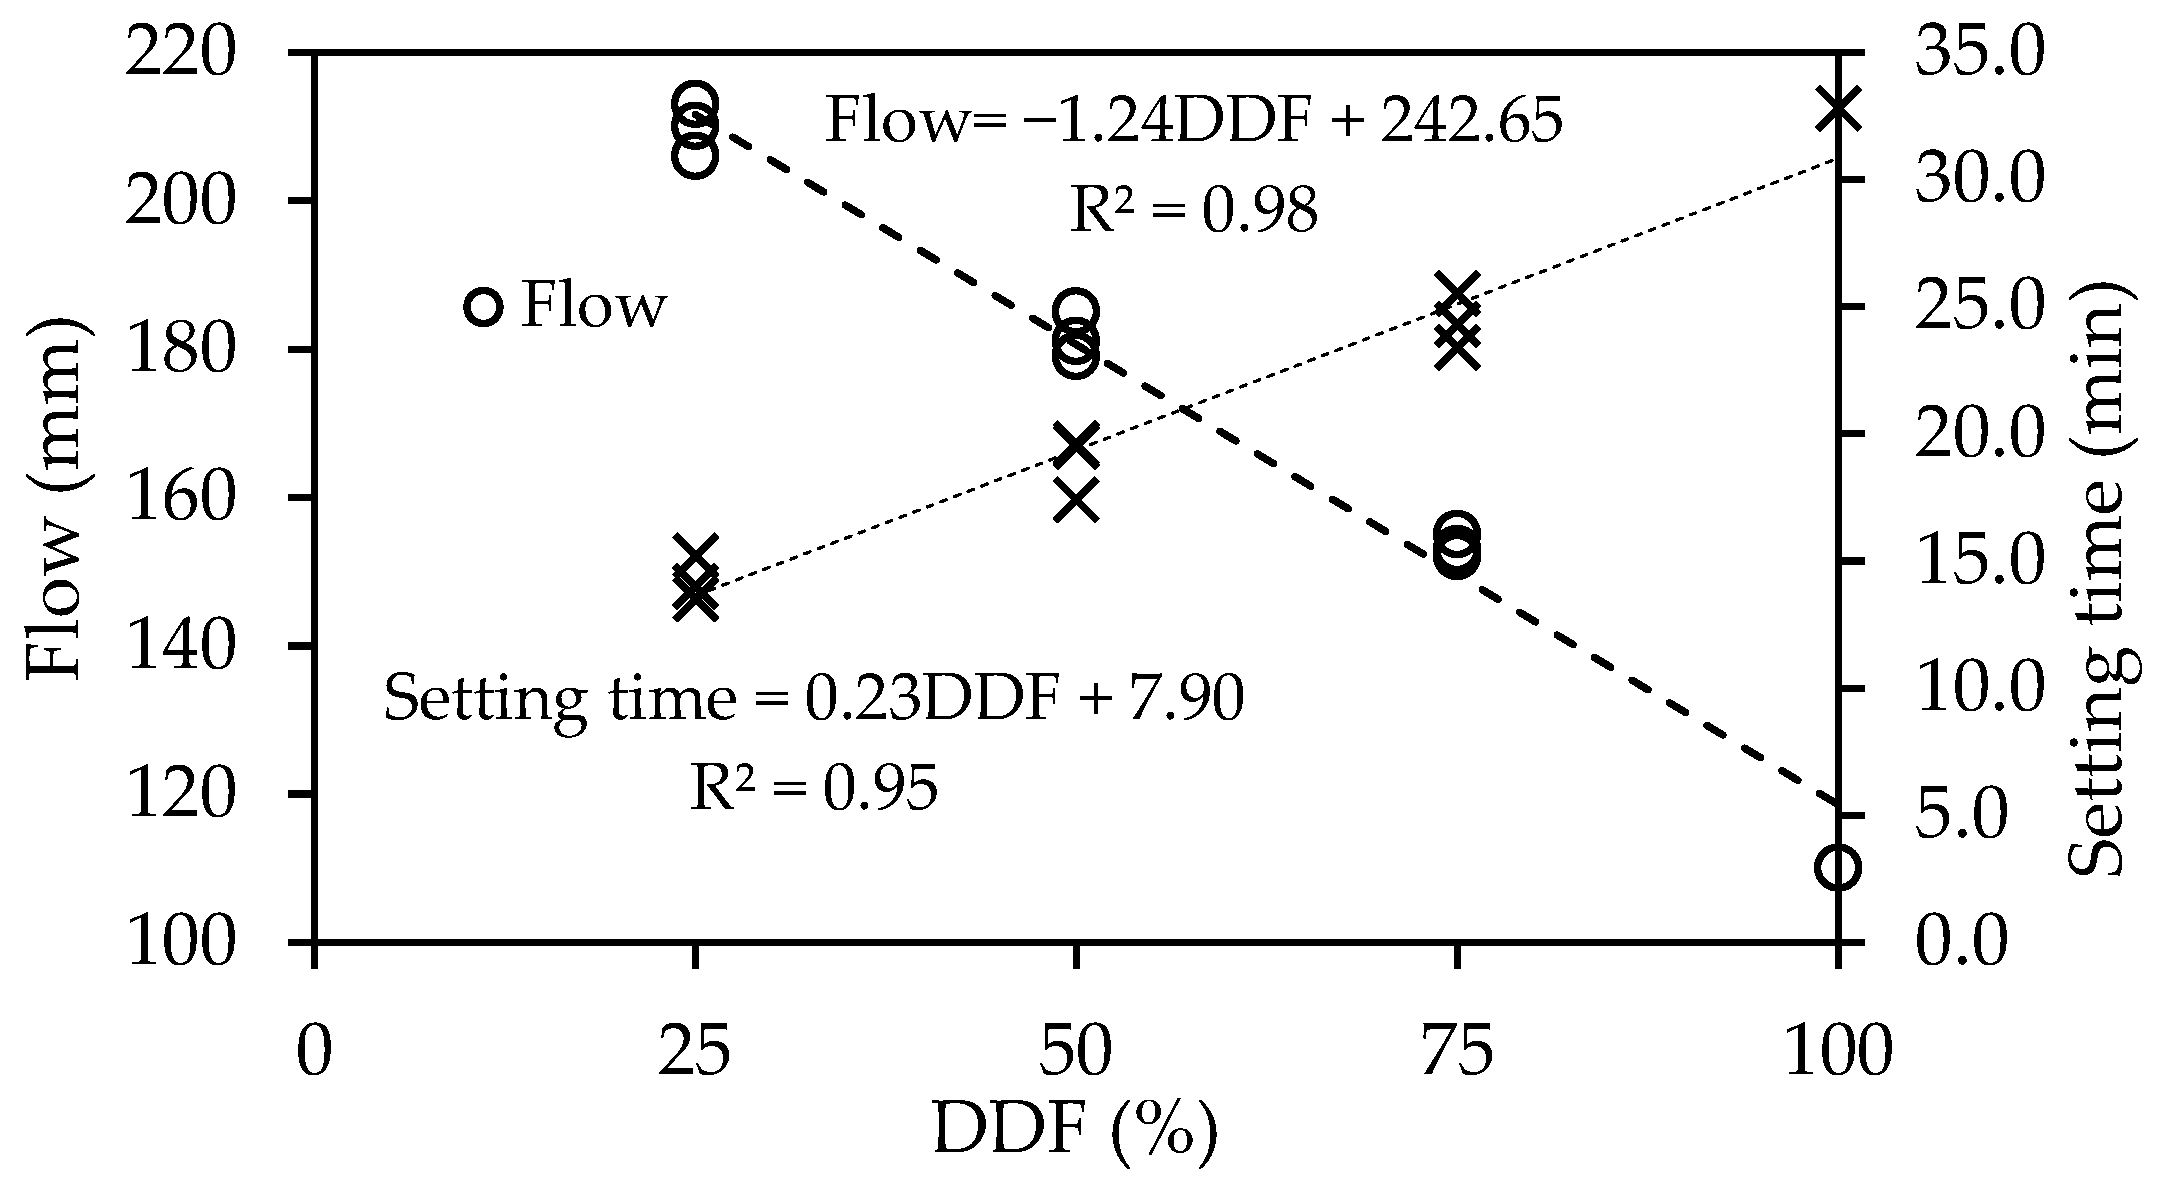
  • The replacement of BFS with DDF reduced the flowability of geopolymer mortars. A flowability of at least 153 mm could be attained with 75% DDF replacement. Reducing SS/SH and SH molarity to at most 1.5 and 10 M, respectively, increased flowability.
  • The final setting time of DDF-BFS blended geopolymer mortars increased with BFS replacement by DDF. The average final setting time increased from 14.1 min for 0% DDF to 14.2, 19.5, 24.3, and 32.8 min with 25, 50, 75, and 100% DDF replacement, respectively. Lowering SH molarity below 10 M resulted in longer setting times.
  • The fresh and hardened densities of DDF-BFS blended geopolymer mortar increased with 25% DDF replacement but decreased at higher replacement levels (50, 75, and 100%). This was attributed to the dilution of the matrix and reduced compactability of the mortar with high DDF replacement. Meanwhile, the densities were marginally affected by the AAS/B, SS/SH, and SH molarity.
  • Compressive strength followed similar trends at 1, 7, and 28 days. The replacement of BFS by 25% DDF increased the strength up to 56.5 MPa, owing to enhanced particle packing density and particle gradation. In fact, to attain a compressive strength above 40 MPa, mixtures should be proportioned with 0–25% of DDF, 0.5–0.55 of AAS/B, 1.5–2.0 of SS/SH, and 10–14 M of SH solution. Further increasing DDF replacement to 50, 75, and 100% reduced the strength to, on average, 15.6, 6.8, and 6.0 MPa, respectively. Such values are considered sufficient for specific mortar construction applications.
  • Concurrent with strength, water absorption and sorptivity were marginally affected by 25% DDF replacement. However, increasing DDF replacement from to 50, 75, and 100% led to, on average, 102, 275, and 344% higher water absorption, respectively. Sorptivity was, on average, 88, 253, and 319% higher, respectively. Other factors, i.e., AAS/B, SS/SH, and SH molarity had less significant impact on the two properties.
  • Analytical models were developed to predict the flow, final setting time, compressive strength, water absorption, and sorptivity from the DDF replacement percentage with high accuracy (R2 ≥ 0.89). It was also possible to accurately predict f’c at 1, 7, and 28 days using the hardened density (R2 ≥ 0.96).
  • The replacement of BFS with 25, 50, 75, and 100% DDF reduced the carbon footprint by 3, 5, 5, and 7%, respectively, compared to 100% BFS control mix. Similarly, replacing BFS by DDF led to a decrease in the cost (7% for every 25% DDF replacement). Increasing AAS/B, SS/SH, and SH molarity increased the cost and carbon footprint.
  • The ANOVA results highlighted that the DDF replacement had the highest contribution to the fresh and hardened properties and cost. Conversely, the main contributors to the carbon footprint were the AAS/B and SH solution molarity.
  • The optimum mixture proportions for superior fresh and hardened properties, cost, and carbon footprint were DDF replacement of 25%, AAS/B of 0.50, SS/SH of 2.0, and SH molarity of 10 M (A1B1C3D2).
  • Multivariable regression models were developed to predict the fresh and hardened properties of DDF-BFS blended geopolymer mortar using the mix design parameters. The predicted-to-actual responses exhibited accurate relationships, reflecting R2 values ranging between 0.83 and 0.98, while the RMSE ranged from 0.32 to 48.36.

Author Contributions

Conceptualization, H.E.-H. and A.E.-D.; methodology, H.E.-H. and A.A.; validation, A.E.-M., H.E.-H., and A.E.-D.; formal analysis, A.E.-M. and H.E.-H.; investigation, A.E.-M., H.E.-H., A.E.-D. and A.A.; data curation, A.E.-M. and A.A.; writing—original draft preparation, A.E.-M.; writing—review and editing, H.E.-H., A.E.-D. and A.A.; visualization, H.E.-H. and A.E.-D.; supervision, H.E.-H. and A.E.-D.; funding acquisition, H.E.-H. All authors have read and agreed to the published version of the manuscript.

Funding

This research was funded by United Arab Emirates University (UAEU), grant number 31N453 and ASPIRE UAE, grant number 21N235.

Data Availability Statement

Data may be provided by the corresponding author upon request.

Acknowledgments

The authors acknowledge the support of the UAEU staff and lab personnel.

Conflicts of Interest

The authors declare no conflict of interest.

References

  1. Tan, J.; Cai, J.; Li, X.; Pan, J.; Li, J. Development of eco-friendly geopolymers with ground mixed recycled aggregates and slag. J. Clean. Prod. 2020, 256, 120369. [Google Scholar] [CrossRef]
  2. Alzard, M.H.; El-Hassan, H.; El-Maaddawy, T. Environmental and Economic Life Cycle Assessment of Recycled Aggregates Concrete in the United Arab Emirates. Sustainability 2021, 13, 10348. [Google Scholar] [CrossRef]
  3. El-Mir, A.; Assaad, J.J.; Nehme, S.G.; El-Hassan, H. Correlating strength and durability to time-temperature profiles of high-performance mass concrete. Case Stud. Constr. Mater. 2022, 16, e01055. [Google Scholar] [CrossRef]
  4. El-Mir, A.; Nehme, S.G.; Assaad, J.J. Effect of Binder Content and Sand Type on Mechanical Characteristics of Ultra-High Performance Concrete. Arab. J. Sci. Eng. 2022, 1–14. [Google Scholar] [CrossRef]
  5. Abhilash, P.P.; Kumar, D.; Sangoju, B.; Kumar, R. Effect of nano-silica in concrete: A review. Constr. Build. Mater. 2021, 278, 122347. [Google Scholar] [CrossRef]
  6. AlArab, A.; Hamad, B.; Chehab, G.; Assaad, J.J. Use of Ceramic-Waste Powder as Value-Added Pozzolanic Material with Improved Thermal Properties. J. Mater. Civ. Eng. 2020, 32, 04020243. [Google Scholar] [CrossRef]
  7. Rashad, A.M. Effect of quartz-powder on the properties of conventional cementitious materials and geopolymers. Mater. Sci. Technol. 2018, 34, 2043–2056. [Google Scholar] [CrossRef]
  8. Panesar, D.K.; Zhang, R. Performance comparison of cement replacing materials in concrete: Limestone fillers and supplementary cementing materials—A review. Constr. Build. Mater. 2020, 251, 118866. [Google Scholar] [CrossRef]
  9. El Mir, A.; Nehme, S.G. Utilization of industrial waste perlite powder in self-compacting concrete. J. Clean. Prod. 2017, 156, 507–517. [Google Scholar] [CrossRef]
  10. Najm, O.; El-Hassan, H.; El-Dieb, A. Ladle slag characteristics and use in mortar and concrete: A comprehensive review. J. Clean. Prod. 2020, 288, 125584. [Google Scholar] [CrossRef]
  11. El-Hassan, H.; Medljy, J.; El-Maaddawy, T. Properties of Steel Fiber-Reinforced Alkali-Activated Slag Concrete Made with Recycled Concrete Aggregates and Dune Sand. Sustainability 2021, 13, 8017. [Google Scholar] [CrossRef]
  12. El-Sayed, M. Sedimentological characteristics and morphology of the aeolian sand dunes in the eastern part of the UAE, a case study from Ar Rub’ Al Khali. Sediment. Geol. 1999, 123, 219–238. [Google Scholar] [CrossRef]
  13. Saleous, N.; Issa, S.; Saeed, R. Mapping Sand Dune Fields in Abu Dhabi Emirate over the Period of 1992–2013 Using Landsat Data. In Global Changes and Natural Disaster Management: Geo-information Technologies; Springer: Berlin/Heidelberg, Germany, 2017; pp. 101–112. [Google Scholar]
  14. Luo, F.J.; He, L.; Pan, Z.; Duan, W.H.; Zhao, X.L.; Collins, F. Effect of very fine particles on workability and strength of concrete made with dune sand. Constr. Build. Mater. 2013, 47, 131–137. [Google Scholar] [CrossRef]
  15. El-Hassan, H.; Hussein, A.; Medljy, J.; El-Maaddawy, T. Performance of Steel Fiber-Reinforced Alkali-Activated Slag-Fly Ash Blended Concrete Incorporating Recycled Concrete Aggregates and Dune Sand. Buildings 2021, 11, 327. [Google Scholar] [CrossRef]
  16. Platias, S.; Vatalis, K.I.; Charalampides, G. Suitability of Quartz Sands for Different Industrial Applications. Procedia Econ. Financ. 2014, 14, 491–498. [Google Scholar] [CrossRef] [Green Version]
  17. Guettala, S.; Mezghiche, B. Compressive strength and hydration with age of cement pastes containing dune sand powder. Constr. Build. Mater. 2011, 25, 1263–1269. [Google Scholar] [CrossRef]
  18. ASTM C33/C33M-18; Standard Specification for Concrete Aggregates. ASTM International: West Conshohocken, PA, USA, 2018.
  19. Kachouh, N.; El-Hassan, H.; El Maaddawy, T. Effect of steel fibers on the performance of concrete made with recycled concrete aggregates and dune sand. Constr. Build. Mater. 2019, 213, 348–359. [Google Scholar] [CrossRef]
  20. Liu, Y.; Li, Y.; Jiang, G. Orthogonal experiment on performance of mortar made with dune sand. Constr. Build. Mater. 2020, 264, 120254. [Google Scholar] [CrossRef]
  21. Mechti, W.; Mnif, T.; Chaabouni, M.; Rouis, J. Formulation of blended cement by the combination of two pozzolans: Calcined clay and finely ground sand. Constr. Build. Mater. 2014, 50, 609–616. [Google Scholar] [CrossRef]
  22. Krobba, B.; Bouhicha, M.; Kenai, S.; Courard, L. Formulation of low cost eco-repair mortar based on dune sand and Stipa tenacissima microfibers plant. Constr. Build. Mater. 2018, 171, 950–959. [Google Scholar] [CrossRef]
  23. Rashad, A.M.; Zeedan, S.R.; Hassan, H.A. A preliminary study of autoclaved alkali-activated slag blended with quartz powder. Constr. Build. Mater. 2012, 33, 70–77. [Google Scholar] [CrossRef]
  24. Rashad, A.M.; Sadek, D.M.; Gharieb, M. Valorization of quartz powder for drying shrinkage and carbonation resistance of alkali-activated slag cement. Environ. Sci. Pollut. Res. 2022, 29, 45191–45203. [Google Scholar] [CrossRef] [PubMed]
  25. Buchwald, A.; Vicent, M.; Kriegel, R.; Kaps, C.; Monzó, M.; Barba-Juan, A. Geopolymeric binders with different fine fillers—Phase transformations at high temperatures. Appl. Clay Sci. 2009, 46, 190–195. [Google Scholar] [CrossRef]
  26. Chuah, S.; Duan, W.H.; Pan, Z.; Hunter, E.; Korayem, A.H.; Zhao, X.; Collins, F.; Sanjayan, J. The properties of fly ash based geopolymer mortars made with dune sand. Mater. Des. 2016, 92, 571–578. [Google Scholar] [CrossRef]
  27. Brahimi, A.; Meghachou, M.; Abbad, H.; Rahmouni, A.; Belbachir, M.; Zeggai, F.Z.; Khaldoun, B. Analysis of experimental data of environmental cement prepared by fly ash of eggs shell and sand dune for reduction of carbon dioxid. Data Brief 2020, 30, 105407. [Google Scholar] [CrossRef] [PubMed]
  28. Mehta, A.; Siddique, R.; Singh, B.P.; Aggoun, S.; Łagód, G.; Barnat-Hunek, D. Influence of various parameters on strength and absorption properties of fly ash based geopolymer concrete designed by Taguchi method. Constr. Build. Mater. 2017, 150, 817–824. [Google Scholar] [CrossRef]
  29. Nasir, M.; Johari, M.A.M.; Adesina, A.; Maslehuddin, M.; Yusuf, M.O.; Mijarsh, M.; Ibrahim, M.; Najamuddin, S.K. Evolution of room-cured alkali-activated silicomanganese fume-based green mortar designed using Taguchi method. Constr. Build. Mater. 2021, 307, 124970. [Google Scholar] [CrossRef]
  30. Fantous, T.; Yahia, A. Effect of viscosity and shear regime on stability of the air-void system in self-consolidating concrete using Taguchi method. Cem. Concr. Compos. 2020, 112, 103653. [Google Scholar] [CrossRef]
  31. Xu, W.; Jalal, M.; Wang, L. Mechanical and Rheological Properties of Glass Fiber-Reinforced Flowable Mortar (GFRFM): Optimization Using Taguchi Method. KSCE J. Civ. Eng. 2021, 26, 310–324. [Google Scholar] [CrossRef]
  32. Korucu, H.; Şimşek, B.; Yartaşı, A. A TOPSIS-Based Taguchi Design to Investigate Optimum Mixture Proportions of Graphene Oxide Powder Synthesized by Hummers Method. Arab. J. Sci. Eng. 2018, 43, 6033–6055. [Google Scholar] [CrossRef]
  33. Rashid, K.; Rehman, M.U.; de Brito, J.; Ghafoor, H. Multi-criteria optimization of recycled aggregate concrete mixes. J. Clean. Prod. 2020, 276, 124316. [Google Scholar] [CrossRef]
  34. Najm, O.; El-Hassan, H.; El-Dieb, A. Optimization of alkali-activated ladle slag composites mix design using taguchi-based TOPSIS method. Constr. Build. Mater. 2022, 327, 126946. [Google Scholar] [CrossRef]
  35. Şimşek, B.; Pakdil, F.; Iç, Y.T.; Güvenç, A.B. Building a Graphical User Interface for Concrete Production Processes: A Combined Application of Statistical Process Control and Design of Experiment. Arab. J. Sci. Eng. 2018, 44, 4373–4393. [Google Scholar] [CrossRef]
  36. El-Hassan, H.; Ismail, N. Effect of process parameters on the performance of fly ash/GGBS blended geopolymer composites. J. Sustain. Cem. Mater. 2017, 7, 122–140. [Google Scholar] [CrossRef]
  37. El-Hassan, H.; Shehab, E.; Al-Sallamin, A. Effect of curing regime on the performance and microstructure characteristics of alkali-activated slag-fly ash blended concrete. J. Sustain. Cem. Mater. 2021, 10, 289–317. [Google Scholar] [CrossRef]
  38. ASTM C230/C230M-03; Standard Specification for Flow Table for Use in Tests of Hydraulic Cement. ASTM International: West Conshohocken, PA, USA, 2003.
  39. ASTM C138/C 138M-01; Standard Test Method for Density (Unit Weight), Yield, and Air Content (Gravimetric) of Concrete. ASTM International: West Conshohocken, PA, USA, 2004.
  40. ASTM C191-04; Standard Test Method for Time of Setting of Hydraulic Cement by Vicat Needle. ASTM International: West Conshohocken, PA, USA, 2001.
  41. ASTM C109/C109M-02; Standard Test Method for Compressive Strength of Hydraulic Cement Mortars (Using 2-in. or [50 Mm] Cube Specimens). ASTM International: West Conshohocken, PA, USA, 2002.
  42. ASTM C 642-02; Standard Test Method for Density, Absorption, and Voids in Hardened Concrete. ASTM International: West Conshohocken, PA, USA, 2002.
  43. ASTM C1585-13; Standard Test Method for Measurement of Rate of Absorption of Water by Hydraulic Cement Concretes. ASTM International: West Conshohocken, PA, USA, 2013.
  44. Davis, R.; John, P. Application of Taguchi-Based Design of Experiments for Industrial Chemical Processes. In Statistical Approaches with Emphasis on Design of Experiments Applied to Chemical Processes; IntechOpen: London, UK, 2018. [Google Scholar]
  45. Rashad, A.M. An exploratory study on alkali-activated slag blended with quartz powder under the effect of thermal cyclic loads and thermal shock cycles. Constr. Build. Mater. 2014, 70, 165–174. [Google Scholar] [CrossRef]
  46. Naas, A.; Taha-Hocine, D.; Salim, G.; Michèle, Q. Combined effect of powdered dune sand and steam-curing using solar energy on concrete characteristics. Constr. Build. Mater. 2022, 322, 126474. [Google Scholar] [CrossRef]
  47. Saba, M.; Assaad, J.J. Effect of recycled fine aggregates on performance of geopolymer masonry mortars. Constr. Build. Mater. 2021, 279, 122461. [Google Scholar] [CrossRef]
  48. Benabed, B.; Azzouz, L.; Kadri, E.-H.; Kenai, S.; Belaidi, A.S.E. Effect of fine aggregate replacement with desert dune sand on fresh properties and strength of self-compacting mortars. J. Adhes. Sci. Technol. 2014, 28, 2182–2195. [Google Scholar] [CrossRef]
  49. Khatib, J.M. Properties of concrete incorporating fine recycled aggregate. Cem. Concr. Res. 2005, 35, 763–769. [Google Scholar] [CrossRef]
  50. Assaad, J.J.; Vachon, M. Valorizing the use of recycled fine aggregates in masonry cement production. Constr. Build. Mater. 2021, 310, 125263. [Google Scholar] [CrossRef]
  51. Hwalla, J.; Saba, M.; Assaad, J.J. Suitability of metakaolin-based geopolymers for underwater applications. Mater. Struct. 2020, 53, 119. [Google Scholar] [CrossRef]
  52. Rahhal, V.; Bonavetti, V.; Trusilewicz, L.; Pedrajas, C.; Talero, R. Role of the filler on Portland cement hydration at early ages. Constr. Build. Mater. 2012, 27, 82–90. [Google Scholar] [CrossRef]
  53. Rafeet, A.; Vinai, R.; Soutsos, M.; Sha, W. Guidelines for mix proportioning of fly ash/GGBS based alkali activated concretes. Constr. Build. Mater. 2017, 147, 130–142. [Google Scholar] [CrossRef] [Green Version]
  54. Kaplan, G.; Öz, A.; Bayrak, B.; Alcan, H.G.; Çelebi, O.; Aydın, A.C. Effect of quartz powder on mid-strength fly ash geopolymers at short curing time and low curing temperature. Constr. Build. Mater. 2022, 329, 127153. [Google Scholar] [CrossRef]
  55. Manikandan, P.; Vasugi, V. Potential utilization of waste glass powder as a precursor material in synthesizing ecofriendly ternary blended geopolymer matrix. J. Clean. Prod. 2022, 355, 131860. [Google Scholar] [CrossRef]
  56. Hu, W.; Ma, Y.; Koehler, M.; Gong, H.; Huang, B. Mix design optimization and early strength prediction of unary and binary geopolymer from multiple waste streams. J. Hazard. Mater. 2020, 403, 123632. [Google Scholar] [CrossRef]
  57. Fang, G.; Ho, W.K.; Tu, W.; Zhang, M. Workability and mechanical properties of alkali-activated fly ash-slag concrete cured at ambient temperature. Constr. Build. Mater. 2018, 172, 476–487. [Google Scholar] [CrossRef]
  58. El-Hassan, H.; Elkholy, S. Enhancing the performance of Alkali-Activated Slag-Fly ash blended concrete through hybrid steel fiber reinforcement. Constr. Build. Mater. 2021, 311, 125313. [Google Scholar] [CrossRef]
  59. BS EN 413-1:2011; Masonry Cement Part 1: Composition, Specifications and Conformity Criteria. BSI Standards Publication: Cyprus, Czech Republic, 2011.
  60. Lin, T.S.; Jia, D.C.; He, P.G.; Wang, M.R. Thermo-mechanical and Microstructural Characterization of Geopolymers with α-Al2O3 Particle Filler. Int. J. Thermophys. 2009, 30, 1568–1577. [Google Scholar] [CrossRef]
  61. Kovářík, T.; Rieger, D.; Kadlec, J.; Křenek, T.; Kullová, L.; Pola, M.; Bělský, P.; Franče, P.; Říha, J. Thermomechanical properties of particle-reinforced geopolymer composite with various aggregate gradation of fine ceramic filler. Constr. Build. Mater. 2017, 143, 599–606. [Google Scholar] [CrossRef]
  62. Myers, J.L.; Well, A.D.; Lorch, R.F. Research Design and Statistical Analysis, 3rd ed.; Routledge: New York, NY, USA, 2010. [Google Scholar]
  63. Najm, O.; El-Hassan, H.; El-Dieb, A. Design of Alkali-Activated Ladle Slag Mortar Using Taguchi Method. In Proceedings of the 7th World Congress on Civil, Structural, and Environmental Engineering (CSEE’22), Virtual Conference, 10–12 April 2022. [Google Scholar] [CrossRef]
  64. El Mir, A.; Nehme, S.G. Application of Chloride Induced Corrosion Model for Self-Compacting Concrete Based on Experimental Data. In Proceedings of the 11th fib International PhD symposium in Civil Engineering, Tokyo, Japan, 29–31 August 2016. [Google Scholar]
Figure 1. Particle size distribution of dune sand (0% DDF), 100% DDF, and different combinations of dune sand and DDF.
Sustainability 14 07845 g001
Figure 2. Flow chart for preparing geopolymer mortars.
Sustainability 14 07845 g002
Figure 3. Effect of DDF replacement rate on the flowability and setting times of geopolymer mortars.
Sustainability 14 07845 g003
Figure 4. Relationship between the DDF replacement rate and each of flow and final setting time.
Sustainability 14 07845 g004
Figure 5. Effect of DDF replacement rate on strength development of geopolymer mortar.
Sustainability 14 07845 g005
Figure 6. Two-dimensional contour plot of mixture proportions against 28-day compressive strength.
Sustainability 14 07845 g006
Figure 7. Relationships between (a) compressive strength with respect to DDF replacement rate and (b) the hardened density at various ages.
Sustainability 14 07845 g007
Figure 8. Effect of DDF replacement rate on water absorption and sorptivity of DDF-BFS blended geopolymer mortar.
Sustainability 14 07845 g008
Figure 9. Relationships between water absorption/sorptivity and (a) DDF replacement rate and (b) compressive strength.
Sustainability 14 07845 g009
Figure 10. Cost and CO2 footprint of geopolymer mortar mixes.
Sustainability 14 07845 g010
Figure 11. Effect of control factors on the average S/N ratio of TOPSIS.
Sustainability 14 07845 g011
Table 1. Chemical and physical characteristics of BFS and DDF.
ComponentBFS (%)DDF (%)
SiO235.464.9
CaO42.114.1
Al2O310.63.0
Fe2O30.40.7
MgO8.11.3
SO30.3-
LOI3.1-
Physical characteristics
Specific gravity2.502.70
Specific surface area, cm2/g42501820
Table 2. Experimental matrix of geopolymer mortar mixes.
Mix IDDDF (%)AAS/BSS/SHSH (M)
1250.501.06
2250.551.510
3250.602.014
4500.501.514
5500.552.06
6500.601.010
7750.502.010
8750.551.014
9750.601.56
Table 3. Mixture proportions of geopolymer mortar mixes (in kg/m3).
Mix IDBFSDDFDune SandSSSHSP
1468.7156.31210.7156.3156.312.5
2468.7156.31144.3206.3137.512.5
3468.7156.31076.5250.0125.012.5
4312.5312.51224.8187.5125.012.5
5312.5312.51156.6229.2114.612.5
6312.5312.51071.4187.5187.512.5
7156.3468.71236.7208.3104.212.5
8156.3468.71152.5171.9171.912.5
9156.3468.71086.7225.0150.012.5
C1625.00.01213.7208.3104.212.5
C20.0625.01244.3208.3104.212.5
Table 4. Cost and CO2 footprint of used materials for geopolymer mortar.
MaterialsCost ($/ton)CO2 Footprint (kg/kg of Material)
BFS760.0416
DDF5-
Dune Sand5-
SH Solid5441.9150
Water20.0126
SS Liquid2721.0000
SP19271.8800
Table 5. Fresh and hardened densities of DDF-BFS blended geopolymer mortars.
Mix IDFresh Density (kg/m3)Hardened Density (kg/m3)
12220 ± 1112010 ± 111
22240 ± 1082070 ± 125
32232 ± 1052056 ± 120
42224 ± 1341944 ± 102
52224 ± 1161888 ± 91
62128 ± 1071896 ± 95
72168 ± 1021868 ± 85
82168 ± 971862 ± 82
91900 ± 731800 ± 80
C12250 ± 1102065 ± 124
C21810 ± 651680 ± 62
Table 6. Contribution of factors towards the flow, final setting time, compressive strength, permeability, cost, and CO2(ft).
PropertiesFactors Contribution (%)
DDF%AAS/BSS/SHSH Molarity
Flow99.000.130.810.06
Final setting time95.561.210.322.91
Hardened density90.151.750.547.55
1-d f’c97.360.541.120.98
7-d f’c96.861.261.210.67
28-d f’c96.810.991.220.97
Water absorption95.381.050.942.63
Sorptivity92.331.442.124.10
Cost51.2521.112.7624.88
CO2(ft)0.9446.228.4444.40
Table 7. Signal-to-noise ratios for factors and levels of each quality criteria.
Quality
Criteria
Factors and LevelsOptimum
ABCD
123123123123
Flow46.4345.1843.7145.0945.0845.1645.2445.0145.0845.1445.0945.10A1B3C1D1
Final setting
time
23.0625.4927.7425.7325.2625.2925.5325.2725.4825.8625.0425.38A3B1C1D1
Hardened
density
66.2165.6265.3165.7665.7565.6465.6765.8365.7465.5665.7765.81A1B1C3D3
1-d f’c29.4620.256.5519.8919.5317.8417.7620.1418.3617.7618.4820.03A1B1C2D3
7-d f’c31.3921.3913.7223.9022.9821.0121.3823.2821.8421.3522.3622.79A1B1C2D3
28-d f’c33.5923.6716.6526.2825.9623.6623.7625.6624.4823.7324.7425.43A1B1C2D3
Water
absorption
−5.64−10.14−15.54−10.13−10.14−11.04−10.99−10.05−10.28−11.39−10.00−9.93A1B1C2D3
Sorptivity1.89−1.41−6.91−1.72−1.81−2.78−2.88−1.56−1.99−3.22−1.50−1.22A1B1C2D3
Cost−43.18−42.57−41.38−42.06−42.61−42.91−42.37−42.53−42.68−42.05−42.54−42.98A3B1C1D1
CO2−50.21−50.19−50.02−49.36−50.27−50.79−49.81−50.18−50.43−49.41−50.19−50.82A3B1C1D1
Table 8. Decision matrix of S/N for Q1-Q10 criteria responses.
Mix
ID
Quality Criteria
Q1Q2Q3Q4Q5Q6Q7Q8Q9Q10
146.5723.6466.0627.6030.5332.46−6.850.30−42.07−48.37
246.2822.6166.3231.3533.1035.04−4.513.53−43.29−50.43
346.4422.9266.2629.4330.5333.26−5.581.83−44.17−51.82
445.0625.8565.7723.0523.8626.14−8.94−0.17−42.56−50.13
545.1525.8065.5219.6520.6722.95−10.63−1.92−42.33−49.87
645.3424.8165.5618.0619.6521.92−10.86−2.13−42.81−50.56
743.6427.7165.436.0214.3217.24−14.65−5.89−41.54−49.58
843.8127.3765.407.6013.9816.90−15.27−6.81−42.22−50.51
943.6928.1365.116.0212.8715.79−16.69−8.03−41.75−49.97
Table 9. Normalized weights for the design of the optimum mixes.
Performance CriteriaS/N Target ValueSymbolWeightsNormalized Weights
FlowLarger is betterQ170.113
Final setting timeLarger is betterQ280.129
Hardened densityLarger is betterQ320.032
1-d f’cLarger is betterQ480.129
7-d f’cLarger is betterQ530.048
28-d f’cLarger is betterQ6100.161
Water absorptionSmaller is betterQ750.081
SorptivitySmaller is betterQ850.081
CostSmaller is betterQ970.113
CO2Smaller is betterQ1070.113
Table 10. Closeness coefficient of the geopolymer mixes.
MixQ1Q2Q3Q4Q5Q6Q7Q8Q9Q10Si+Si−Ci*
10.0390.0400.0110.0560.0210.068−0.0160.002−0.037−0.0360.0240.0810.77
20.0390.0380.0110.0640.0230.074−0.0110.022−0.038−0.0380.0100.1020.914
30.0390.0390.0110.0600.0210.070−0.0130.011−0.039−0.0390.0150.0910.854
40.0380.0440.0110.0470.0160.055−0.021−0.001−0.038−0.0380.0370.0670.647
50.0380.0440.0110.0400.0140.048−0.025−0.012−0.037−0.0370.0520.0520.501
60.0380.0420.0110.0370.0140.046−0.026−0.013−0.038−0.0380.0550.0480.465
70.0360.0470.0110.0120.0100.036−0.035−0.036−0.037−0.0370.0910.0170.158
80.0370.0460.0110.0160.0100.035−0.037−0.042−0.037−0.0380.0940.0120.116
90.0360.0470.0110.0120.0090.033−0.040−0.050−0.037−0.0380.1020.0100.086
Table 11. Regression models for predicting the properties of DDF-BFS geopolymer mortar.
Propertiesα0
(DDF)
α1
(AAS/B)
α2
(SS/SH)
α3
(SH Solution)
α4
(Intercept)
RMSER2
Flow−1.14058.820−3.330−0.693216.6205.830.98
Final setting time0.171−30.0520.6100.14925.4633.020.83
Hardened density−3.920114.86014.9002.4502007.47048.360.90
1-d f’c−0.436−11.8102.2660.56433.9006.450.87
7-d f’c−0.534−45.2700.4660.50764.7308.150.86
28-d f’c−0.619−26.8351.9400.59060.74010.740.83
Water absorption0.0661.645−0.263−0.0250.2890.860.89
Sorptivity0.0230.567−0.135−0.0010.2690.320.88
Publisher’s Note: MDPI stays neutral with regard to jurisdictional claims in published maps and institutional affiliations.

