
Integrated Approach to Explore Multidimensional Urban Morphology of Informal Settlements: The Case Studies of Lahore, Pakistan


Abstract
:1. Introduction
2. Informal Settlements
3. Literature Review
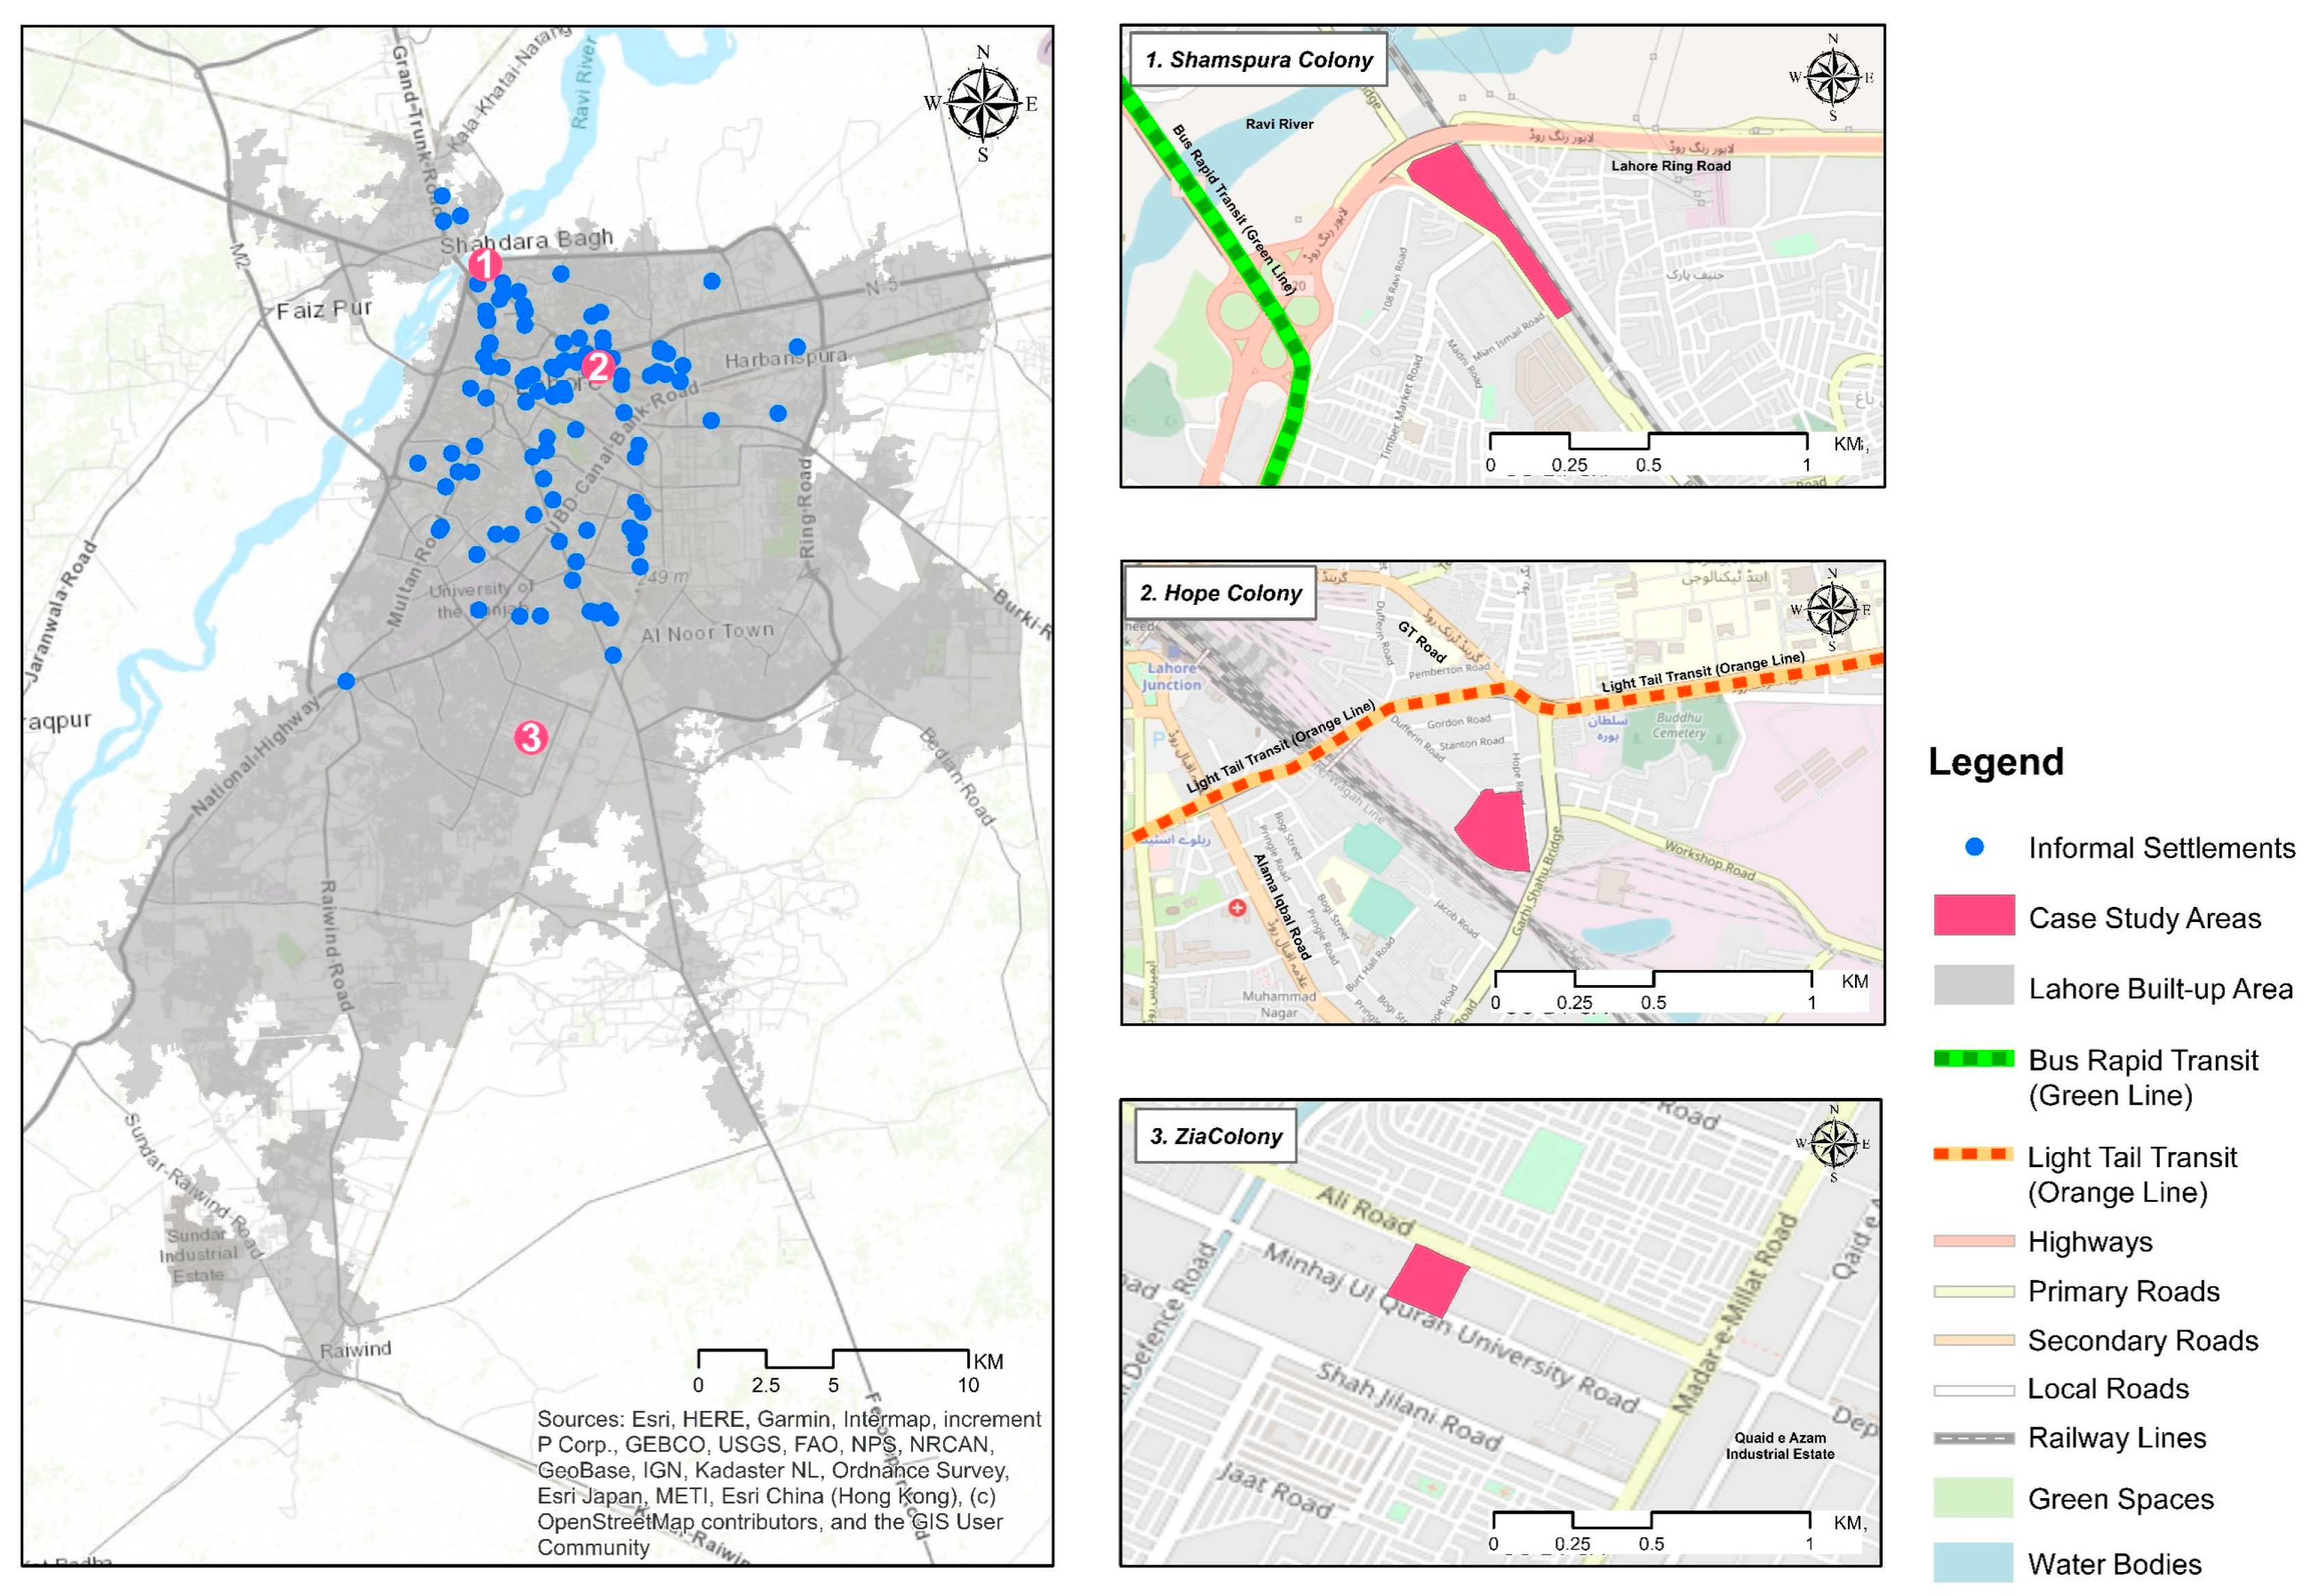
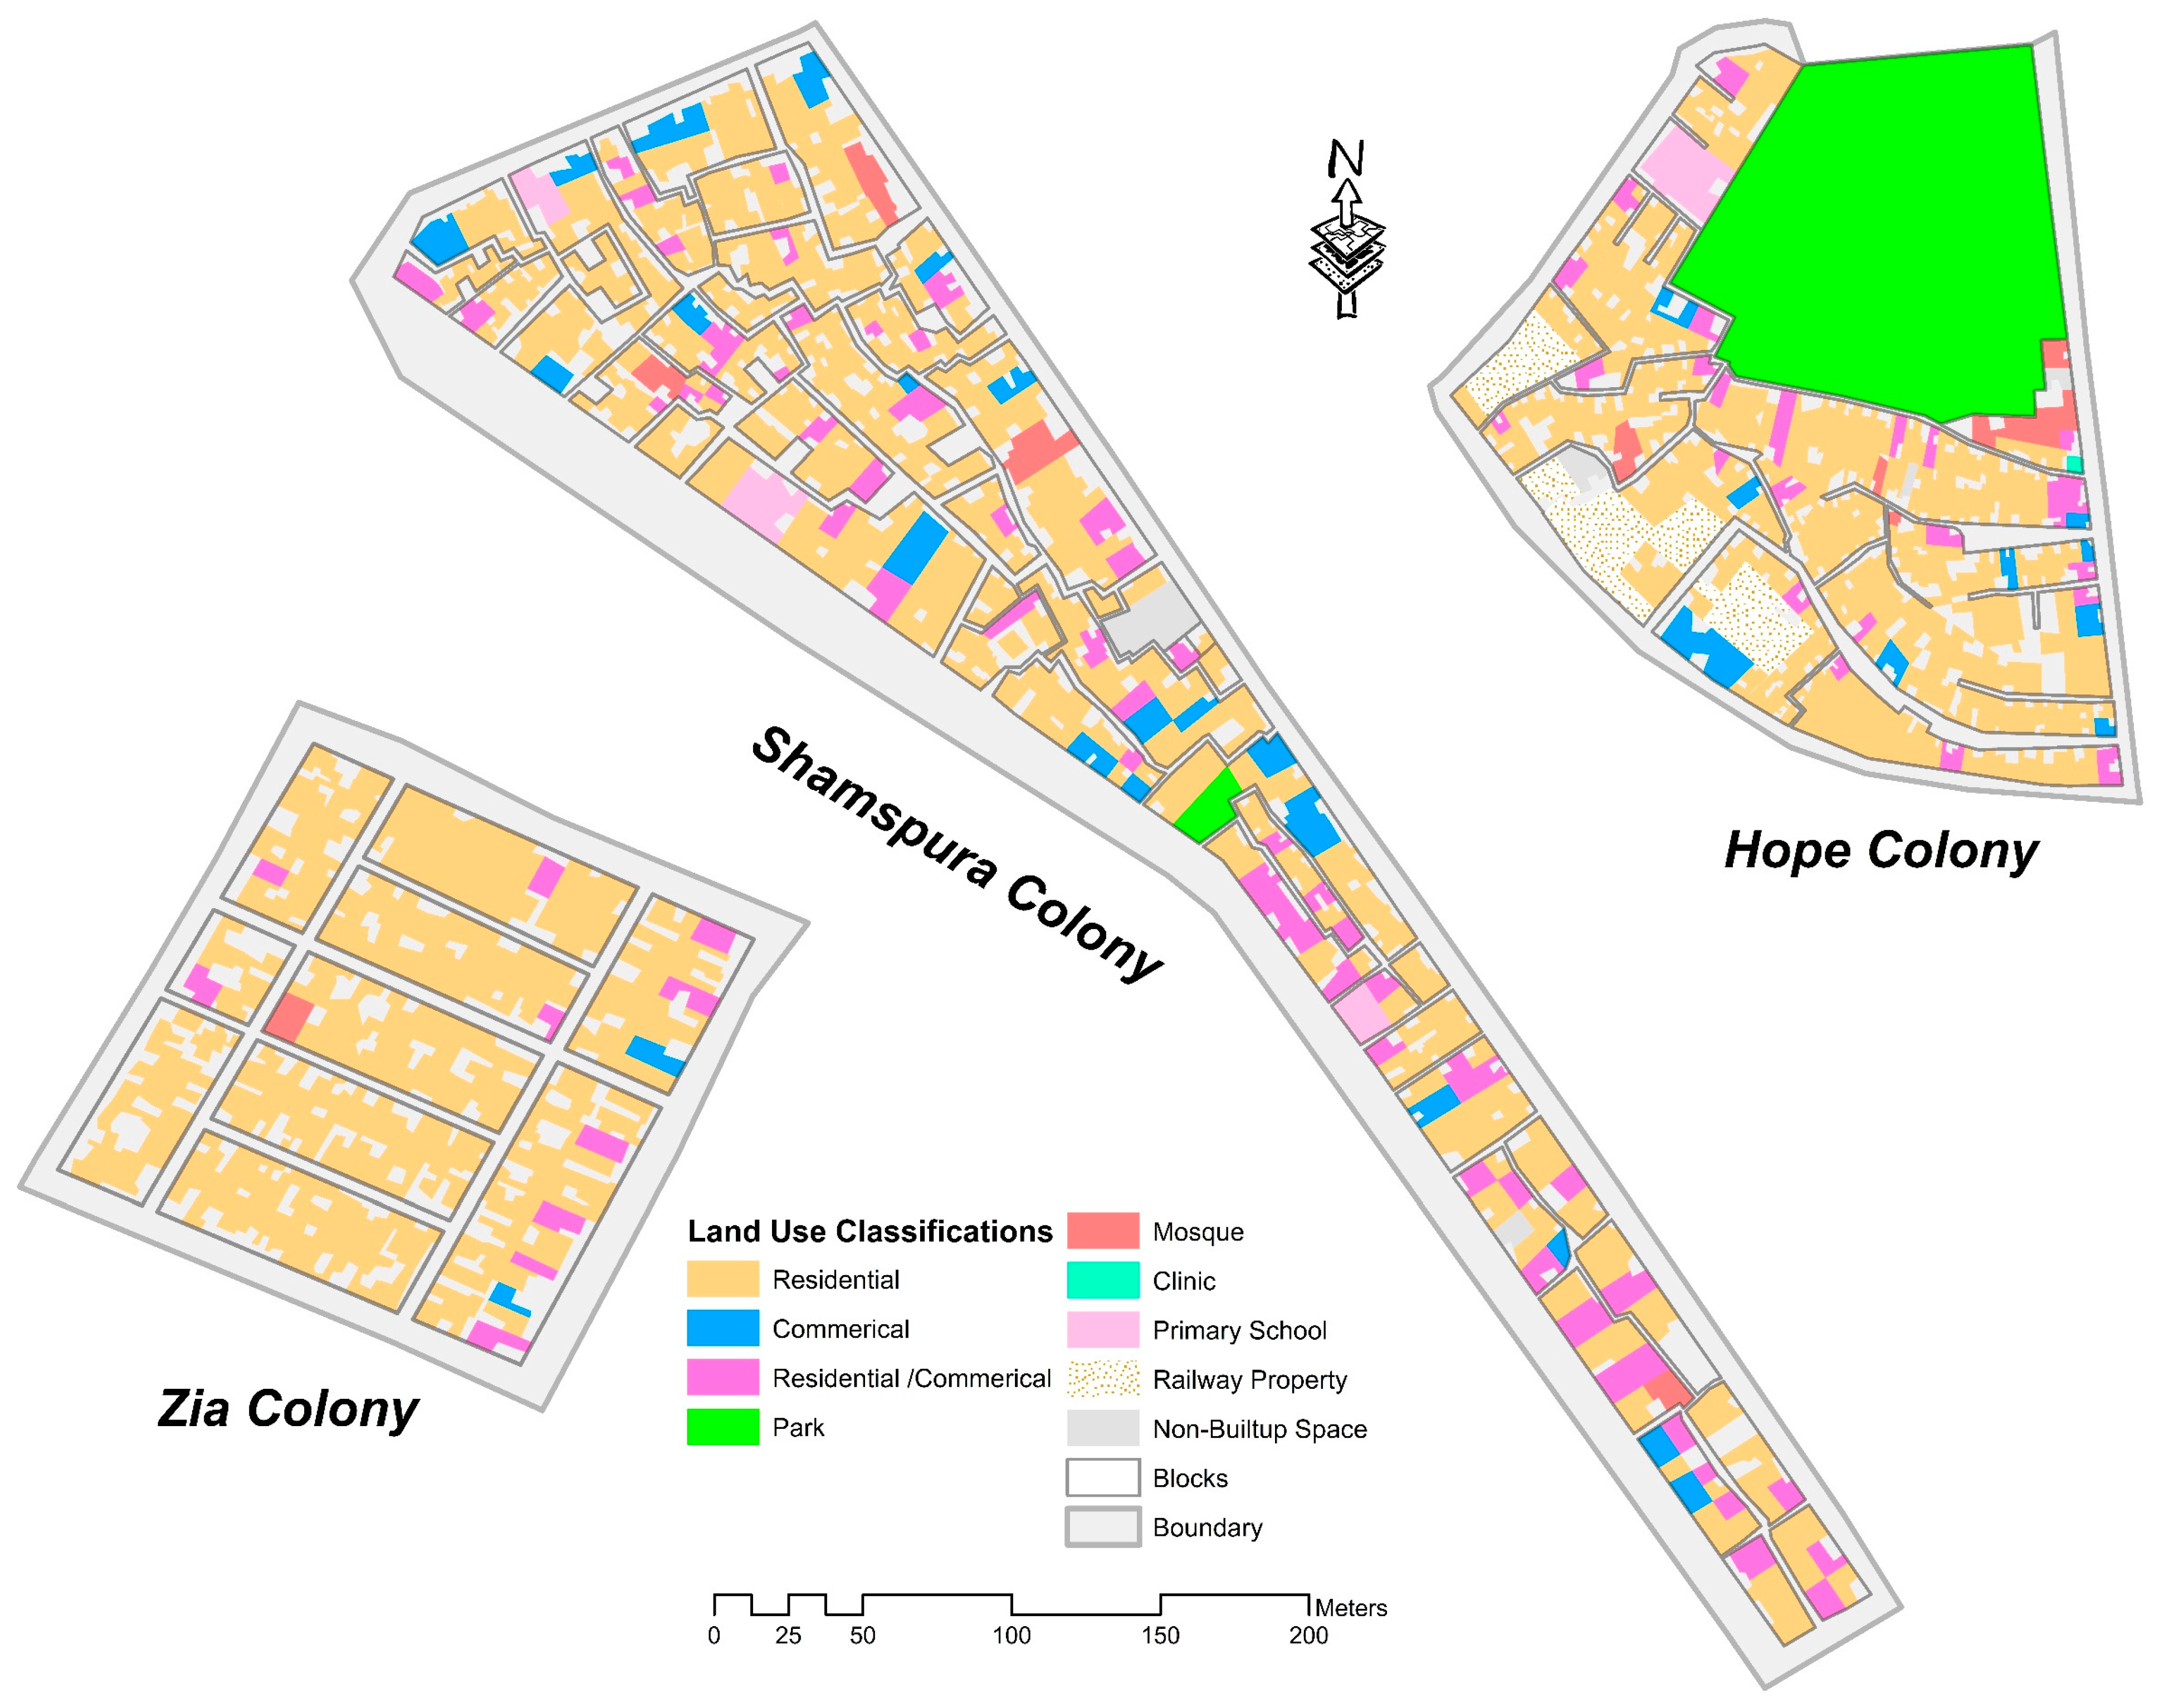
4. Case Studies
5. Materials and Methods
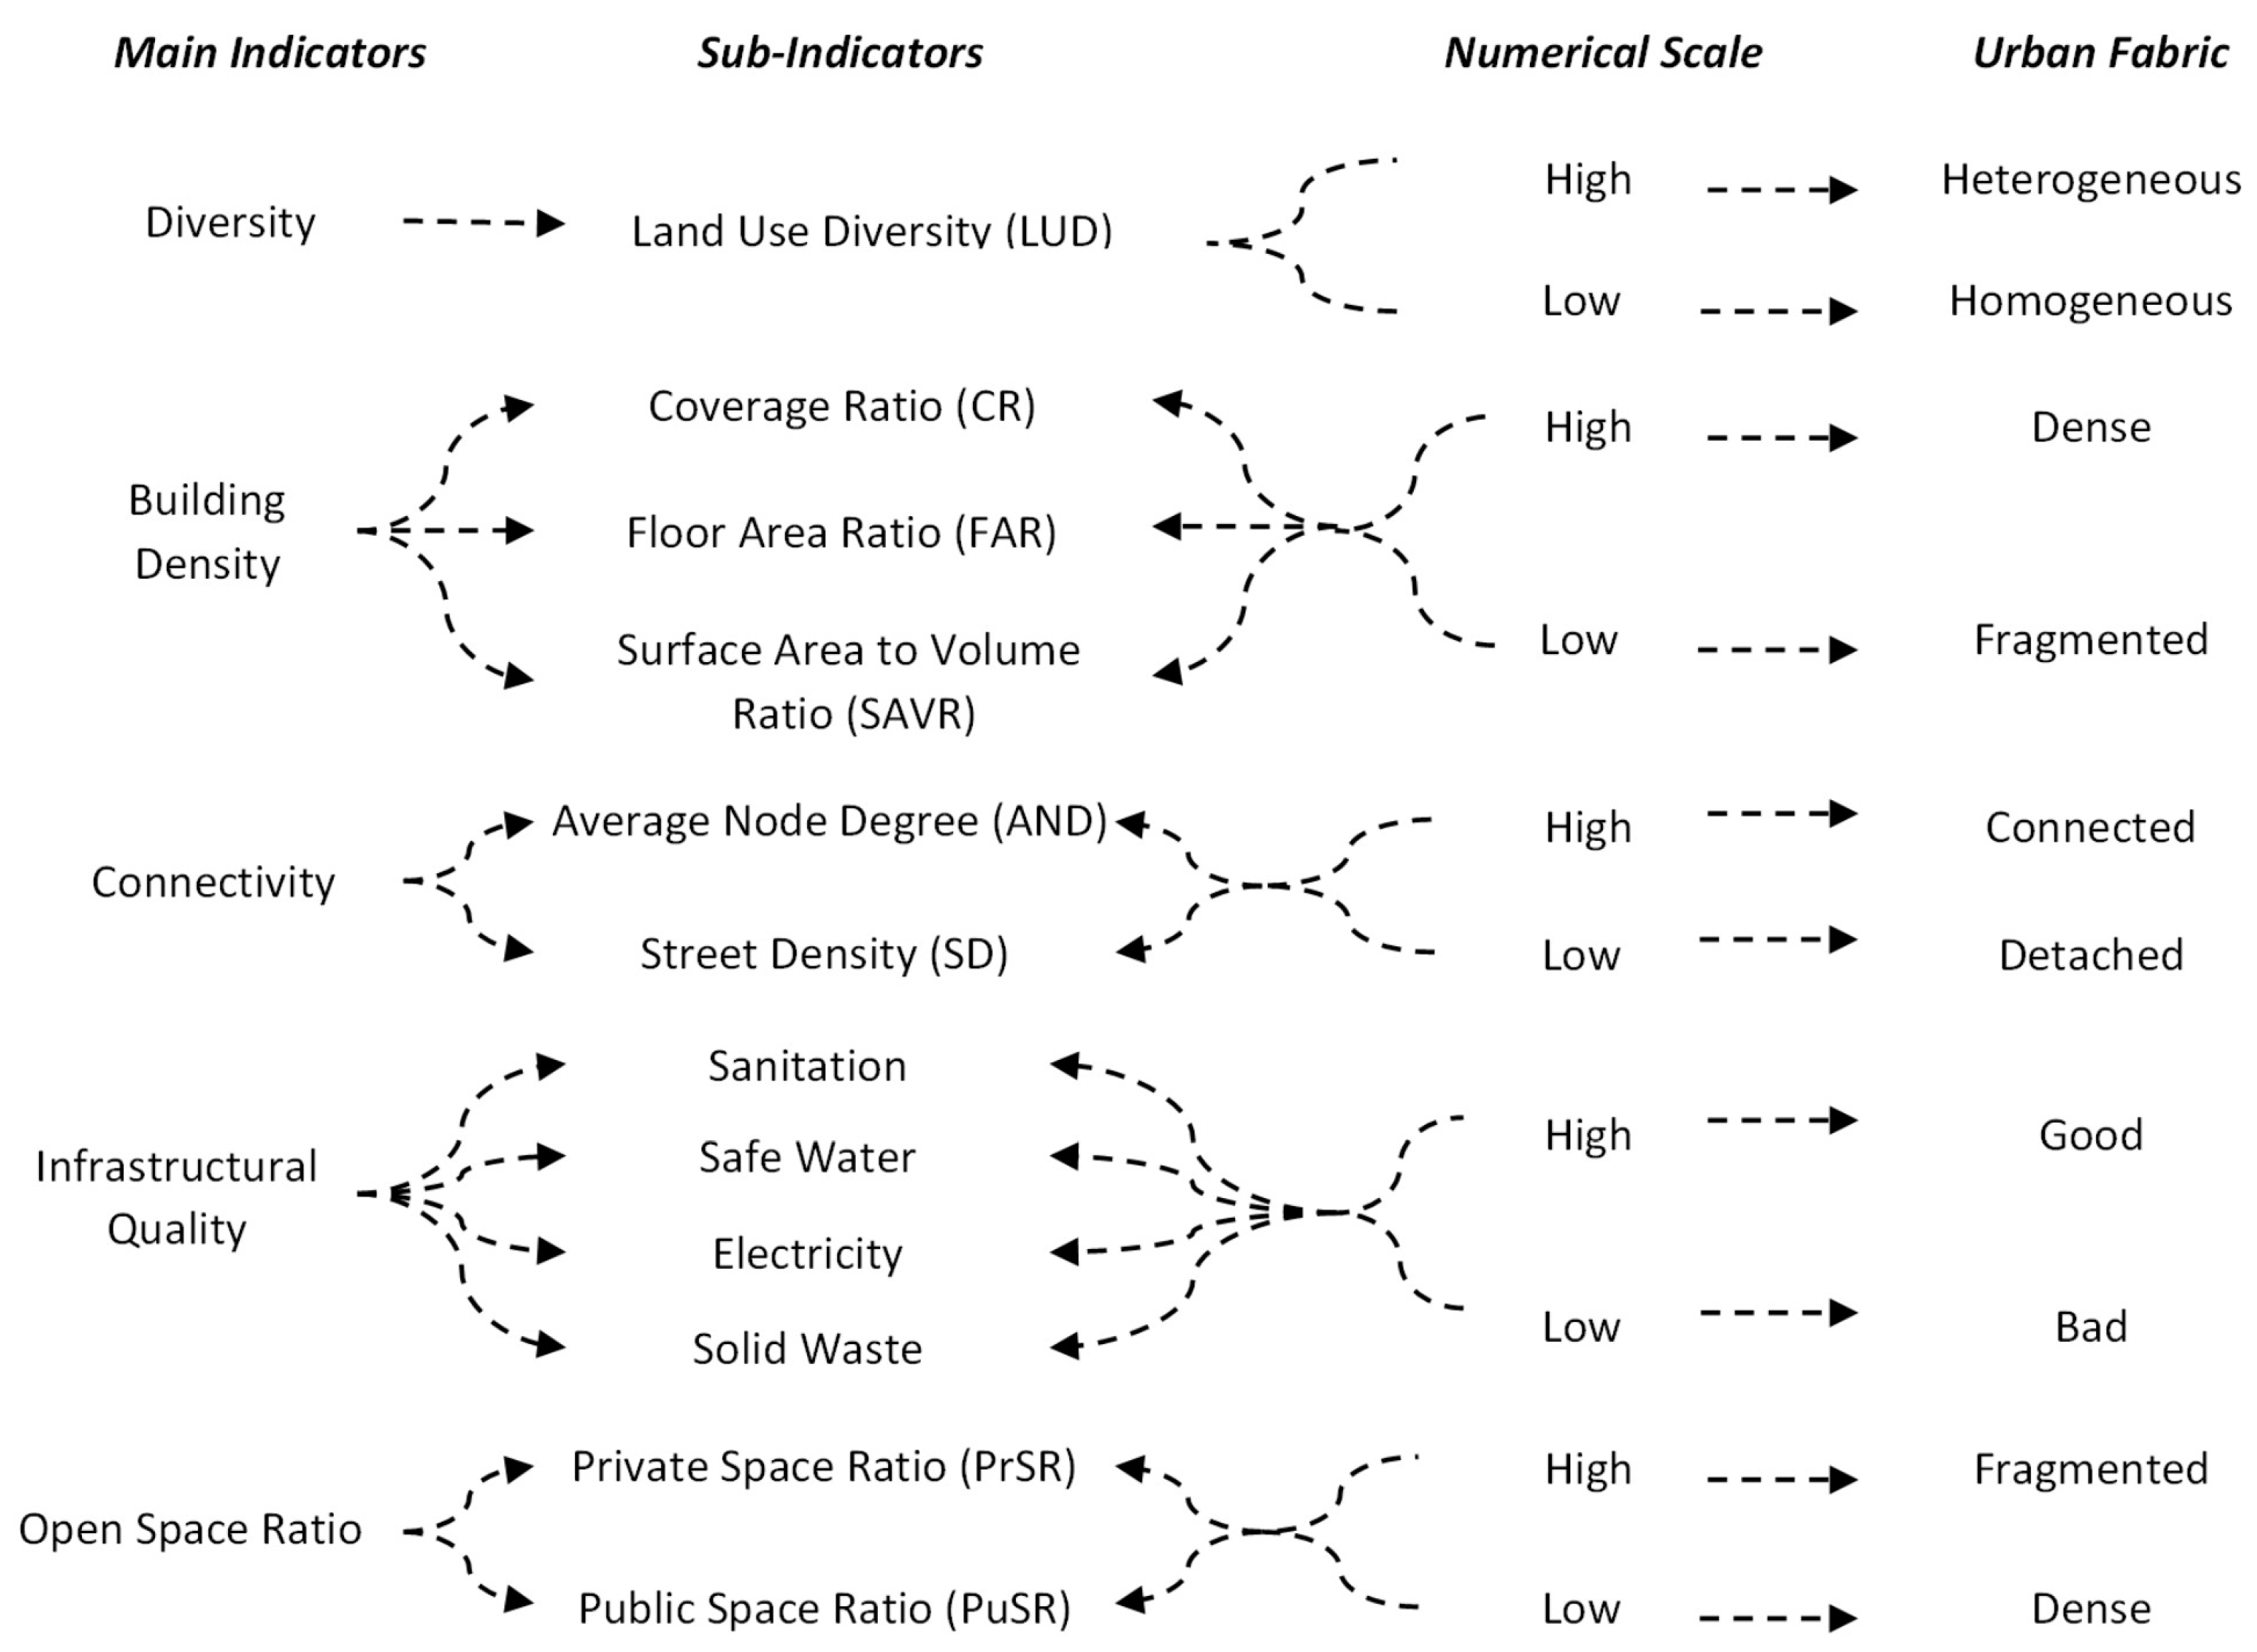
5.1. Indicator Identification
5.2. Data Collection and Sampling
5.3. Data Analysis
6. Results
7. Discussion

| Indicators (Subindicators) | Measuring Guidelines | Scaling the Urban Fabric | ||
|---|---|---|---|---|
| Zia Colony | Hope Colony | Shamspura Colony | ||
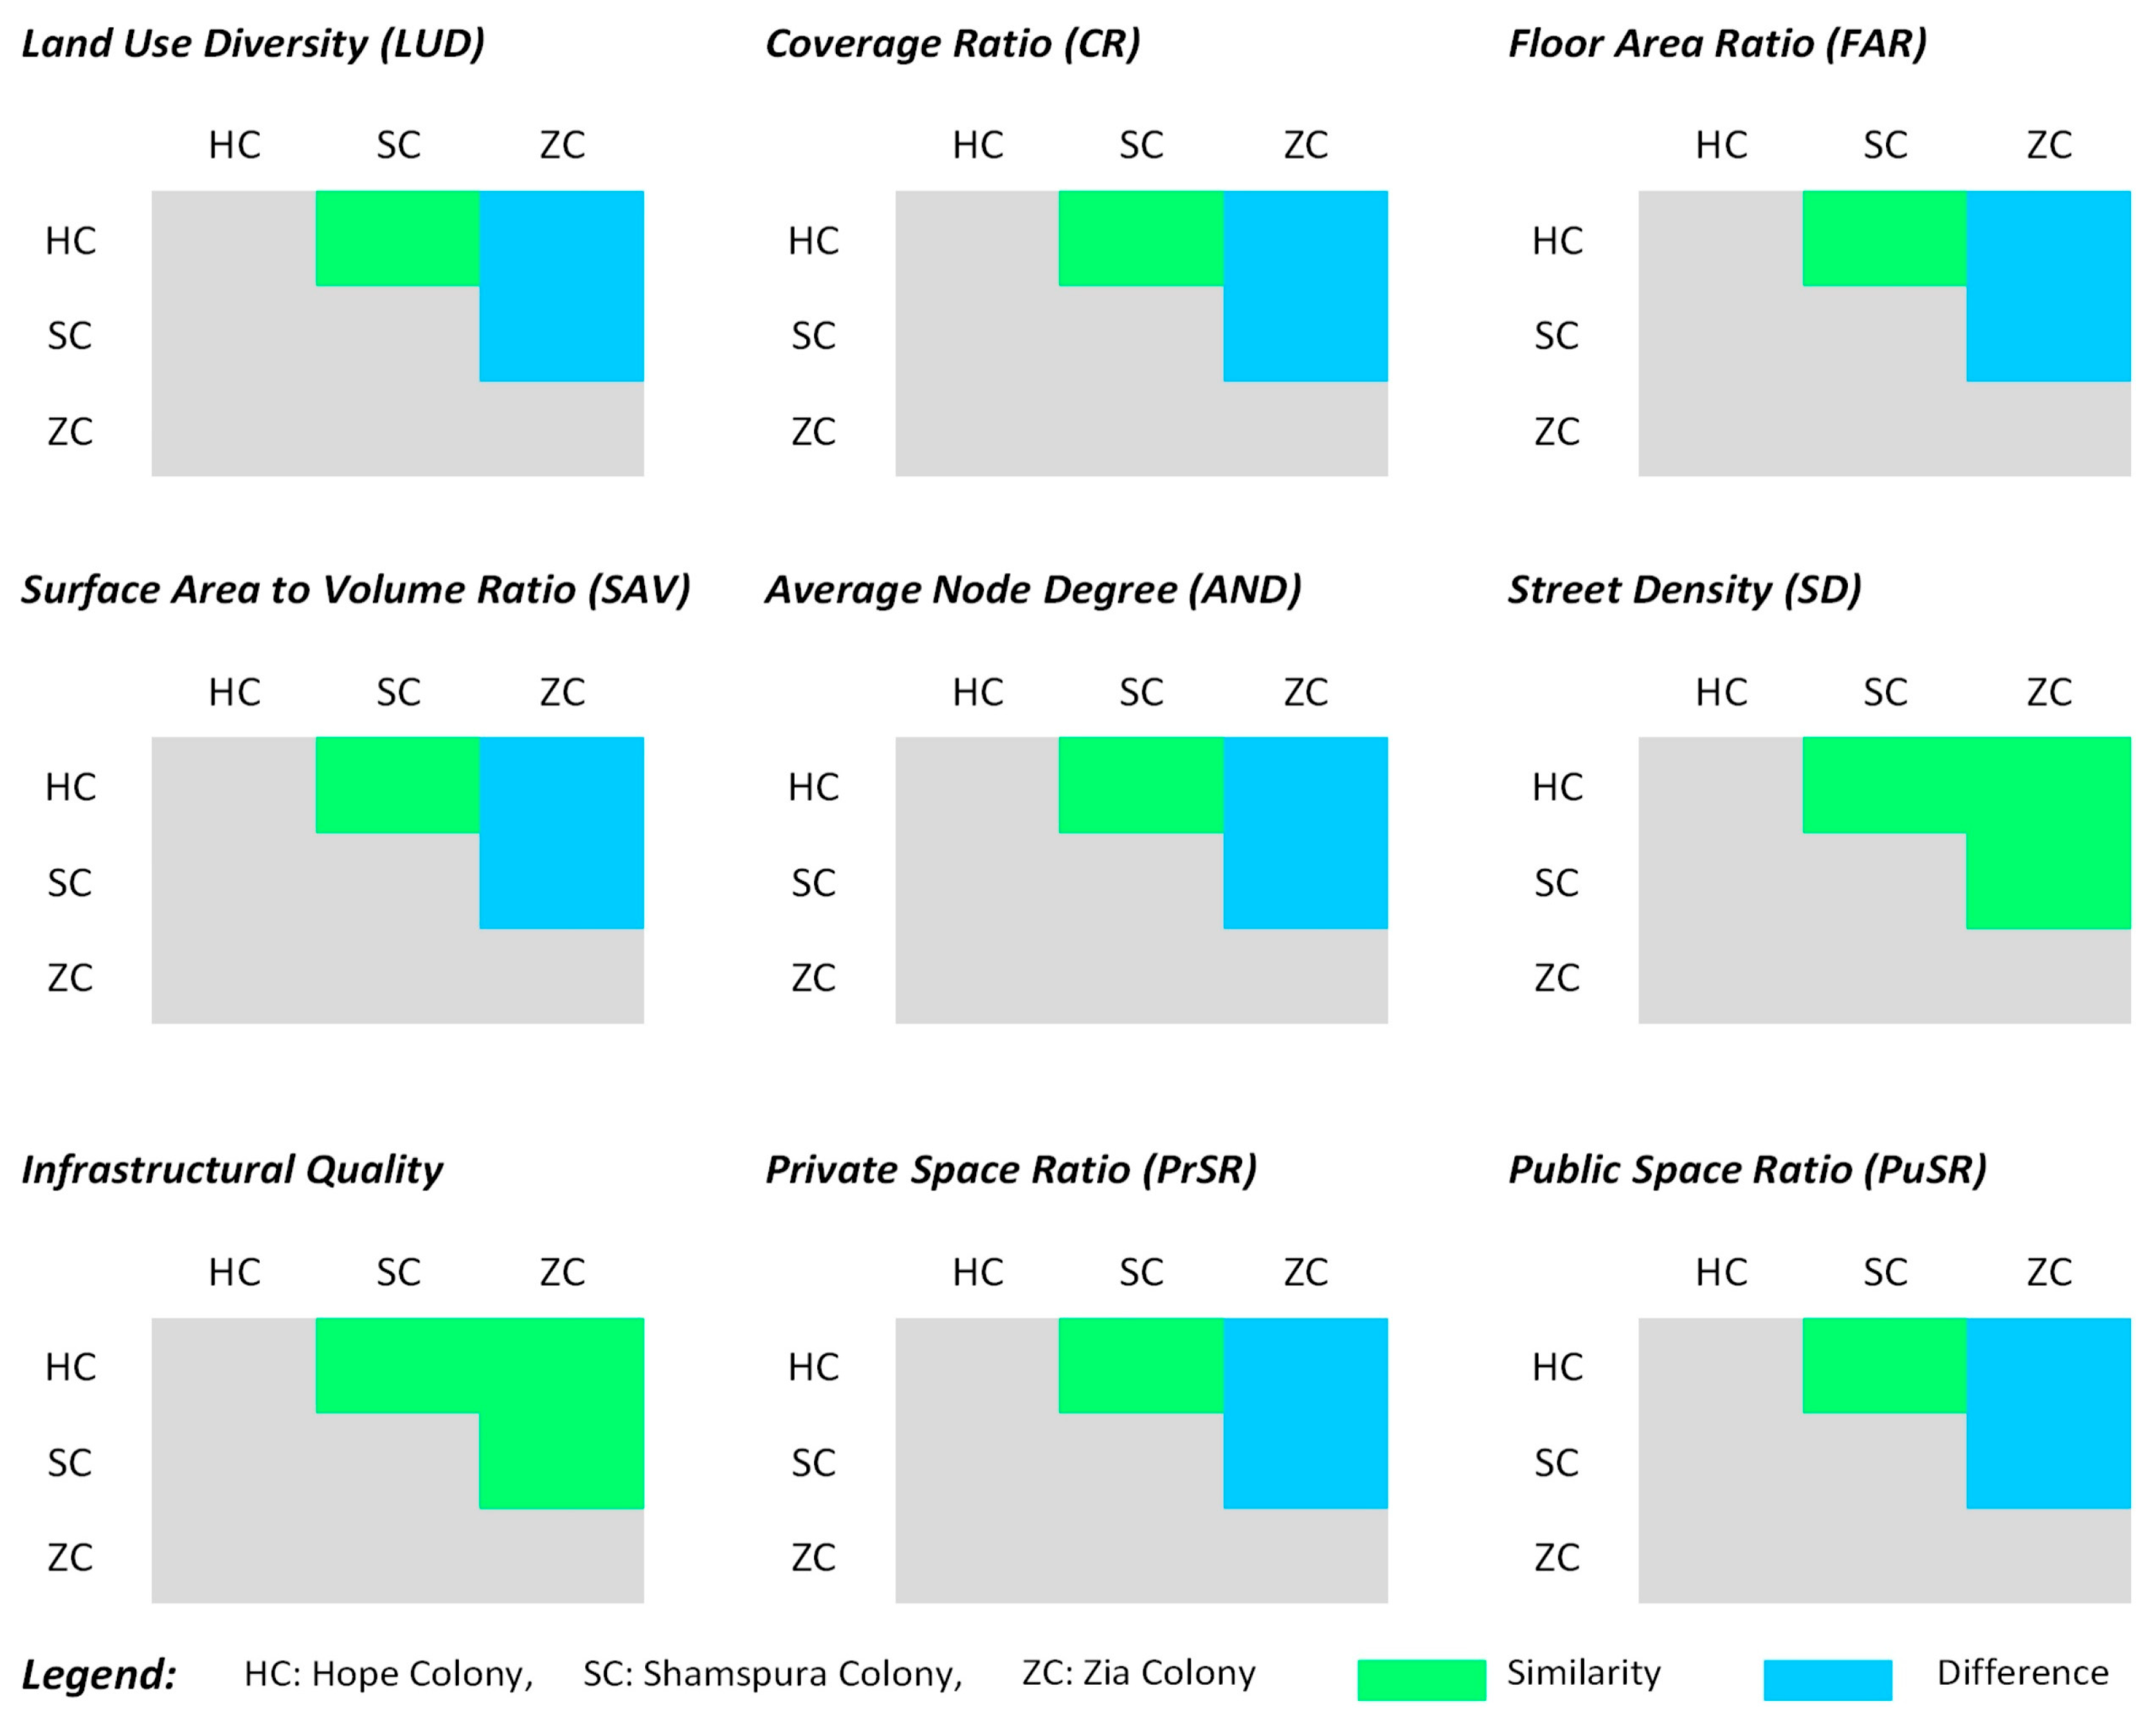
| Diversity (LUD) | Residential to nonresidential land-use ratio should be 1 to ensure land-use heterogeneity [82] | Land-use ratio is 0.1, corresponding to the least level of land-use heterogeneity in the settlement | Land-use ratio is 0.15, depicting the unfavorable scale of land-use heterogeneity | Land-use ratio is 0.28, relatively higher than former settlements but still less than the stipulated standards |
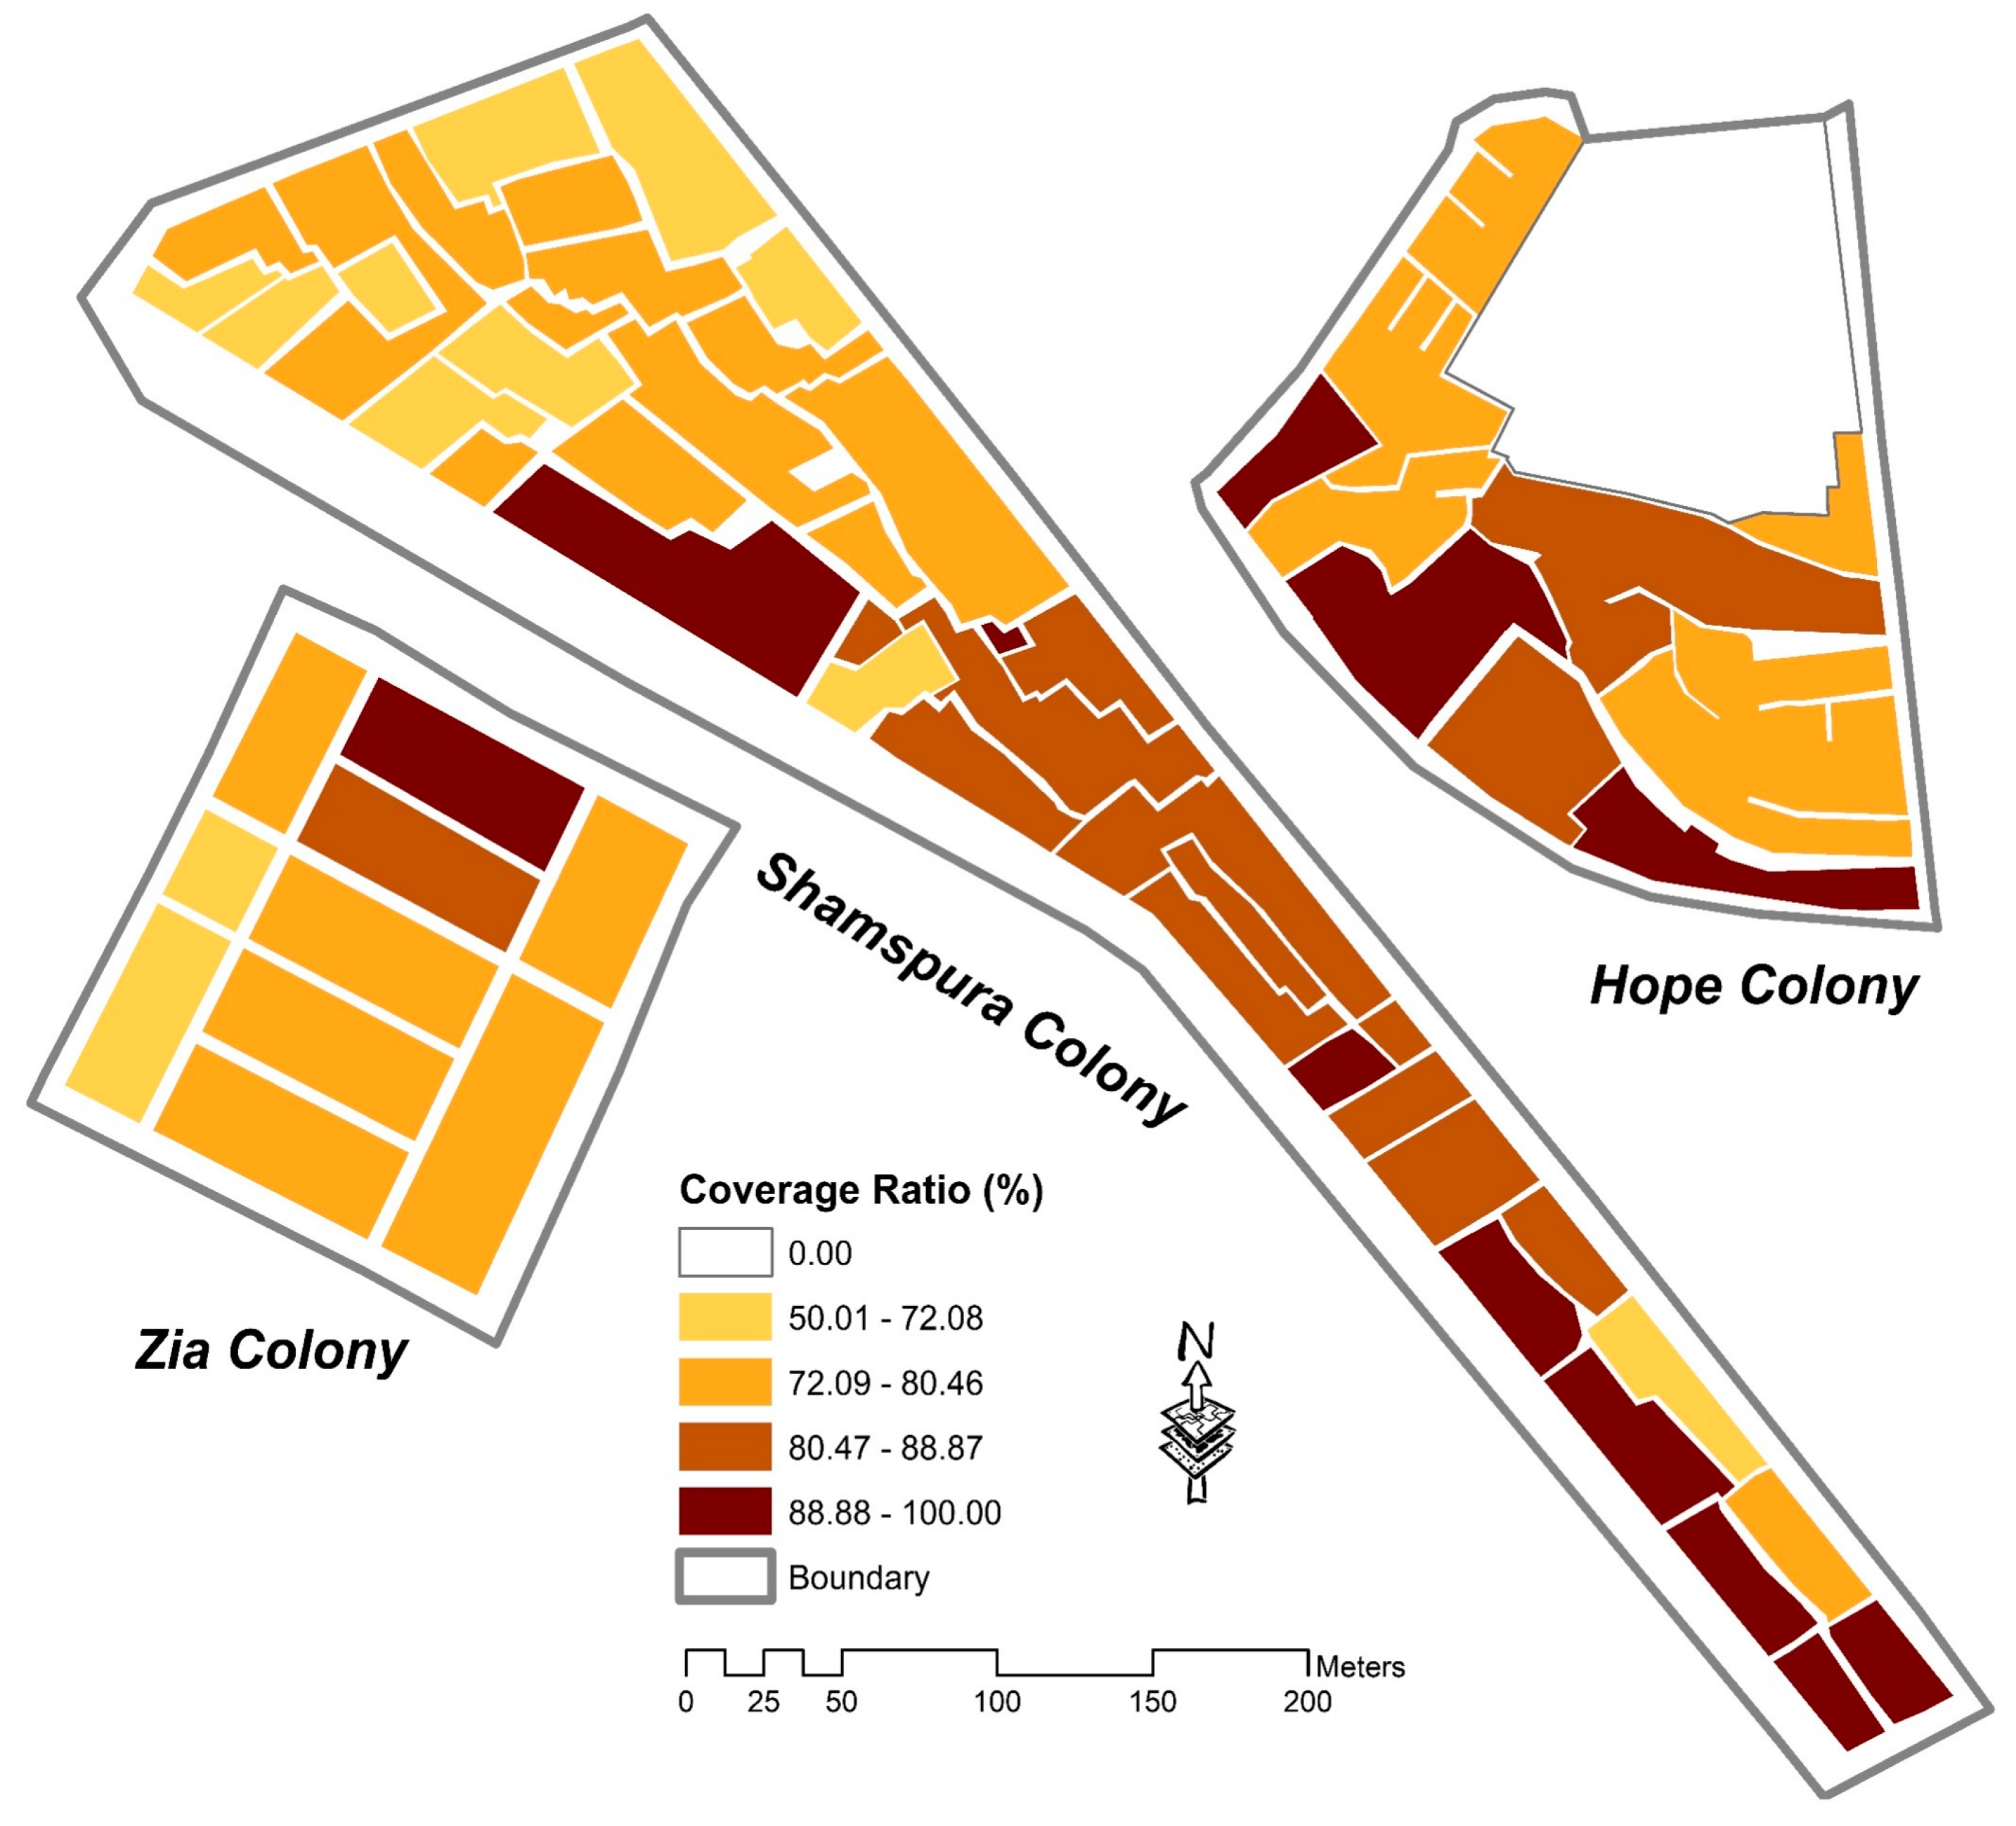
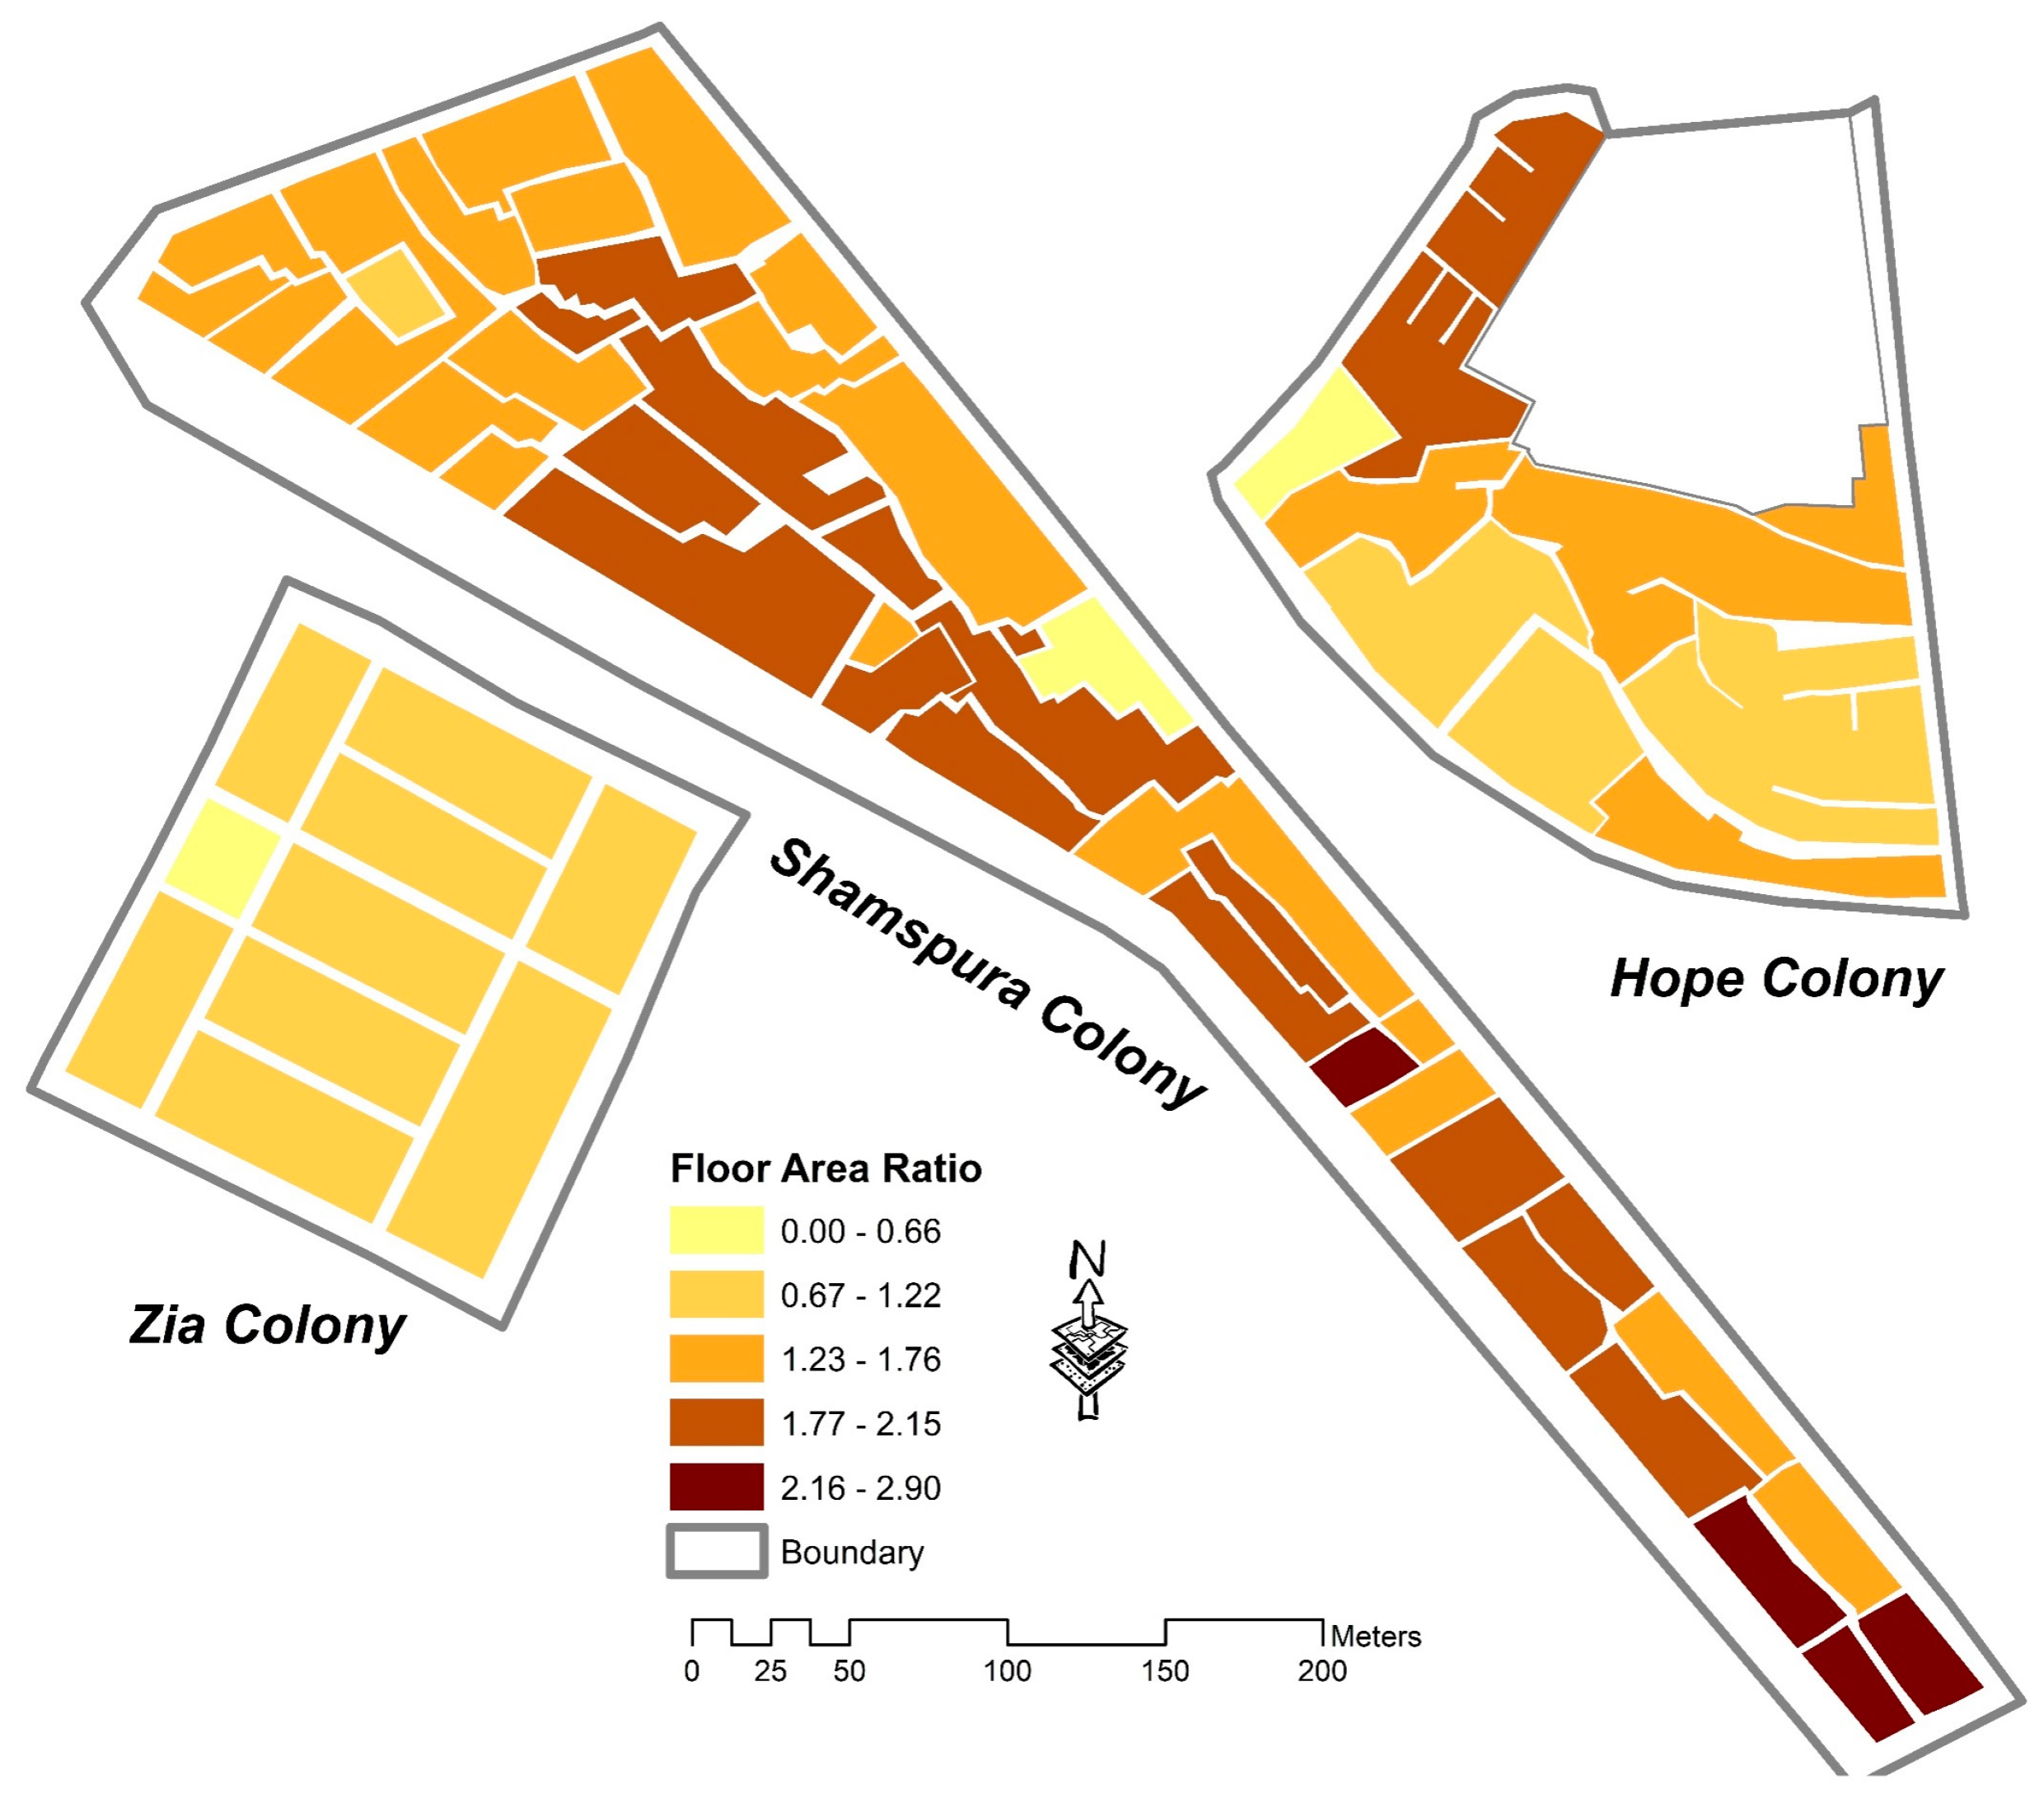
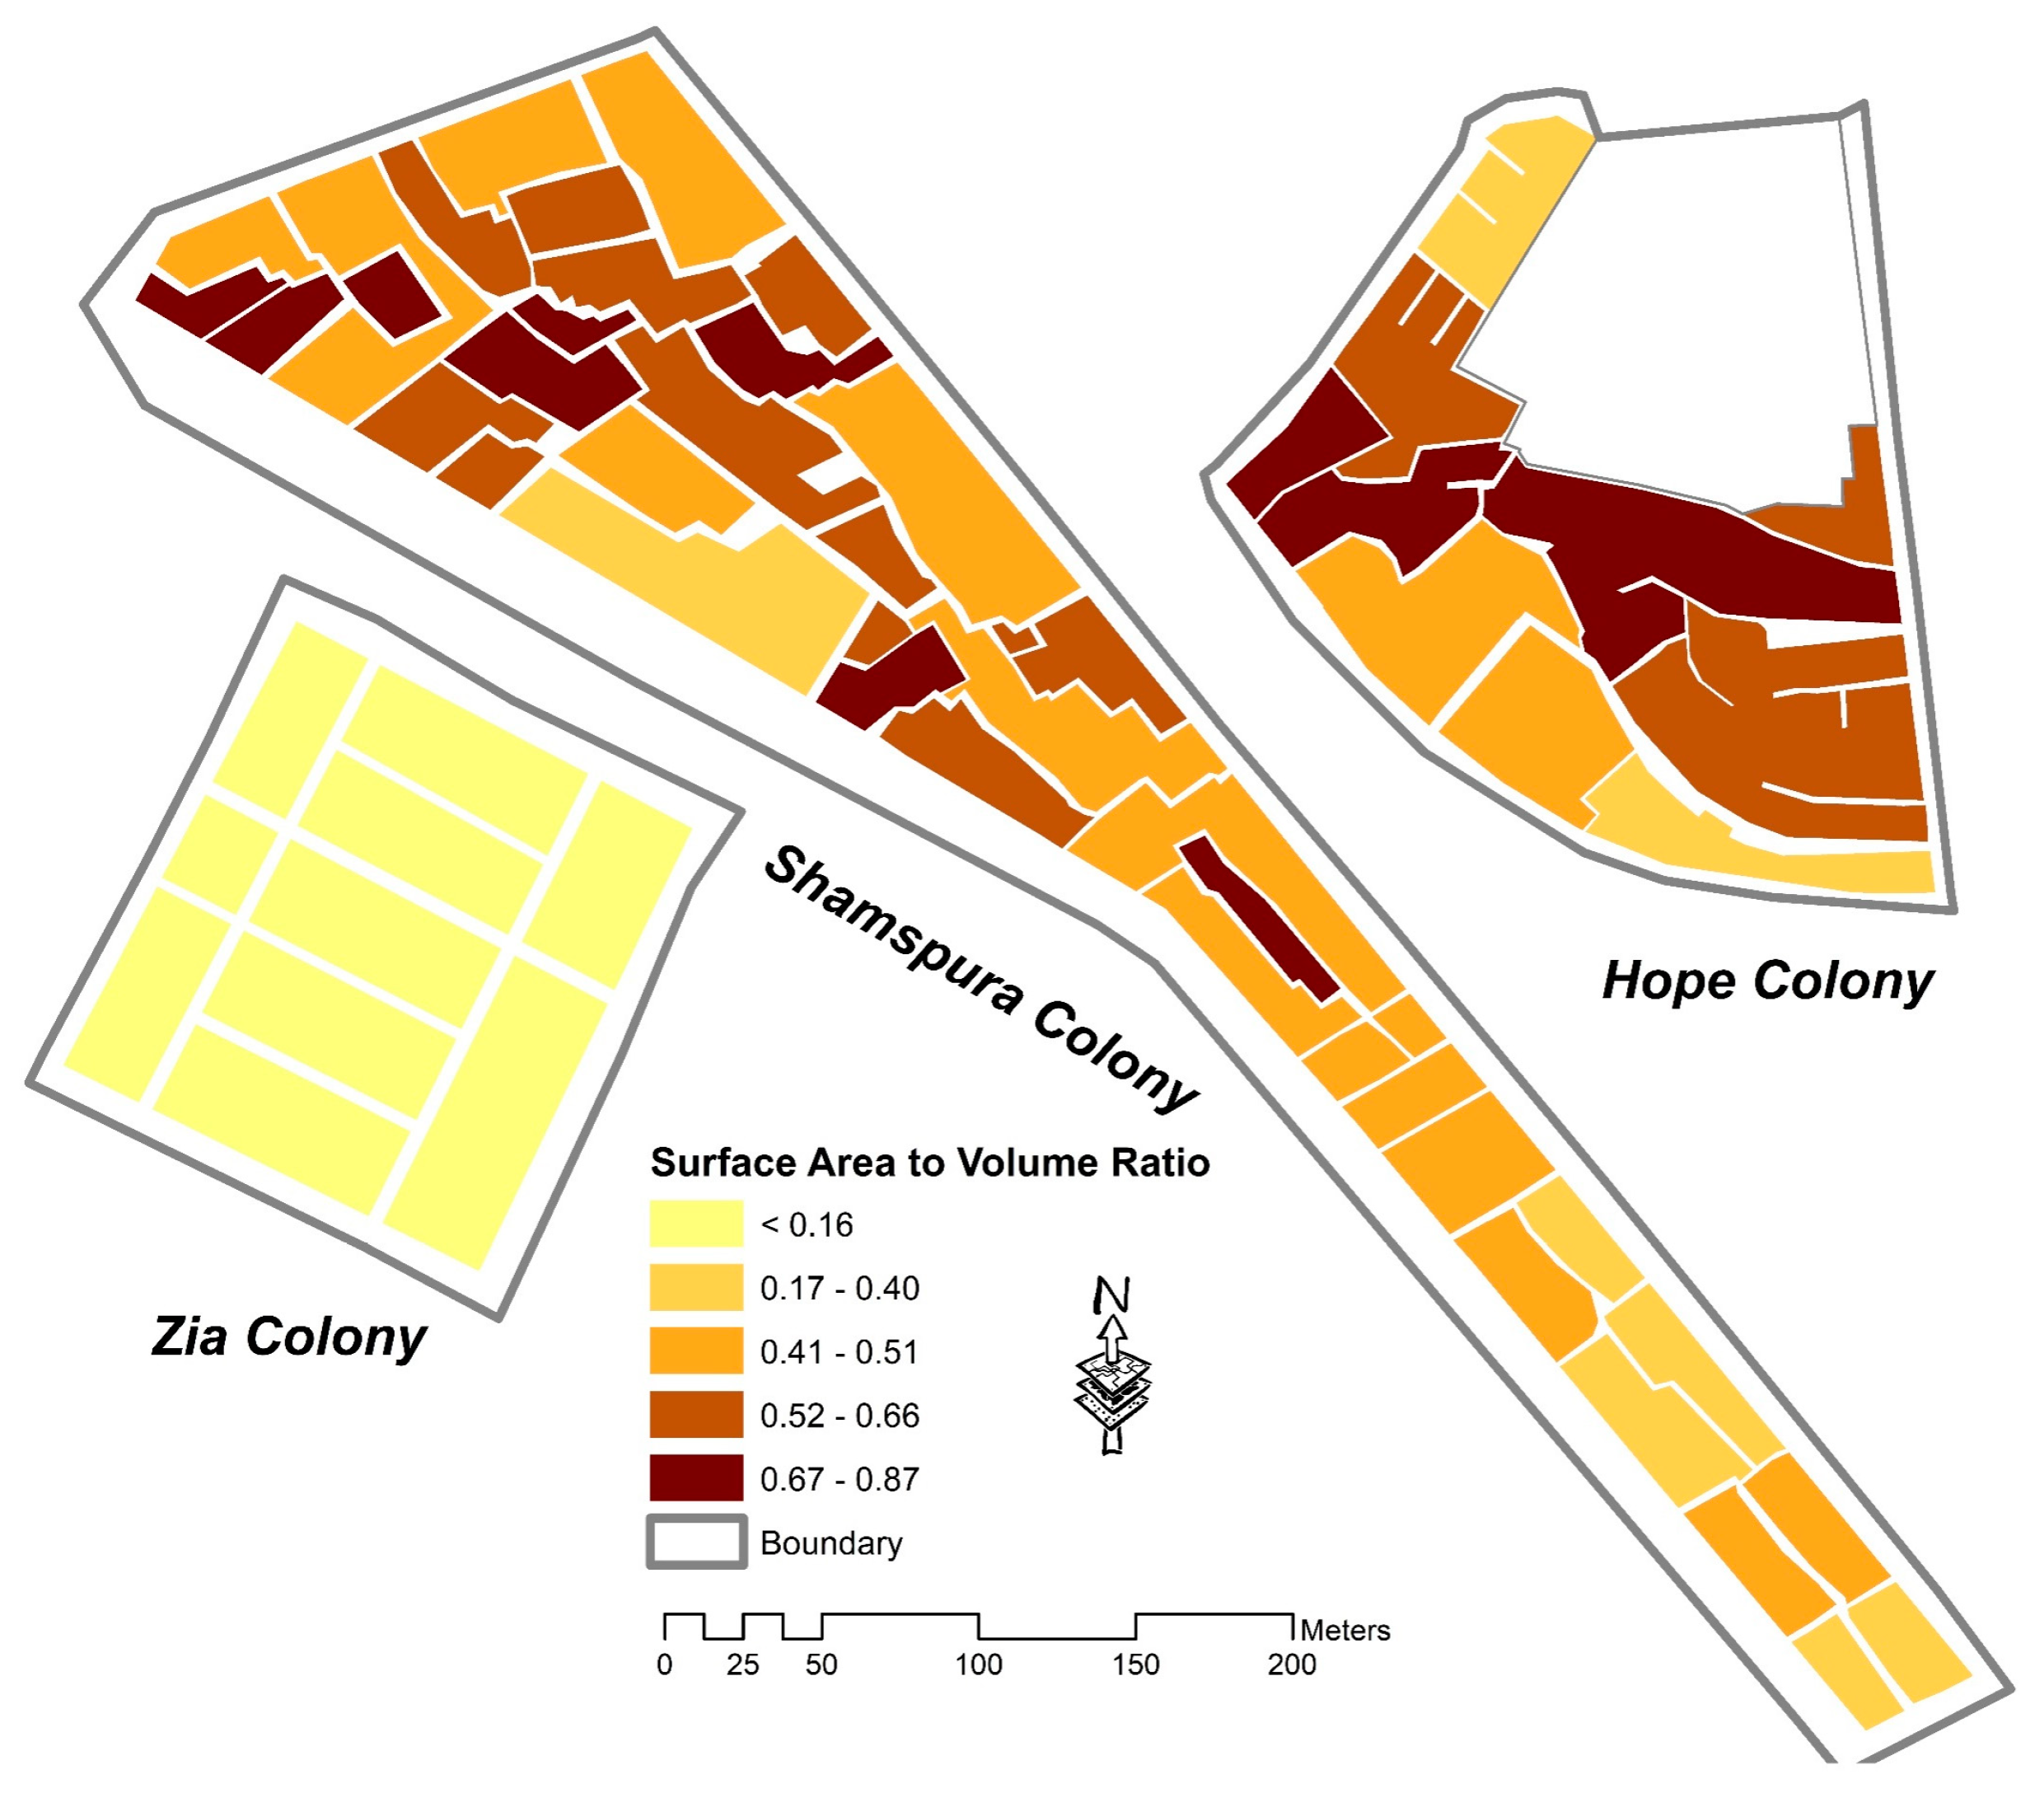
| Building Density (CR, FAR, SAVR) | Higher densities lead to compact urban form [96,97] | CR, FAR, and SAVR values represent the least dense development | The subindicator values indicate medium densities | Analysis shows the highest building densities and compact development. |
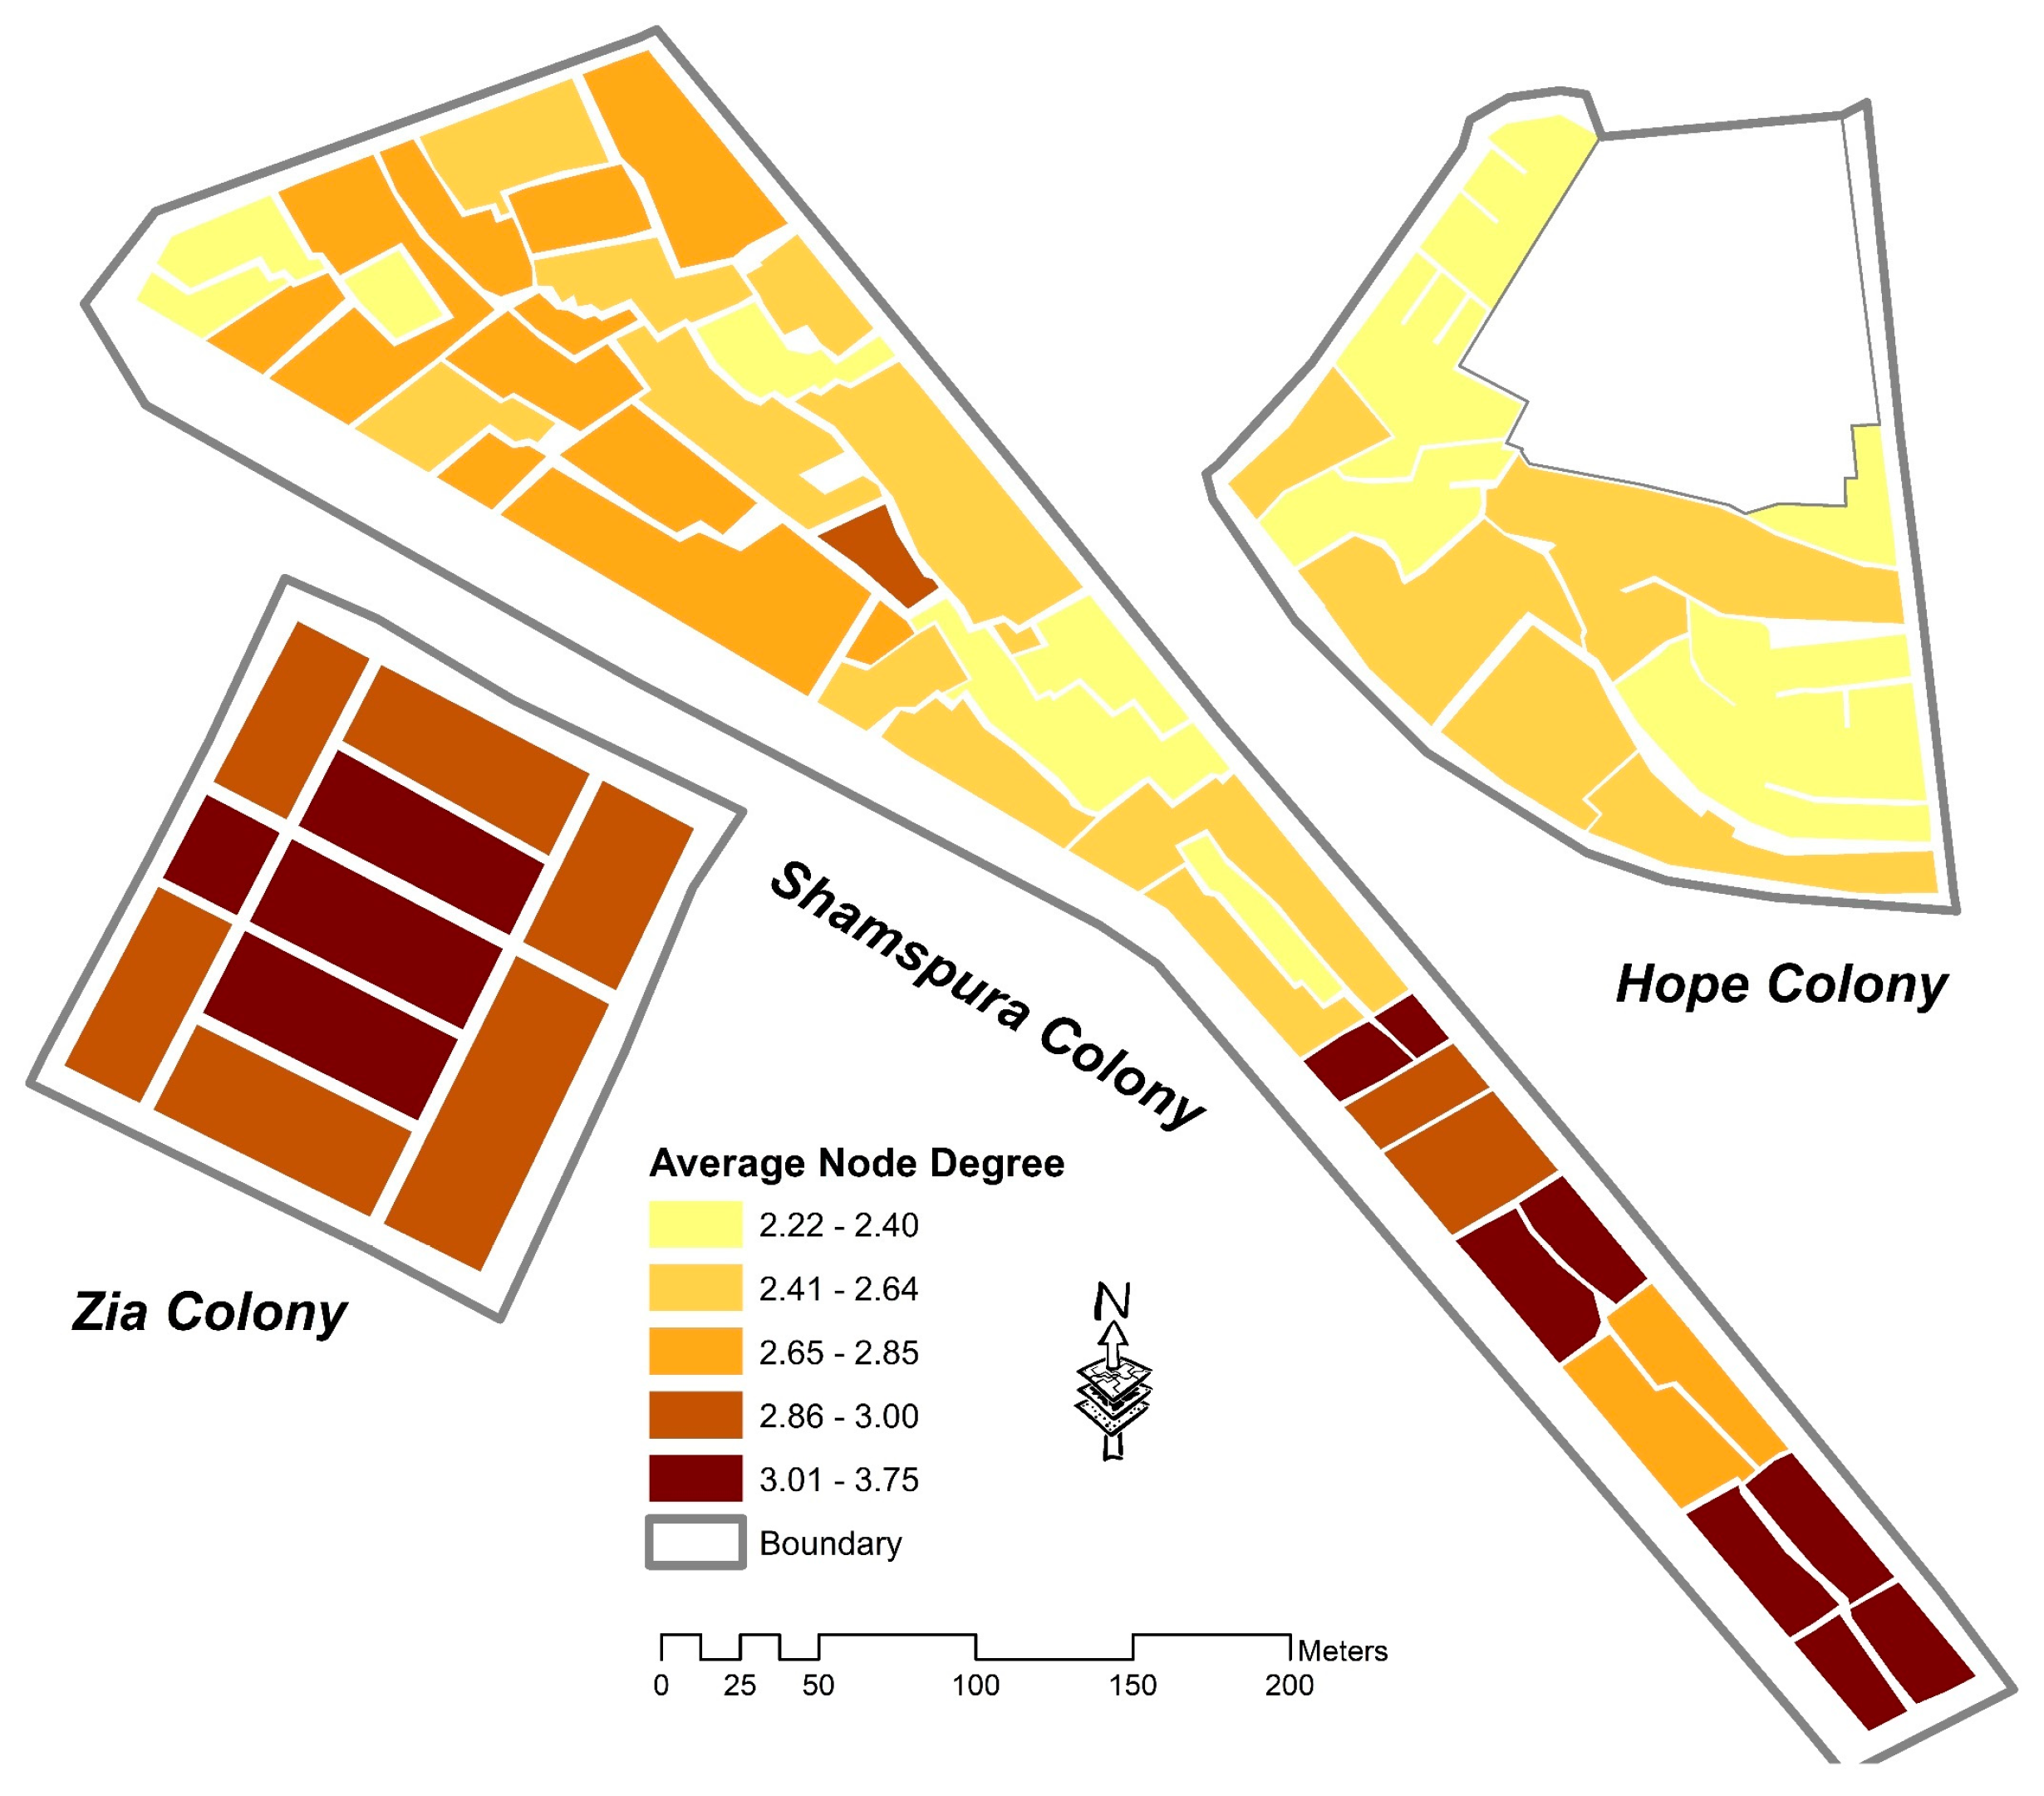
| Connectivity (AND, SD) | Higher connectivity index leads to greater accessibility and integrated urban fabric [43,98] | The subindicators depict the highest connectivity index due to its grid iron street layout | The subindicators suggest the least connectivity index due to the presence of cul-de-sac and dead ends | AND indicator reveals a low value of connectivity index due to Y and T shape junctions except for a few blocks on the southern side. |
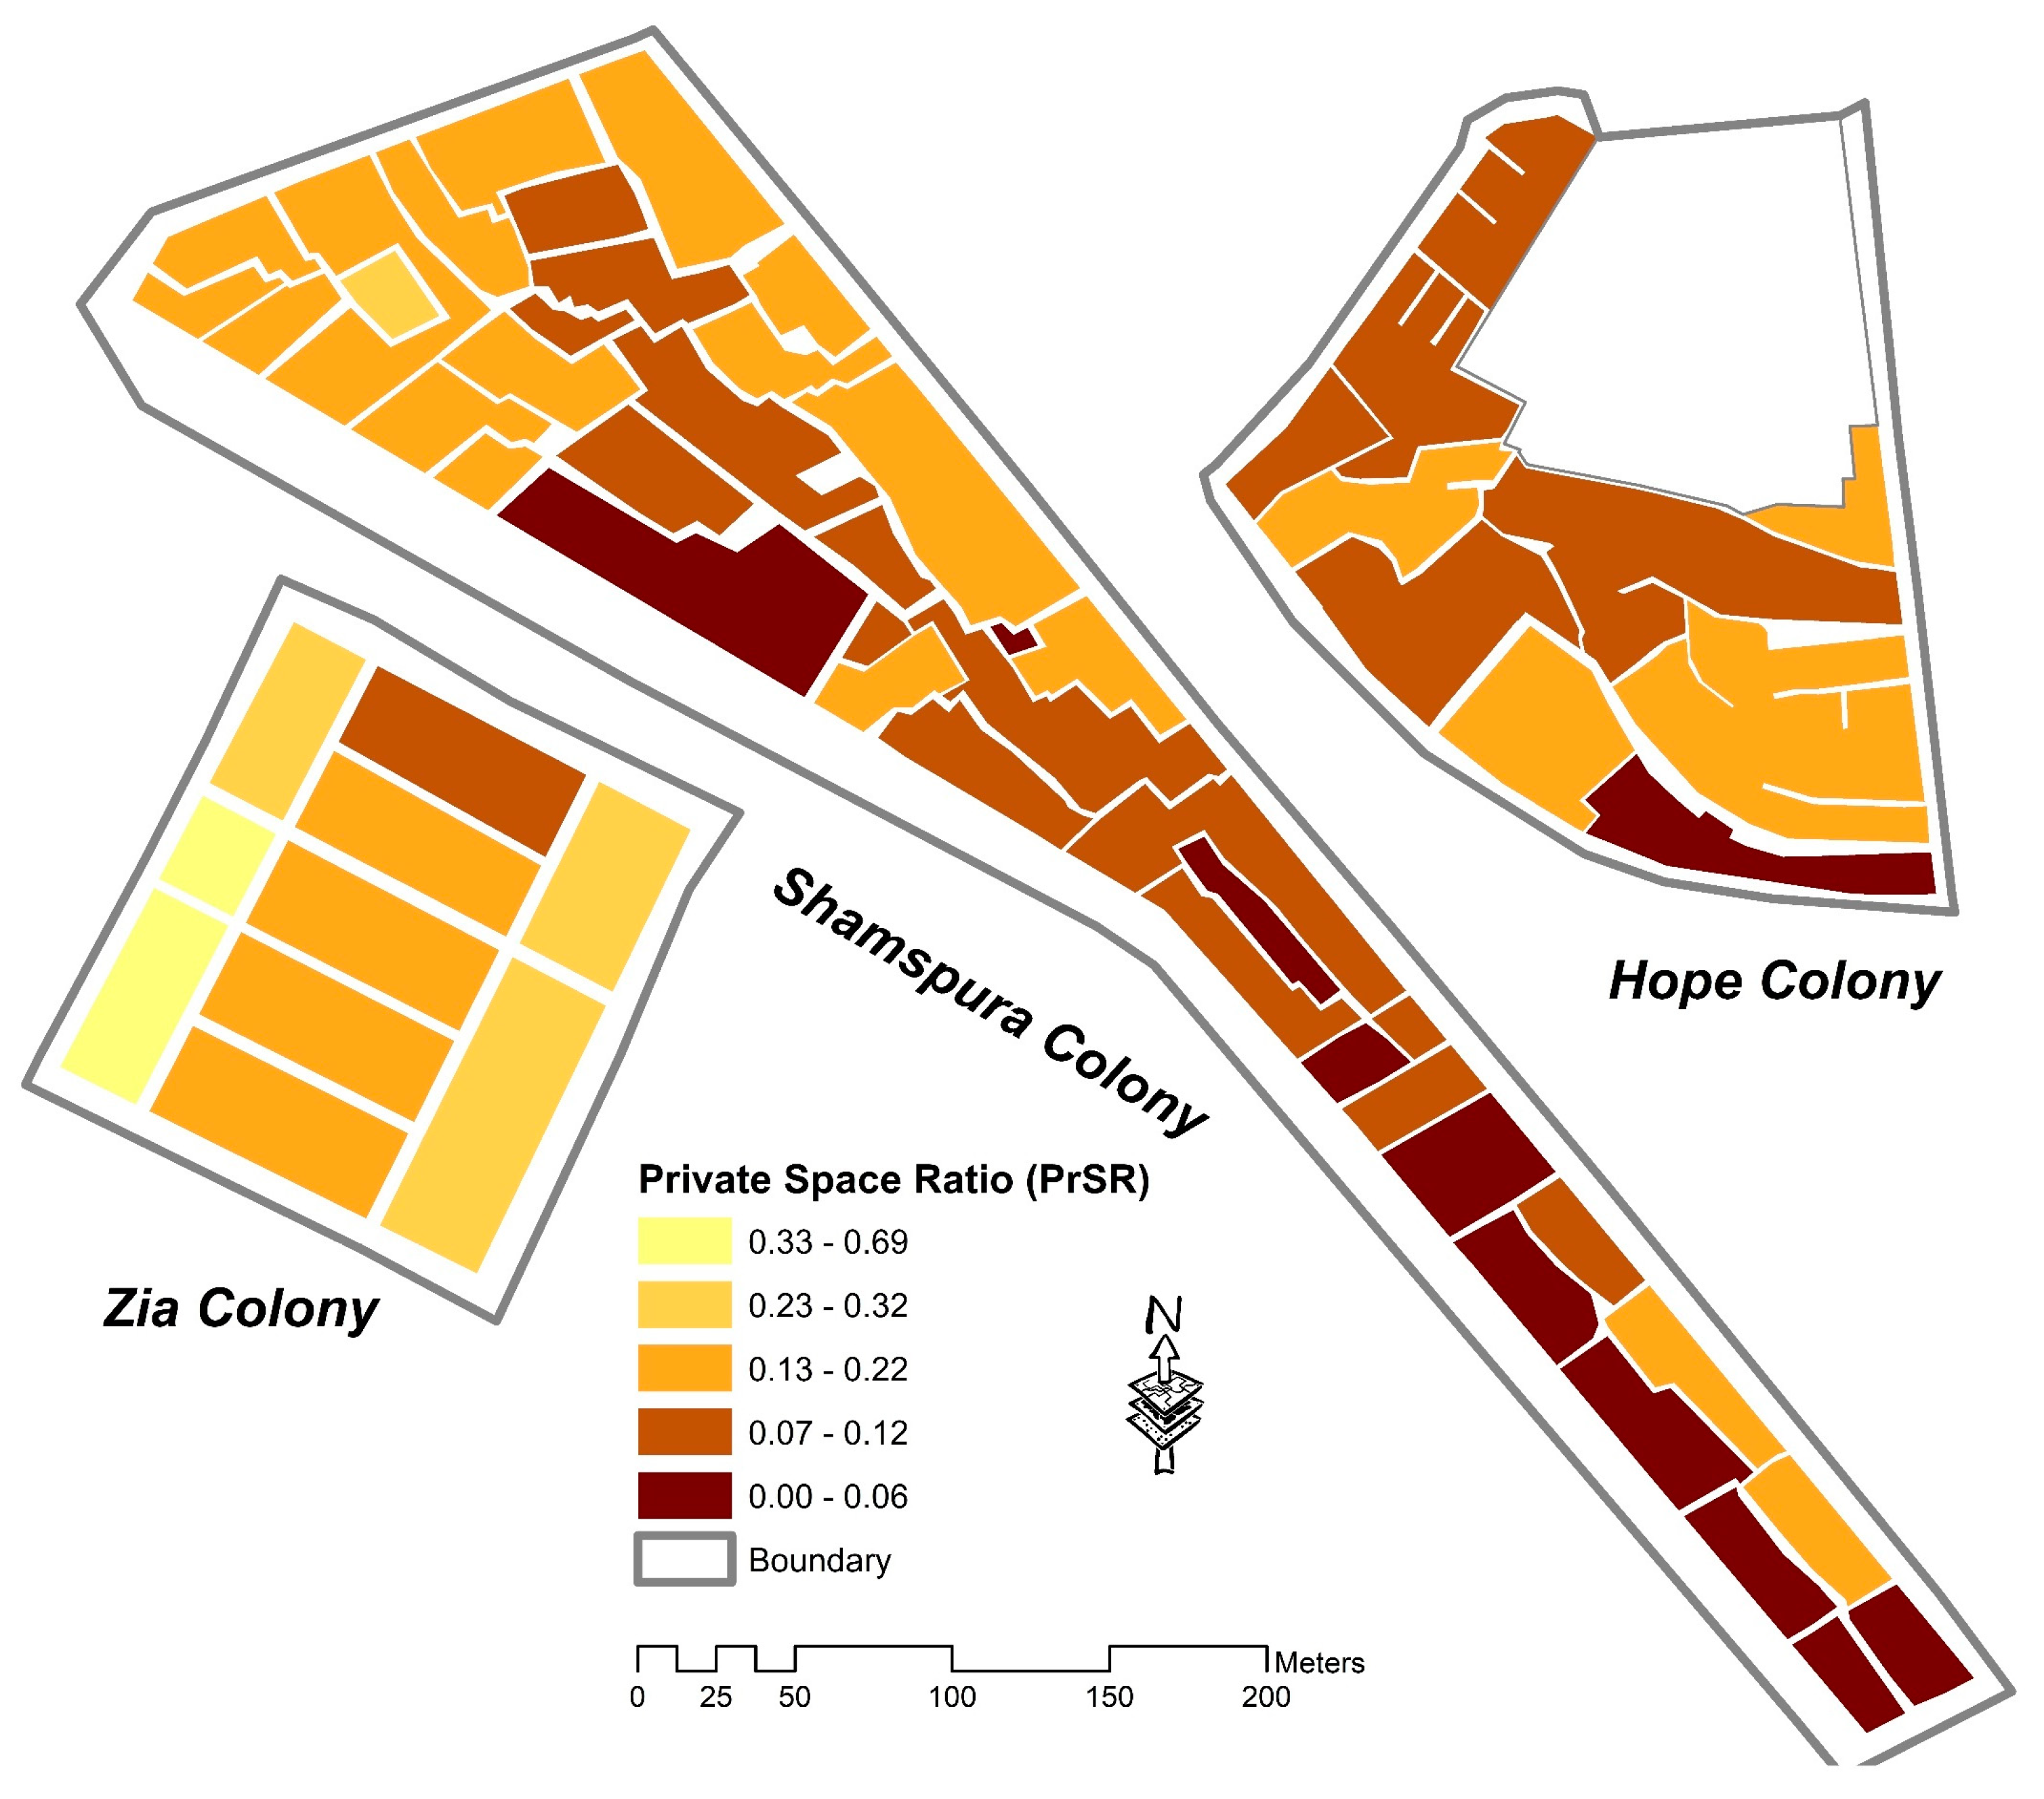
| Open-Space Ratio (PrSR, PuSR) | Built-up to open-space ratio should be three times [82] | Built-up to open-space ratio is 1.5 times, signifying the less open spaces despite wider streets. | Built-up to open-space ratio is 1.2 times, which suggests inadequate availability of open spaces | Built-up to open-space ratio is 1.1 times, which is the minimum value as compared to other case studies, depicting the utmost scarcity of open spaces |
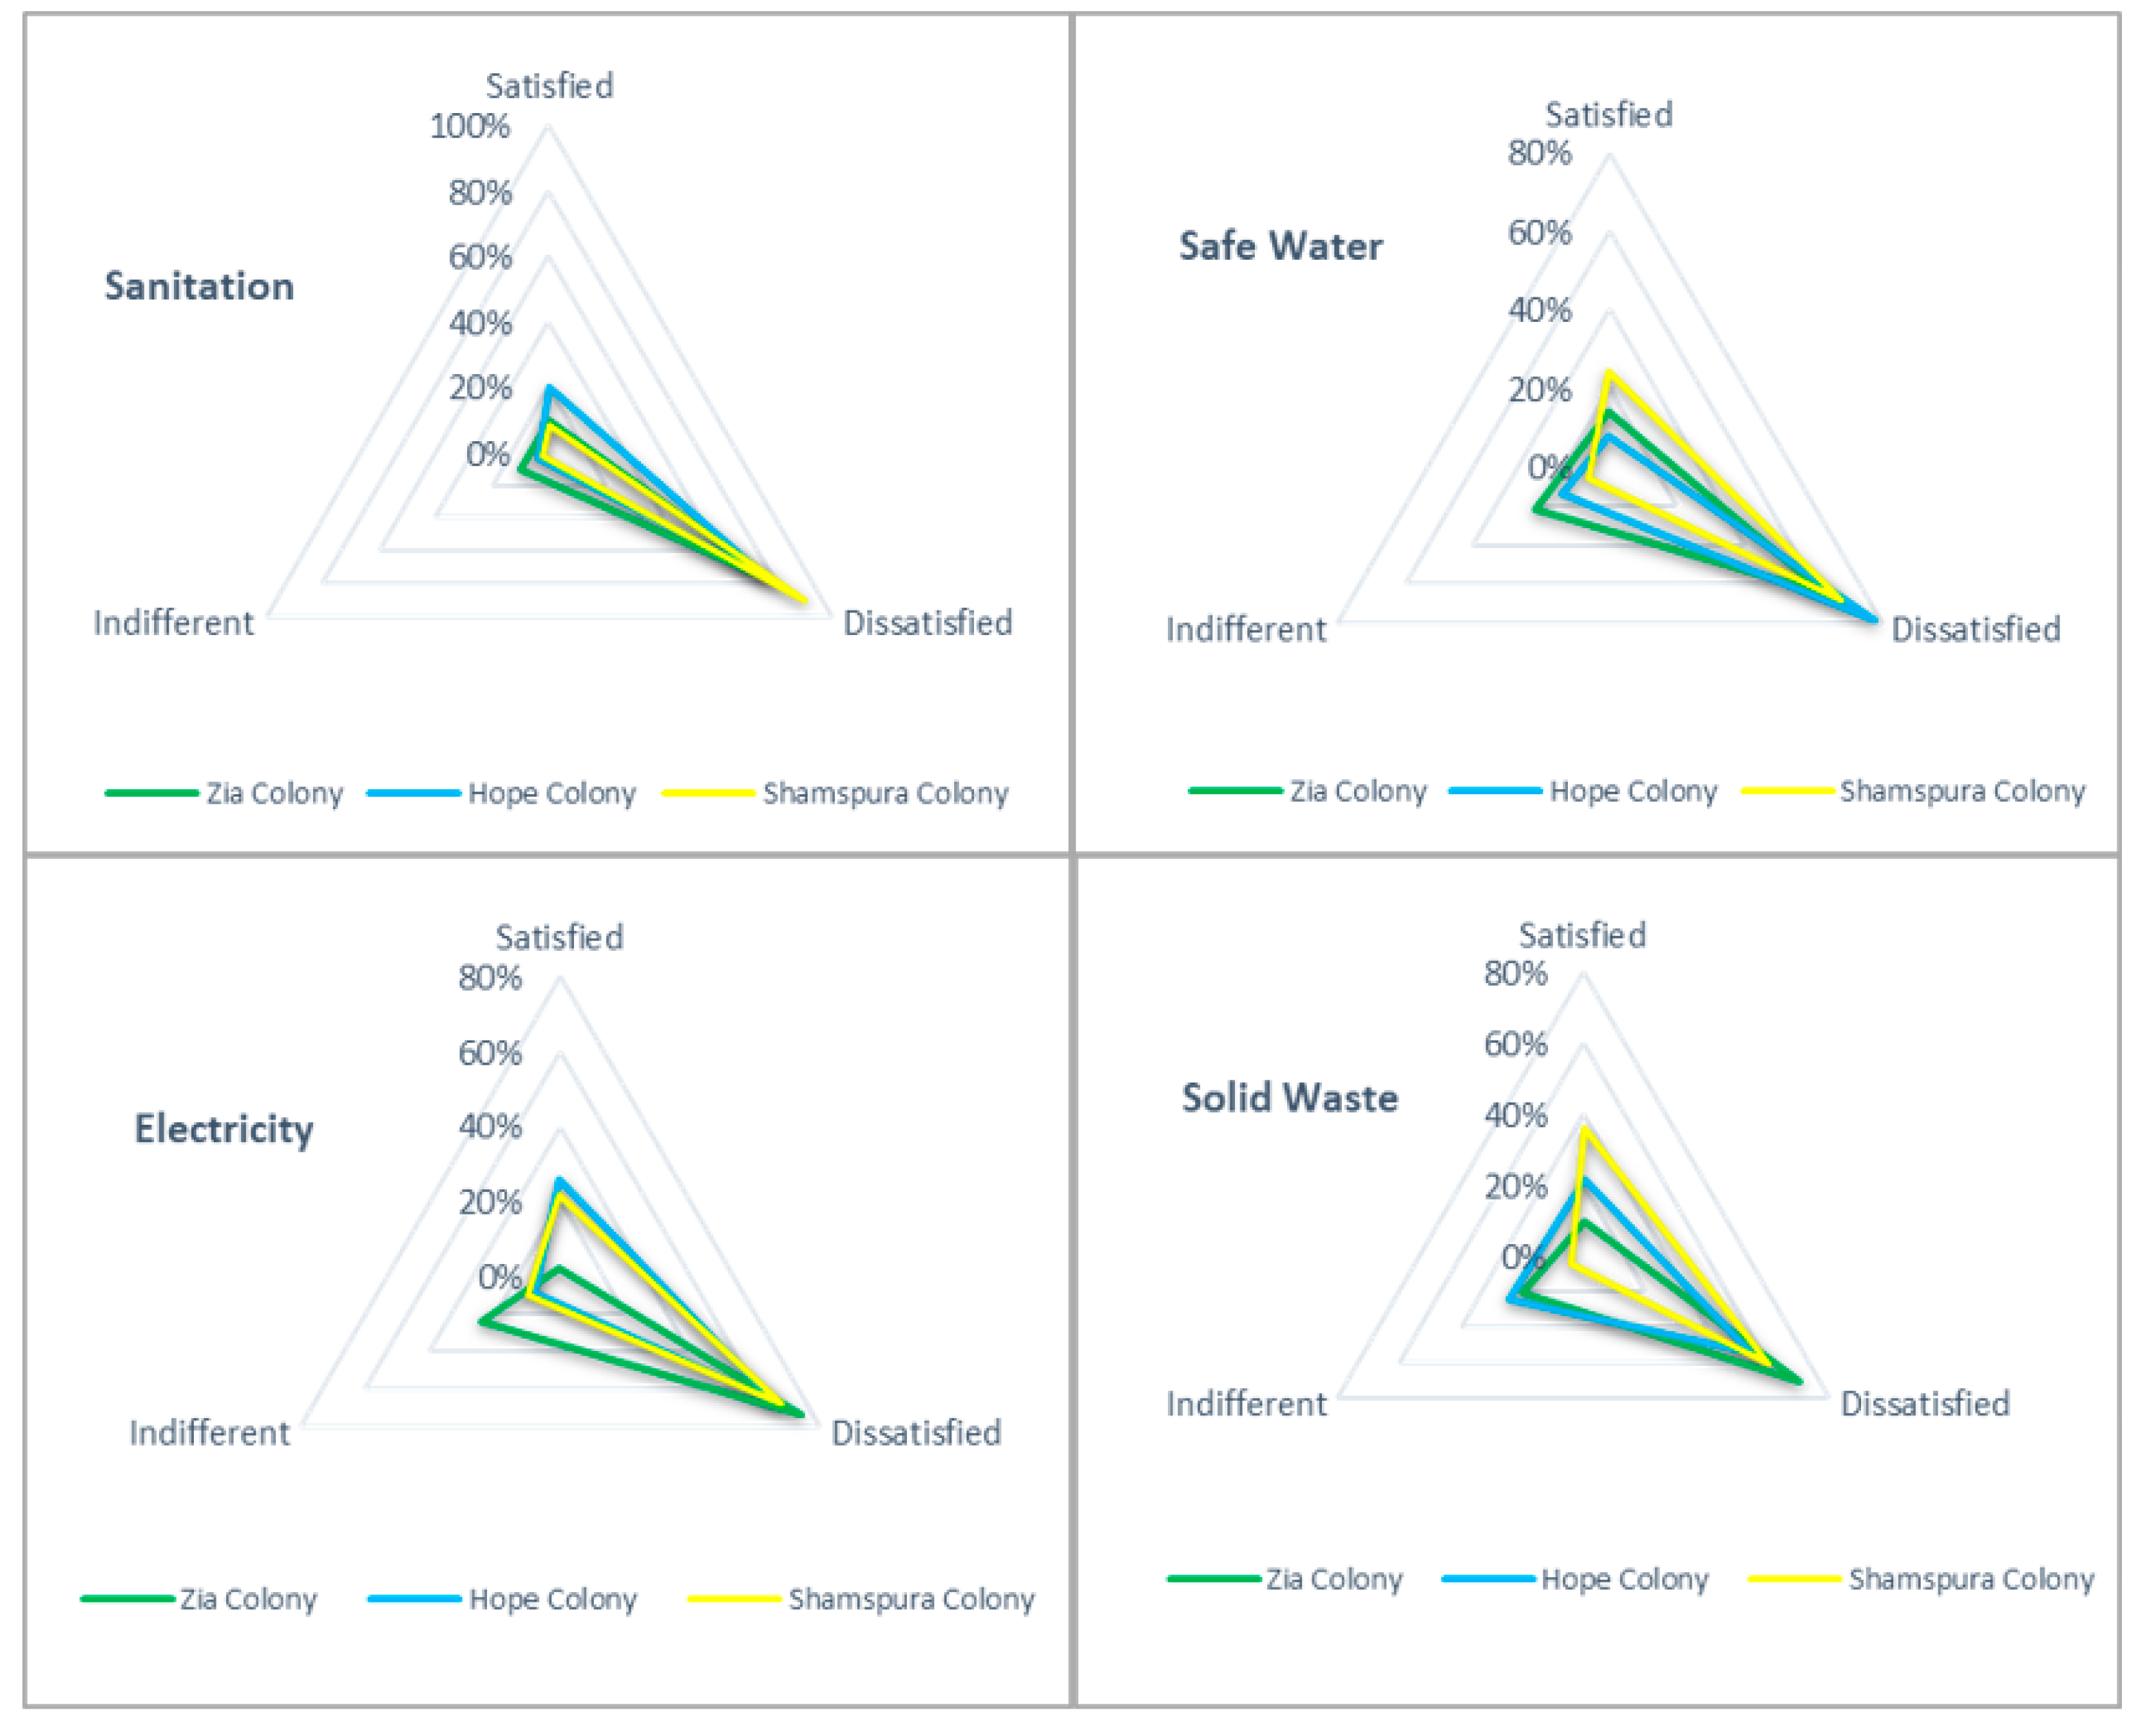
| Infrastructural Quality (Sanitation, Water Supply, Electricity, Waste Management) | Higher respondent satisfaction level depicts a better quality of infrastructural services [99] | Respondent’s satisfaction level for utility services was significantly lower. | Lowest level of respondent satisfaction, depicting the worst infrastructural qualities | Respondents’ satisfaction levels for utility services are comparatively better than Zia and Hope Colony; however, still considered unfavorable |
8. Conclusions and Recommendations
9. Limitations and Future Research
Supplementary Materials
Author Contributions
Funding
Institutional Review Board Statement
Informed Consent Statement
Data Availability Statement
Acknowledgments
Conflicts of Interest
References
- Azunre, G.A.; Amponsah, O.; Takyi, S.A.; Mensah, H.; Braimah, I. Urban informalities in sub-Saharan Africa (SSA): A solution for or barrier against sustainable city development. World Dev. 2022, 152, 105782. [Google Scholar] [CrossRef]
- UNESCAP. Economic and social survey of Asia and the Pacific 2015 Part I: Making growth more inclusive for sustainable development. In Economic and Social Survey of Asia and the Pacific; ESCAP UN: Bangkok, Thailand, 2015. [Google Scholar]
- UN-Habitat. World Cities Report 2020: The Value of Sustainable Urbanization; UN-Habitat: Nairobi, Kenya, 2020; p. 318. [Google Scholar]
- UN-Habitat. Habitat III Issue Papers 22—Informal Settlements. In Proceedings of the United Nations Conference on Housing and Sustainable Urban Development, Quito, Ecuador, 17–20 October 2016. [Google Scholar]
- UN-Habitat. The challenge of slums: Global report on human settlements 2003. Manag. Environ. Qual. Int. J. 2004, 15, 337–338. [Google Scholar] [CrossRef]
- UNESCAP. Urbanization Trends in Asia and the Pacific. Available online: https://www.unescap.org/resources/urbanization-trends-asia-and-pacific (accessed on 13 June 2022).
- UN-Habitat. State of the World’s Cities 2010/2011: Bridging the Urban Divide; Earthscan: London, UK, 2010. [Google Scholar]
- Satterthwaite, D.; Archer, D.; Colenbrander, S.; Dodman, D.; Hardoy, J.; Mitlin, D.; Patel, S. Building resilience to climate change in informal settlements. One Earth 2020, 2, 143–156. [Google Scholar] [CrossRef] [Green Version]
- Fawaz, M. Towards the right to the city in informal settlements. In Locating Right to the City in the Global South; Samara, T.R., He, S., Chen, G., Eds.; Routledge: London, UK, 2013; pp. 35–52. [Google Scholar]
- Selod, H.; Shilpi, F. Rural-urban migration in developing countries: Lessons from the literature. Reg. Sci. Urban Econ. 2021, 91, 103713. [Google Scholar] [CrossRef]
- Berner, E. Housing disablement: Market failures, haphazard policies and the global proliferation of slums. In Local Governance, Economic Development and Institutions; Gómez, G.M., Knorringa, P., Eds.; Springer: Berlin/Heidelberg, Germany, 2016; pp. 98–117. [Google Scholar] [CrossRef]
- Alsayyad, N. Urban Informality as a “New”Way of Life. In Urban Informality: Transnational Perspectives from the Middle East, Latin America, and South Asia; Alsayyad, N., Roy, A., Eds.; Lexington Books: Washington, DC, USA, 2004; pp. 7–32. [Google Scholar]
- Simone, A. Cities of the Global South. Annu. Rev. Sociol. 2020, 46, 603–622. [Google Scholar] [CrossRef]
- McFarlane, C. Sanitation in Mumbai’s Informal Settlements: State, ‘Slum’, and Infrastructure. Environ. Plan. A Econ. Space 2008, 40, 88–107. [Google Scholar] [CrossRef] [Green Version]
- Doberstein, B.; Stager, H. Towards guidelines for post-disaster vulnerability reduction in informal settlements. Disasters 2013, 37, 28–47. [Google Scholar] [CrossRef]
- McCartney, S.; Krishnamurthy, S. Neglected? Strengthening the Morphological Study of Informal Settlements. SAGE Open 2018, 8, 215824401876037. [Google Scholar] [CrossRef] [Green Version]
- Kamalipour, H. Mapping Urban Interfaces: A Typology of Public/Private Interfaces in Informal Settlements. Spaces Flows Int. J. Urban ExtraUrban Stud. 2017, 8, 1–12. [Google Scholar] [CrossRef]
- Dovey, K.; van Oostrum, M.; Chatterjee, I.; Shafique, T. Towards a morphogenesis of informal settlements. Habitat Int. 2020, 104, 102240. [Google Scholar] [CrossRef]
- Ulack, R. The Role of Urban Squatter Settlements. Ann. Assoc. Am. Geogr. 1978, 68, 535–550. [Google Scholar] [CrossRef]
- Rodwin, L. Shelter, Settlement & Development; Taylor & Francis Group: Oxfordshire, UK, 2022; p. 498. [Google Scholar]
- Hernandez, J. Production, use and language of open spaces in popular settlements, two case studies from Bogotá. Forum Ej. 2009, 9, 31–48. [Google Scholar]
- Ward, P.M. Latin America’s “Innerburbs”: Towards a new generation of housing policies for low-income consolidated self-help settlements. In Housing Policy in Latin American Cities; Routledge: London, UK, 2015; pp. 21–39. [Google Scholar]
- Zhang, L.; Zhao, S.X.; Tian, J.P. Self-help in housing and chengzhongcun in China’s urbanization. Int. J. Urban Reg. Res. 2003, 27, 912–937. [Google Scholar] [CrossRef]
- Huchzermeyer, M.; Karam, A.; Maina, M. Informal settlements. In Changing Space, Changing City: Johannesburg after Apartheid; Harrison, P., Gotz, G., Todes, A., Wray, C., Eds.; Wits University Press: Johannesburg, South Africa, 2014; pp. 154–175. [Google Scholar] [CrossRef]
- Rasmussen, M.I. The power of informal settlements. The case of Dar es Salaam, Tanzania. Planum—J. Urban. 2013, 1, 26. [Google Scholar]
- Alliance, C. Cities without Slums: Action Plan for Moving Slum Upgrading to Scale; Cities Alliance: Washington, DC, USA, 1999. [Google Scholar]
- UN-Habitat. Enhancing Urban Safety and Security: Global Report on Human Settlements 2007; Routledge: London, UK, 2012. [Google Scholar]
- Mohanty, M. Squatter settlements and slums and sustainable development. In Sustainable Cities and Communities. Encyclopedia of the UN Sustainable Development Goals; Filho, W.L., Azul, A.M., Brandli, L., Özuyar, P.G., Wall, T., Eds.; Springer: Cham, Switzerland, 2020. [Google Scholar] [CrossRef] [Green Version]
- Eckstein, S. Urbanization revisited: Inner-city slum of hope and squatter settlement of despair. World Dev. 1990, 18, 165–181. [Google Scholar] [CrossRef]
- Obudho, R.; Aduwo, G. Slum and squatter settlements in urban centres of Kenya: Towards a planning strategy. Neth. J. Hous. Environ. Res. 1989, 4, 17–29. [Google Scholar] [CrossRef]
- Arefi, M. Revisiting the “Informal Settlement” Phenomenon. In Learning from Informal Settlements in Iran; Palgrave Macmillan: Cham, Switzerland, 2018; pp. 9–21. [Google Scholar] [CrossRef]
- Ishtiyaq, M.; Kumar, S. Typology of informal settlements and distribution of slums in the NCT, Delhi. J. Contemp. India Stud. Space Soc. 2011, 1, 37–46. [Google Scholar] [CrossRef]
- Gilbert, A. Pirates and invaders: Land acquisition in urban Colombia and Venezuela. World Dev. 1981, 9, 657–678. [Google Scholar] [CrossRef]
- van Gelder, J.L. Paradoxes of Urban Housing Informality in the Developing World. Law Soc. Rev. 2013, 47, 493–522. [Google Scholar] [CrossRef]
- Dovey, K.; King, R. Forms of informality: Morphology and visibility of informal settlements. Built Environ. 2011, 37, 11–29. [Google Scholar] [CrossRef] [Green Version]
- Hasan, A.; Vaidya, C. Two approaches to the improvement of low-income urban areas—Madras and Orangi. Habitat Int. 1986, 10, 225–234. [Google Scholar] [CrossRef]
- Khan, M.; Wu, Q.; Yan, S.; Peng, J. Factors Affecting Urban Resilience and Sustainability: Case of Slum Dwellers in Islamabad, Pakistan. J. Urban Plan. Dev. 2021, 147, 04021053. [Google Scholar] [CrossRef]
- Wajahat, F. Perceptions of tenure security in a squatter settlement in Lahore, Pakistan. In Transforming Asian Cities: Intellectual impasse, Asianizing Space, and Emerging Translocalities; Perera, N., Tang, W.S., Eds.; Routledge: London, UK, 2012; pp. 137–147. [Google Scholar]
- Rana, I.A.; Bhatti, S.S. Lahore, Pakistan–Urbanization challenges and opportunities. Cities 2018, 72, 348–355. [Google Scholar] [CrossRef]
- Malik, S.; Roosli, R.; Tariq, F. Investigation of informal housing challenges and issues: Experiences from slum and squatter of Lahore. J. Hous. Built Environ. 2020, 35, 143–170. [Google Scholar] [CrossRef]
- Marshall, S.; Çalişkan, O. A Joint Framework for Urban Morphology and Design. Built Environ. 2011, 37, 409–426. [Google Scholar] [CrossRef]
- Hillier, B.; Greene, M.; Desyllas, J. Self-generated Neighbourhoods: The role of urban form in the consolidation of informal settlements. Urban Des. Int. 2000, 5, 61–96. [Google Scholar] [CrossRef]
- Elfouly, H.A. Adapting a composite street connectivity index as a spatial tool for approaching informal settlements in Egypt; Applied to Giza City. Int. J. Dev. Sustain. 2017, 6, 712–727. [Google Scholar]
- Taubenböck, H.; Kraff, N.J. The physical face of slums: A structural comparison of slums in Mumbai, India, based on remotely sensed data. J. Hous. Built Environ. 2014, 29, 15–38. [Google Scholar] [CrossRef]
- Kamalipour, H. Improvising Places: The Fluidity of Space in Informal Settlements. Sustainability 2020, 12, 2293. [Google Scholar] [CrossRef] [Green Version]
- Sharma, A.; Tiwari, G.; Rao, K.R. Identifying mixed use indicators for including informal settlements as a distinct land use: Case study of Delhi. Transp. Res. Procedia 2020, 48, 1918–1930. [Google Scholar] [CrossRef]
- Kamalipour, H. Forms of informality and adaptations in informal settlements. ArchNet-IJAR Int. J. Archit. Res. 2016, 10, 60. [Google Scholar] [CrossRef]
- Manaugh, K.; Kreider, T. What is mixed use? Presenting an interaction method for measuring land use mix. J. Transp. Land Use 2013, 6, 63–72. [Google Scholar] [CrossRef]
- Ewing, R.; Meakins, G.; Bjarnson, G.; Hilton, H. Transportation and Land Use. In Making Healthy Places: Designing and Building for Health, Well-Being, and Sustainability; Dannenberg, A.L., Frumkin, H., Jackson, R.J., Eds.; Island Press/Center for Resource Economics: Washington, DC, USA, 2011; pp. 149–169. [Google Scholar] [CrossRef]
- Hidayati, I.; Yamu, C.; Tan, W. Realised pedestrian accessibility of an informal settlement in Jakarta, Indonesia. J. Urban. Int. Res. Placemaking Urban Sustain. 2021, 14, 434–456. [Google Scholar] [CrossRef]
- Chiodelli, F.; Mazzolini, A. Inverse planning in the cracks of formal land use regulation: The bottom-up regularisation of informal settlements in Maputo, Mozambique. Plan. Theory Pract. 2019, 20, 165–181. [Google Scholar] [CrossRef]
- Abbott, J.; Douglas, D. The use of longitudinal spatial analyses of informal settlements in urban development planning. Dev. South. Afr. 2003, 20, 3–19. [Google Scholar] [CrossRef]
- Legarias, T.M.; Nurhasana, R.; Irwansyah, E. Building Density Level of Urban Slum Area in Jakarta. Geosfera Indones. 2020, 5, 268–287. [Google Scholar] [CrossRef]
- Alexander, E.R.; Reed, K.D.; Murphy, P. Density Measures and Their Relation to Urban Form; Center for Architecture and Urban Planning Research, University of Wisconsin: Madison, WI, USA, 1988. [Google Scholar]
- Visagie, J.; Turok, I. Getting urban density to work in informal settlements in Africa. Environ. Urban. 2020, 32, 351–370. [Google Scholar] [CrossRef]
- Dave, S. High urban densities in developing countries: A sustainable solution? Built Environ. 2010, 36, 9–27. [Google Scholar] [CrossRef]
- García-Villalba, O.C. Shaping informality: The role of street-based strategies in revitalizing informal and low-income areas. In Proceedings of the 7th International Urban Design Conference: Designing Productive Cities, Adelaide, South Australia, 1–3 September 2014; pp. 18–34. [Google Scholar]
- Kamalipour, H. Urban Morphologies in Informal Settlements: A Case Study. Contour J. 2016, 1. Available online: https://contourjournal.org/index.php/contour/article/view/61 (accessed on 14 June 2022).
- UN-Habitat. Streets as Tools for Urban Transformation in Slums: A Street-Led Approach to Citywide Slum Upgrading; UN-Habitat: Nairobi, Kenya, 2012; ISBN 978-92-1-132606-2. [Google Scholar]
- Hernández-Garcia, J. Open spaces in informal settlements in Bogotá, expressions of attachment and identity. Role Place Identity Percept. Underst. Des. Built Environ. Bentham Sci. 2012, 92–106. Available online: https://books.google.be/books?hl=en&lr=&id=WM2e9gV9UxMC&oi=fnd&pg=PA92&dq=2.%09Hern%C3%A1ndez-Garcia,+J.+Open+spaces+in+informal+settlements+in+Bogot%C3%A1,+expressions+of+attachment+and+identity.+Role+Place+Identity+Percept.+Underst.+Des.+Built+Environ.+&ots=FKE4e6-kna&sig=3q20EXpU4QHKJWYUdG_x2CXMIOs&redir_esc=y#v=onepage&q&f=false (accessed on 14 June 2022).
- Waller, M. An exploration of spatial appropriation in a series of informal settlements in Bangkok, Thailand. In Urban Space: Experiences and Reflections from the Global South; García, J.H., Cárdenas-O’Byrne, S., Adolfo García Jerez, A., Beza, B.B., Eds.; Sello Editorial Javeriano, 2018; pp. 337–362. Available online: https://books.google.be/books?hl=en&lr=&id=utGaDwAAQBAJ&oi=fnd&pg=PA337&dq=3.%09Waller,+M.+An+exploration+of+spatial+appropriation+in+a+series+of+informal+settlements+in+Bangkok,+Thailand.+In+Urban+Space:+Experiences+and+Reflections+from+the+Global+South&ots=yy4O3VRhFW&sig=Kyx5L4OoP1PYyKiBTJctGZ-rzYc&redir_esc=y#v=onepage&q&f=false (accessed on 14 June 2022).
- Hosni, L.; Afify, A.; Mohsen, H.; Youssef, M. Proposing guidelines to upgrade the open public spaces in the informal settlements. Archit. Plan. J. (APJ) 2022, 28, 3. [Google Scholar] [CrossRef]
- Wekesa, B.W.; Steyn, G.S.; Otieno, F.F. A review of physical and socio-economic characteristics and intervention approaches of informal settlements. Habitat Int. 2011, 35, 238–245. [Google Scholar] [CrossRef]
- UN-Habitat. SDG Indicator 11.1.1 Training Module: Adequate Housing and Slum Upgrading; UN-Habitat: Nairobi, Kenya, 2018. [Google Scholar]
- Marais, L.; Ntema, J. The upgrading of an informal settlement in South Africa: Two decades onwards. Habitat Int. 2013, 39, 85–95. [Google Scholar] [CrossRef]
- Hasan, A. Orangi Pilot Project: The expansion of work beyond Orangi and the mapping of informal settlements and infrastructure. Environ. Urban. 2006, 18, 451–480. [Google Scholar] [CrossRef]
- Hegazy, I.R. Informal settlement upgrading policies in Egypt: Towards improvement in the upgrading process. J. Urban. Int. Res. Placemaking Urban Sustain. 2016, 9, 254–275. [Google Scholar] [CrossRef]
- Kyessi, A.G. Enhancing Securinty of Land Tenure in Informal Settlements: The Case of Wat-Human Settlements Trust in Hanna Nassif Settlement, Dar es Salaam Tanzania. Utafiti J. 2018, 8. Available online: https://journals.udsm.ac.tz/index.php/uj/article/view/1330 (accessed on 14 June 2022).
- Durand-Lasserve, A. Informal settlements and the Millennium Development Goals: Global policy debates on property ownership and security of tenure. Glob. Urban Dev. 2006, 2, 1–15. [Google Scholar]
- Ribeiro, G. An Ecological Approach to the Study of Urban Spaces: The Case of a Shantytown in Brasilia. J. Archit. Plan. Res. 1997, 14, 289–300. [Google Scholar]
- Kamalipour, H.; Dovey, K. Incremental Urbanisms. In Mapping Urbanities: Morphologies, Flows, Possibilities; Dovey, K., Pafka, E., Ristic, M., Eds.; Routledge: New York, NY, USA, 2018; pp. 249–267. [Google Scholar] [CrossRef]
- Statistics, P.B.o. Provisional Summary Results of 6th Population and Housing Census (2017); Government of Pakistan: Pakistan, 2017. Available online: https://www.pbs.gov.pk/content/final-results-census-2017 (accessed on 14 June 2022).
- Kamalipour, H.; Dovey, K. Incremental production of urban space: A typology of informal design. Habitat Int. 2020, 98, 102133. [Google Scholar] [CrossRef]
- Jones, P. Distance and proximity matters: Understanding housing transformation through micro-morphology in informal settlements. Int. J. Hous. Policy 2021, 21, 169–195. [Google Scholar] [CrossRef]
- Scheer, B.C. Typology and Urban Transformation. In The Evolution of Urban Form: Typology for Planners and Architects; Routledge: London, UK, 2017; pp. 47–60. [Google Scholar] [CrossRef]
- Banerjee, B. Security of tenure in Indian cities. Hold. Ground Secur. Tenure Urban Poor Dev. Countries. Lond. Earthscan Publ. Ltd. 2002, 37–58. Available online: https://www.researchgate.net/profile/Banashree-Banerjee/publication/287661684_Security_of_tenure_in_Indian_cities/links/5e6f52fa92851c6ba7066cca/Security-of-tenure-in-Indian-cities.pdf (accessed on 14 June 2022).
- Durand-Lasserve, A.; Clerc, V. Regularization and Integration of Irregular Settlements: Lessons from Experience; UNDP, UN-Habitat, World Bank, Urban Management Program (UMP): Nairobi, Kenya, 1996; Volume 6, p. 113. [Google Scholar]
- OpenStreetMap. Available online: https://www.openstreetmap.org/ (accessed on 15 June 2022).
- Punjab, G.O. Lahore Ring Road Authority. Available online: https://lrra.punjab.gov.pk/background (accessed on 14 June 2022).
- Punjab, G.O. Lahore Development Authority. Available online: https://lda.gop.pk/website (accessed on 14 June 2022).
- Punjab, G.O. The Punjab Katchi Abadi Act. Available online: http://punjablaws.gov.pk/laws/385.html (accessed on 14 June 2022).
- Pakistan, G.O. National Reference Manual on Planning and Infrastructure Standards. Available online: https://pt.scribd.com/document/457528871/National-Reference-Manual-on-Planning-and-Infrastructure-Standards (accessed on 14 June 2022).
- Authority, L.D. Land Use Regulations. Available online: https://lda.gop.pk/website/images/LDA_Land_Use_Regulations_2020_dated_07_10_2020.pdf (accessed on 14 June 2022).
- Mottelson, J.; Venerandi, A. A fine-grain multi-indicator analysis of the urban form of five informal settlements in East Africa. Urban Sci. 2020, 4, 31. [Google Scholar] [CrossRef]
- Venerandi, A.; Mottelson, J. A taxonomy of informality: Exploring block types in five informal settlements in East Africa. In Proceedings of the ISUF 2020 Virtual Conference Proceedings, Salt Lake City, UT, USA, 31 January–20 September 2020. [Google Scholar]
- Elfouly, H.A. Exploring the heterogeneity of the street pattern of informal settlements on agricultural lands in Giza Egypt. Int. J. Dev. Sustain. 2017, 6, 1418–1433. [Google Scholar]
- UN-Habitat. Slums of the World: The Face of Urban Poverty in the New Millennium; UN-Habitat: Nairobi, Kenya, 2003. [Google Scholar]
- Ratti, C.; Baker, N.; Steemers, K. Energy consumption and urban texture. Energy Build. 2005, 37, 762–776. [Google Scholar] [CrossRef]
- van Oostrum, M. Access, density and mix of informal settlement: Comparing urban villages in China and India. Cities 2021, 117, 103334. [Google Scholar] [CrossRef]
- Kumar, R. FAR, Density and Impact on Urban Morphology. Int. Res. J. Eng. Technol. 2017, 4, 1301–1306. [Google Scholar]
- Hernández-García, J.; Yunda, J.G. Untangling the vitality of public spaces of Bogotá’s informal settlements. Urban Space Exp. Reflect. Glob. South 2018, 263. Available online: https://books.google.be/books?hl=en&lr=&id=utGaDwAAQBAJ&oi=fnd&pg=PA263&dq=Untangling+the+vitality+of+public+spaces+of+Bogot%C3%A1%E2%80%99s+informal+settlements.&ots=yy4O3VScGY&sig=4NUAAgE8lzemhnI9hfSFhGOXVyg&redir_esc=y#v=onepage&q=Untangling%20the%20vitality%20of%20public%20spaces%20of%20Bogot%C3%A1%E2%80%99s%20informal%20settlements.&f=false (accessed on 14 June 2022).
- Venerandi, A.; Iovene, M.; Fusco, G. Exploring the similarities between informal and medieval settlements: A methodology and an application. Cities 2021, 115, 103211. [Google Scholar] [CrossRef]
- Pont, M.Y.B.; Haupt, P.A. Spacematrix. Space, Density and Urban Form; NAi Publishers: Rotterdam, The Netherlands, 2010. [Google Scholar]
- Association, A.P. Floor Area Ratio: PAS Report 111. 2022. Available online: https://www.planning.org/pas/reports/report111.htm (accessed on 14 June 2022).
- Arefi, M. Order in informal settlements: A case study of Pinar, Istanbul. Built Environ. 2011, 37, 42–56. [Google Scholar] [CrossRef]
- Nadeem, M.; Aziz, A.; Al-Rashid, M.A.; Tesoriere, G.; Asim, M.; Campisi, T. Scaling the Potential of Compact City Development: The Case of Lahore, Pakistan. Sustainability 2021, 13, 5257. [Google Scholar] [CrossRef]
- Arifwidodo, S.D.; Perera, R. Quality of life and compact development policies in Bandung, Indonesia. Appl. Res. Qual. Life 2011, 6, 159–179. [Google Scholar] [CrossRef]
- Kotharkar, R.; Bahadure, P.; Sarda, N. Measuring compact urban form: A case of Nagpur City, India. Sustainability 2014, 6, 4246–4272. [Google Scholar] [CrossRef] [Green Version]
- Mutyambizi, C.; Mokhele, T.; Ndinda, C.; Hongoro, C. Access to and Satisfaction with Basic Services in Informal Settlements: Results from a Baseline Assessment Survey. Int. J. Environ. Res. Public Health 2020, 17, 4400. [Google Scholar] [CrossRef] [PubMed]
- Kamalipour, H.; Iranmanesh, A. Morphogenesis of emerging settlements: Mapping incremental urbanism. Land 2021, 10, 89. [Google Scholar] [CrossRef]
- Kamalipour, H.; Peimani, N. Towards an informal turn in the built environment education: Informality and urban design pedagogy. Sustainability 2019, 11, 4163. [Google Scholar] [CrossRef] [Green Version]
- Hofmann, P.; Taubenböck, H.; Werthmann, C. Monitoring and modelling of informal settlements-A review on recent developments and challenges. In Proceedings of the 2015 Joint Urban Remote Sensing Event (JURSE), Lausanne, Switzerland, 30 March–1 April 2015; pp. 1–4. [Google Scholar]


| Indicators | Literature References | ||||||||||
|---|---|---|---|---|---|---|---|---|---|---|---|
| Main Indicators | Subindicators | [84,85] | [43] | [86] | [87] | [88] | [89] | [40] | [90] | [91] | [92] |
| Diversity | Land-Use Diversity (LUD) | x | x | ||||||||
| Building Densities | Coverage Ratio (CR) | x | x | x | x | x | x | ||||
| Floor-Area Ratio (FAR) | x | x | x | ||||||||
| Surface Area-to-Volume Ratio (SAVR) | x | x | |||||||||
| Connectivity | Average Node Degree (AND) | x | x | x | x | ||||||
| Street Density (SD) | x | x | x | ||||||||
| Open Space Ratio | Private Space Ratio (PrSR) | x | |||||||||
| Public Space Ratio (PuSR) | x | x | |||||||||
| Infrastructural Quality | Sanitation | x | x | ||||||||
| Water Supply | x | x | |||||||||
| Electricity | x | ||||||||||
| Waste Management | x | x | |||||||||
| Characteristics/Case Studies | Zia Colony | Hope Colony | Shamspura Colony | ||||
|---|---|---|---|---|---|---|---|
| Freq. | % | Freq. | % | Freq. | % | ||
| Units | 204 | 268 | 404 | ||||
| Sample Size | 67 | 73 | 80 | ||||
| Age | <20 | 12 | 18% | 10 | 14% | 10 | 13% |
| 20–35 | 36 | 53% | 25 | 34% | 24 | 30% | |
| 36–50 | 16 | 24% | 32 | 44% | 37 | 46% | |
| >50 | 3 | 5% | 6 | 8% | 9 | 11% | |
| Education | Illiterate | 35 | 52% | 29 | 40% | 26 | 32% |
| Primary | 27 | 40% | 23 | 32% | 27 | 34% | |
| Secondary | 4 | 6% | 13 | 18% | 16 | 20% | |
| Graduate | 1 | 2% | 7 | 10% | 11 | 14% | |
| Occupation | Laborer | 39 | 58% | 35 | 48% | 38 | 48% |
| Own Business | 19 | 28% | 23 | 32% | 32 | 40% | |
| Public Employee | 4 | 6% | 10 | 14% | 10 | 12% | |
| Private Employee | 5 | 8% | 4 | 6% | 3 | 4% | |
| Tenure Status | Owned | 44 | 66% | 37 | 50% | 35 | 44% |
| Leased | 9 | 14% | 15 | 20% | 13 | 16% | |
| Rented | 7 | 10% | 22 | 30% | 32 | 40% | |
Publisher’s Note: MDPI stays neutral with regard to jurisdictional claims in published maps and institutional affiliations. |
© 2022 by the authors. Licensee MDPI, Basel, Switzerland. This article is an open access article distributed under the terms and conditions of the Creative Commons Attribution (CC BY) license (https://creativecommons.org/licenses/by/4.0/).
Share and Cite
Arif, M.M.; Ahsan, M.; Devisch, O.; Schoonjans, Y. Integrated Approach to Explore Multidimensional Urban Morphology of Informal Settlements: The Case Studies of Lahore, Pakistan. Sustainability 2022, 14, 7788. https://doi.org/10.3390/su14137788
Arif MM, Ahsan M, Devisch O, Schoonjans Y. Integrated Approach to Explore Multidimensional Urban Morphology of Informal Settlements: The Case Studies of Lahore, Pakistan. Sustainability. 2022; 14(13):7788. https://doi.org/10.3390/su14137788
Chicago/Turabian StyleArif, Muhammad Mashhood, Muhammad Ahsan, Oswald Devisch, and Yves Schoonjans. 2022. "Integrated Approach to Explore Multidimensional Urban Morphology of Informal Settlements: The Case Studies of Lahore, Pakistan" Sustainability 14, no. 13: 7788. https://doi.org/10.3390/su14137788
APA StyleArif, M. M., Ahsan, M., Devisch, O., & Schoonjans, Y. (2022). Integrated Approach to Explore Multidimensional Urban Morphology of Informal Settlements: The Case Studies of Lahore, Pakistan. Sustainability, 14(13), 7788. https://doi.org/10.3390/su14137788