1. Introduction
Concrete production has a large environmental impact due both to the CO
2 emissions related to cement manufacture and to the large consumption of natural aggregates. Optimizing concrete mixture proportions is fundamental from a sustainable development perspective, as it allows for minimizing the volume fraction of cement paste for a given workability, therefore reducing the amount of cement in the mix for a given set of specifications [
1]. Another way to improve the environmental impact of concrete is to replace part of the cement with mineral admixtures or a portion of the natural aggregates with recycled ones to reduce the shortage of natural resources. Several industrial by-products, such as blast furnace slags or coal fly ashes, have been used as cement substitutes for a long time and have proven to be efficient both in the carbon footprint reduction of concrete and in the improvement of some specific properties, such as durability [
2]. Other recycled materials could be used as cement or aggregate substitutes in concrete (sugarcane bagasse ash [
3], grinded bricks [
4], recycled concrete aggregates [
5], etc.), but these materials are produced at a smaller industrial scale than classical admixtures, and deposits are much more variable. Replacing a well-known material with a new one changes the properties of concrete both at fresh and hardened states, and the optimization of the new mixture proportions is required in each case. In particular, the substitution of a concrete constituent with a recycled material very often leads to a decrease in the workability of concrete due to a lack of granular optimization of the new mixture. The experimental optimization of granular materials is expensive and takes a long time, and the laboratory optimization of concrete-containing recycled materials can only be carried out if the deposit of recycled materials is large enough for experimentation to be profitable. There are some numerical models of concrete mixture proportioning [
6], but they also require substantial experiments to determine the entry data of each constituent, and once again, they are more suited to large deposits. Having a simple and fast solution for mixture proportion optimization is therefore necessary to increase the proportion of recycled materials in concrete. In this paper, we propose a numerical model for granular mixture proportioning, attempting to fill the gap between the need for a reliable model of granular optimization and the necessity to limit the cost of experiments to feed the model. The proposed model allows comparison of the viscosity of concentrated suspensions with different granular mixture proportions. It can therefore be used to optimize the composition of the granular mixture in order to minimize the viscosity of the suspension. This could lead to a simple tool for the development of concretes containing recycled materials.
Predicting the relative viscosity (η
r = η/η
0: ratio between the viscosity of the suspension to that of the suspending fluid) of non-colloidal concentrated suspensions from their solid volume fraction is a matter of importance, both theoretically and for industrial purposes. Many models have been proposed to derive the relative viscosity from the ratio (φ/φ
m) between the solid volume fraction of particles in the suspension to their random packing fraction [
7,
8,
9,
10,
11]. The latter can either be computed from rheological experiments by measuring the viscosity of suspensions of various solid volume fractions or estimated from packing experiments with dry particles [
12]. Both methods require time-consuming experiments and are not suited to the purpose of optimization.
The increase in viscosity due to the addition of particles in a suspending fluid can be accounted for by the intrinsic viscosity (2.5 for spheres) considering hydrodynamic effects and by geometric considerations, captured by the ratio (φ/φ
m) [
10]. For a given particle geometry, the influence of the volume fraction of particles should only depend on geometric considerations. The basic idea of the model is that, for a given particle geometry (spheres in this paper), the numerical generation of a suspension of volume fraction φ is easier (i.e., less computationally expensive) for a granular system with a larger φ
m value (i.e., for a less viscous suspension). With this hypothesis, the optimization of the granular mixtures should be possible based on the generation of suspensions and not on that of packings, which is much less computationally expensive.
In
Section 2, the numerical methods used to generate and characterize monosized suspensions is described. In
Section 3, monosized suspensions of spheres of densities ranging between 0.025 and 0.5 are generated, the φ
m value of the system is identified following two different approaches and compared to the random loose packing density determined by Onoda and Liniger [
13]. In
Section 4, the numerical procedure is adapted for the generation of bidisperse suspensions, introducing particles by order of decreasing radius. The viscosity of bidisperse suspensions with size ratios 4:1 and 2:1 and of varying proportions of large particles are computed, and the optimum values are compared to experimental results from the literature.
3. Application to Suspensions of Monosized Spheres Systems
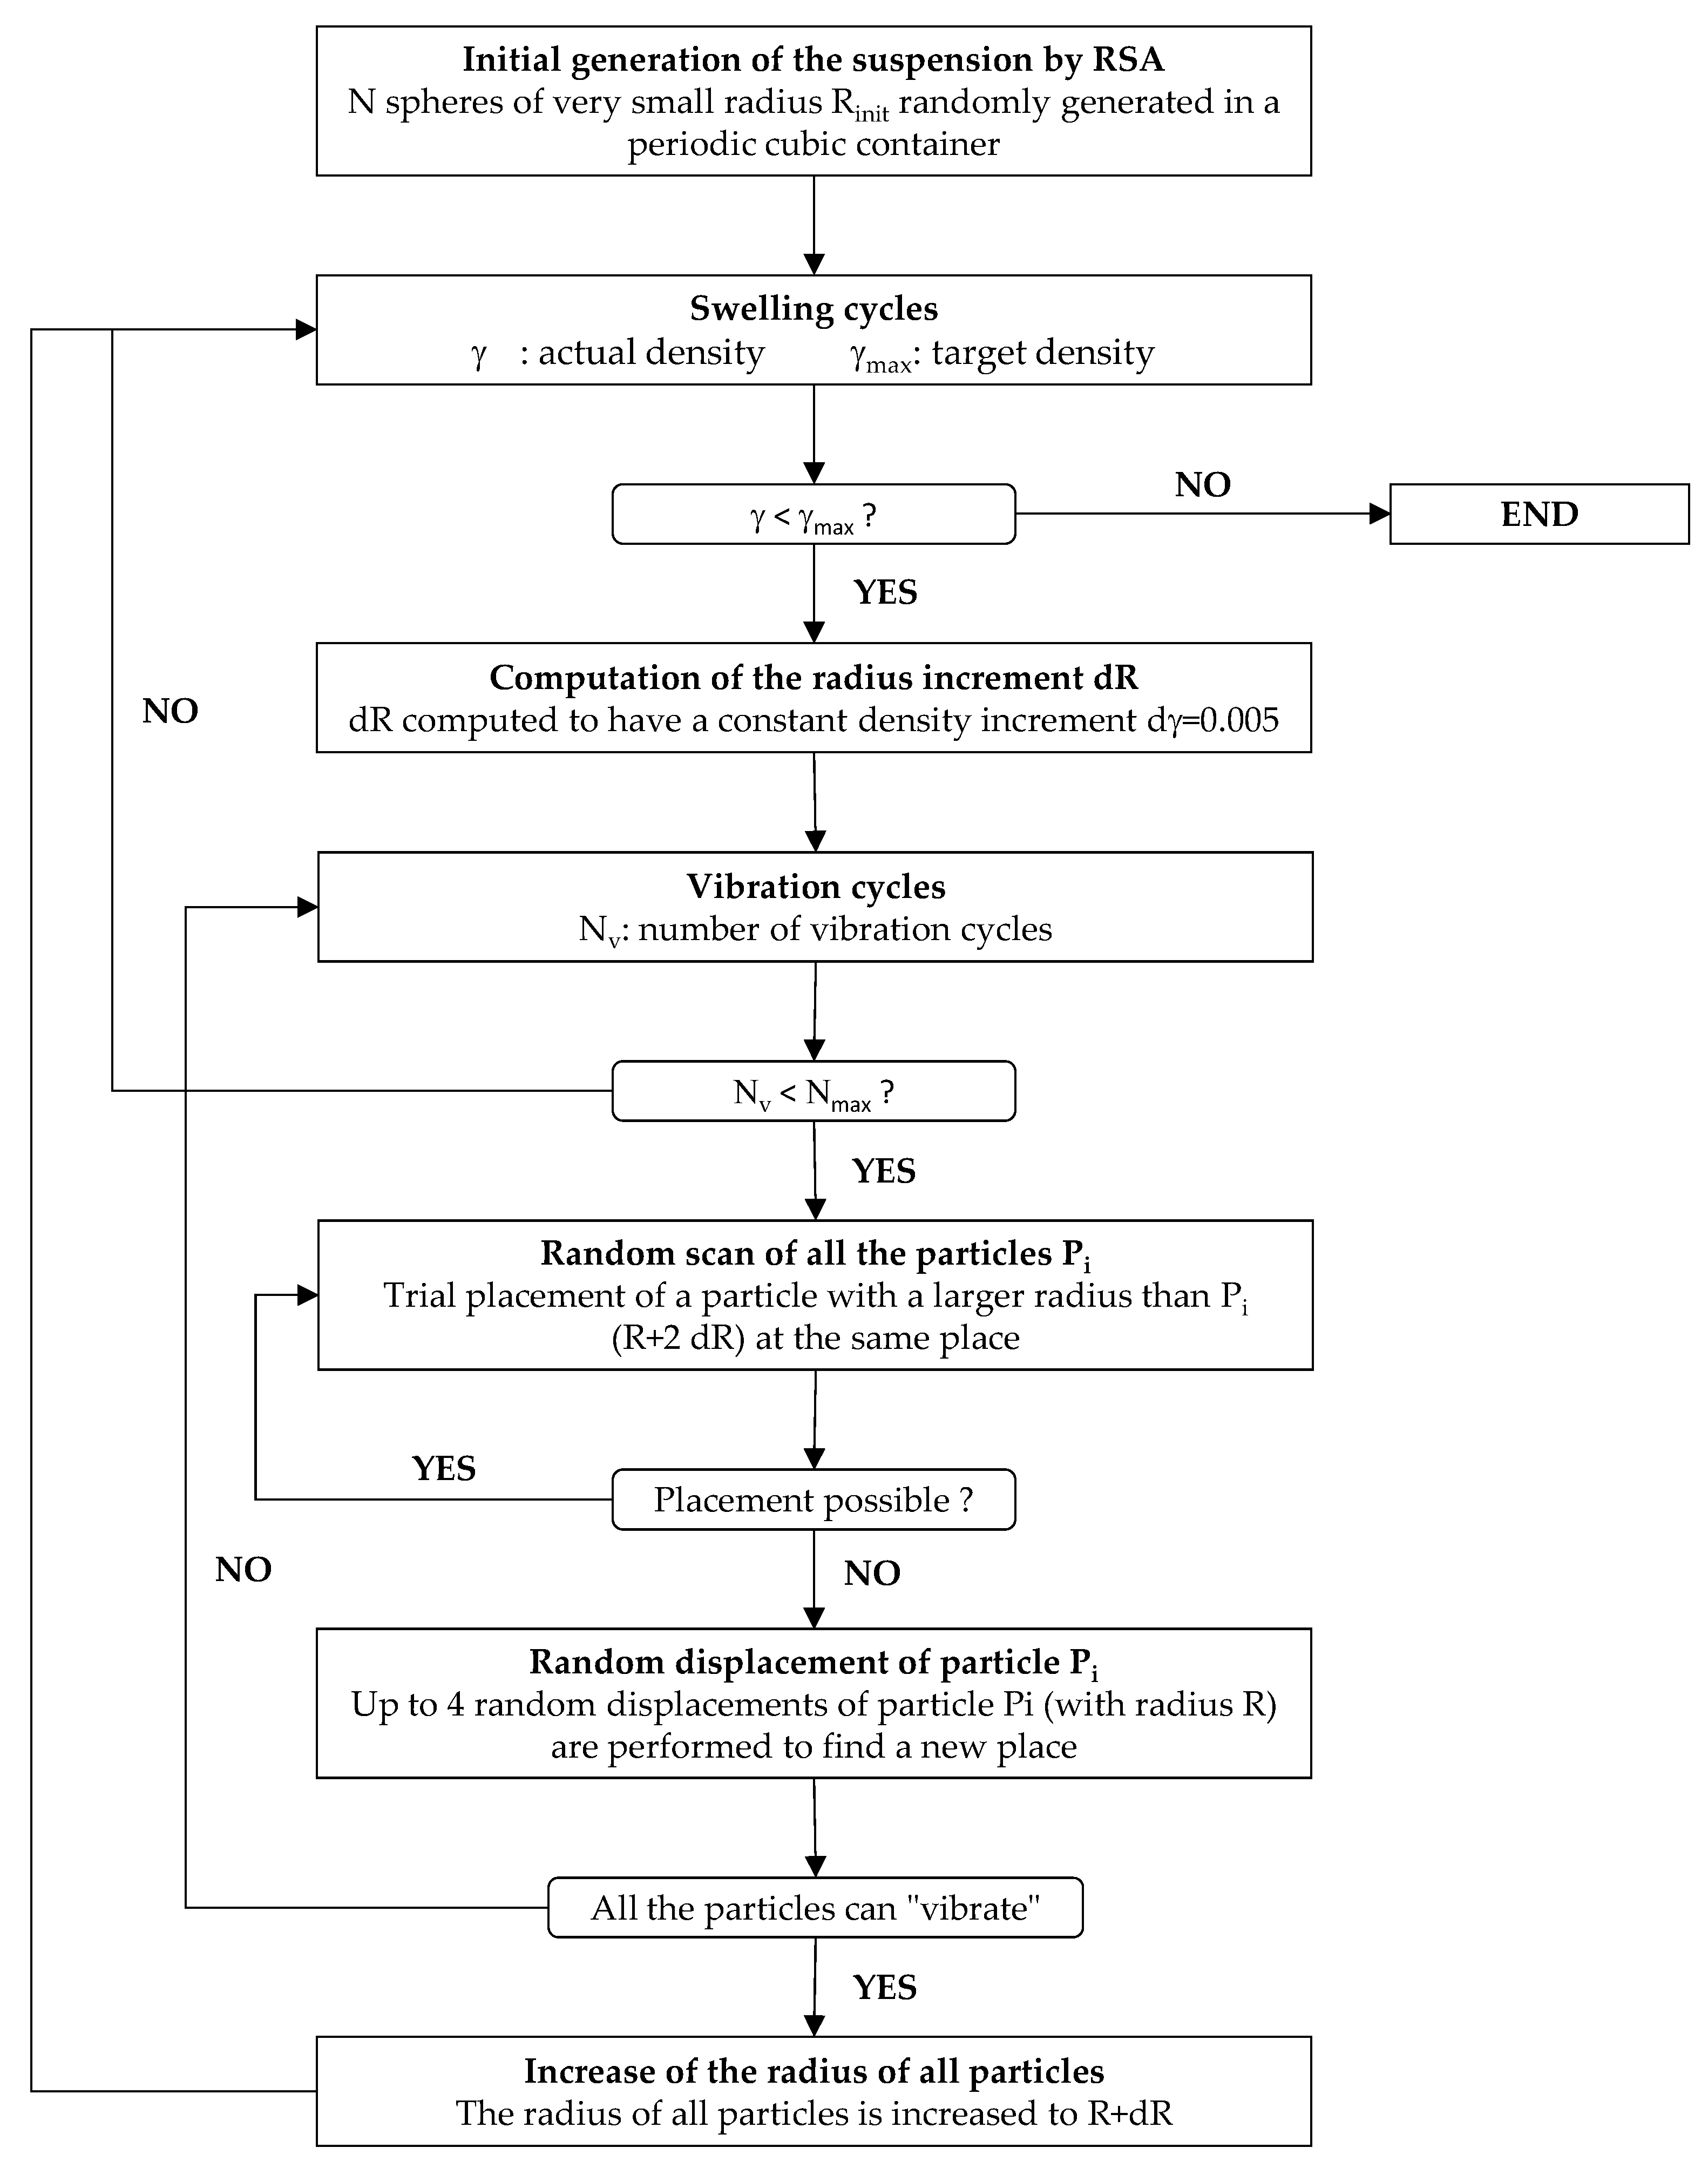
Monosized suspensions of 10,000 spherical particles have been generated in periodic cubic containers of varying sizes (depending on the target density), with solid volume fractions φ ranging from 0.025 to 0.5. All the simulations have been repeated 10 times, varying the seed number of the random generator. The loosening factor λ of each system has been computed according to the procedure described in
Section 2.2.
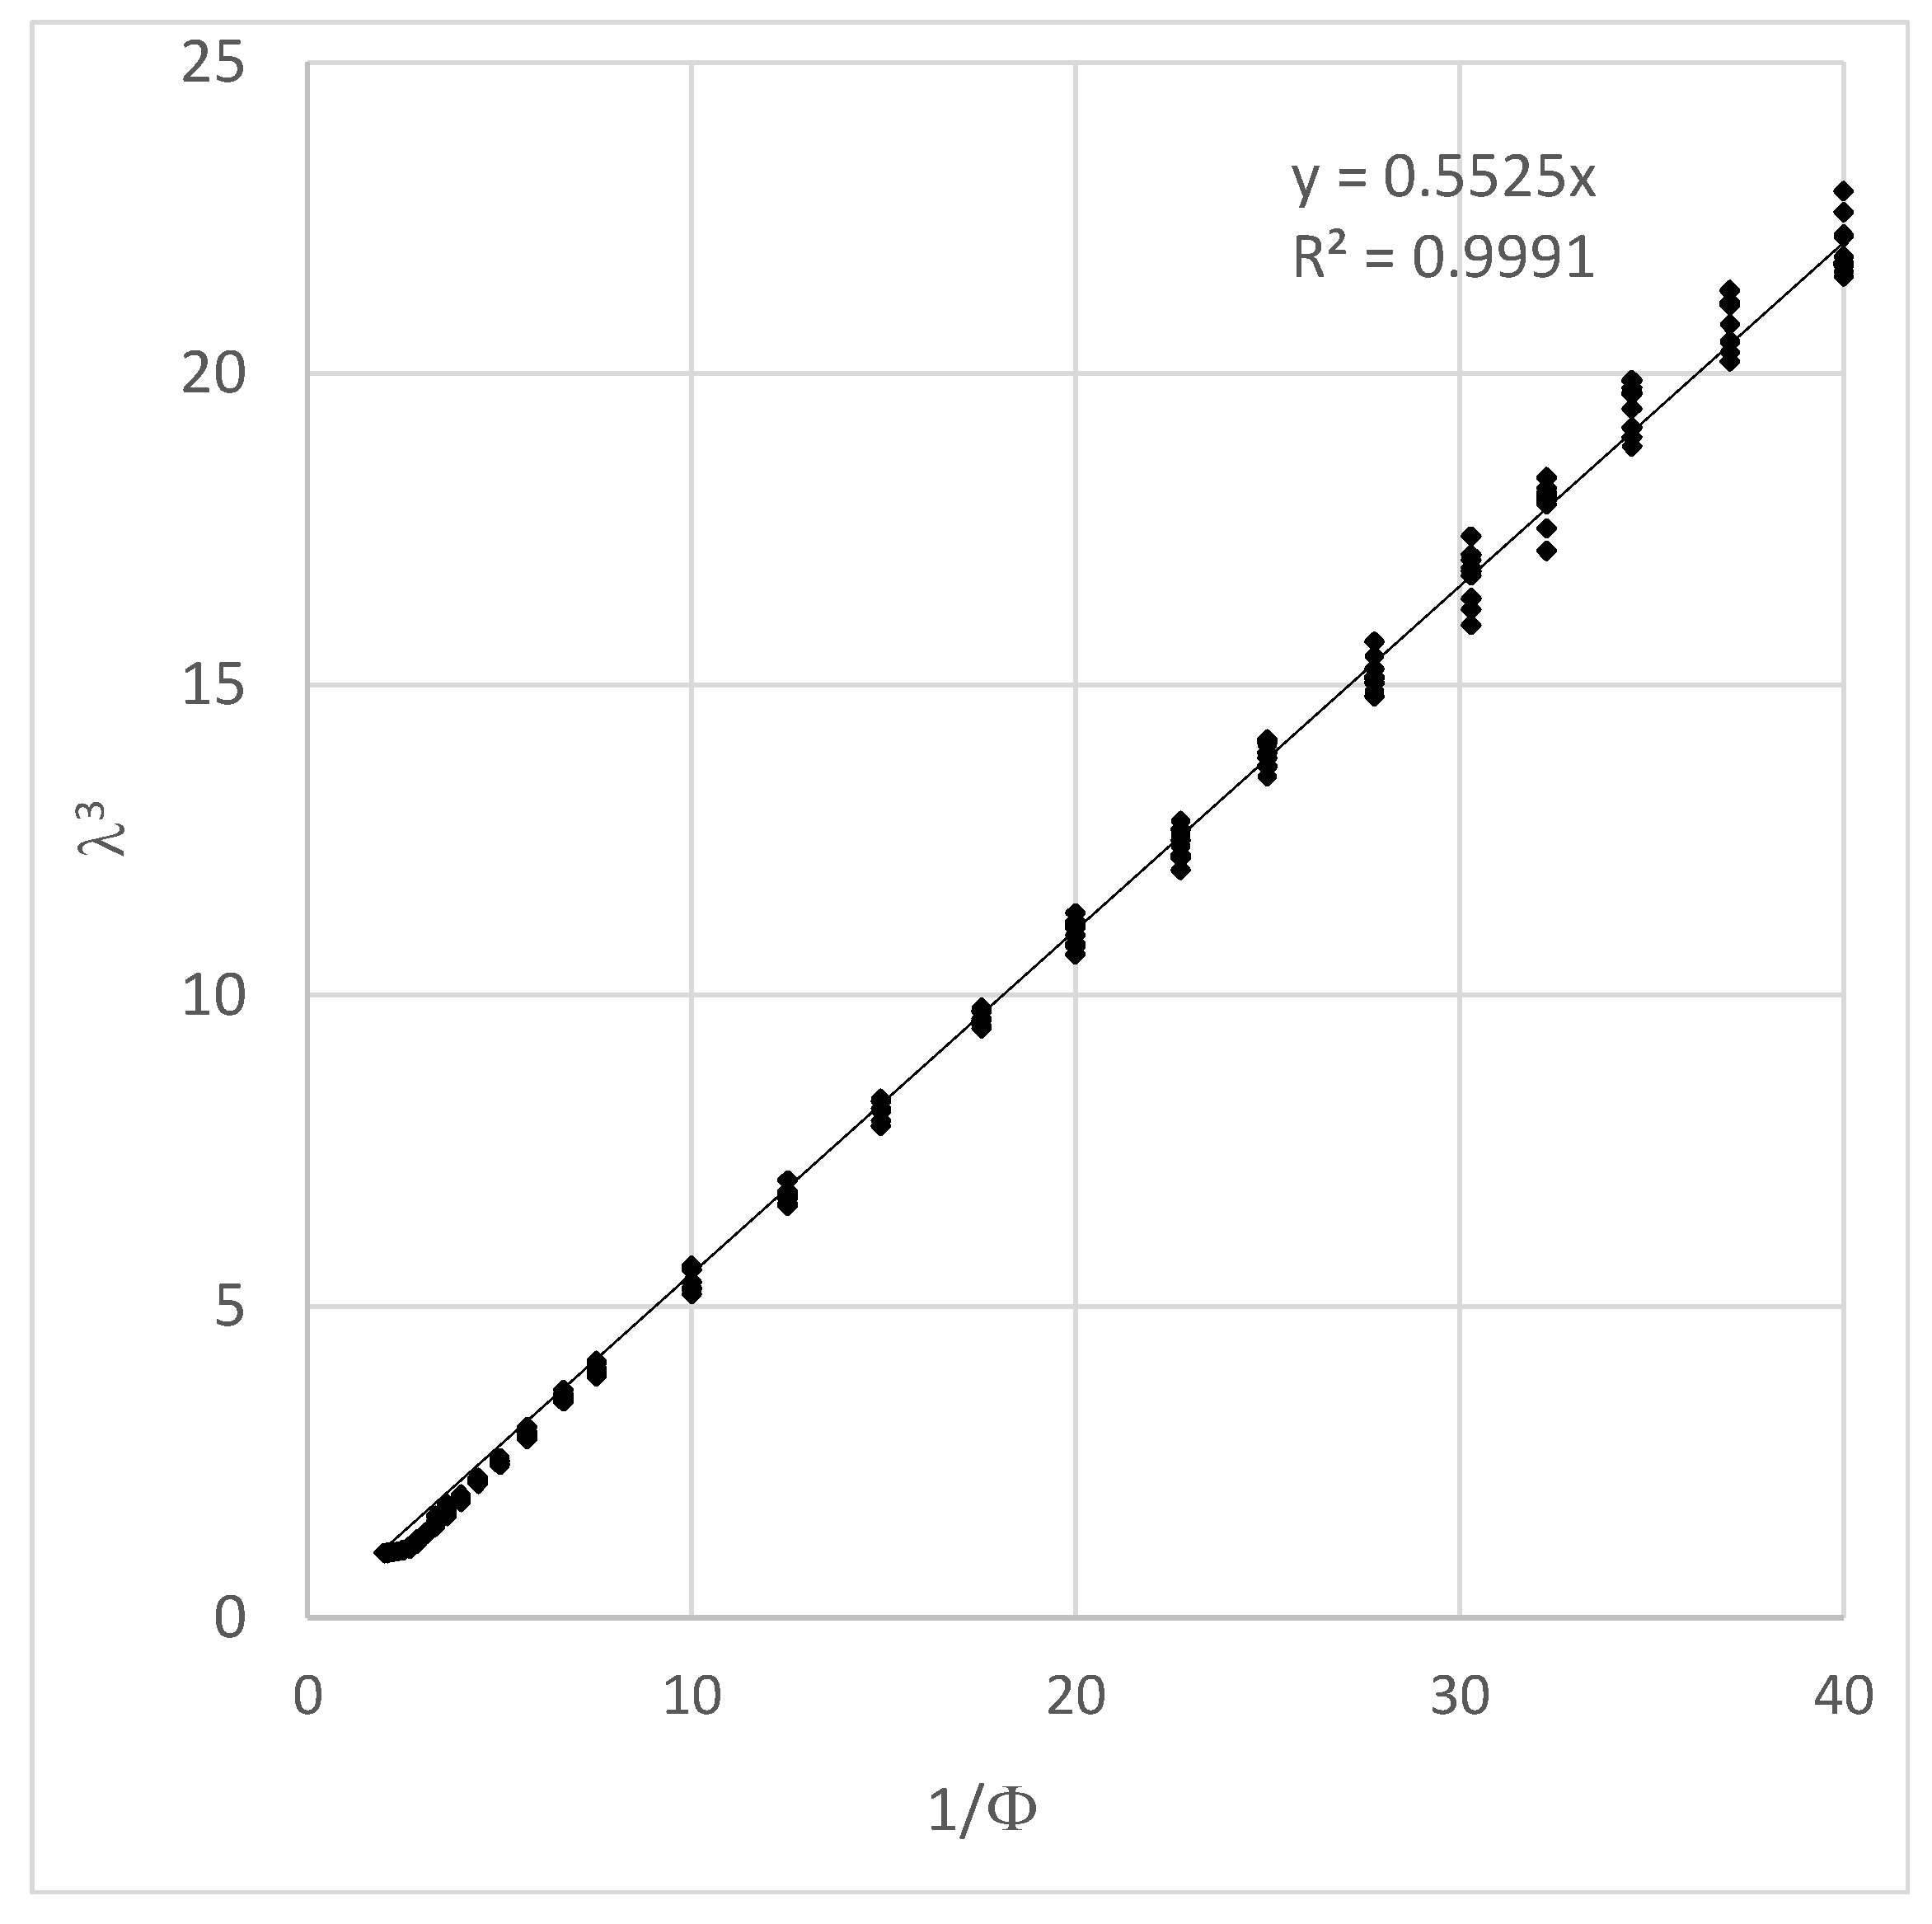
Figure 2 presents the variation of λ
3 as a function of 1/φ. As expected, a linear variation is observed, the slope of which can be identified as the packing fraction of the condensed system (φ
m). The value of φ
m identified this way (forcing the curve to pass by the origin) is 0.5525 ± 0.0010, which is very close to the random loose packing limit (0.555 ± 0.005) obtained by Onoda and Liniger [
13]. This result shows that the proposed numerical procedure can simulate suspensions of varying solid volume fraction (from 0.025 up to 0.5), and that these suspensions can be considered as dilated systems of a packing whose density is close to the random loose packing limit.
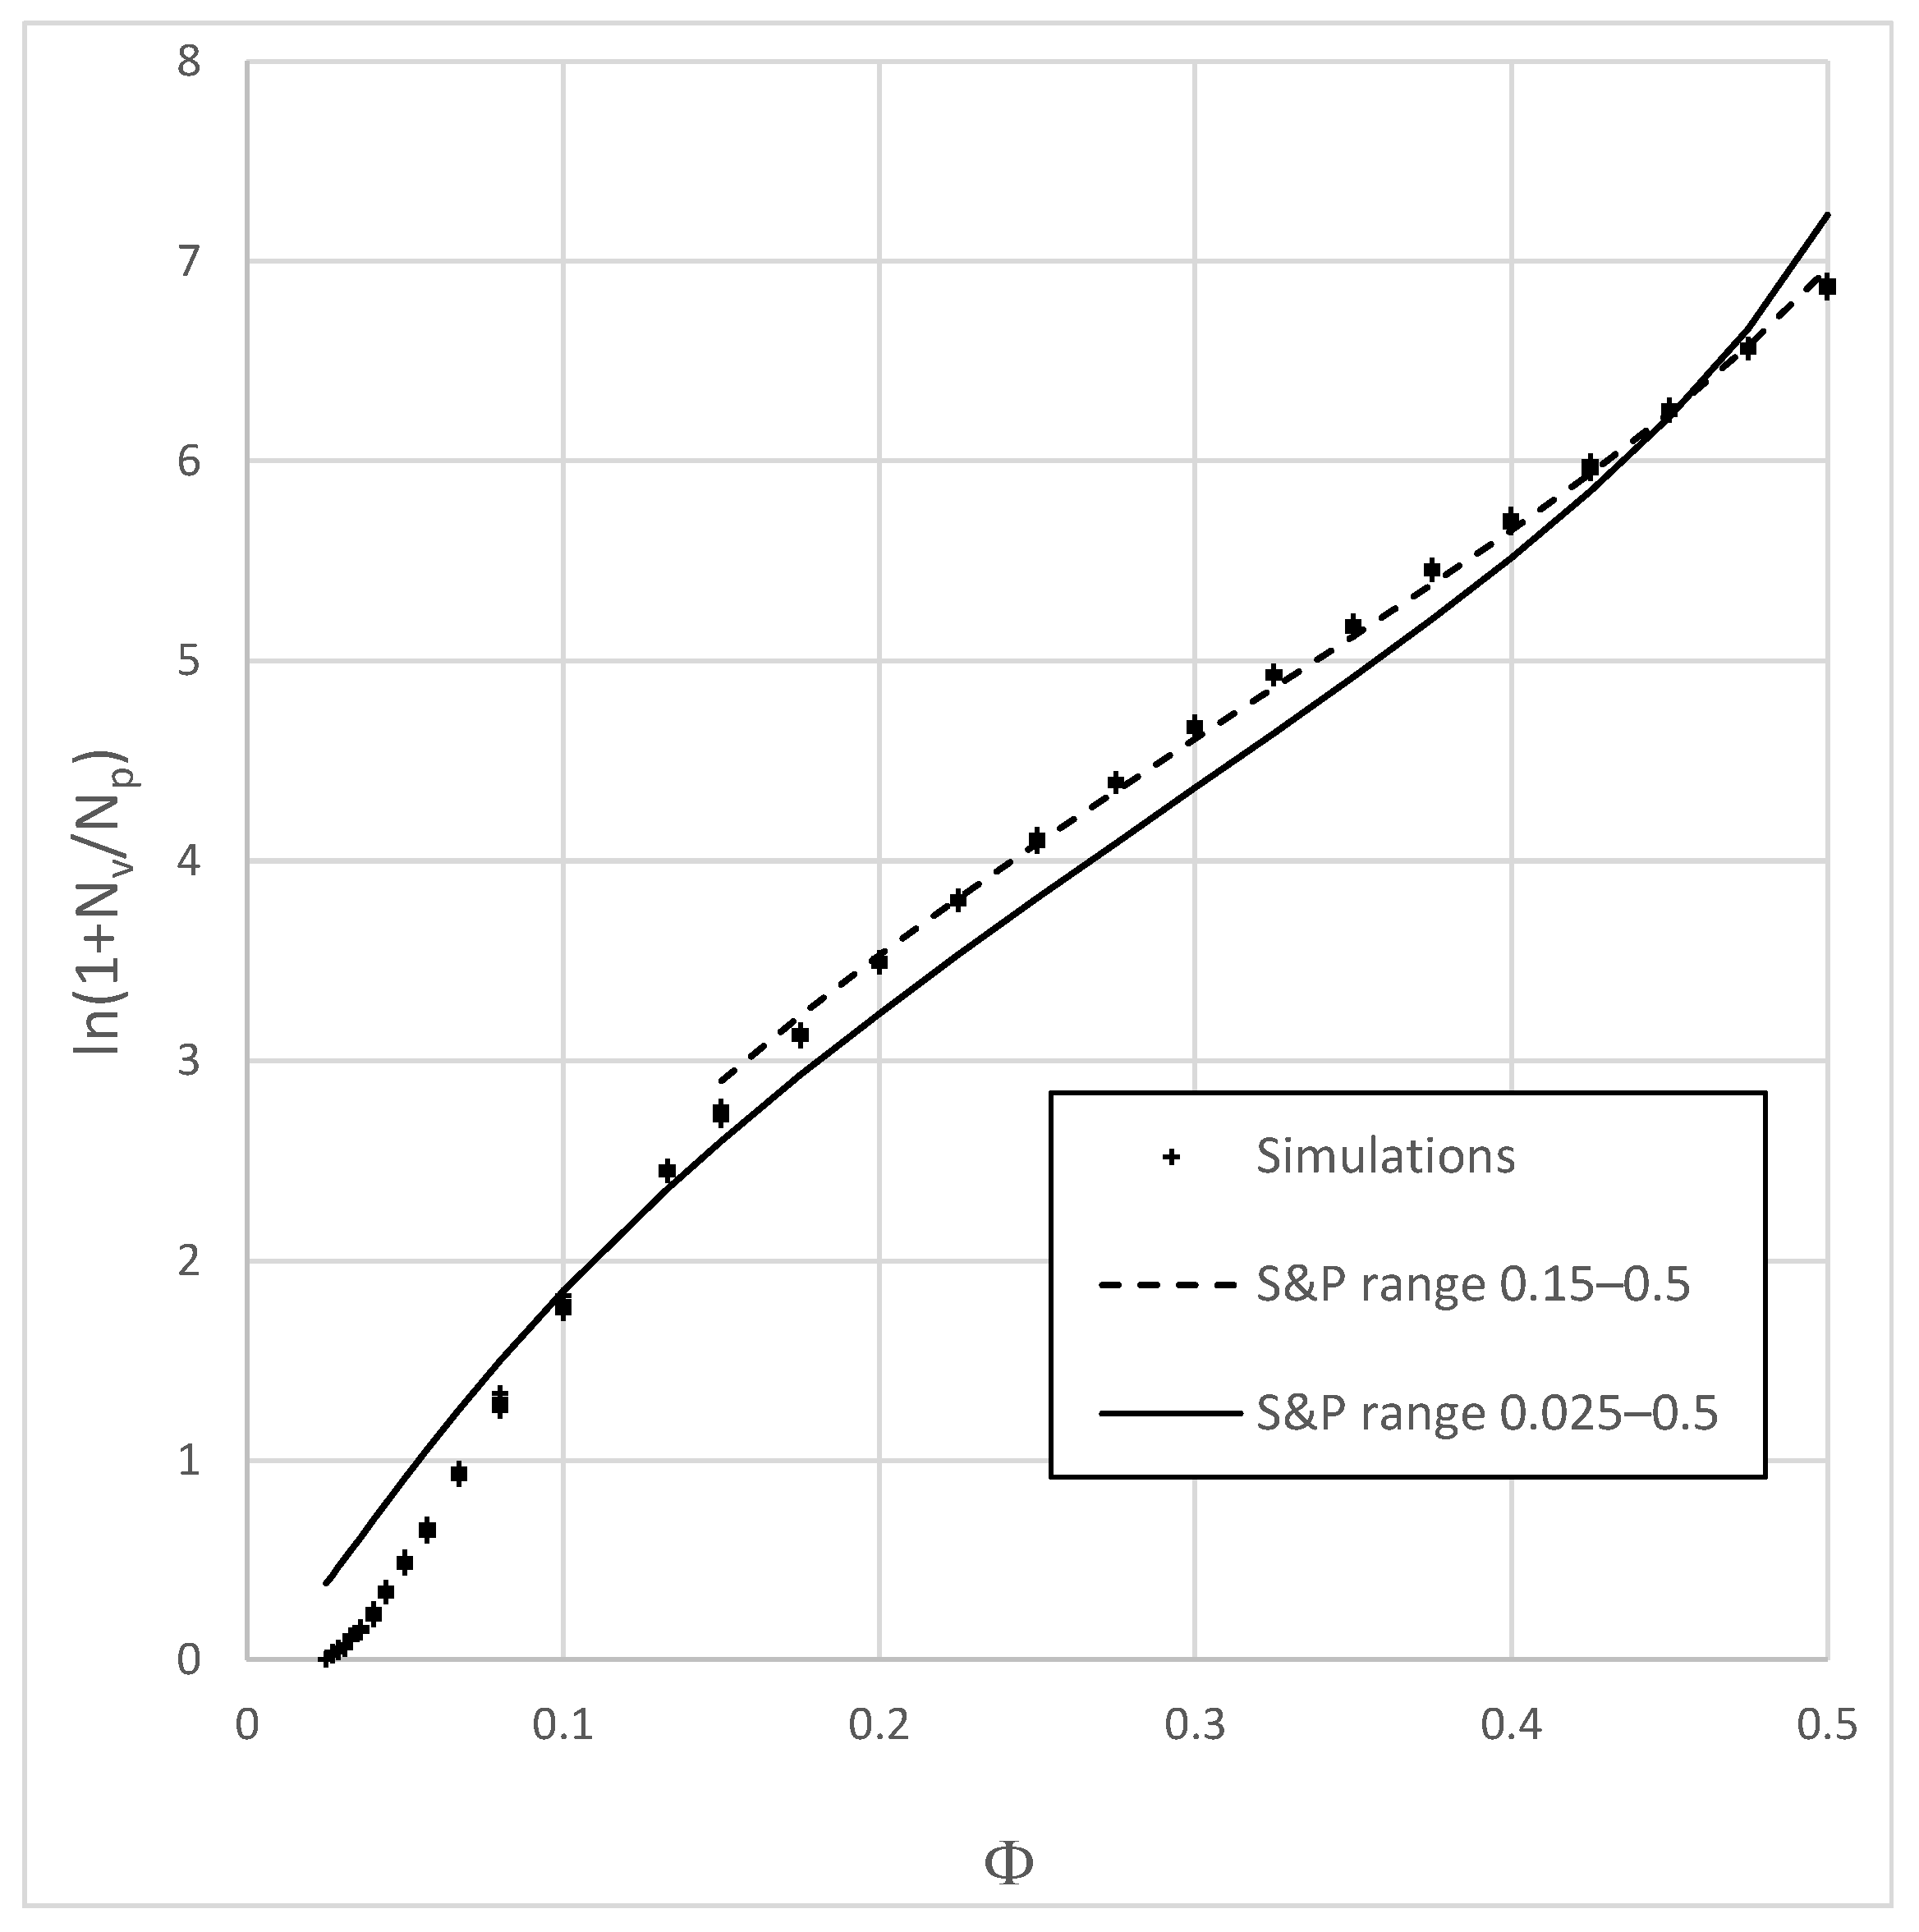
Figure 3 presents the variation of the logarithm of 1 + N
v/N
p as a function of density for all the simulations. It is compared to the variation of η
r as a function of φ, η
r being the relative viscosity computed with the relation of Sengun and Probstein [
11] (Equations (1) and (2)).
where
C and φm have been identified using a least-squares error method, on a logarithmic basis as for Sengun and Probstein. Two ranges of densities have been considered for this identification: 0.025–0.5 and 0.15–0.5, excluding the less concentrated systems. Indeed, in the dynamical analysis, viscosity is assessed from the number of numerical operations needed to generate the suspension. In dilute suspensions, number of operations per particles is much smaller than in more concentrated systems, which implies a poor representativity of the dynamical analysis.
Figure 3 shows that the number of operations per particle needed to generate the suspension (1 + N
v/N
p) can be described properly using a classical viscosity–density relationship (1). The fit for the range of densities 0.15–0.5 (R
2 = 0.9974) is much better than for 0.025–0.5 (R
2 = 0.9906). The values obtained in the former case for φ
m and C are, respectively, 0.5884 and 78.3. C depends on the used placing procedure (number of density increments, number of trial random displacements in case of a collision, etc.). The φ
m value is larger, but close to the random loose packing limit (0.555 ± 0.005) identified by Onoda and Liniger [
13]. The good correlation between Equation (1) and the numerical results, together with the value obtained for φ
m (close to the random loose packing limit) both show that (1 + N
v/N
p) gives a good estimate of the relative viscosity of the suspension. N
v can be easily computed during the generation procedure itself and does not need any postprocessing of the results, it could therefore be used for the optimization of larger systems.
The fit on
Figure 3 between numerical results and Equation (1) is not perfect and C and φ
m both depend on the range of densities chosen for the adjustment.
Table 1 shows the values obtained for these two parameters for five different ranges of densities. Both C and φ
m values increase with the density range. However, the comparison is easier with a single variable parameter, and in a second analysis the C value is forced to
= 63,
being the mean value of C for the five studied ranges of densities. In that case, it can be observed that the correlation coefficient is still very high. Moreover, the φ
m values are much closer for ranges of density from 0.15 up to 0.40/0.45. For larger densities, the φ
m value starts to increase significantly. This suggests that the modified RSA procedure used for the building of suspensions leads to a compaction of the system when the density gets closer to the maximum packing fraction. For densities significantly smaller than φ
m (about 80% of φ
m), it can be considered that the procedure allows the simulation of suspensions of varying density without compacting the system and therefore without affecting its maximum packing fraction.
4. Application to Bidisperse Suspensions
Bidisperse spherical particles systems with particle size ratios 4:1 and 2:1 (ratio between the radius of large particles R
1 to the radius of small particles R
2) have been studied and compared with experimental results of the literature. Systems containing more than 100,000 particles have been generated with varying proportions of large spheres (X
1) using the previous procedure with the following modification, to adapt it to the case of polydisperse spherical particles systems. N
p1 large particles are placed first and η
r,1 = 1 + N
v1/N
p1 is computed. Then, N
p2 small grains are added and allowed to swell in the porosity of the previous system, and η
r,2 is determined similarly. The resulting viscosity is finally computed according to the Arrhenius [
18] relation as following (Equation (3)):
For each particle size ratio, and each proportion of large particles, several suspensions of density ranging from 0.20 up to 0.65, with steps of 0.025 have been generated. No system of density smaller than 0.20 has been simulated because, as shown in
Figure 3, the fit between 1 + N
v/N
p and Equation (1) is poor for low density suspensions and in that case η
r,1 and/or η
r,2 (depending on the proportion of large particles) would not be computed accurately. Moreover, after a first estimate of the maximum packing fraction φ
m, the range of density has been limited to a value close to 0.8 φ
m to avoid any over compaction of the suspensions. The range of density finally retained for the analysis of results is 0.2 to 0.6 for systems 4:1 and 0.2 to 0.5 for systems 2:1. Then, the C, and φ
m values of each system have been computed by fitting Equation (1) to the variation of η
r as a function of density, using a least-squares error method on a logarithmic basis.
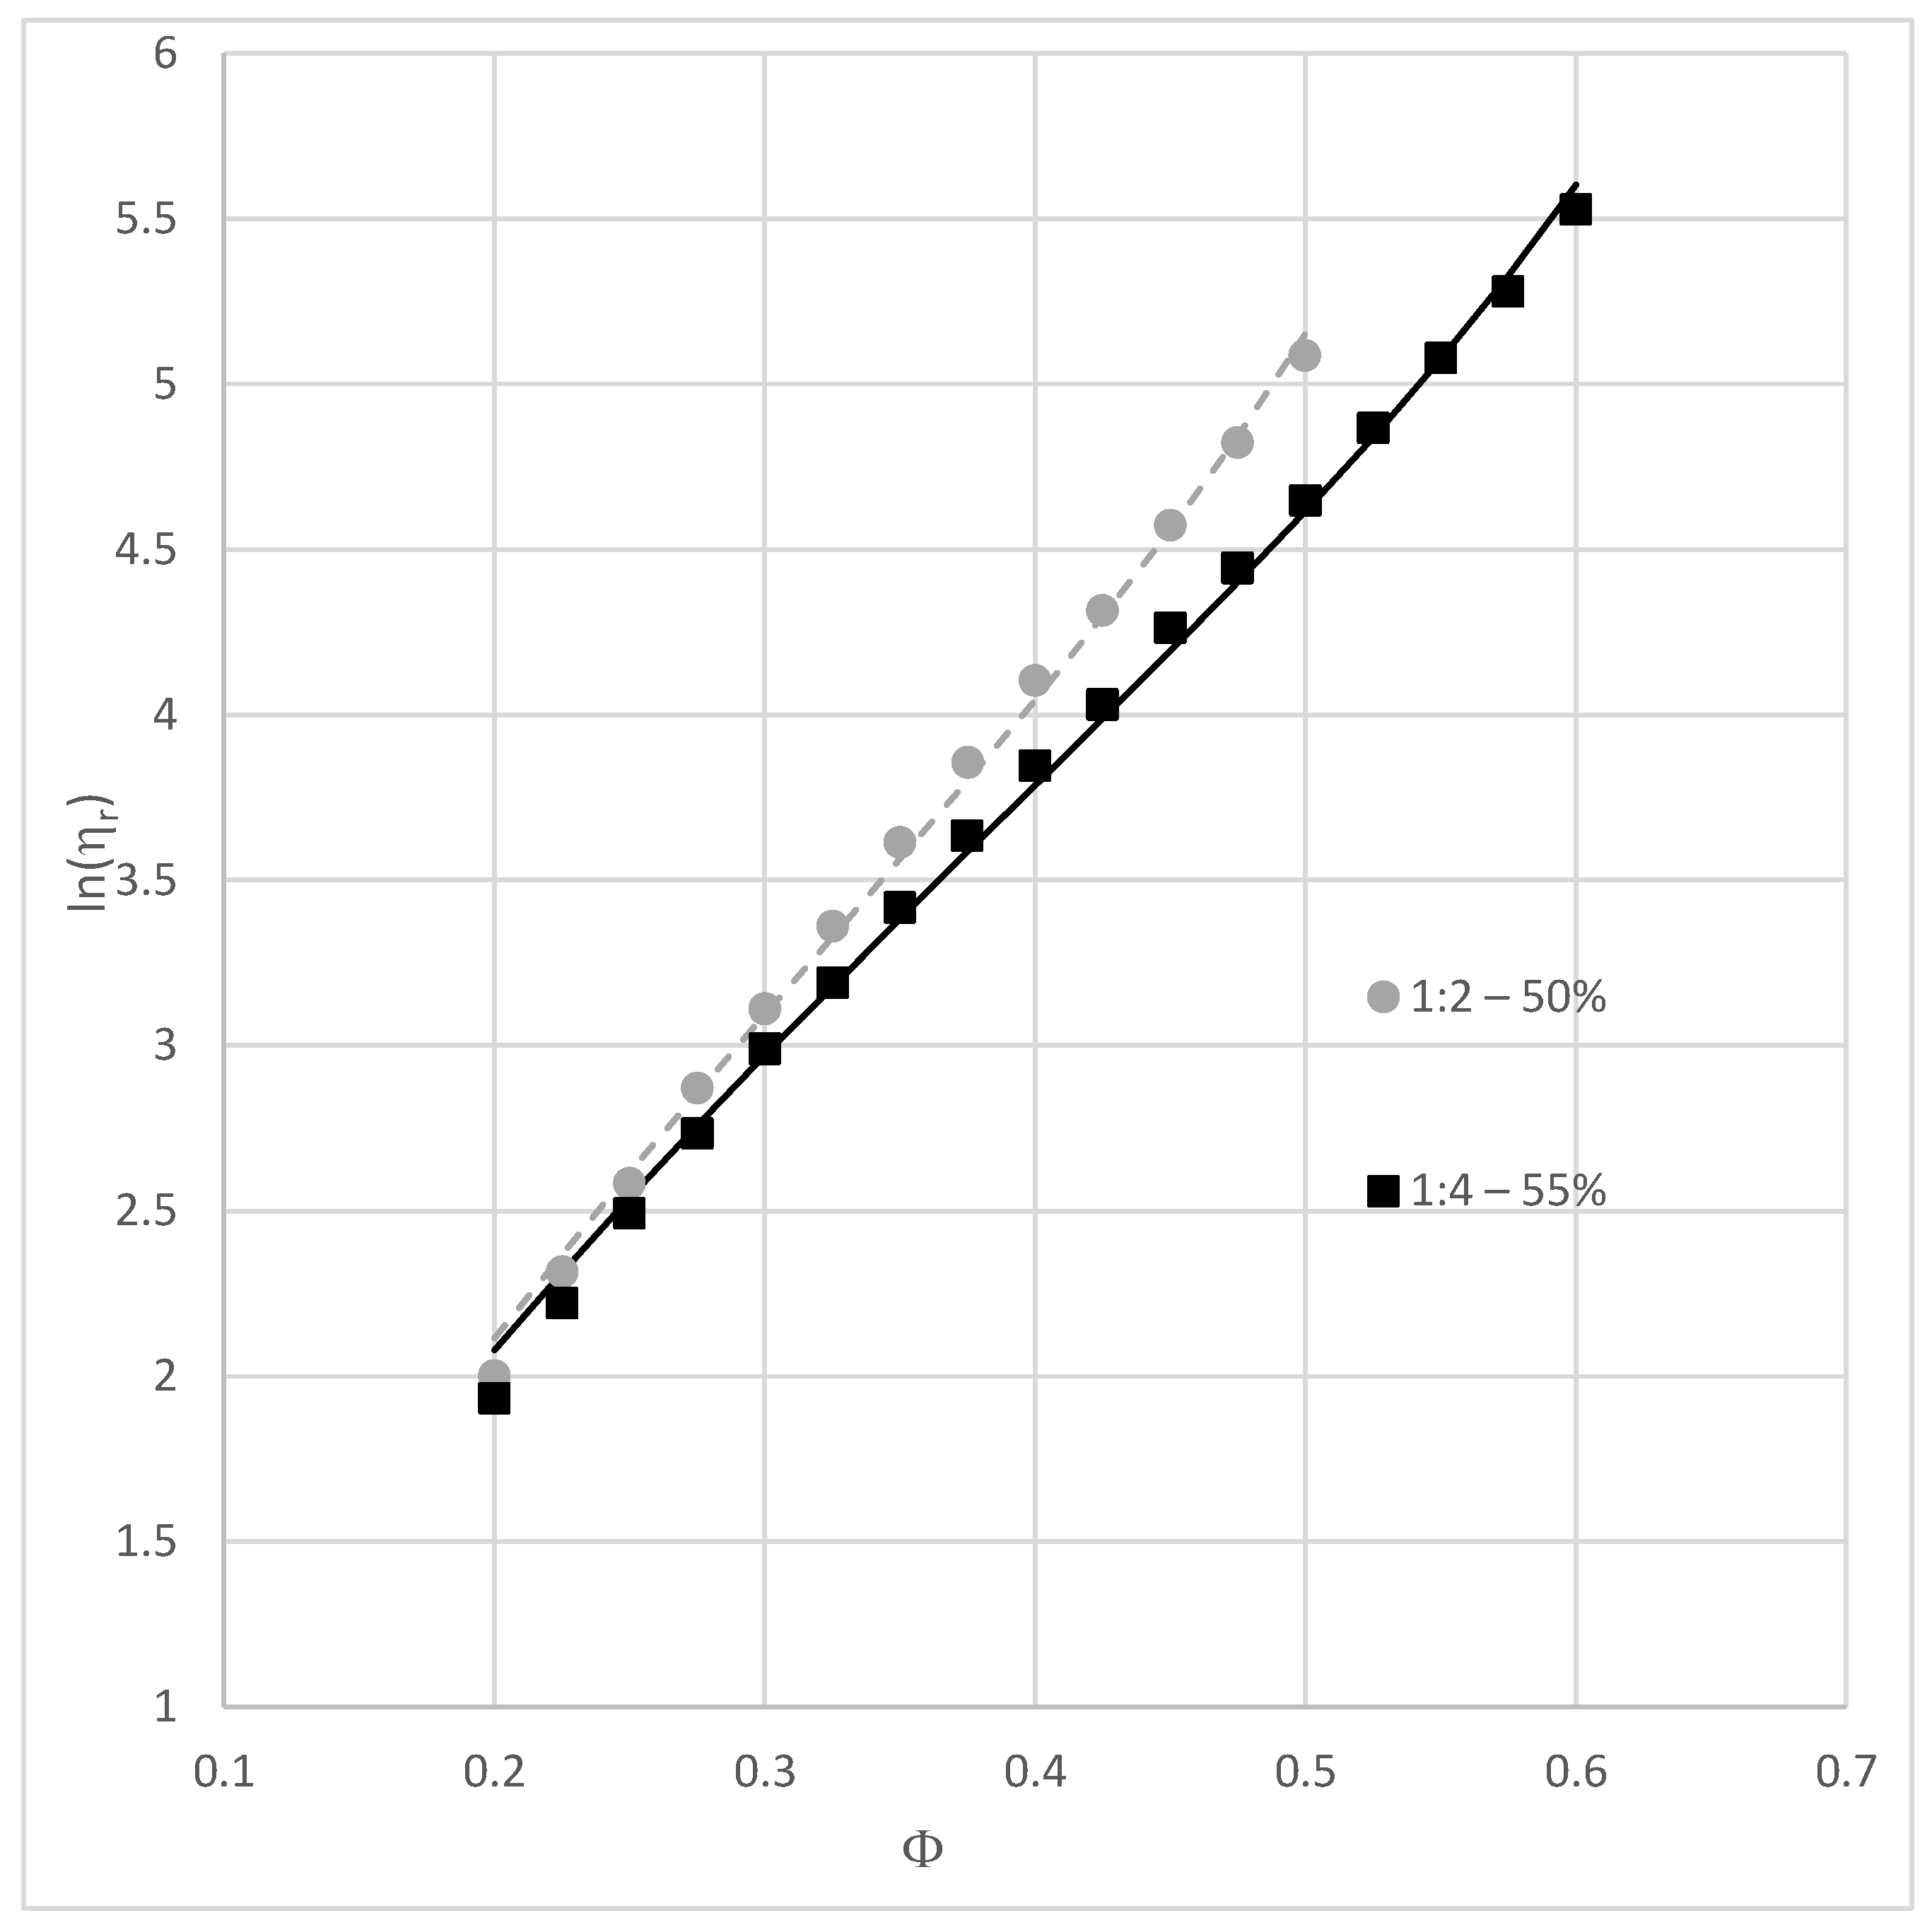
Figure 4 presents the variation of ln(η
r) as a function of density for two systems (1:2, X
1 = 0.5 and 1:4, X
1 = 0.55). The figure also presents the best fit obtained with Equation (1) in both cases and shows that for bidisperse systems, the variation of relative viscosity computed according to the Arrhenius relation (Equation (3)) as a function of solid volume fraction can also be described very satisfactorily by the Sengun and Probstein relationship [
11]. For these two systems, ten successive simulations have been repeated for all the studied solid volume fractions to assess the repeatability of the procedure. The mean values obtained for C and φ
m for system (1:2, X
1 = 0.5) are 20.0 and 0.6257 with standard deviations of 0.320 and 0.0017. The mean values obtained for C and φ
m for system (1:4, X
1 = 0.55) are 27.3 and 0.7368 with standard deviations of 0.517 and 0.0019.
The fit with Equation (1) is good (R2 larger or equal to 0.9973), which shows that this equation allows for a good prediction of the packing densities. However, numerical results could also be approached satisfactorily with a linear relation (R2 larger than or equal to 0.9990 in both cases). This observation also stands for all the other studied systems and suggests that the slope of the variation of ln(ηr) as a function of density could also be used to compare the systems, the larger the slope, the higher the viscosity.
The C value strongly depends on the particle size ratio, and to a lesser extent on the proportion of large particles (X1). For a particle size ratio of 1:4, C varies between 25.3 and 33.0, and its value is comprised between 19.9 and 21.5 for particle size ratio 1:2. Whatever the size ratio, C is much lower than the value identified previously on monosized systems (78.3). This large difference probably depends on the placing procedure, which is carried out in two steps for bidisperse systems.
To assess the role of the two step procedure, the φ
m value of the monosized systems containing 10,000 particles has been recomputed in two steps, as for the bidisperse systems, by first placing a part of the particles (from 20 to 80%, that are in this case considered as “large grains”), letting them swell up to the final radius, and then the remaining part (these systems are noted 1:1 in the following).
Table 2 presents the obtained values for C and φ
m for the different proportions of particles placed in the first step (X
1). It can be observed that, for proportions comprised between 0.3 and 0.7, the C value is comprised between 20.6 and 24.3, which is close to the values obtained for systems of particle size ratio 1:2. Additionally, the φ
m value for all these systems varies between 0.5045 and 0.5204, the variation being larger for proportions X
1 lower than 0.3 or larger than 0.7. The packing densities obtained for systems 1:1 (monosized systems placed in two steps) therefore vary significantly as a function of the proportion of particles placed in the first step. A constant value of the packing density is expected here because the systems are the same, simulations only differ from the placing procedure. Placing part of the grains in the first step of course adds constraints to the system as the first batch of particles cannot be moved once they have reached their final radius. These constraints depend however on the specific surface of particles and are therefore maximized when the size of grains is the same for the two steps of the process. This effect of the placing procedure should therefore be less pronounced for systems of increasing size ratios, but for the latter the influence is more difficult to quantify, and we neglect it in the following.
In order to compare the bidisperse systems with a single value, it has been decided to force C to ( being the mean value of C for all the proportions of large particles studied for each size ratio, = 28.4 for 4:1 systems, and = 20.7 for 2:1 systems), and only φm is identified. Even with a fixed value of C, the correlation between ηr and Equation (1) is still good (R2 larger than 0.9962).
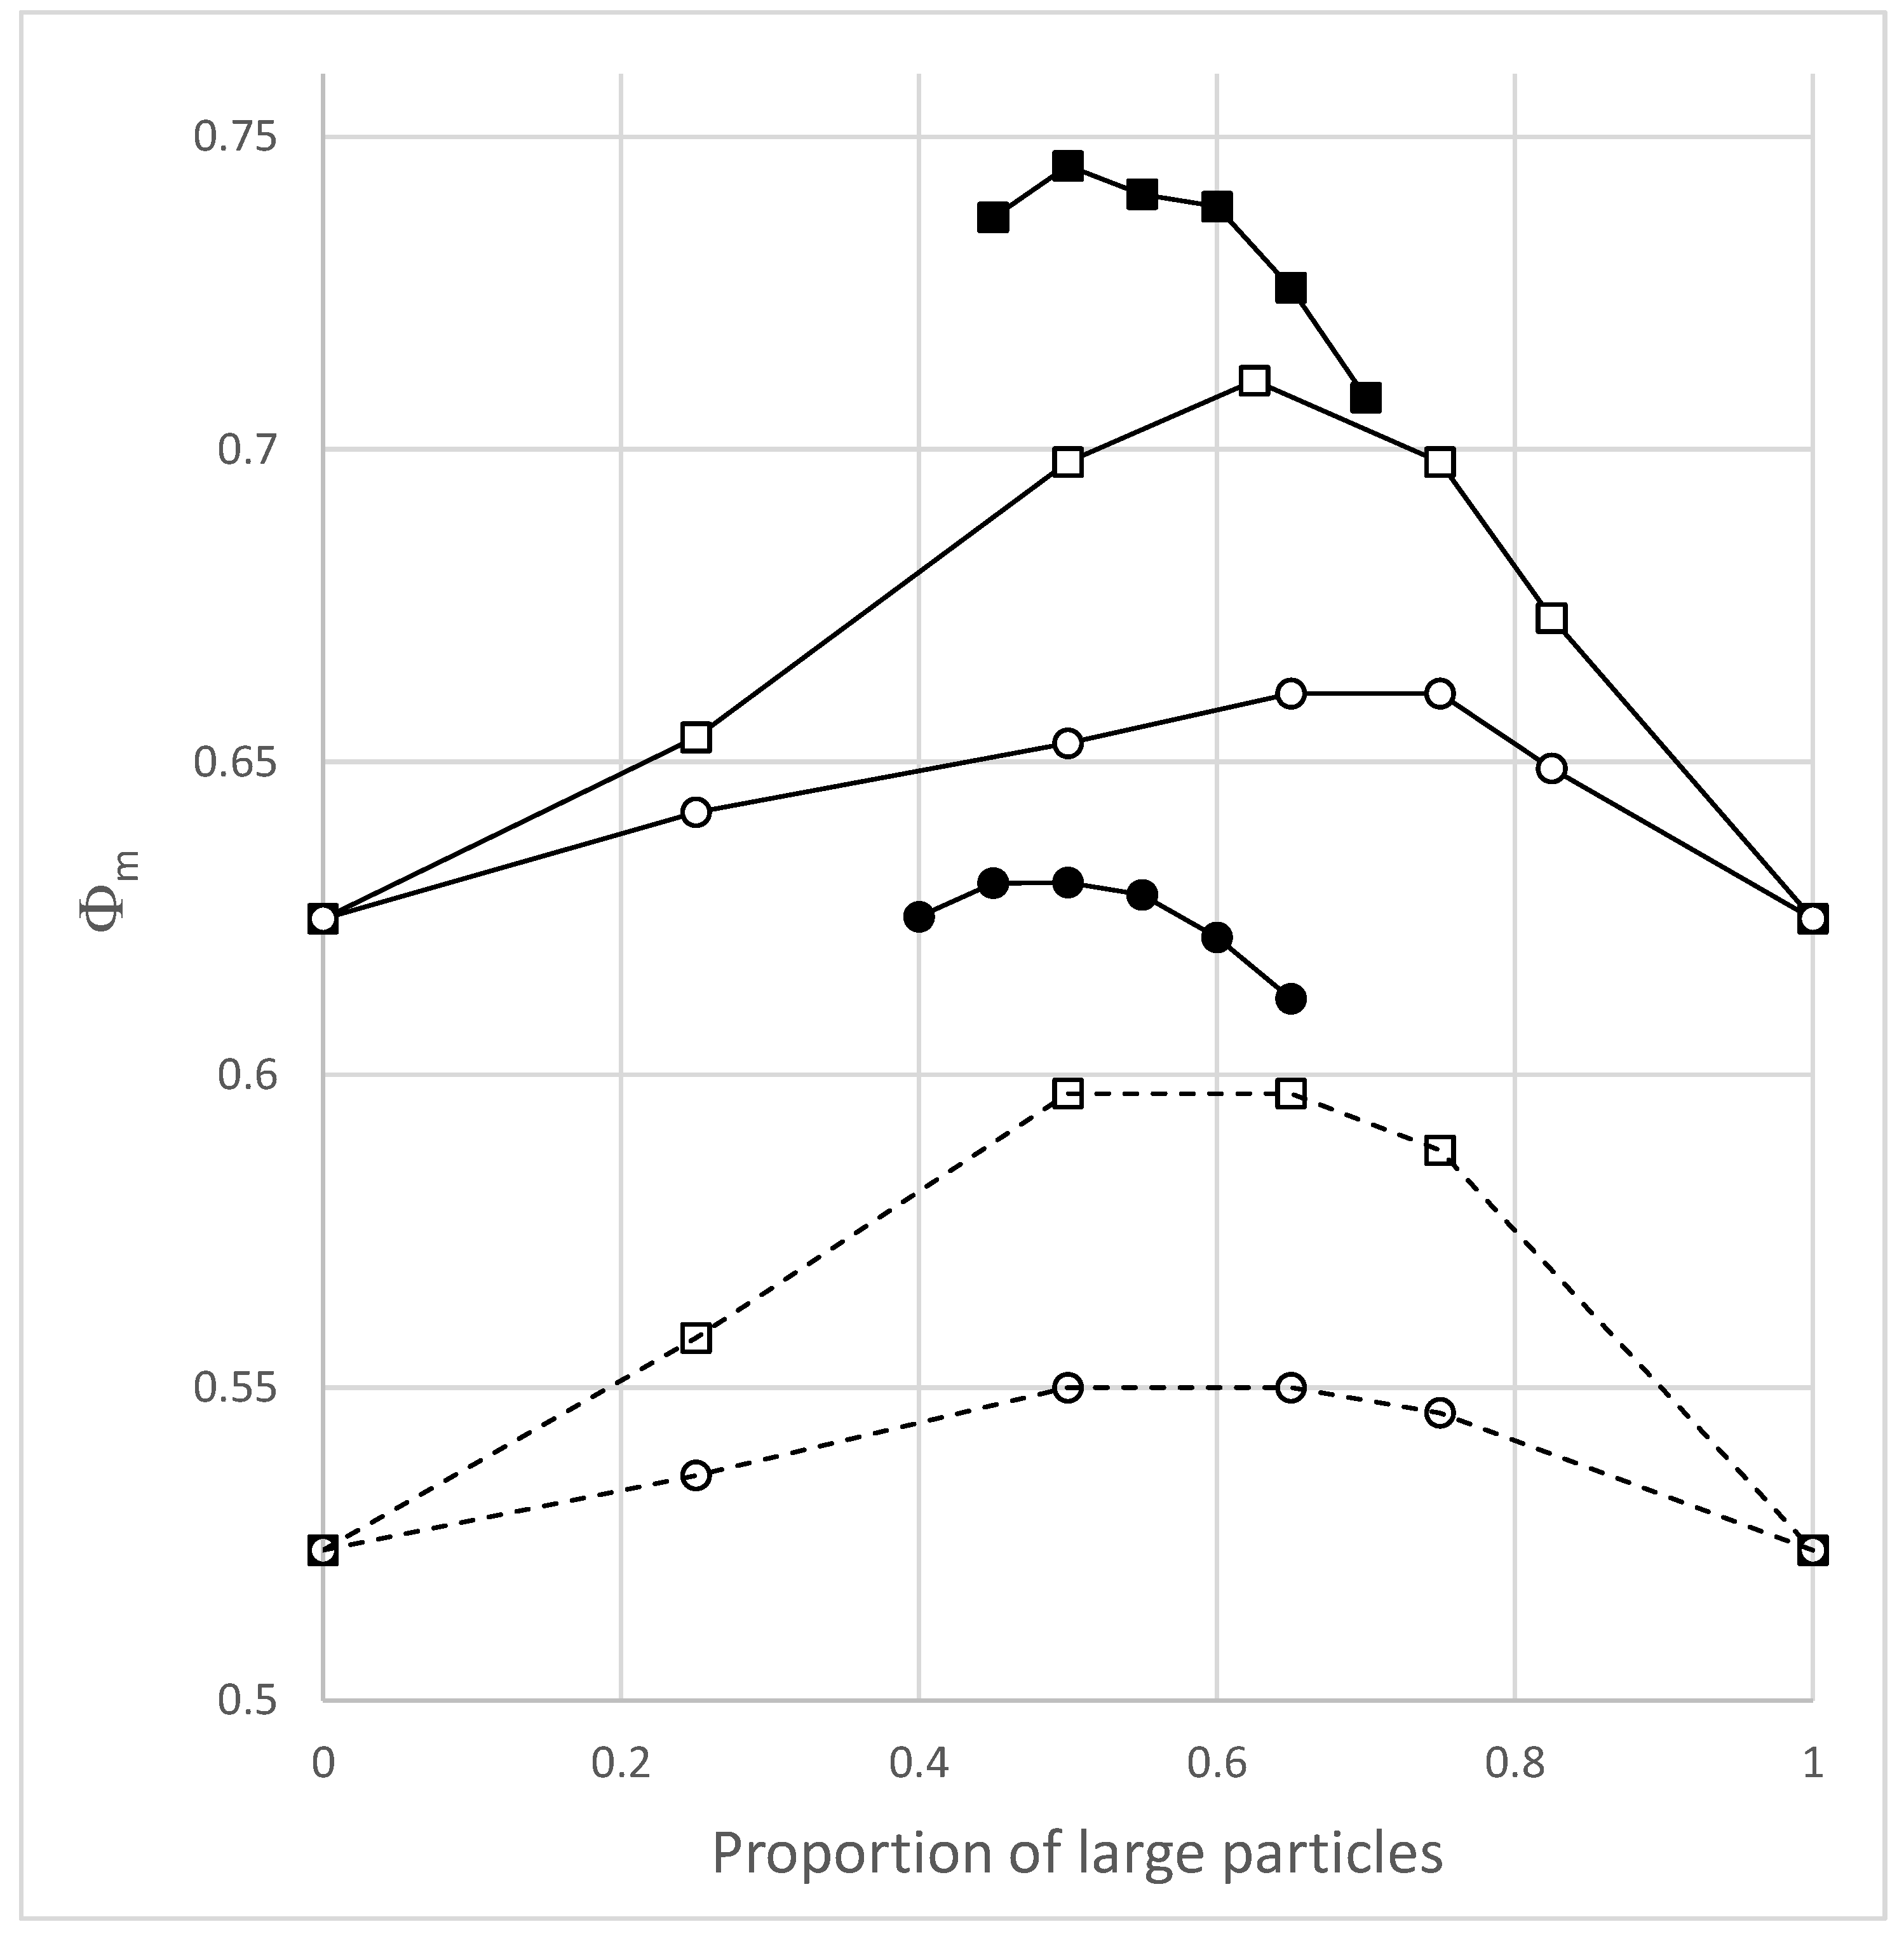
Figure 5 shows the variation of φ
m as a function of the proportion of large particles for the two studied systems (4:1, and 2:1). These results are compared to those obtained experimentally by Shapiro and Probstein [
12] on bidisperse 4:1 and 2:1 suspensions and packings. The optimum values obtained in our simulations for the 4:1 and 2:1 suspensions (0.50) lie in the range of optimum proportions measured by Shapiro and Probstein on suspensions (between 0.5 and 0.65). For the 2:1 suspensions, the variation of φ
m with the proportion of large particles is very flat for proportions of large grains comprised between 0.45 and 0.55, and a neat optimum is more difficult to define. Overall, the simulations seem to give a good estimate of optimum proportions, the predictions being probably more accurate as the size ratio increases.
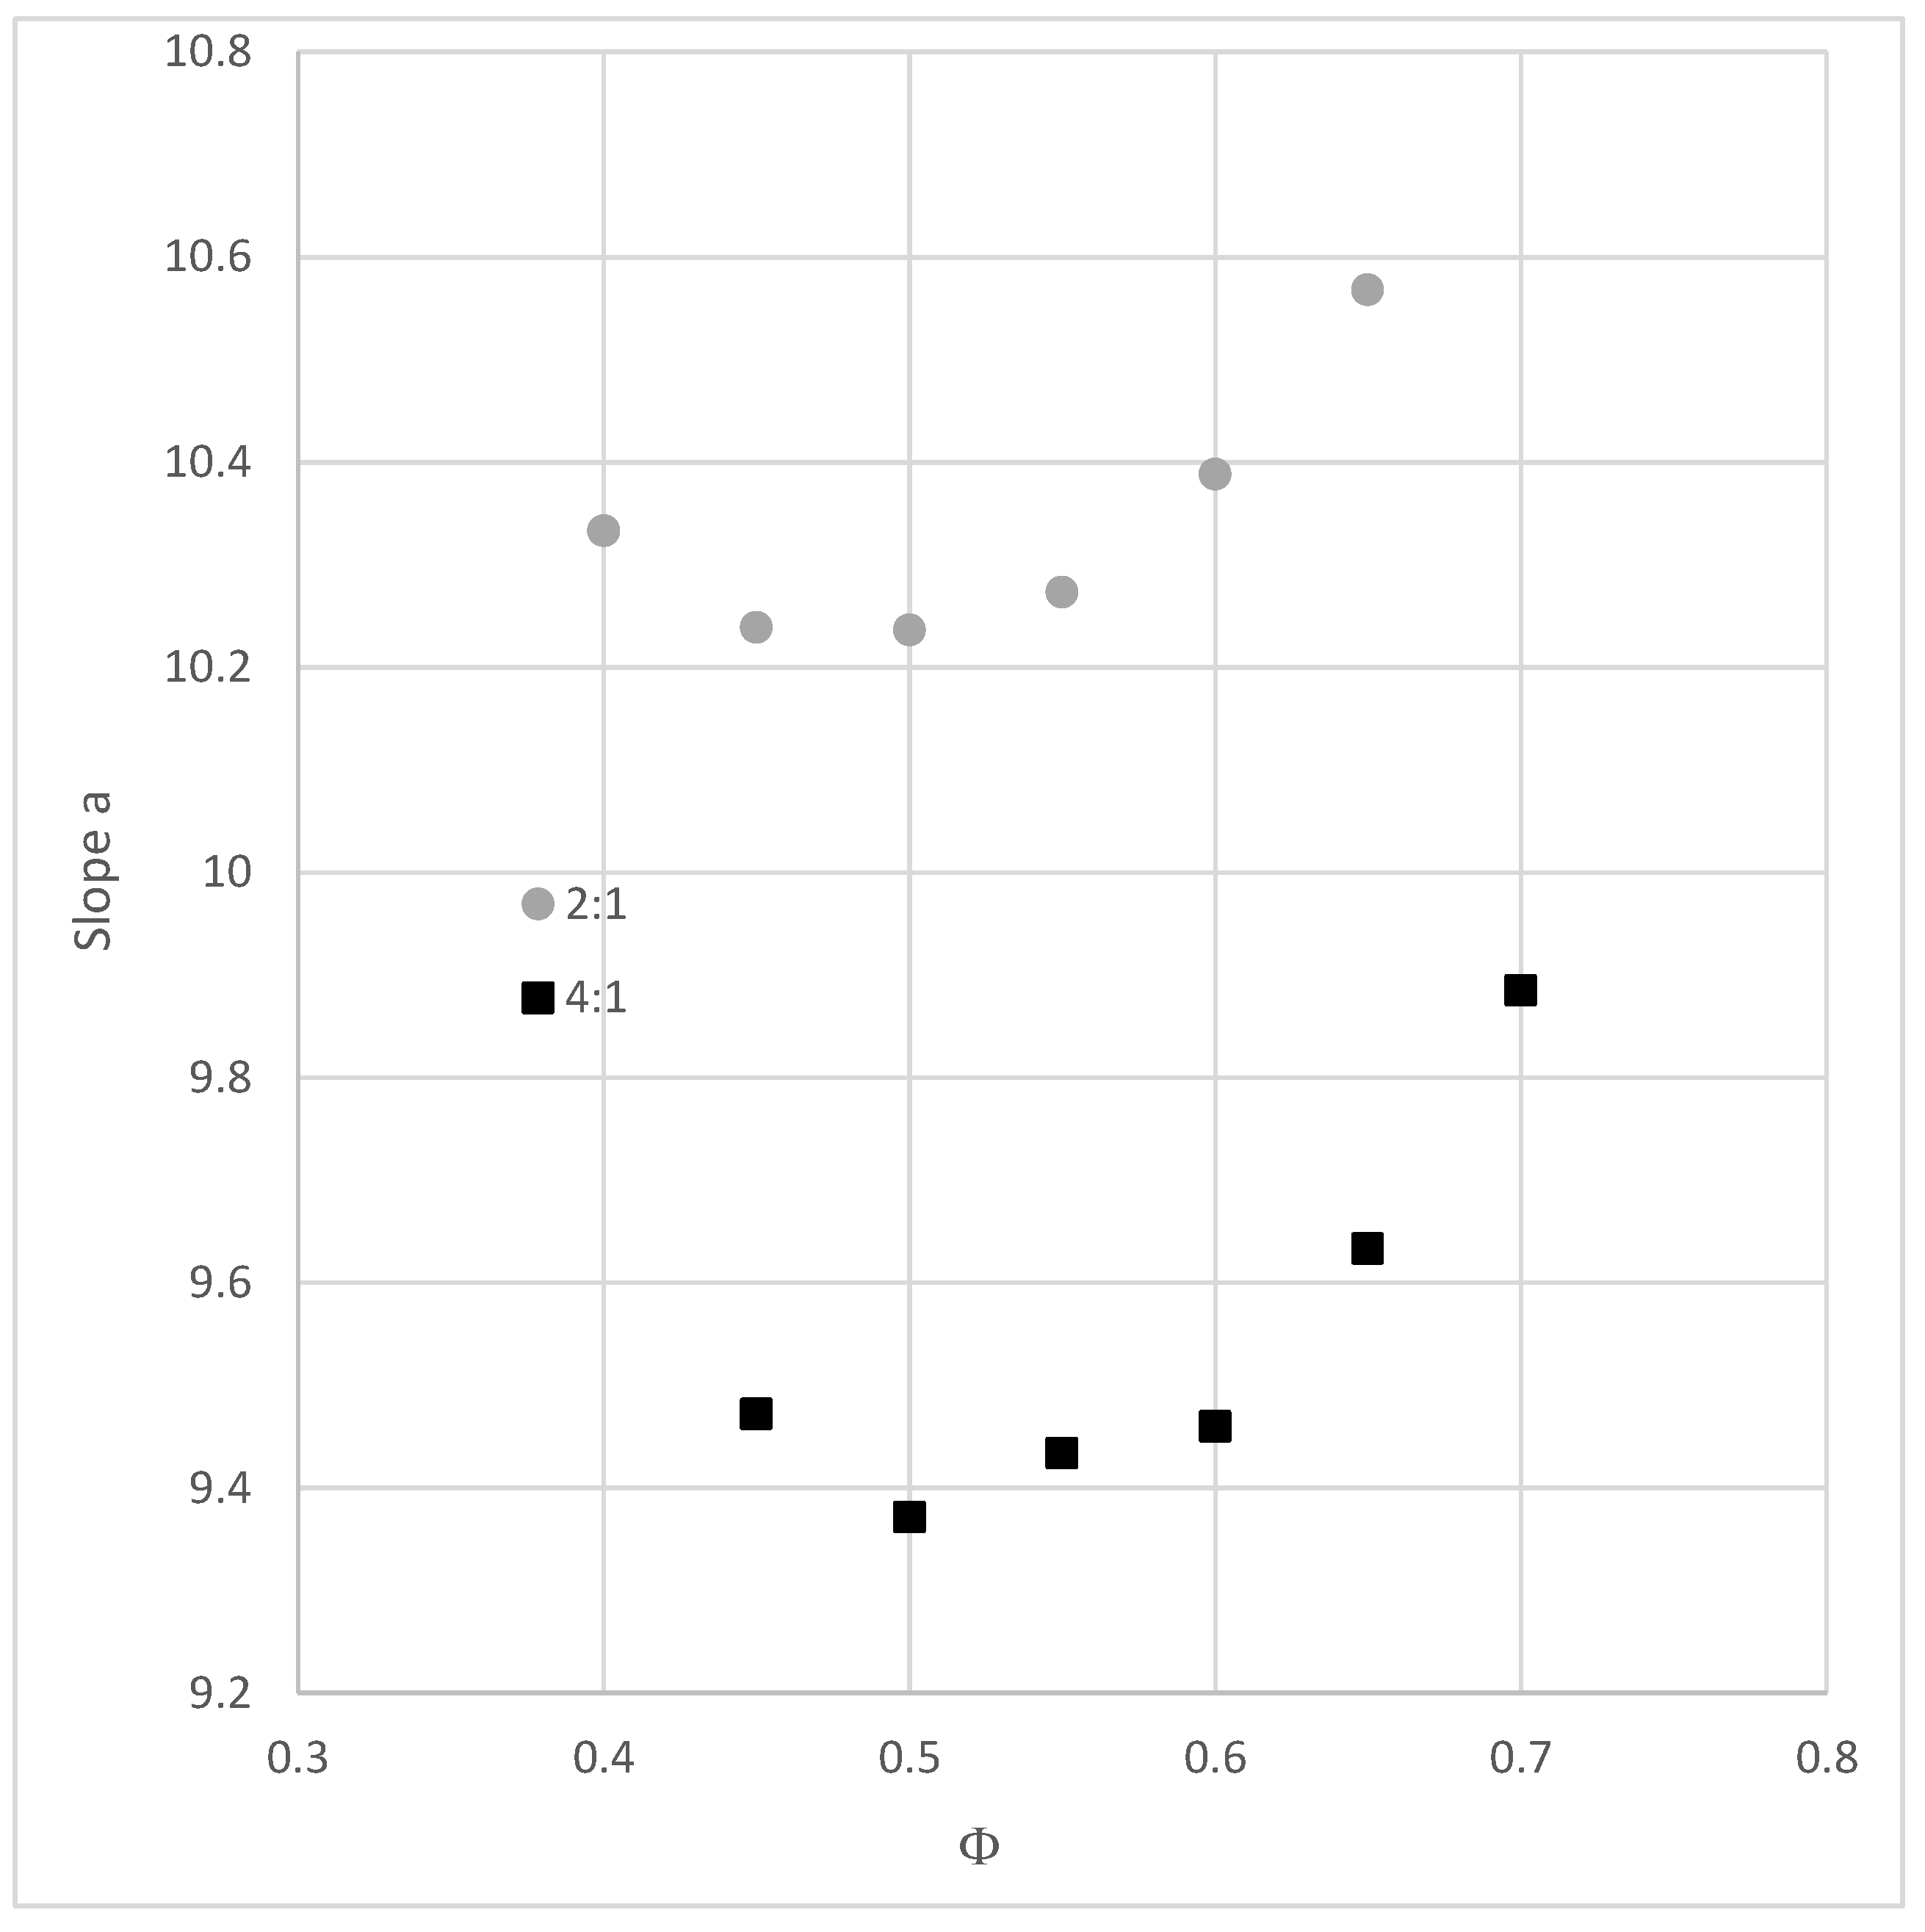
Figure 6 shows the variation of the slope of the relation ln(η
r) = f(φ) for the two studied systems (4:1 and 2:1). This result leads to similar conclusions than the previous analysis, the optimum proportion for 4:1 systems is 0.5 and that of 2:1 systems is comprised between 0.45 and 0.5. The slope of the viscosity–density relation does not give the maximum packing density of the system, but it seems sufficient to identify the optimum proportions and could therefore be used as an efficient parameter for the optimization of granular mixtures.
5. Conclusions
The main objective of this paper was to propose a simple numerical model allowing us to optimize the mixture proportions of granular systems with very few entry data (basically the particle size distribution). The principle of the model was first tested on monosized spheres systems, and it was then applied to bidisperse spherical particles mixtures and compared successfully to results of the literature.
Monosized spheres suspensions of varying density have first been simulated with an original numerical procedure. Simulated systems have then been analyzed following two different approaches: a structural analysis of the final suspension or a dynamical analysis of the whole generation of the system. The structural analysis showed that the generated suspensions can be considered as dilated states of a denser packing whose density is very close to the well-known random loose packing limit. The dynamical analysis has shown that the variation of the number of operations per particle needed to generate the suspension follows a classical viscosity–density relationship, showing that the “numerical difficulty” to generate the suspension is correlated to its viscosity and suggesting also that the maximum packing fraction of the system is close to the random loose packing limit.
The numerical procedure used for the generation of suspensions has then been extended to bidisperse systems, placing first the large grains and then the small ones. The viscosity of the whole suspension has been calculated by combining the viscosities of each granular class, and the optimum proportions of the bidisperse suspensions have been identified. The two steps procedure could be questioned because no interaction (the so-called “loosening effect”) between large and small particles is considered during the placement of large grains. However, the optimum proportions of simulated systems compared quite well to the optimum proportions identified experimentally in the literature, and this assumption does not seem to affect the optimization results. This might be because the optimum proportion is researched not from the generation of packings, but of suspensions, for which the presence of the interstitial fluid between particles could decrease the influence of the loosening effect.
A similar approach could be used for the optimization of polydisperse systems such as concrete containing recycled materials, placing particles from the largest to the smallest, providing thus an efficient and fast tool for the optimization of the proportions of granular mixtures of known particle size distributions.


