Abstract
Concrete has a large environmental impact due to CO2 emissions related to cement manufacturing and the consumption of natural aggregates. More sustainable concretes can be developed, replacing part of the cement with mineral admixtures or natural aggregates with recycled ones. However, recycled materials are less regular than natural ones, and using new deposit changes concrete properties, which necessitates the re-optimization of mixture proportions. For small/medium-size waste deposits, the expensive experimental work needed to adapt concrete formulation containing these particular wastes is not profitable, which prevents from their valorization. The aim of this study is to develop a numerical model to optimize the mixture proportions of concentrated suspensions based on very limited entry data. In the model, spheres of small radii are seeded in the porosity and allowed to swell until reaching a target radius/density. On monosized suspensions, it is shown that the ratio between the number of random displacements to the number of particles varies with density, following a classical viscosity–density relationship, which allows identification of the packing fraction. The model is extended to bidisperse systems, with the viscosity of the whole suspension calculated by combining the viscosities of each granular class. The model is applied to bidisperse systems of size ratios 4:1 and 2:1 with varying proportions of large particles. The optimum proportions identified numerically are compared successfully to experimental results from the literature.
1. Introduction
Concrete production has a large environmental impact due both to the CO2 emissions related to cement manufacture and to the large consumption of natural aggregates. Optimizing concrete mixture proportions is fundamental from a sustainable development perspective, as it allows for minimizing the volume fraction of cement paste for a given workability, therefore reducing the amount of cement in the mix for a given set of specifications [1]. Another way to improve the environmental impact of concrete is to replace part of the cement with mineral admixtures or a portion of the natural aggregates with recycled ones to reduce the shortage of natural resources. Several industrial by-products, such as blast furnace slags or coal fly ashes, have been used as cement substitutes for a long time and have proven to be efficient both in the carbon footprint reduction of concrete and in the improvement of some specific properties, such as durability [2]. Other recycled materials could be used as cement or aggregate substitutes in concrete (sugarcane bagasse ash [3], grinded bricks [4], recycled concrete aggregates [5], etc.), but these materials are produced at a smaller industrial scale than classical admixtures, and deposits are much more variable. Replacing a well-known material with a new one changes the properties of concrete both at fresh and hardened states, and the optimization of the new mixture proportions is required in each case. In particular, the substitution of a concrete constituent with a recycled material very often leads to a decrease in the workability of concrete due to a lack of granular optimization of the new mixture. The experimental optimization of granular materials is expensive and takes a long time, and the laboratory optimization of concrete-containing recycled materials can only be carried out if the deposit of recycled materials is large enough for experimentation to be profitable. There are some numerical models of concrete mixture proportioning [6], but they also require substantial experiments to determine the entry data of each constituent, and once again, they are more suited to large deposits. Having a simple and fast solution for mixture proportion optimization is therefore necessary to increase the proportion of recycled materials in concrete. In this paper, we propose a numerical model for granular mixture proportioning, attempting to fill the gap between the need for a reliable model of granular optimization and the necessity to limit the cost of experiments to feed the model. The proposed model allows comparison of the viscosity of concentrated suspensions with different granular mixture proportions. It can therefore be used to optimize the composition of the granular mixture in order to minimize the viscosity of the suspension. This could lead to a simple tool for the development of concretes containing recycled materials.
Predicting the relative viscosity (ηr = η/η0: ratio between the viscosity of the suspension to that of the suspending fluid) of non-colloidal concentrated suspensions from their solid volume fraction is a matter of importance, both theoretically and for industrial purposes. Many models have been proposed to derive the relative viscosity from the ratio (φ/φm) between the solid volume fraction of particles in the suspension to their random packing fraction [7,8,9,10,11]. The latter can either be computed from rheological experiments by measuring the viscosity of suspensions of various solid volume fractions or estimated from packing experiments with dry particles [12]. Both methods require time-consuming experiments and are not suited to the purpose of optimization.
The increase in viscosity due to the addition of particles in a suspending fluid can be accounted for by the intrinsic viscosity (2.5 for spheres) considering hydrodynamic effects and by geometric considerations, captured by the ratio (φ/φm) [10]. For a given particle geometry, the influence of the volume fraction of particles should only depend on geometric considerations. The basic idea of the model is that, for a given particle geometry (spheres in this paper), the numerical generation of a suspension of volume fraction φ is easier (i.e., less computationally expensive) for a granular system with a larger φm value (i.e., for a less viscous suspension). With this hypothesis, the optimization of the granular mixtures should be possible based on the generation of suspensions and not on that of packings, which is much less computationally expensive.
In Section 2, the numerical methods used to generate and characterize monosized suspensions is described. In Section 3, monosized suspensions of spheres of densities ranging between 0.025 and 0.5 are generated, the φm value of the system is identified following two different approaches and compared to the random loose packing density determined by Onoda and Liniger [13]. In Section 4, the numerical procedure is adapted for the generation of bidisperse suspensions, introducing particles by order of decreasing radius. The viscosity of bidisperse suspensions with size ratios 4:1 and 2:1 and of varying proportions of large particles are computed, and the optimum values are compared to experimental results from the literature.
2. Numerical Methods: Generation and Characterization of Monosized Suspensions of Spheres
2.1. Generation Procedure
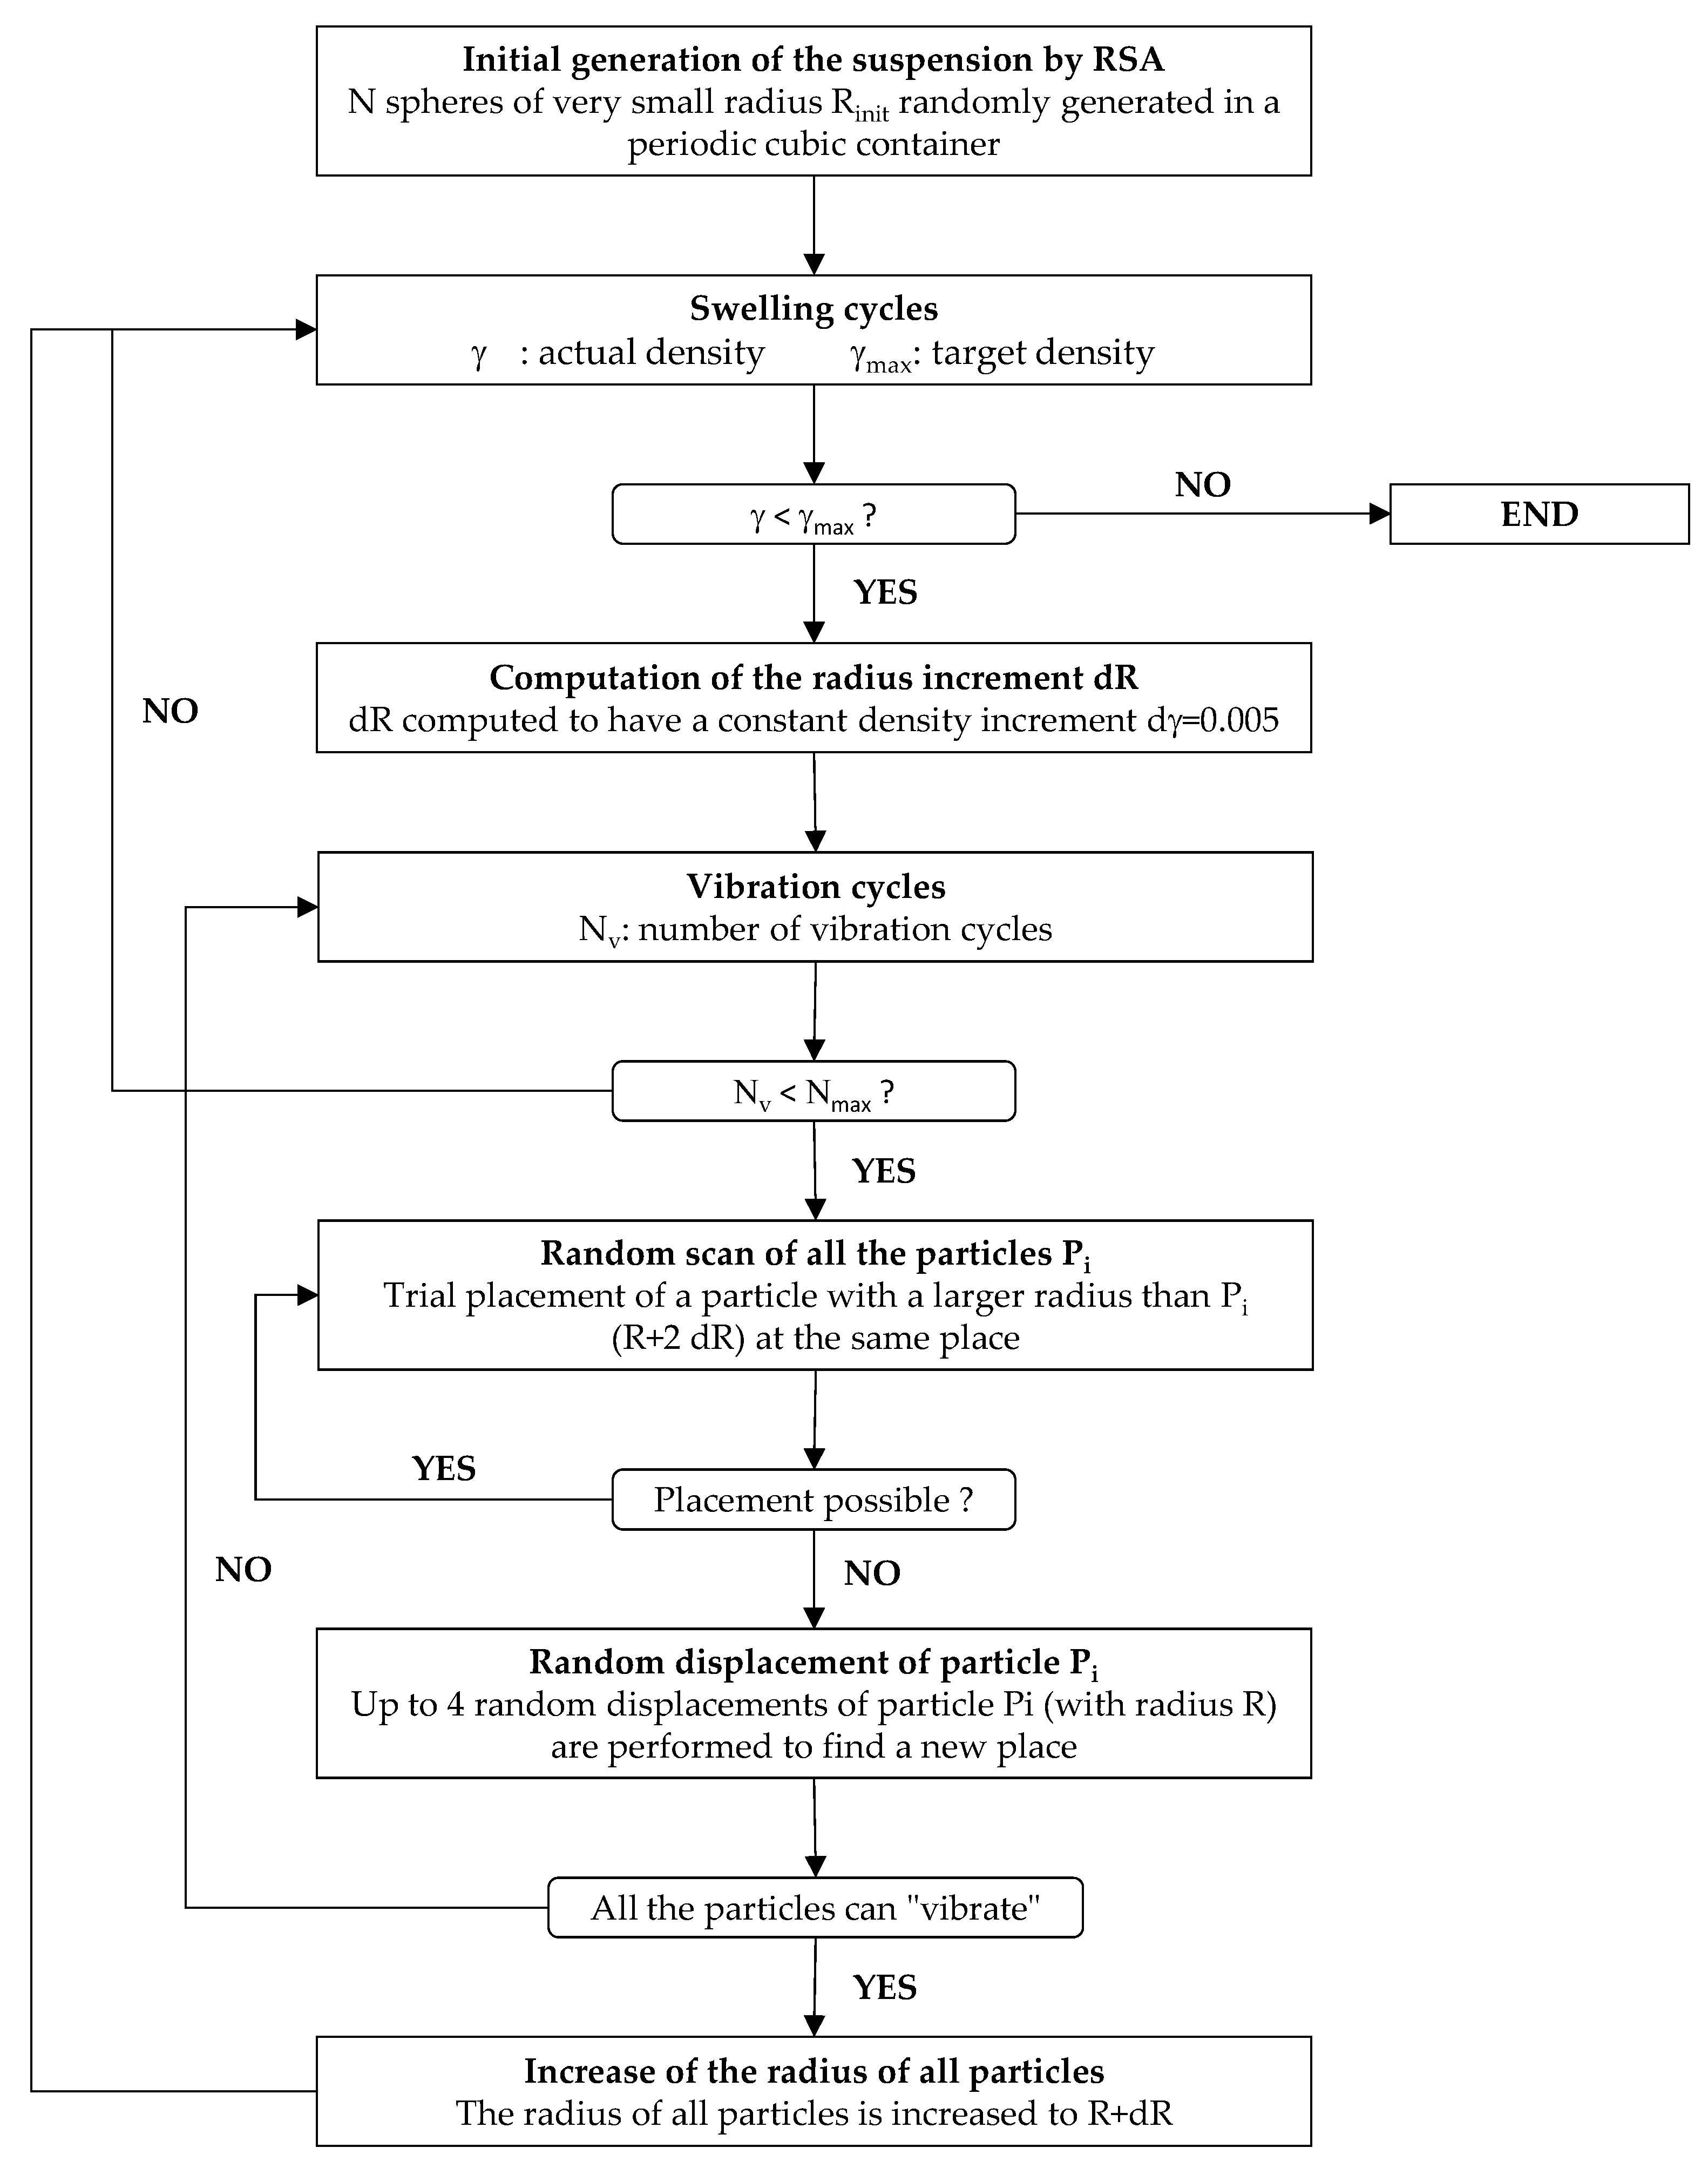
The easiest way to simulate a random suspension is to use the Random Sequential Addition algorithm (RSA), where particle positions are simply generated randomly until a place where they can fit without overlapping already placed particles is found [14]. However, the maximum solid volume fraction that can be reached using RSA with monosized spheres is 0.38, whereas most of the experimental studies available in the literature deal with suspensions with solid volume fractions of up to 0.50. Therefore, a modified algorithm inspired by RSA and by the “symmetric vibration” procedure presented in [15] has been developed to simulate suspensions of higher density. A flow chart of the numerical procedure is presented in Figure 1, and the model is described in detail in the lines below.
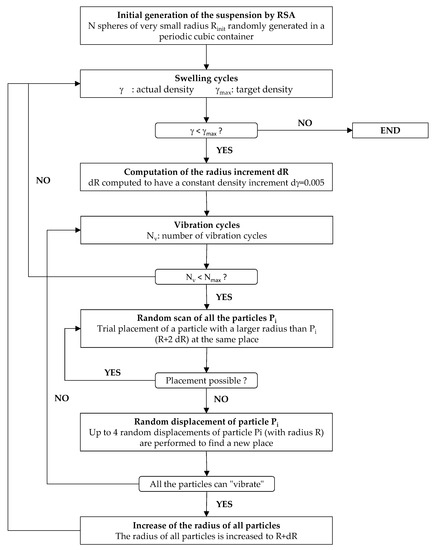
Figure 1.
Flow chart of the numerical procedure used to generate a suspension of density γmax.
A suspension of very low density (0.025) is first generated by RSA. Then, the concentration of the system is progressively increased by swelling the radius of particles up to the required density. In each swelling cycle, the radius increment dr is computed to have a constant density increase dγ = 0.005. To do this, for each swelling step, successive “vibration” cycles are performed. Particles are scanned in a random order, and a trial placement of a larger particle of radius r + 2dr is performed in its original position, all the other particles conserving their initial radius r. If the trial placement is successful, i.e., if no collision occurs with other particles, the particle recovers its initial radius r and stays at its original place. Otherwise, the particle recovers its initial radius r and up to four trial random displacements are performed to find a new position. With this procedure, particles that can “vibrate” freely are not moved whereas particles located in places where they cannot, are moved until finding an appropriate location. Once all the particles “vibrate” freely with an amplitude 2 dr, their radius can be increased to r + dr without producing any overlap and the density of the system can be raised. It has to be pointed out that, to accelerate the simulation and ensure convergence, the swelling cycle is interrupted after a user-defined maximum number of vibrations. In that case, some particles might still not “vibrate” at the end of the cycle. Starting the next swelling cycle allows reorganizing the whole system and the radii of remaining particles can eventually be increased. At the very last swelling cycle, some particles with a radius smaller than required might persist, leading to a suspension of density lower than the target density.
Remark 1: The current version of the model only deals with spherical particles, whereas real granular systems are composed of irregular grains. More complex geometries could be used in the model (parallelepipeds for example) and in that case additional rotations would have to be considered in the random displacements of particles. However, most of the experimental methods used to characterize granular systems assume sphericity for the particles (sieving or laser granulometry for example). Our aim is to develop a fast and simple tool to save expensive experiments, and it therefore needs to be fed with very simple entry data (basically, particle size distribution and density). The model could therefore be used to converge towards optimal proportions of the mixture, but simulations would then have to be completed by a few (much less expensive) experiments to refine the results and account for the real shape of particles.
Remark 2: The presented model is based only on geometrical considerations. Complex interaction forces (grain–grain or fluid–grain) are not considered. As explained above, hydrodynamic effects can be considered through the intrinsic viscosity of particles (2.5 for spheres) [10]. However, interparticle forces (such as Van der Waals forces) could lead to agglomeration of small particles, drastically changing the geometrical configuration of the suspension [16], and then changing the maximum packing fraction (φm). The proposed model is therefore only applicable if the appropriate dosage of dispersant agent is used (High Range Water Reducing Admixture in the case of concrete). These chemical admixtures are, however, quasi systematically used in modern concrete technology, and the range of application of the model therefore covers most of the concretes used nowadays.
2.2. Structural Analysis
It is well known that the ratio (φ/φm) is correlated to the cubic power of the mean distance between particles [1,17]. Indeed, a suspension of solid volume fraction φ can be considered as the dilated state of an initial packing of density φm, where any solid grain of radius r of the initial packing could be replaced by a composite particle of radius λr, made of a hard solid core of radius r surrounded by a shell of fluid of width (λ-1)r. In the following, λ is called “loosening factor” of the system. In this state, the volume fraction of composite particles of radius λr is equal to φm, whereas that of solid particles is φ, and φ/φm = 1/λ3. Knowing the loosening factor λ for a given suspension, its relative viscosity could be computed using models proposed in the literature. In an ideal suspension, the loosening factor λ would have a unique value and could be computed from the distance between any pair of neighbor particles in the system. However, in real suspensions prepared by mixing as well as in simulated suspensions where particles are placed following any random procedure, particle positions do not correspond exactly to the positions of the expanded packing, and some perturbation of the particle positions has to be accounted for. In this case, a loosening factor for the whole system λs is more difficult to define. However, a local loosening factor λi can simply be computed from the distance between particle Pi and its nearest neighbor. It can be reasonably assumed that, in any suspension, the closest particle from a given grain would also be one of its neighbors (in contact) in the condensed packing. As mentioned above, in a random suspension, particle positions do not correspond exactly to the positions of the expanded initial packing and the system is perturbed. In the first order, it can be assumed that the perturbation corresponds to a small variation of the position of grain Pi, the positions of all its neighbor particles being unchanged. In this case, the λs value of the system should correspond to the largest λi value. Indeed, in the non-perturbed system, a particle is equidistant to all its neighbors. In the perturbed system, it will get closer to a given neighbor, which will systematically result in a decrease of its nearest neighbor distance. Finally, in the real suspension, the previous first order hypothesis will not be exact and the largest λi could be larger than λs, because not only the considered grain can move, but also all its neighbors. However, an increase in λi should be rare because in this case, all the neighbor particles would have to get away from it at the same time, which is very unlikely. Identification of λs should therefore be based not exactly on the maximum value of the λi distribution, but rather on a fractile of this distribution, allowing to exclude exceptions. In the following, a fractile 99% has been retained for this structural analysis.
2.3. Dynamical Analysis
Obviously, the number of operations needed to numerically generate a suspension should depend on the mean distance between particles, it should therefore also be corelated to the relative viscosity of the system. Suspensions where grains are far away from each other require less operations (random displacements) for particles than suspensions where grains are closer. During the generation of a suspension containing Np particles, the total number of movements of particles Nv is recorded (number of trial displacements of particles attempted when they cannot vibrate freely). The ratio (Np + Nv) to Np represents the total number of placements and displacements of particles during the suspension generation reported to the total number of particles. This ratio varies between 1 (for very dilute suspensions) to infinity (for a density tending towards φm). It is therefore a good indicator of the “numerical difficulty” to generate the system.
3. Application to Suspensions of Monosized Spheres Systems
Monosized suspensions of 10,000 spherical particles have been generated in periodic cubic containers of varying sizes (depending on the target density), with solid volume fractions φ ranging from 0.025 to 0.5. All the simulations have been repeated 10 times, varying the seed number of the random generator. The loosening factor λ of each system has been computed according to the procedure described in Section 2.2.
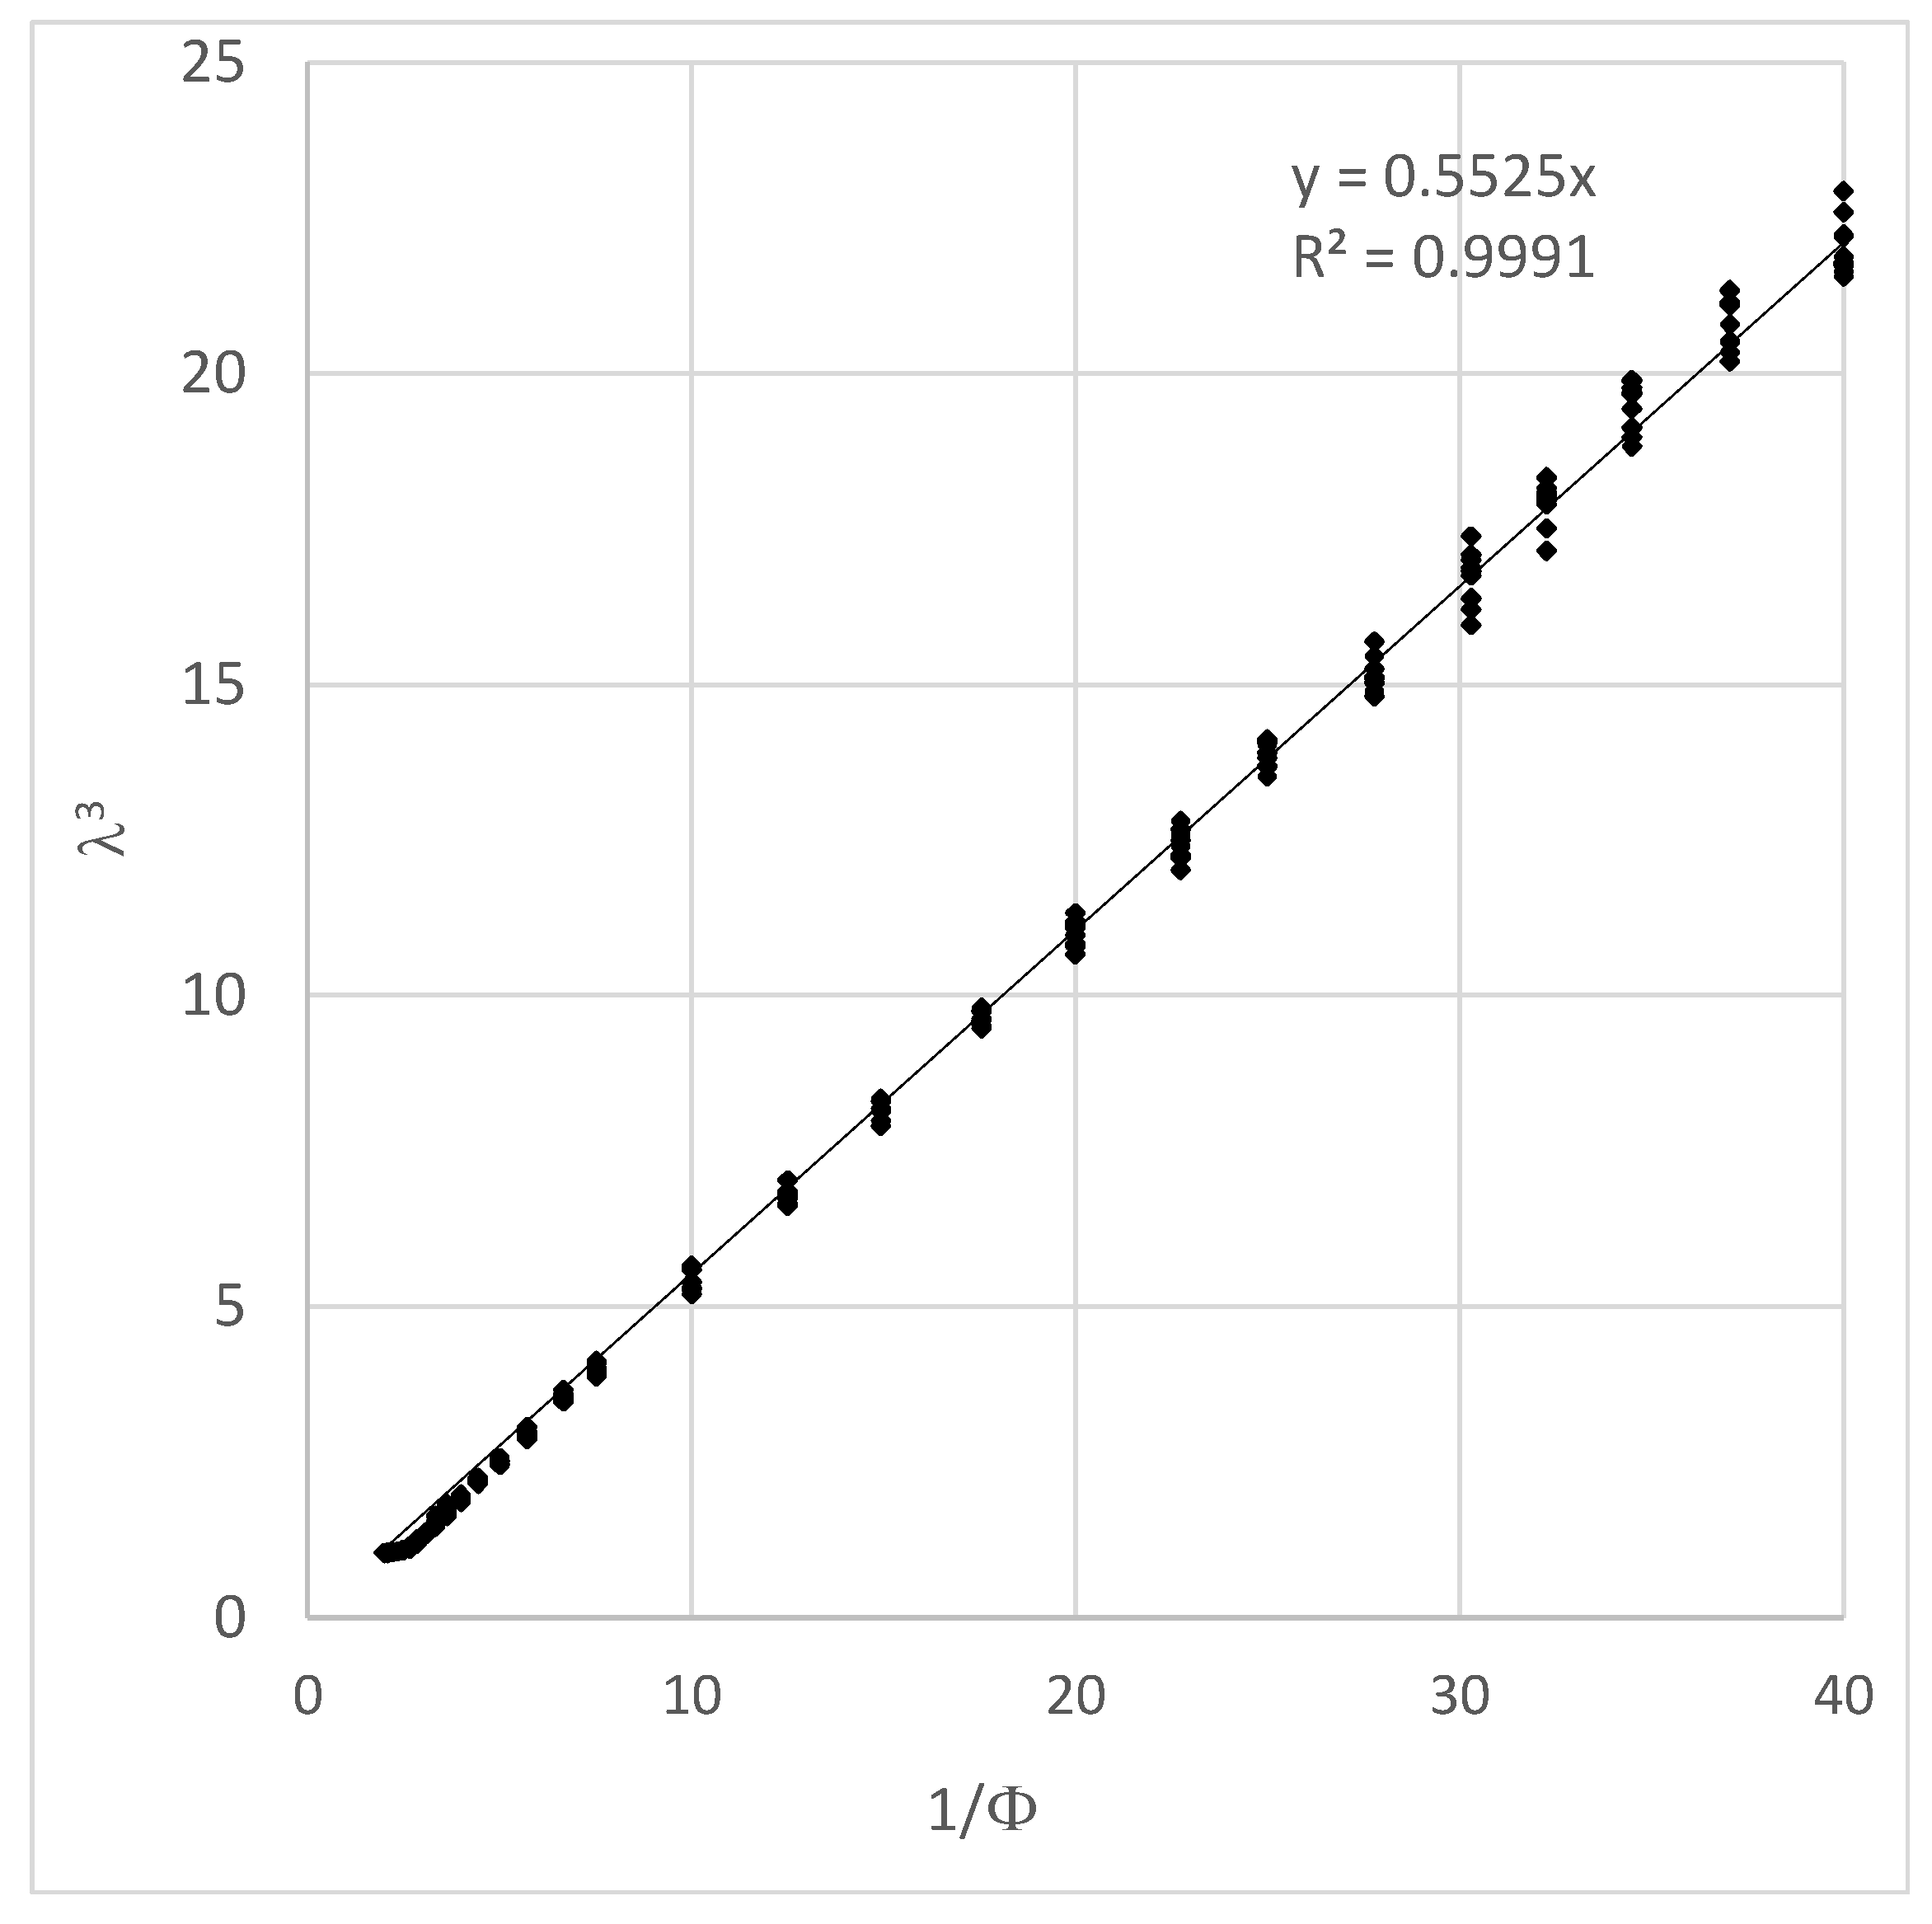
Figure 2 presents the variation of λ3 as a function of 1/φ. As expected, a linear variation is observed, the slope of which can be identified as the packing fraction of the condensed system (φm). The value of φm identified this way (forcing the curve to pass by the origin) is 0.5525 ± 0.0010, which is very close to the random loose packing limit (0.555 ± 0.005) obtained by Onoda and Liniger [13]. This result shows that the proposed numerical procedure can simulate suspensions of varying solid volume fraction (from 0.025 up to 0.5), and that these suspensions can be considered as dilated systems of a packing whose density is close to the random loose packing limit.
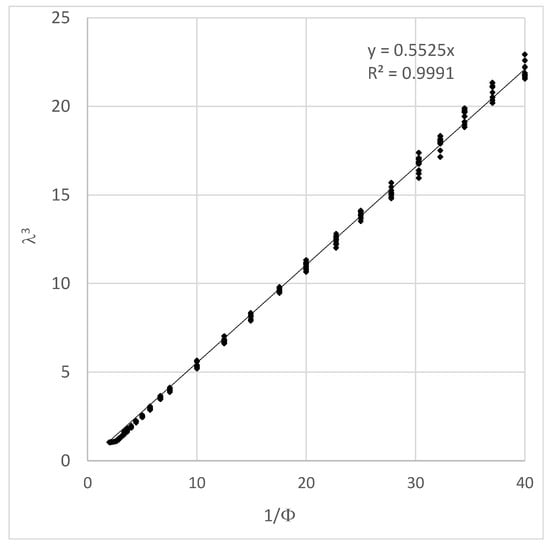
Figure 2.
Variation of as a function of 1/φ for monosized spheres suspensions.
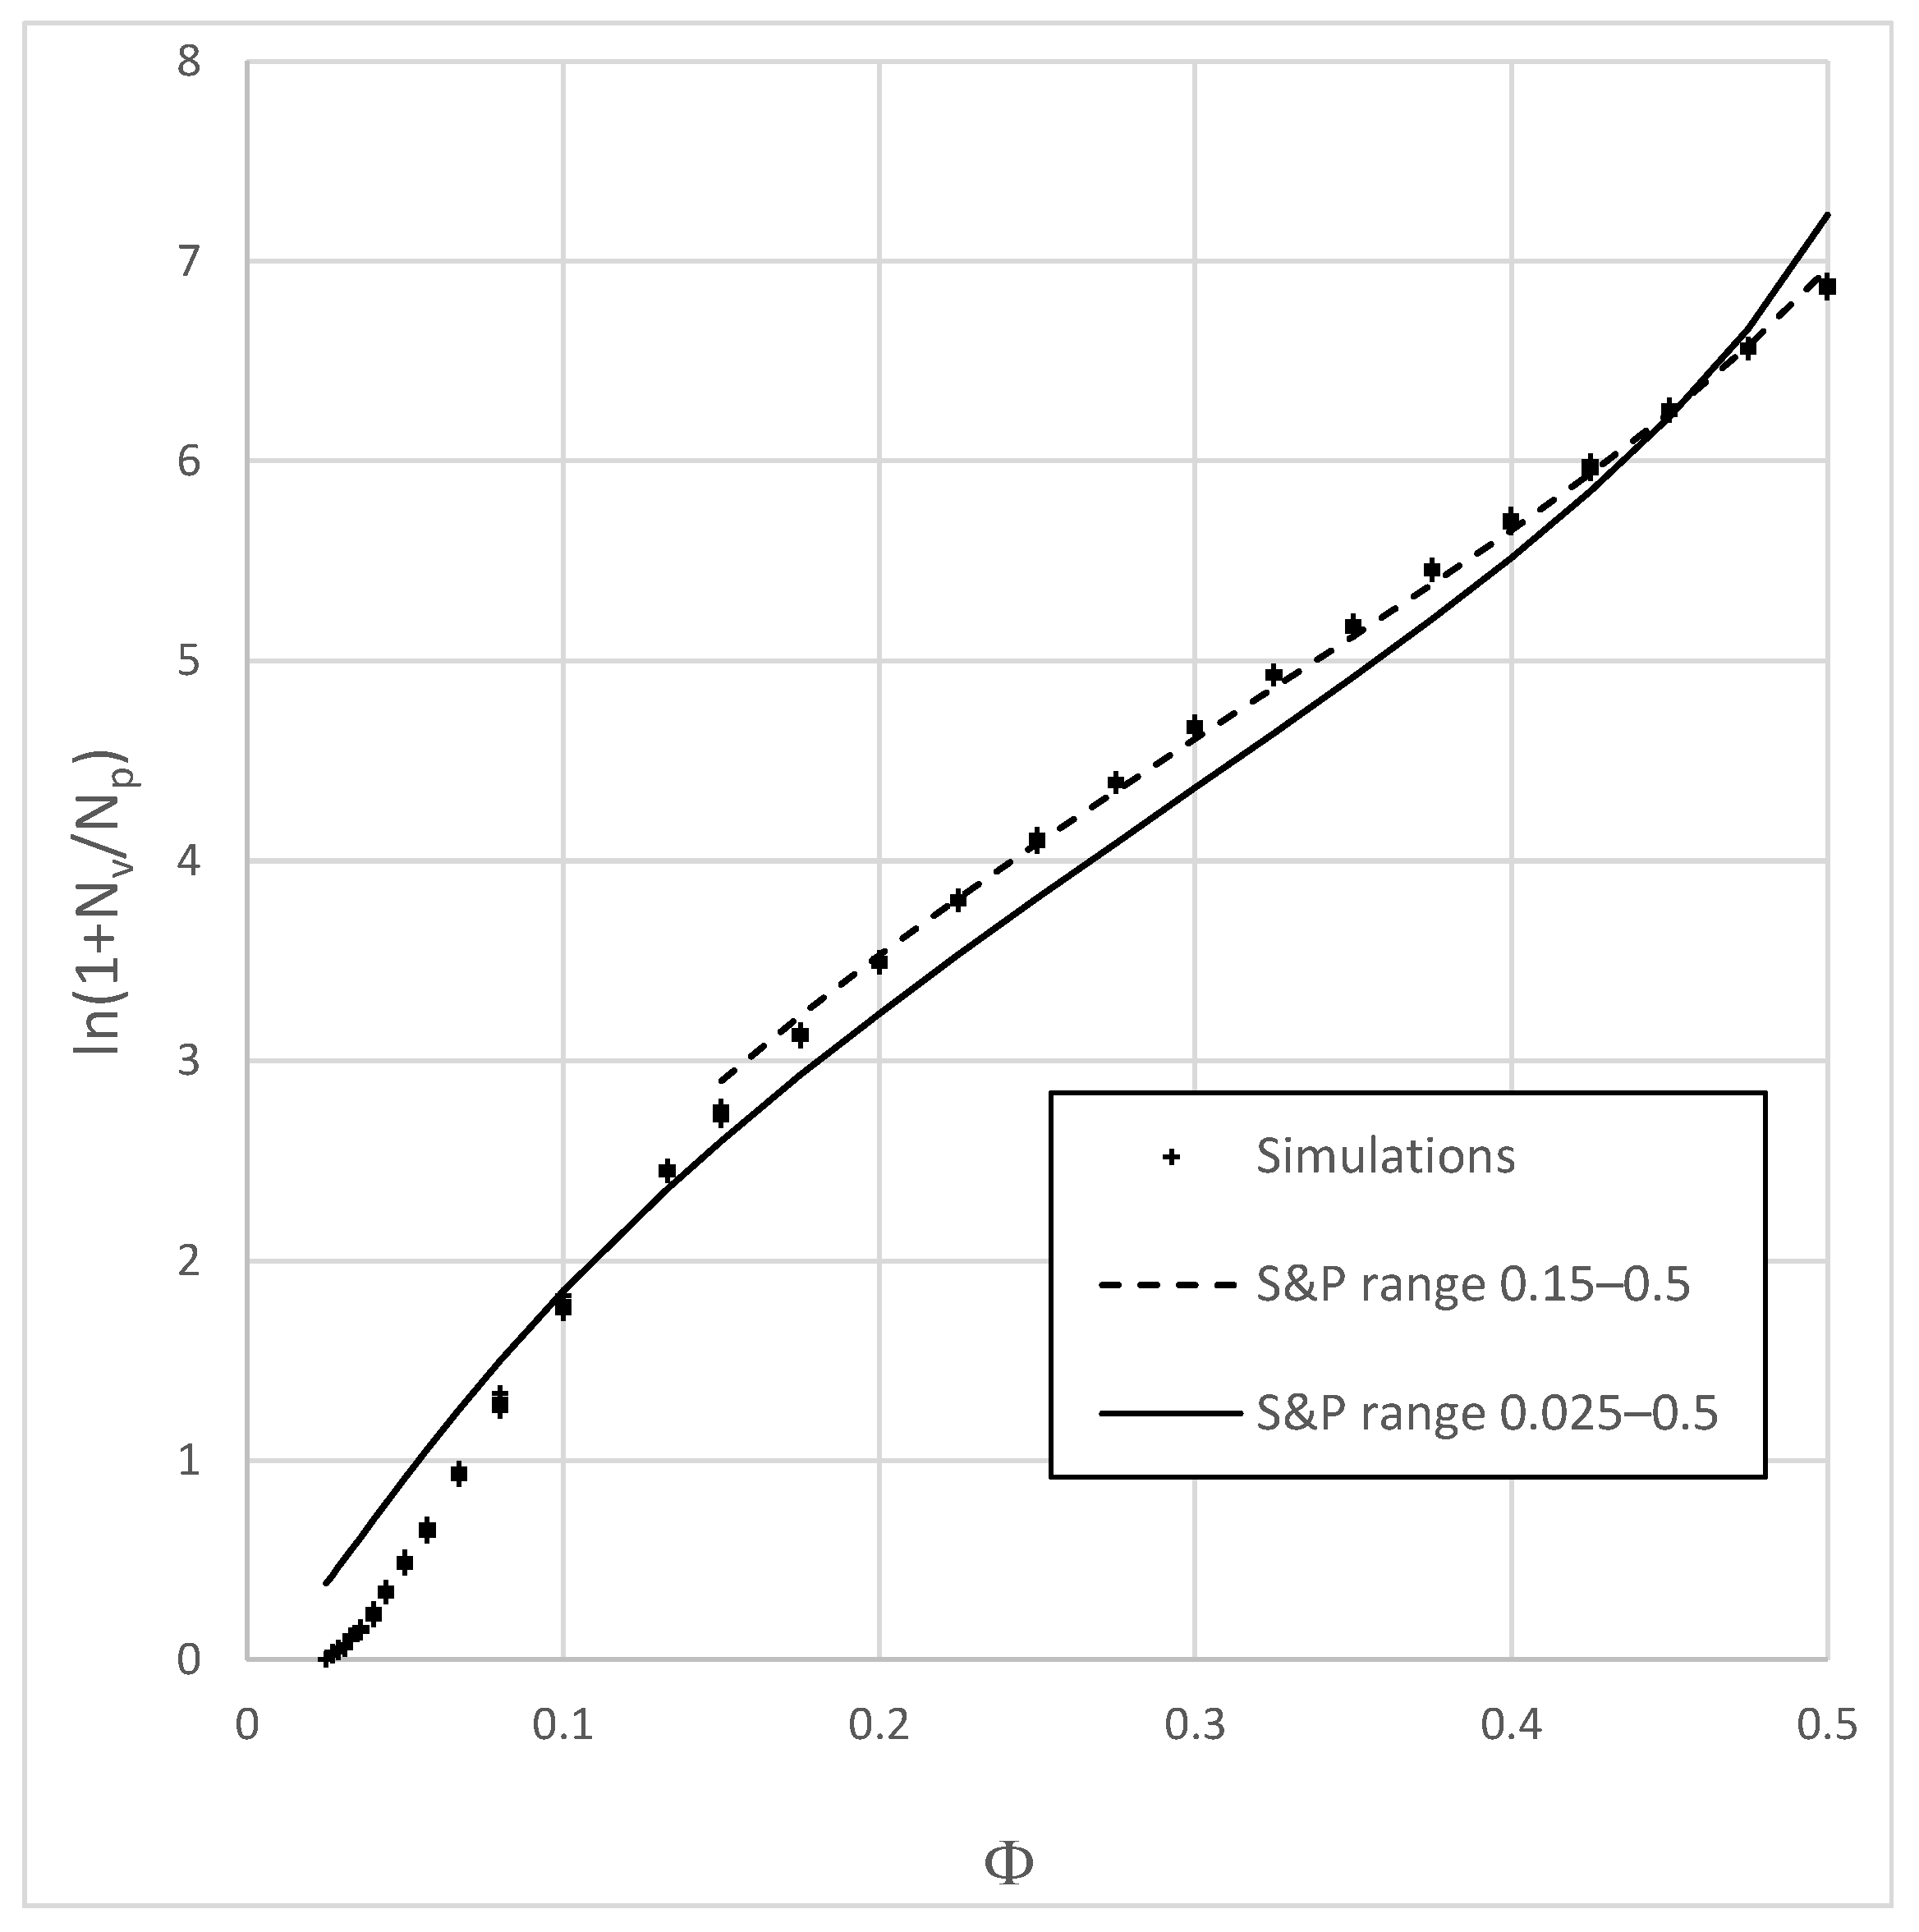
Figure 3 presents the variation of the logarithm of 1 + Nv/Np as a function of density for all the simulations. It is compared to the variation of ηr as a function of φ, ηr being the relative viscosity computed with the relation of Sengun and Probstein [11] (Equations (1) and (2)).
where
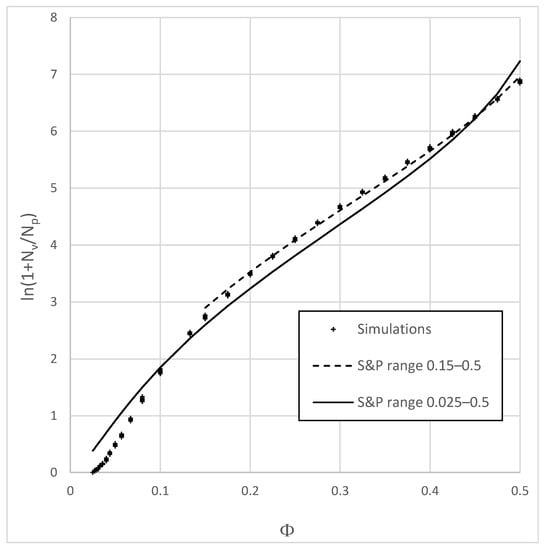
Figure 3.
Variation of ln(1 + Nv/Np) as a function of φ for monosized spherical particles systems. Points are simulation results with systems of 10,000 particles. Solid and dashed lines are the best fit obtained with Equation (1), respectively, for the whole range of studied densities (0.025 to 0.5) and for densities comprised between 0.15 and 0.5.
C and φm have been identified using a least-squares error method, on a logarithmic basis as for Sengun and Probstein. Two ranges of densities have been considered for this identification: 0.025–0.5 and 0.15–0.5, excluding the less concentrated systems. Indeed, in the dynamical analysis, viscosity is assessed from the number of numerical operations needed to generate the suspension. In dilute suspensions, number of operations per particles is much smaller than in more concentrated systems, which implies a poor representativity of the dynamical analysis.
Figure 3 shows that the number of operations per particle needed to generate the suspension (1 + Nv/Np) can be described properly using a classical viscosity–density relationship (1). The fit for the range of densities 0.15–0.5 (R2 = 0.9974) is much better than for 0.025–0.5 (R2 = 0.9906). The values obtained in the former case for φm and C are, respectively, 0.5884 and 78.3. C depends on the used placing procedure (number of density increments, number of trial random displacements in case of a collision, etc.). The φm value is larger, but close to the random loose packing limit (0.555 ± 0.005) identified by Onoda and Liniger [13]. The good correlation between Equation (1) and the numerical results, together with the value obtained for φm (close to the random loose packing limit) both show that (1 + Nv/Np) gives a good estimate of the relative viscosity of the suspension. Nv can be easily computed during the generation procedure itself and does not need any postprocessing of the results, it could therefore be used for the optimization of larger systems.
The fit on Figure 3 between numerical results and Equation (1) is not perfect and C and φm both depend on the range of densities chosen for the adjustment. Table 1 shows the values obtained for these two parameters for five different ranges of densities. Both C and φm values increase with the density range. However, the comparison is easier with a single variable parameter, and in a second analysis the C value is forced to = 63, being the mean value of C for the five studied ranges of densities. In that case, it can be observed that the correlation coefficient is still very high. Moreover, the φm values are much closer for ranges of density from 0.15 up to 0.40/0.45. For larger densities, the φm value starts to increase significantly. This suggests that the modified RSA procedure used for the building of suspensions leads to a compaction of the system when the density gets closer to the maximum packing fraction. For densities significantly smaller than φm (about 80% of φm), it can be considered that the procedure allows the simulation of suspensions of varying density without compacting the system and therefore without affecting its maximum packing fraction.

Table 1.
Fitting parameters C and φm obtained for adjustments performed on different ranges of densities with Equation (1).
4. Application to Bidisperse Suspensions
Bidisperse spherical particles systems with particle size ratios 4:1 and 2:1 (ratio between the radius of large particles R1 to the radius of small particles R2) have been studied and compared with experimental results of the literature. Systems containing more than 100,000 particles have been generated with varying proportions of large spheres (X1) using the previous procedure with the following modification, to adapt it to the case of polydisperse spherical particles systems. Np1 large particles are placed first and ηr,1 = 1 + Nv1/Np1 is computed. Then, Np2 small grains are added and allowed to swell in the porosity of the previous system, and ηr,2 is determined similarly. The resulting viscosity is finally computed according to the Arrhenius [18] relation as following (Equation (3)):
For each particle size ratio, and each proportion of large particles, several suspensions of density ranging from 0.20 up to 0.65, with steps of 0.025 have been generated. No system of density smaller than 0.20 has been simulated because, as shown in Figure 3, the fit between 1 + Nv/Np and Equation (1) is poor for low density suspensions and in that case ηr,1 and/or ηr,2 (depending on the proportion of large particles) would not be computed accurately. Moreover, after a first estimate of the maximum packing fraction φm, the range of density has been limited to a value close to 0.8 φm to avoid any over compaction of the suspensions. The range of density finally retained for the analysis of results is 0.2 to 0.6 for systems 4:1 and 0.2 to 0.5 for systems 2:1. Then, the C, and φm values of each system have been computed by fitting Equation (1) to the variation of ηr as a function of density, using a least-squares error method on a logarithmic basis.
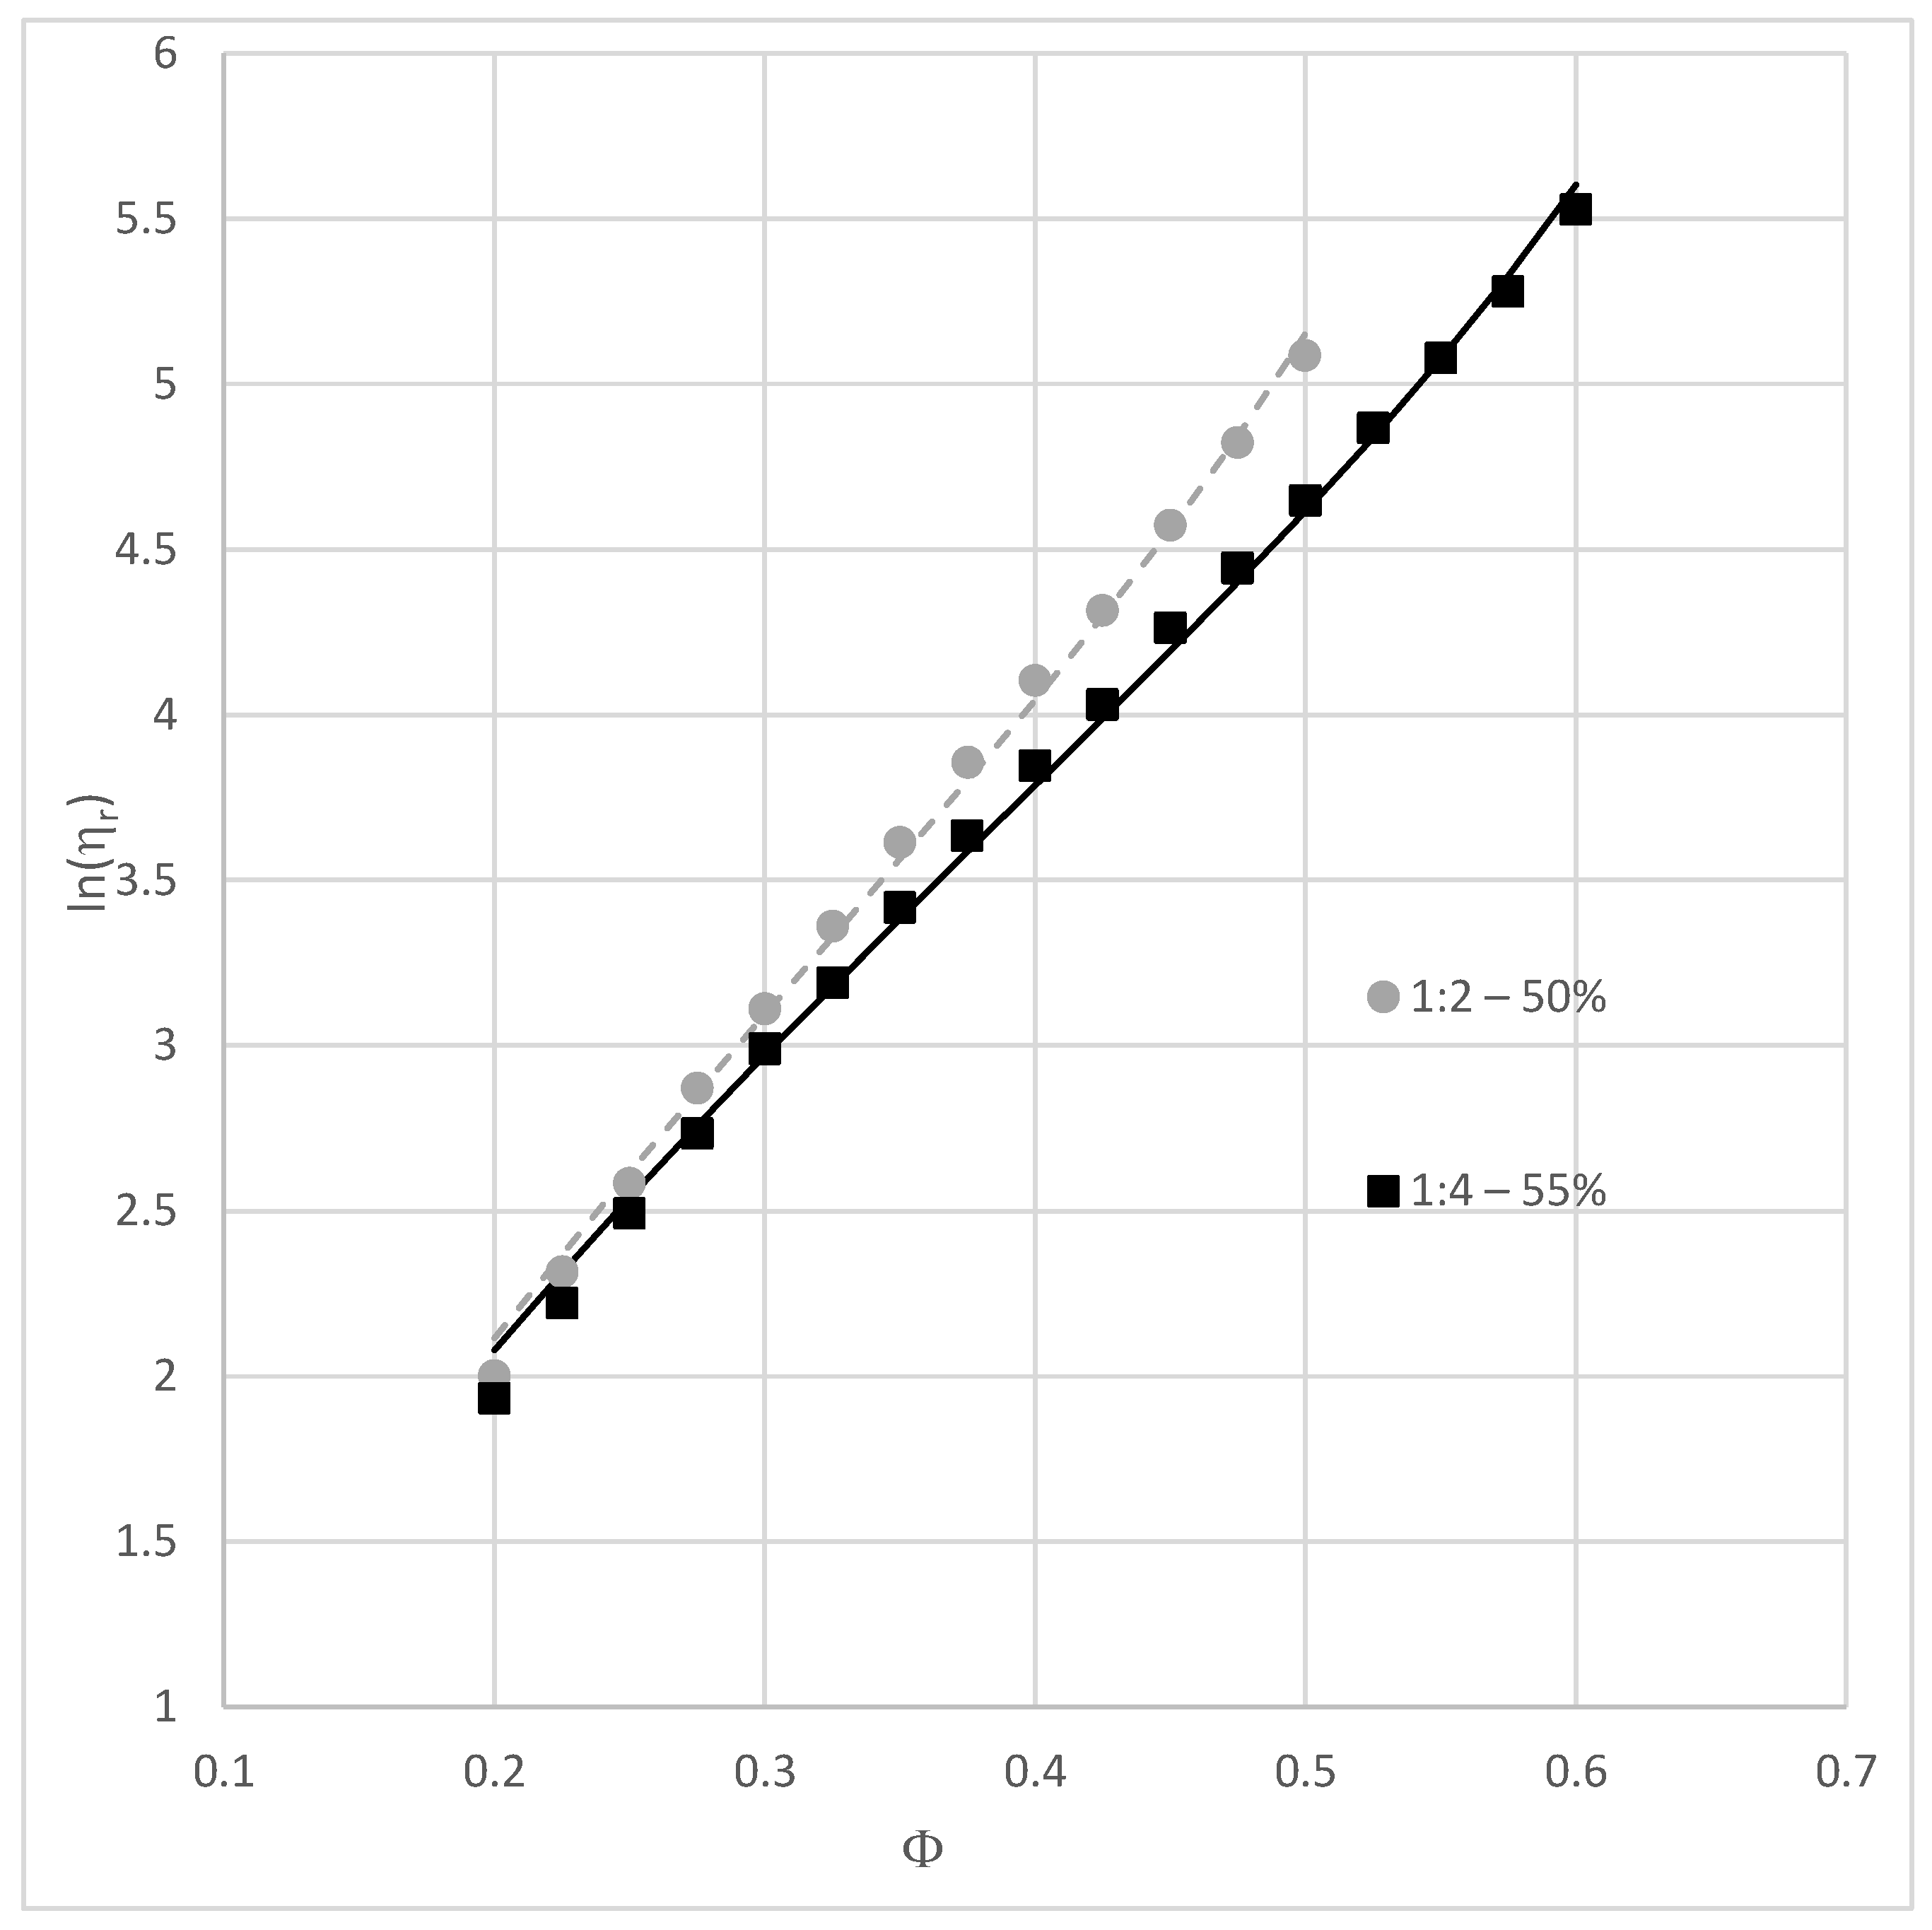
Figure 4 presents the variation of ln(ηr) as a function of density for two systems (1:2, X1 = 0.5 and 1:4, X1 = 0.55). The figure also presents the best fit obtained with Equation (1) in both cases and shows that for bidisperse systems, the variation of relative viscosity computed according to the Arrhenius relation (Equation (3)) as a function of solid volume fraction can also be described very satisfactorily by the Sengun and Probstein relationship [11]. For these two systems, ten successive simulations have been repeated for all the studied solid volume fractions to assess the repeatability of the procedure. The mean values obtained for C and φm for system (1:2, X1 = 0.5) are 20.0 and 0.6257 with standard deviations of 0.320 and 0.0017. The mean values obtained for C and φm for system (1:4, X1 = 0.55) are 27.3 and 0.7368 with standard deviations of 0.517 and 0.0019.
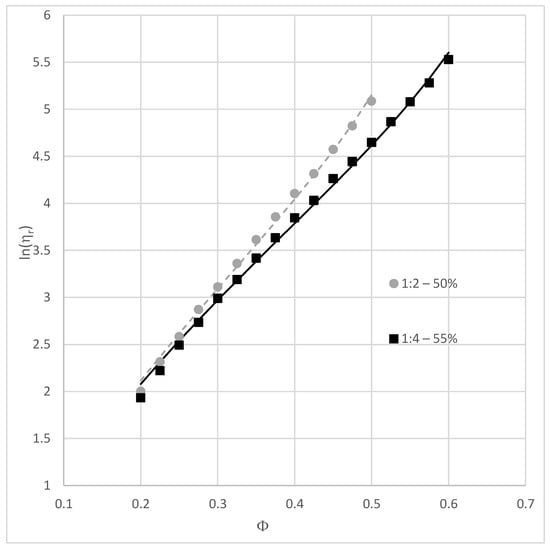
Figure 4.
Variation of ln(ηr) as a function of density for systems 1:2 with 50% large particles and 1:4 with 55% large particles and best fit with Equation (1) (R2 = 0.9975 and 0.9973, respectively).
The fit with Equation (1) is good (R2 larger or equal to 0.9973), which shows that this equation allows for a good prediction of the packing densities. However, numerical results could also be approached satisfactorily with a linear relation (R2 larger than or equal to 0.9990 in both cases). This observation also stands for all the other studied systems and suggests that the slope of the variation of ln(ηr) as a function of density could also be used to compare the systems, the larger the slope, the higher the viscosity.
The C value strongly depends on the particle size ratio, and to a lesser extent on the proportion of large particles (X1). For a particle size ratio of 1:4, C varies between 25.3 and 33.0, and its value is comprised between 19.9 and 21.5 for particle size ratio 1:2. Whatever the size ratio, C is much lower than the value identified previously on monosized systems (78.3). This large difference probably depends on the placing procedure, which is carried out in two steps for bidisperse systems.
To assess the role of the two step procedure, the φm value of the monosized systems containing 10,000 particles has been recomputed in two steps, as for the bidisperse systems, by first placing a part of the particles (from 20 to 80%, that are in this case considered as “large grains”), letting them swell up to the final radius, and then the remaining part (these systems are noted 1:1 in the following). Table 2 presents the obtained values for C and φm for the different proportions of particles placed in the first step (X1). It can be observed that, for proportions comprised between 0.3 and 0.7, the C value is comprised between 20.6 and 24.3, which is close to the values obtained for systems of particle size ratio 1:2. Additionally, the φm value for all these systems varies between 0.5045 and 0.5204, the variation being larger for proportions X1 lower than 0.3 or larger than 0.7. The packing densities obtained for systems 1:1 (monosized systems placed in two steps) therefore vary significantly as a function of the proportion of particles placed in the first step. A constant value of the packing density is expected here because the systems are the same, simulations only differ from the placing procedure. Placing part of the grains in the first step of course adds constraints to the system as the first batch of particles cannot be moved once they have reached their final radius. These constraints depend however on the specific surface of particles and are therefore maximized when the size of grains is the same for the two steps of the process. This effect of the placing procedure should therefore be less pronounced for systems of increasing size ratios, but for the latter the influence is more difficult to quantify, and we neglect it in the following.

Table 2.
Fitting parameters C and φm obtained for adjustments performed on monosized systems placed in two steps (systems 1:1), with a varying proportion of particles placed in the first step.
In order to compare the bidisperse systems with a single value, it has been decided to force C to ( being the mean value of C for all the proportions of large particles studied for each size ratio, = 28.4 for 4:1 systems, and = 20.7 for 2:1 systems), and only φm is identified. Even with a fixed value of C, the correlation between ηr and Equation (1) is still good (R2 larger than 0.9962).
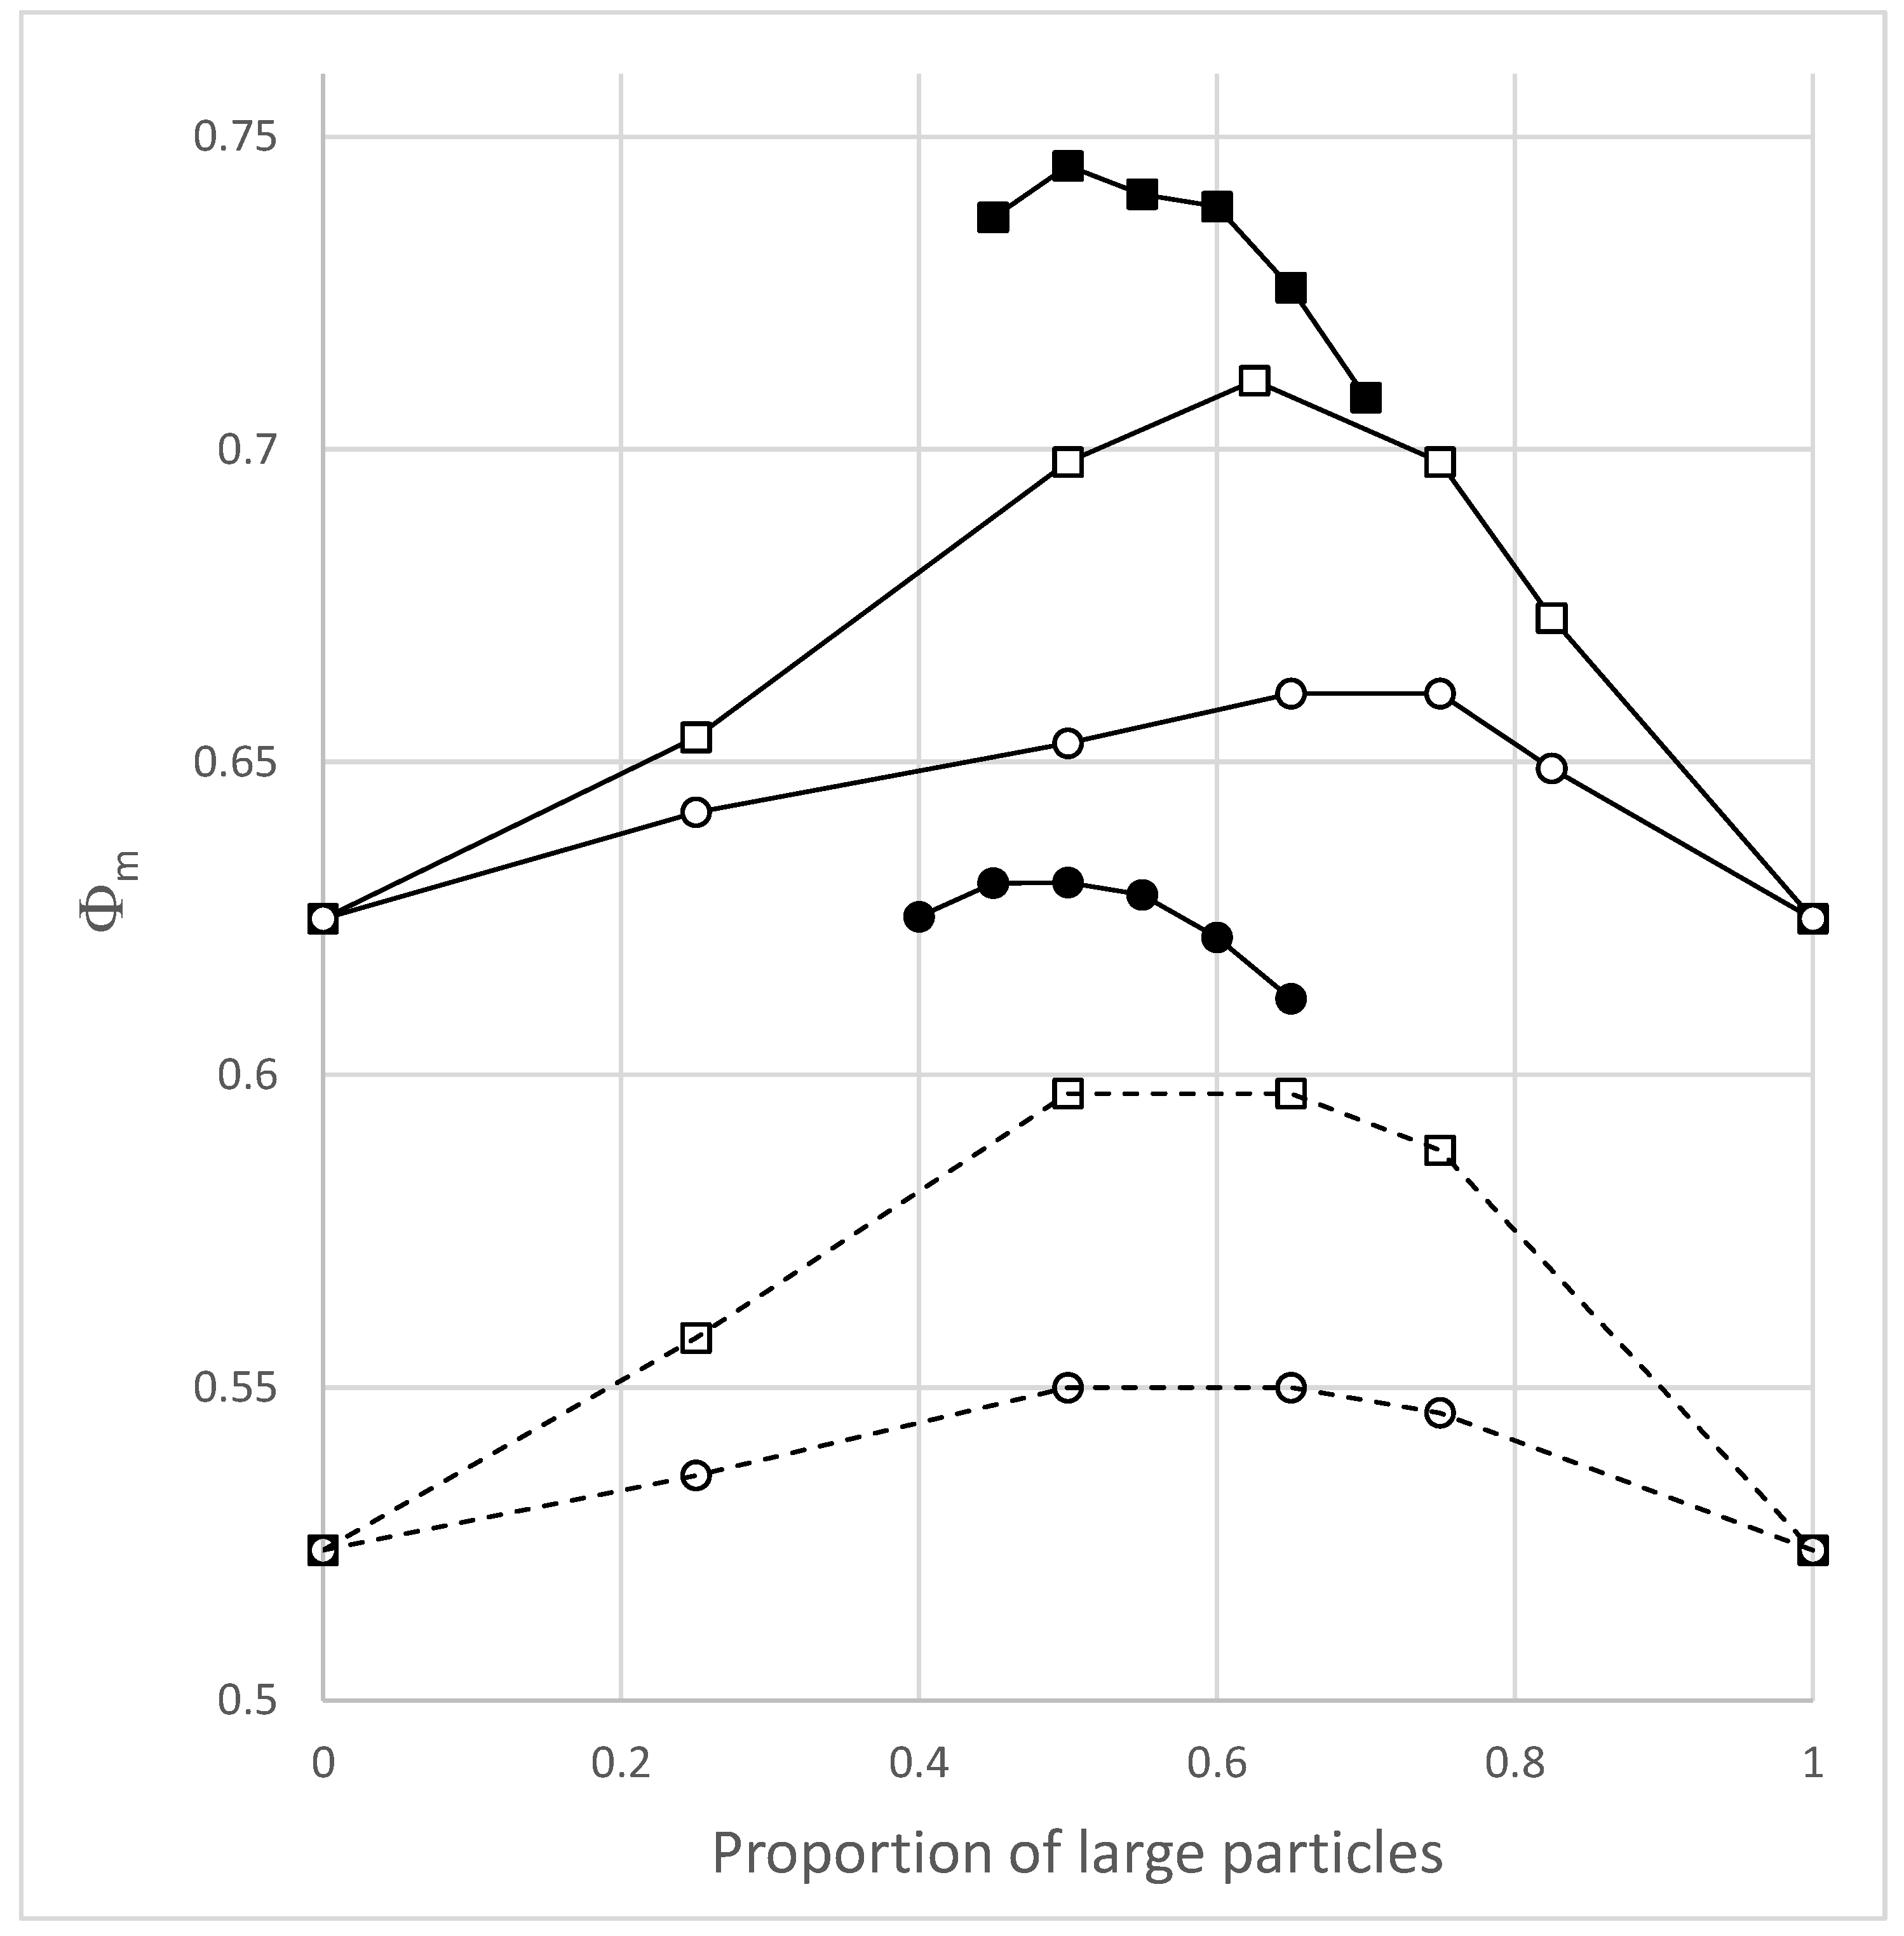
Figure 5 shows the variation of φm as a function of the proportion of large particles for the two studied systems (4:1, and 2:1). These results are compared to those obtained experimentally by Shapiro and Probstein [12] on bidisperse 4:1 and 2:1 suspensions and packings. The optimum values obtained in our simulations for the 4:1 and 2:1 suspensions (0.50) lie in the range of optimum proportions measured by Shapiro and Probstein on suspensions (between 0.5 and 0.65). For the 2:1 suspensions, the variation of φm with the proportion of large particles is very flat for proportions of large grains comprised between 0.45 and 0.55, and a neat optimum is more difficult to define. Overall, the simulations seem to give a good estimate of optimum proportions, the predictions being probably more accurate as the size ratio increases.
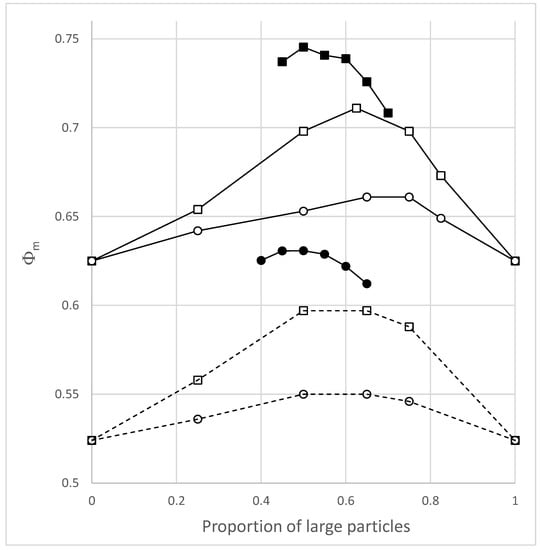
Figure 5.
Variation of φm as a function of the proportion of large particles for bidisperse spherical suspensions of size ratios 4:1 (squares) and 2:1 (circles). Solid symbols correspond to simulations, empty symbols correspond to experimental results of Shapiro and Probstein [12] for similar suspensions (with dotted lines) and for dry packings (solid lines). Adapted with permission from Ref. [12] (License Number RNP/22/JUN/054785, 06/16/2022).
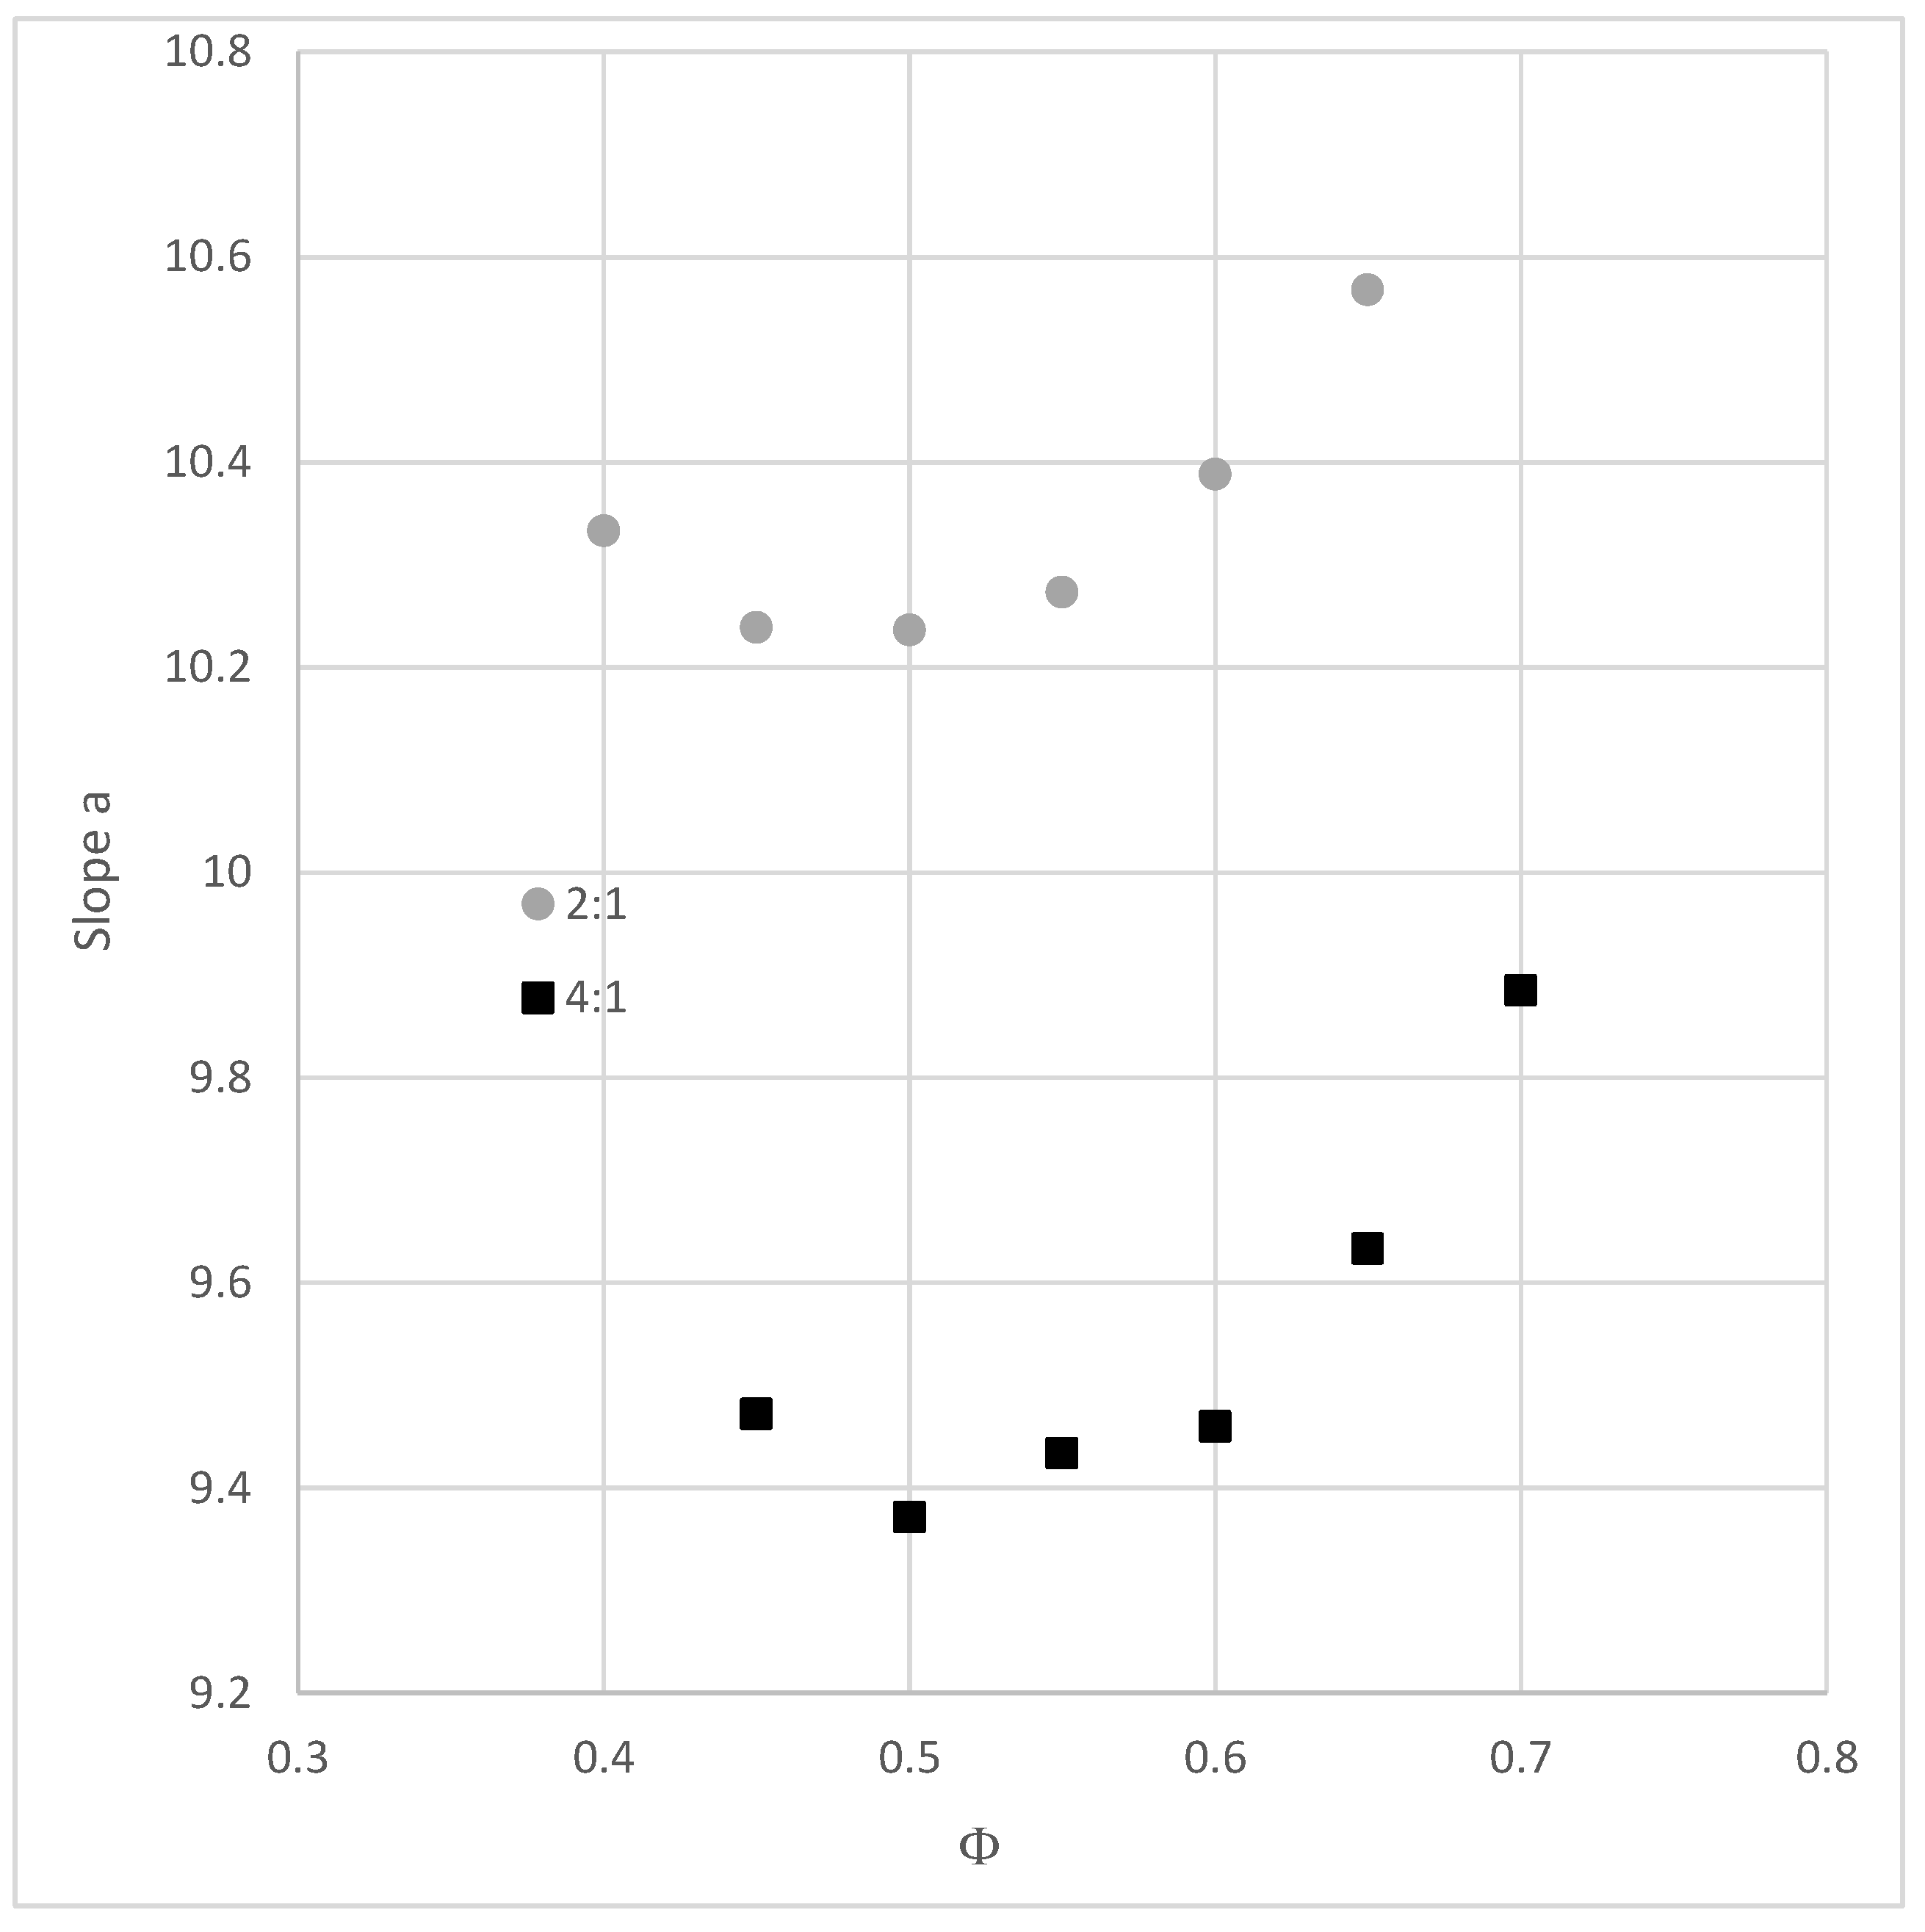
Figure 6 shows the variation of the slope of the relation ln(ηr) = f(φ) for the two studied systems (4:1 and 2:1). This result leads to similar conclusions than the previous analysis, the optimum proportion for 4:1 systems is 0.5 and that of 2:1 systems is comprised between 0.45 and 0.5. The slope of the viscosity–density relation does not give the maximum packing density of the system, but it seems sufficient to identify the optimum proportions and could therefore be used as an efficient parameter for the optimization of granular mixtures.
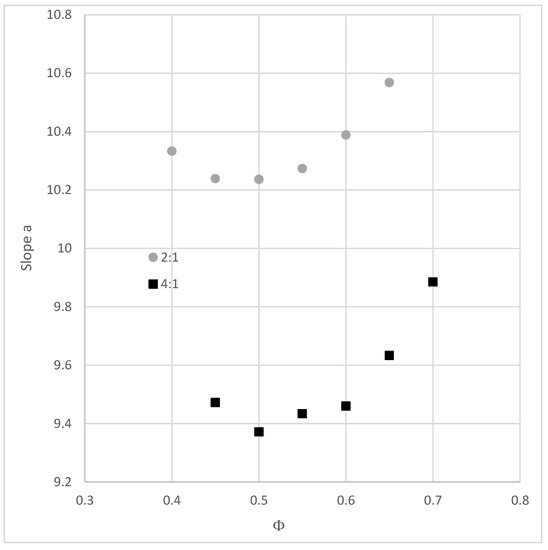
Figure 6.
Variation of the slope “a” of the relation ln(ηr) = f(φ) for the 4:1 and 2:1 bidisperse spherical particles systems.
5. Conclusions
The main objective of this paper was to propose a simple numerical model allowing us to optimize the mixture proportions of granular systems with very few entry data (basically the particle size distribution). The principle of the model was first tested on monosized spheres systems, and it was then applied to bidisperse spherical particles mixtures and compared successfully to results of the literature.
Monosized spheres suspensions of varying density have first been simulated with an original numerical procedure. Simulated systems have then been analyzed following two different approaches: a structural analysis of the final suspension or a dynamical analysis of the whole generation of the system. The structural analysis showed that the generated suspensions can be considered as dilated states of a denser packing whose density is very close to the well-known random loose packing limit. The dynamical analysis has shown that the variation of the number of operations per particle needed to generate the suspension follows a classical viscosity–density relationship, showing that the “numerical difficulty” to generate the suspension is correlated to its viscosity and suggesting also that the maximum packing fraction of the system is close to the random loose packing limit.
The numerical procedure used for the generation of suspensions has then been extended to bidisperse systems, placing first the large grains and then the small ones. The viscosity of the whole suspension has been calculated by combining the viscosities of each granular class, and the optimum proportions of the bidisperse suspensions have been identified. The two steps procedure could be questioned because no interaction (the so-called “loosening effect”) between large and small particles is considered during the placement of large grains. However, the optimum proportions of simulated systems compared quite well to the optimum proportions identified experimentally in the literature, and this assumption does not seem to affect the optimization results. This might be because the optimum proportion is researched not from the generation of packings, but of suspensions, for which the presence of the interstitial fluid between particles could decrease the influence of the loosening effect.
A similar approach could be used for the optimization of polydisperse systems such as concrete containing recycled materials, placing particles from the largest to the smallest, providing thus an efficient and fast tool for the optimization of the proportions of granular mixtures of known particle size distributions.
Author Contributions
Conceptualization, methodology, software, writing—original draft preparation: S.R.; validation, formal analysis, resources, writing—review and editing, S.R. and M.E.K.B. All authors have read and agreed to the published version of the manuscript.
Funding
This research received no external funding. The APC was funded by the Erasmus+ project KA2—Higher education strategic partnerships no.2018-1-RO01-KA203-049214, “Rehabilitation of the Built Environment in the Context of Smart City and Sustainable Development Concepts for Knowledge Transfer and Lifelong Learning—RE-BUILT”.
Institutional Review Board Statement
Not applicable.
Informed Consent Statement
Not applicable.
Data Availability Statement
The data presented in this study are available in the article.
Conflicts of Interest
The authors declare no conflict of interest.
References
- De Larrard, F. Concrete Mixture Proportioning: A Scientific Approach; E & FN Spon: London, UK, 1999. [Google Scholar]
- Cyr, M. Influence of supplementary cementitious materials (SCMs) on concrete durability. In Woodhead Publishing Series in Civil and Structural Engineering, Eco-Efficient Concrete; Pacheco-Torgal, F., Jalali, S., Labrincha, J., John, V.M., Eds.; Woodhead Publishing: Sawston, UK, 2013; pp. 153–197. ISBN 9780857094247. [Google Scholar]
- de Siqueira, A.A.; Cordeiro, G.C. Sustainable Cements Containing Sugarcane Bagasse Ash and Limestone: Effects on Compressive Strength and Acid Attack of Mortar. Sustainability 2022, 14, 5683. [Google Scholar] [CrossRef]
- Grellier, A.; Bulteel, D.; Bouarroudj, M.E.K.; Rémond, S.; Zhao, Z.; Courard, L. Alternative hydraulic binder development based on brick fines: Influence of particle size and substitution rate. J. Build. Eng. 2021, 39, 102263. [Google Scholar] [CrossRef]
- Chu, S.H.; Poon, C.S.; Lam, C.S.; Li, L. Effect of natural and recycled aggregate packing on properties of concrete blocks. Constr. Build. Mater. 2021, 278, 122247. [Google Scholar] [CrossRef]
- de Larrard, F.; Sedran, T. Mixture-proportioning of high-performance concrete. Cem. Concr. Res. 2002, 32, 1699–1704. [Google Scholar] [CrossRef]
- Mooney, M. The viscosity of a concentrated suspension of spherical particles. J. Colloid Sci. 1951, 6, 162–170. [Google Scholar] [CrossRef]
- Krieger, I.M.; Dougherty, T.J. A mechanism for non-Newtonian flow in suspensions of spherical particles. Trans. Soc. Rheol. 1959, 3, 137–152. [Google Scholar] [CrossRef]
- Quemada, D. Rheology of concentrated disperse systems and minimum energy dissipation principle. Rheol. Acta 1977, 16, 82. [Google Scholar] [CrossRef]
- Brouwers, H.J.H. Viscosity of a concentrated suspension of rigid monosized particles. Phys. Rev. E 2010, 81, 051402. [Google Scholar] [CrossRef] [PubMed] [Green Version]
- Sengun, M.Z.; Probstein, R.F. Bimodal model of slurry viscosity with application to coal-slurries. Part 1. Theory and Experiment. Reol. Acta 1989, 28, 382–393. [Google Scholar]
- Shapiro, A.P.; Probstein, R.F. Random Packings of Spheres and Fluidity Limits of Monodisperse and Bidisperse Suspensions. Phys. Rev. Lett. 1992, 68, 1422. [Google Scholar] [CrossRef] [PubMed]
- Onoda, G.Y.; Liniger, E.G. Random loose packings of uniform spheres and the dilatancy onset. Phys. Rev. Lett. 1990, 64, 2727. [Google Scholar] [CrossRef] [PubMed]
- Widom, B.J. Random Sequential Addition of Hard Spheres to a Volume. J. Chem. Phys. 1966, 44, 3888–3894. [Google Scholar] [CrossRef]
- Rémond, S. Compaction of confined mono-sized spherical particles systems under symmetric vibration: A suspension model. Phys. A 2004, 337, 411–427. [Google Scholar] [CrossRef]
- Manounou, A.K.; Rémond, S. Discrete element modeling of the microstructure of fine particle agglomerates in sheared dilute suspension. Phys. A 2014, 412, 66–83. [Google Scholar] [CrossRef]
- Frankel, N.A.; Acrivos, A. On the viscosity of a concentrated suspension of solid spheres. Chem. Eng. Sci. 1967, 22, 847. [Google Scholar] [CrossRef]
- Arrhenius, S. Über die Innere Reibung Verdünnter Wässeriger Lösungen. Z. Phys. Chem. 1887, 1, 285–298. [Google Scholar] [CrossRef]
Publisher’s Note: MDPI stays neutral with regard to jurisdictional claims in published maps and institutional affiliations. |
© 2022 by the authors. Licensee MDPI, Basel, Switzerland. This article is an open access article distributed under the terms and conditions of the Creative Commons Attribution (CC BY) license (https://creativecommons.org/licenses/by/4.0/).

