
Multi-Criteria Decision-Making System for Wind Farm Site-Selection Using Geographic Information System (GIS): Case Study of Semnan Province, Iran


Abstract
:1. Introduction
- It is widely used because it is easy to understand and apply.
- It is very compatible with GIS which is extensively used for land analysis and site-selection problems.
- Possibility of hierarchical modeling, adoption with verbal judgments, and consistency verification [36].
- AHP can be combined with other methods, including mathematical programming, fuzzy sets, genetic algorithms, neural networks, etc. [36].
- It considers both quantitative and qualitative criteria to interpret the problem [37].
- AHP can apply various sensitivity analyses to criteria [38].
- AHP facilitates the decision-making process, using the pairwise comparison among the criteria [38].
- AHP can consider the consistency and inconsistency of the alternatives, which is one of the essential benefits of this method [38].
- In site-selection problems, where the main goal is to select the best places, simple methods such as AHP are sufficient, and more complicated methods such as fuzzy AHP do not necessarily lead to different results [39].
2. Literature Review
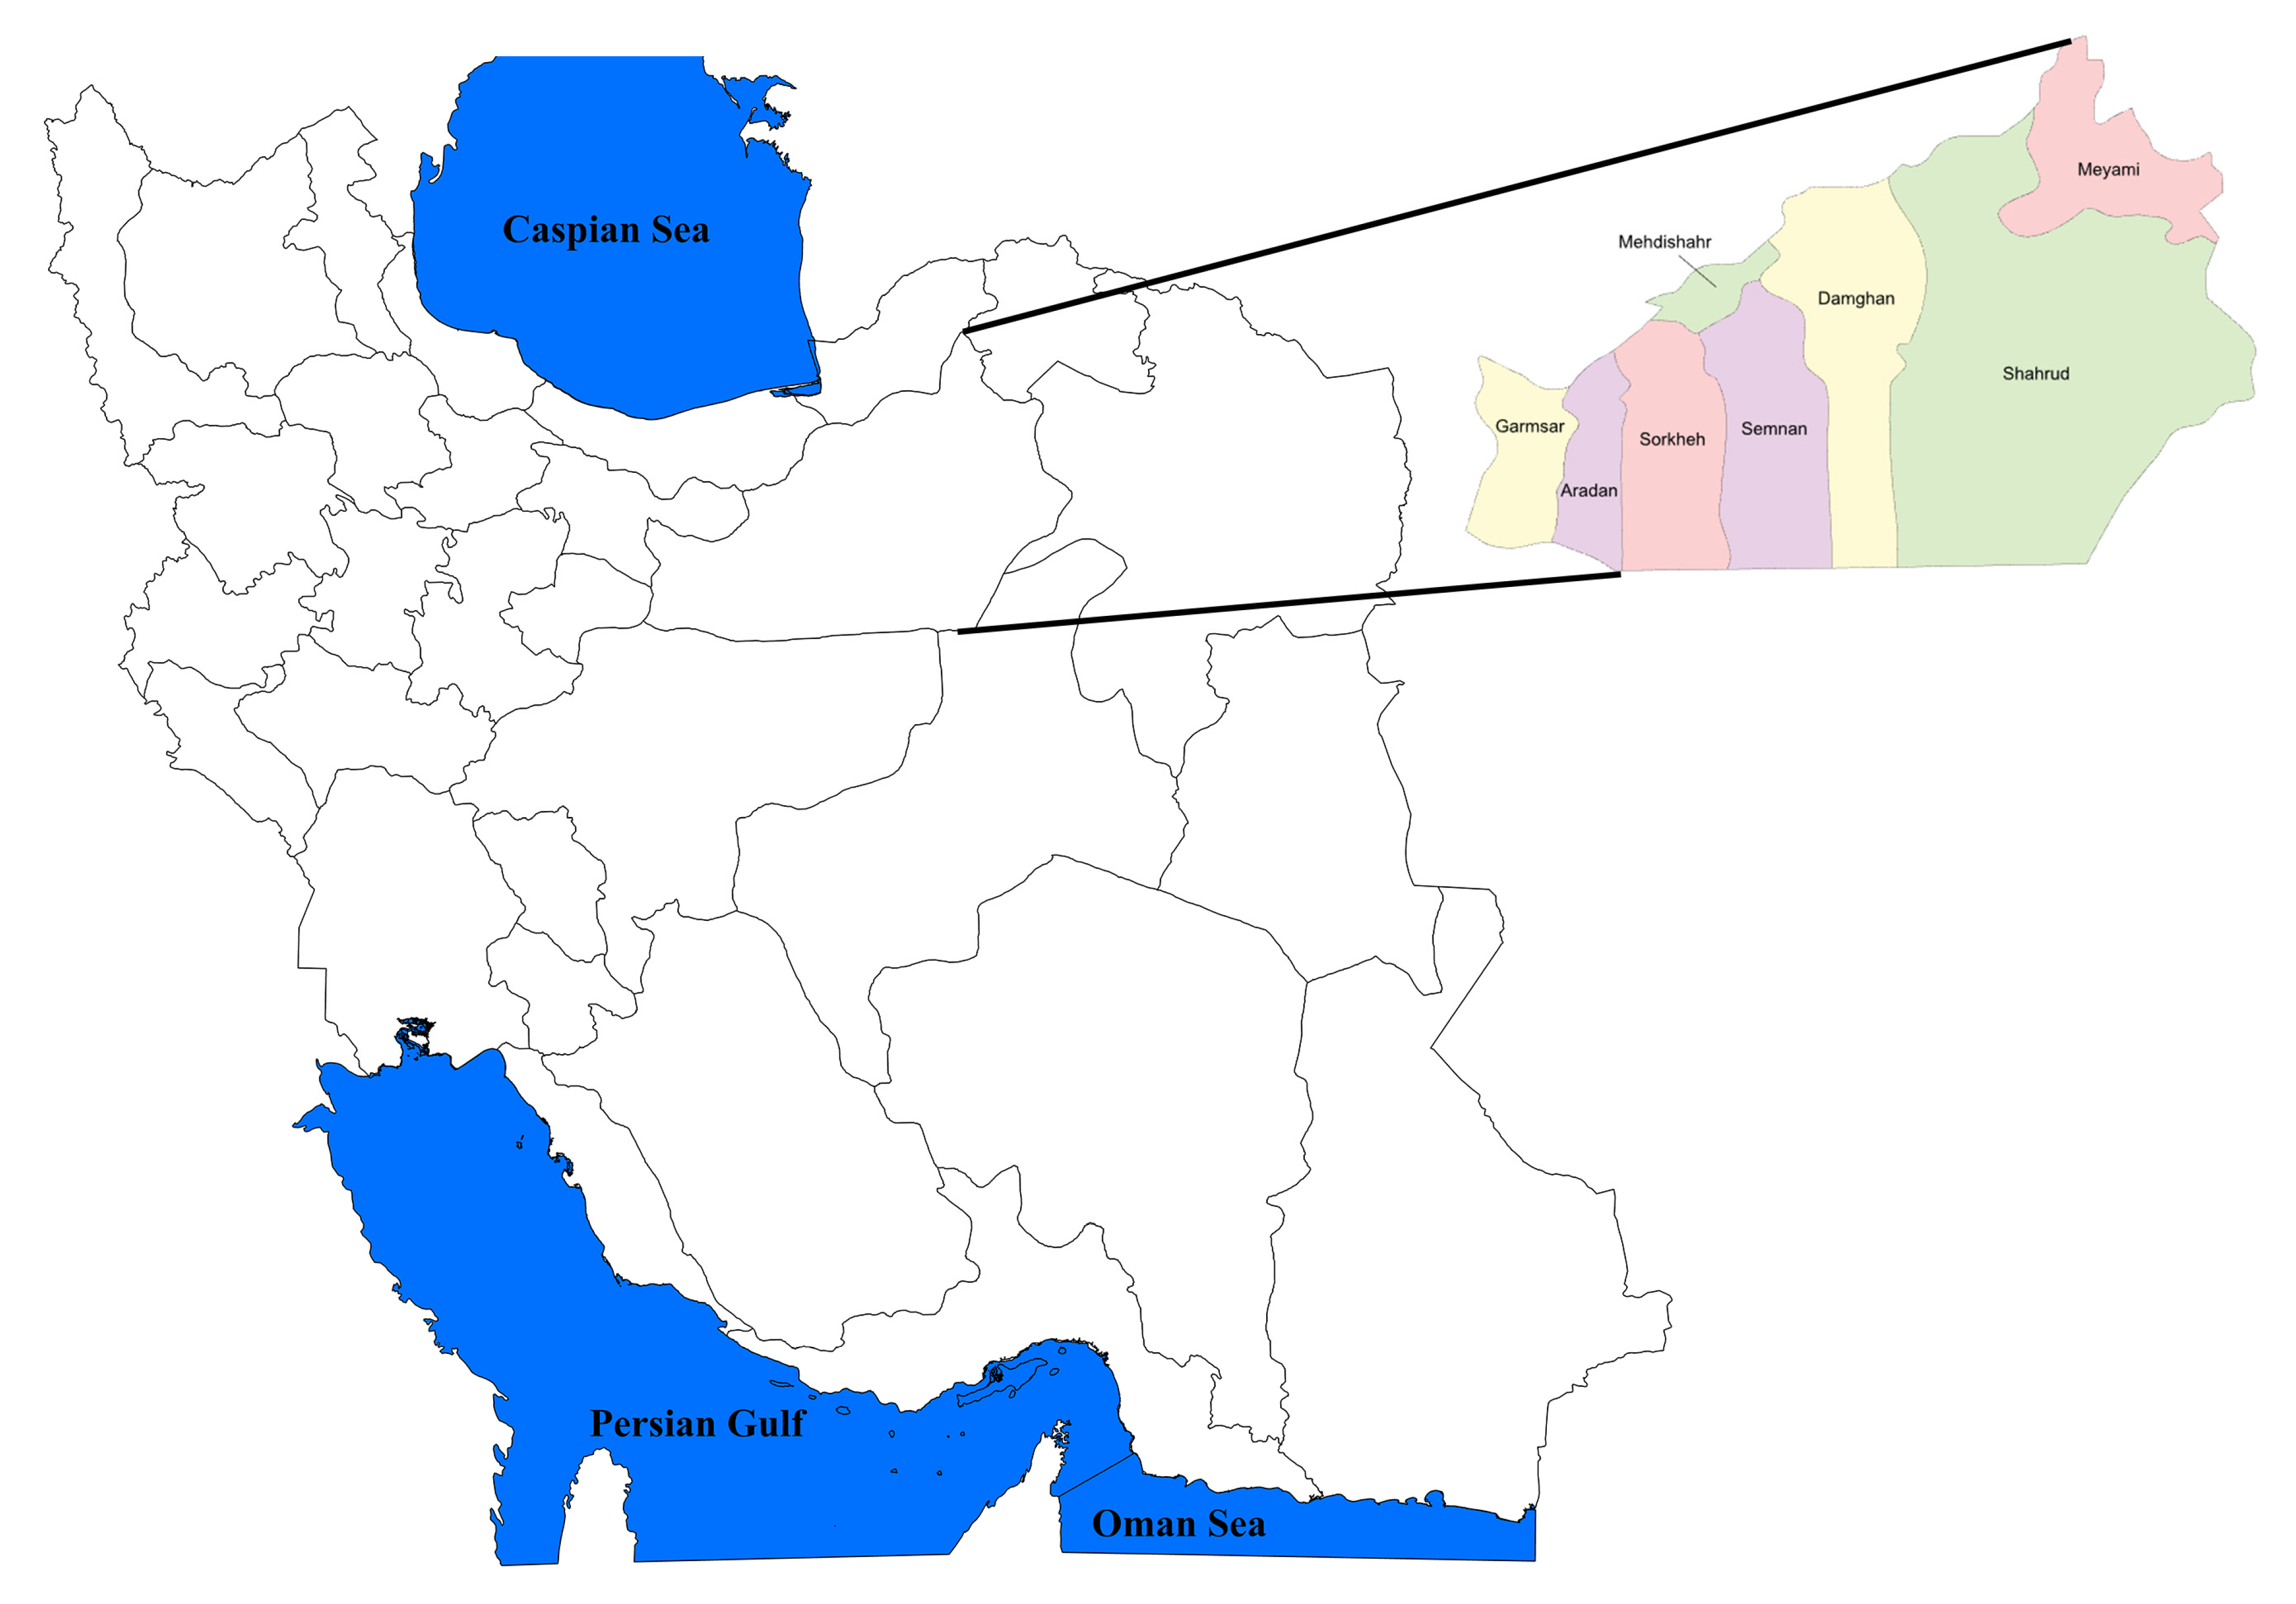
3. Study Area
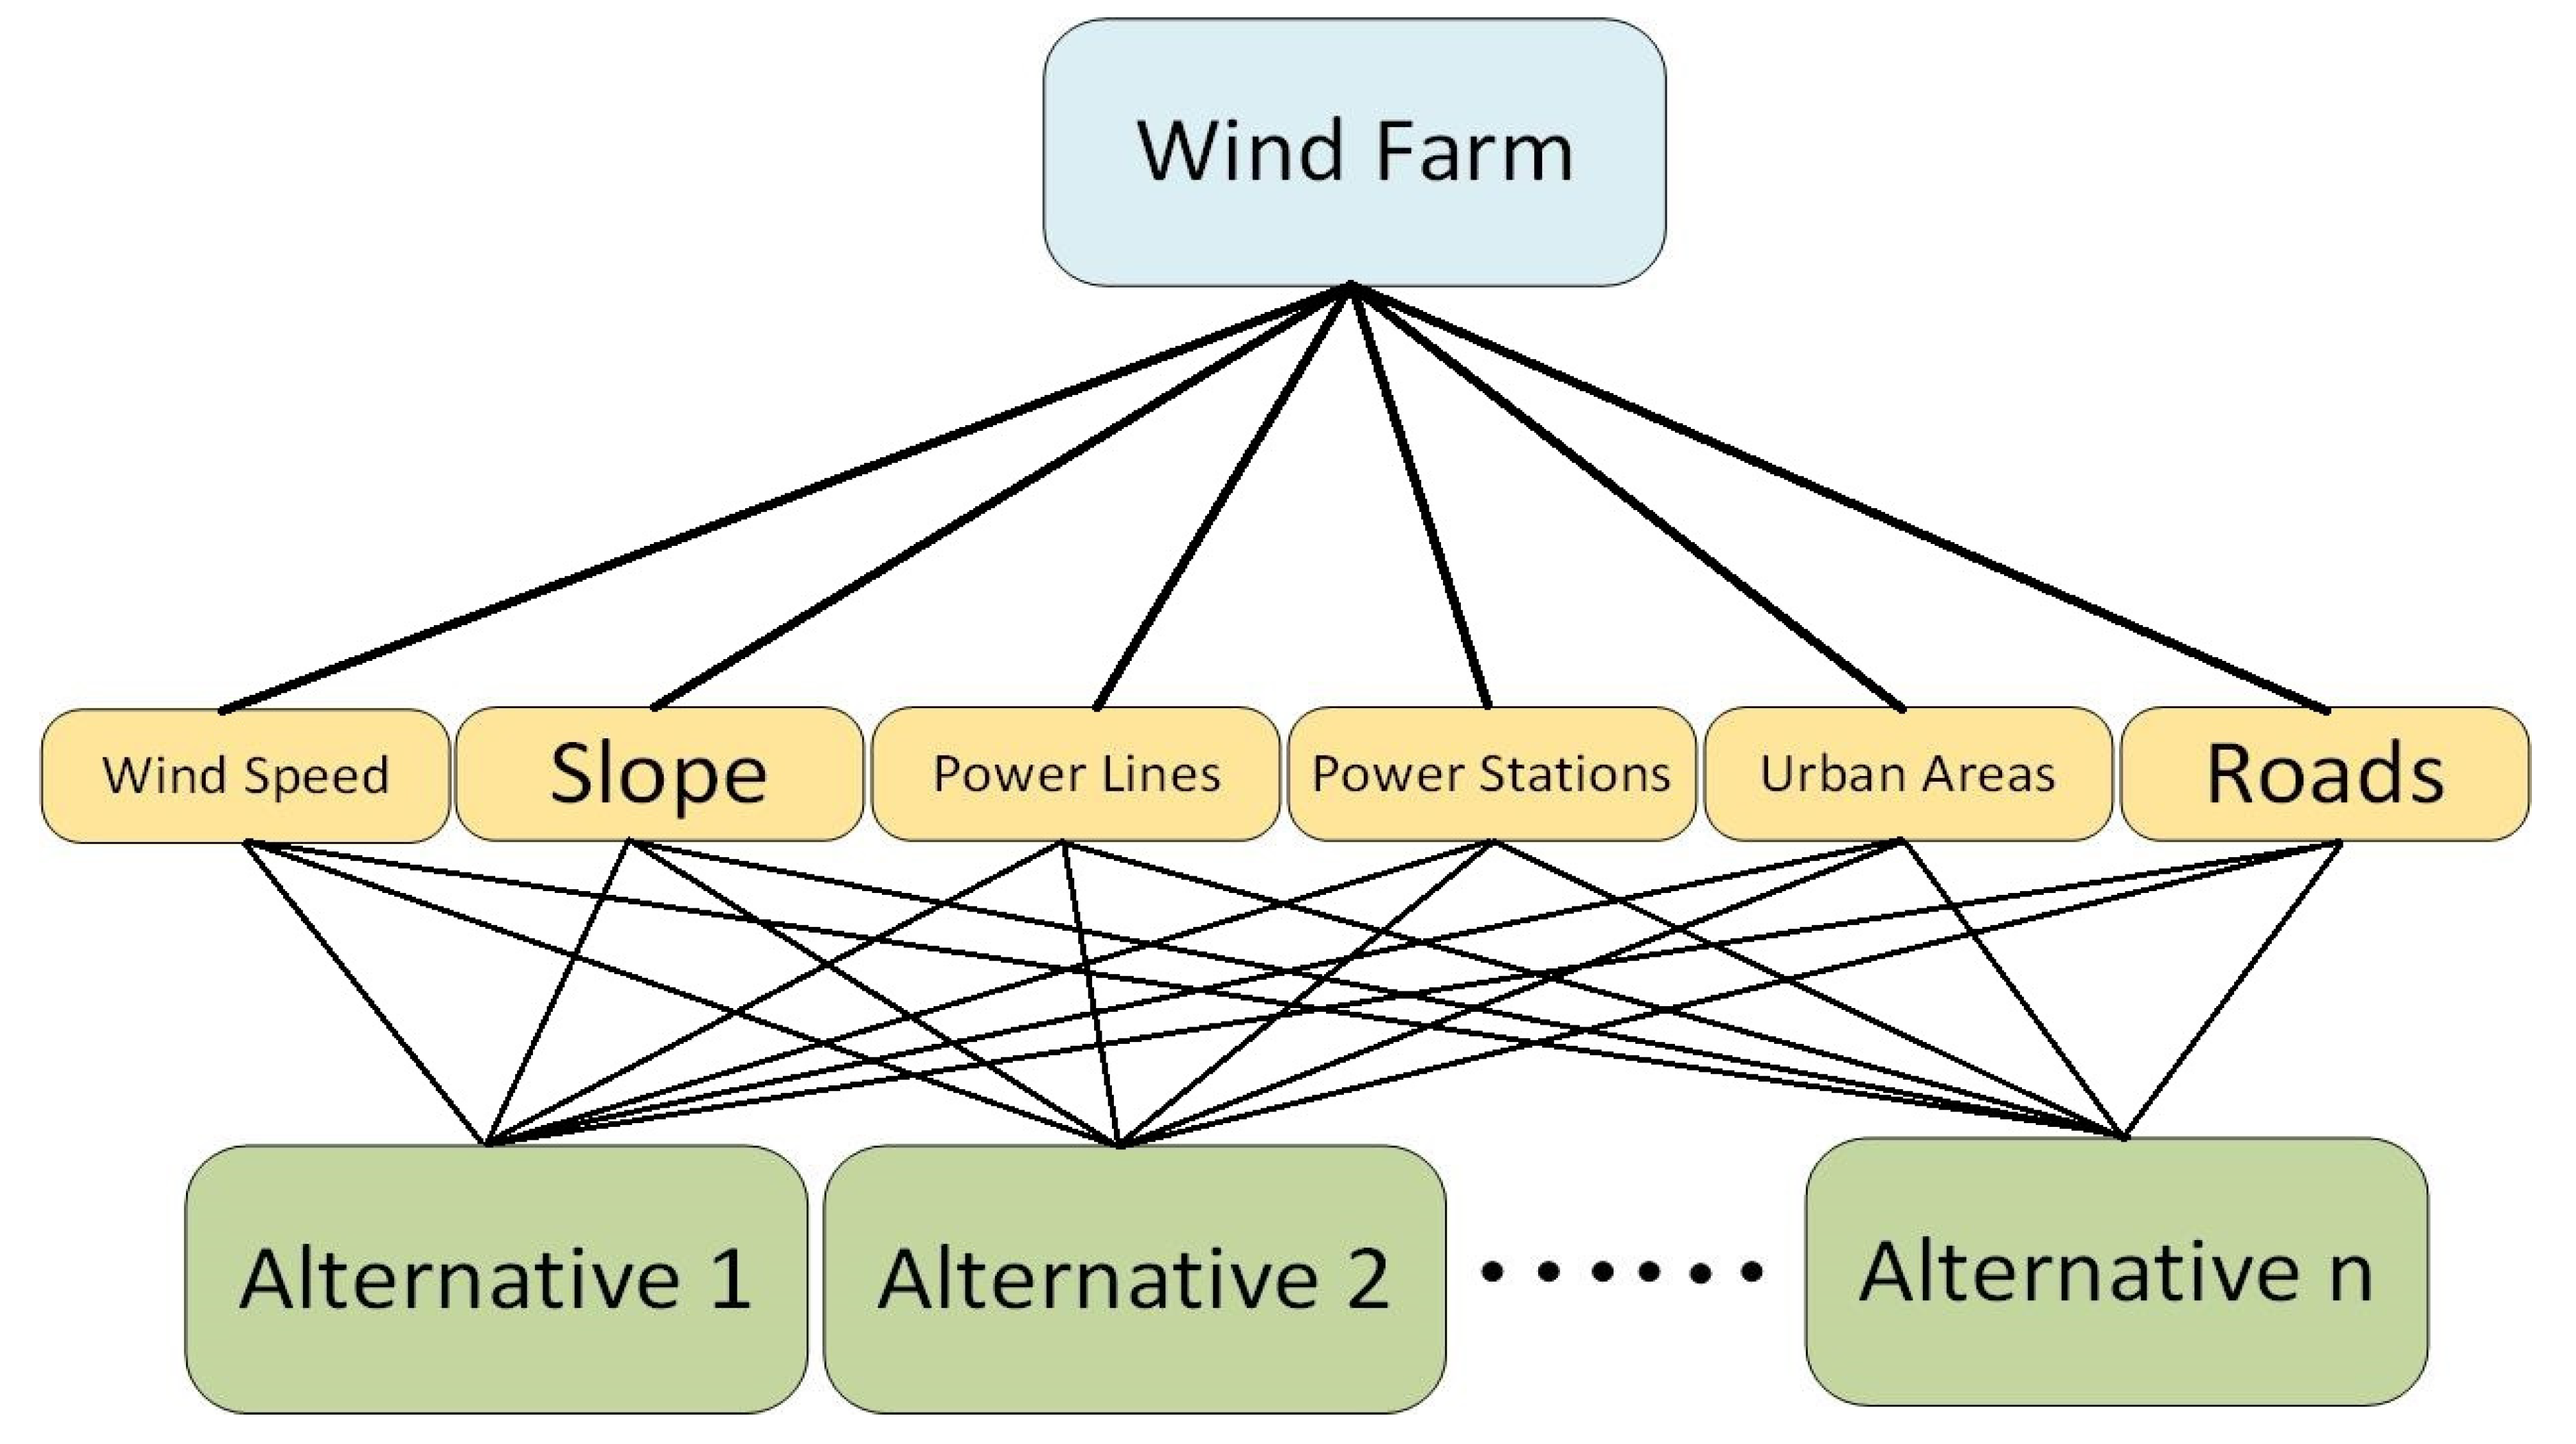
4. Analytical Hierarchy Process
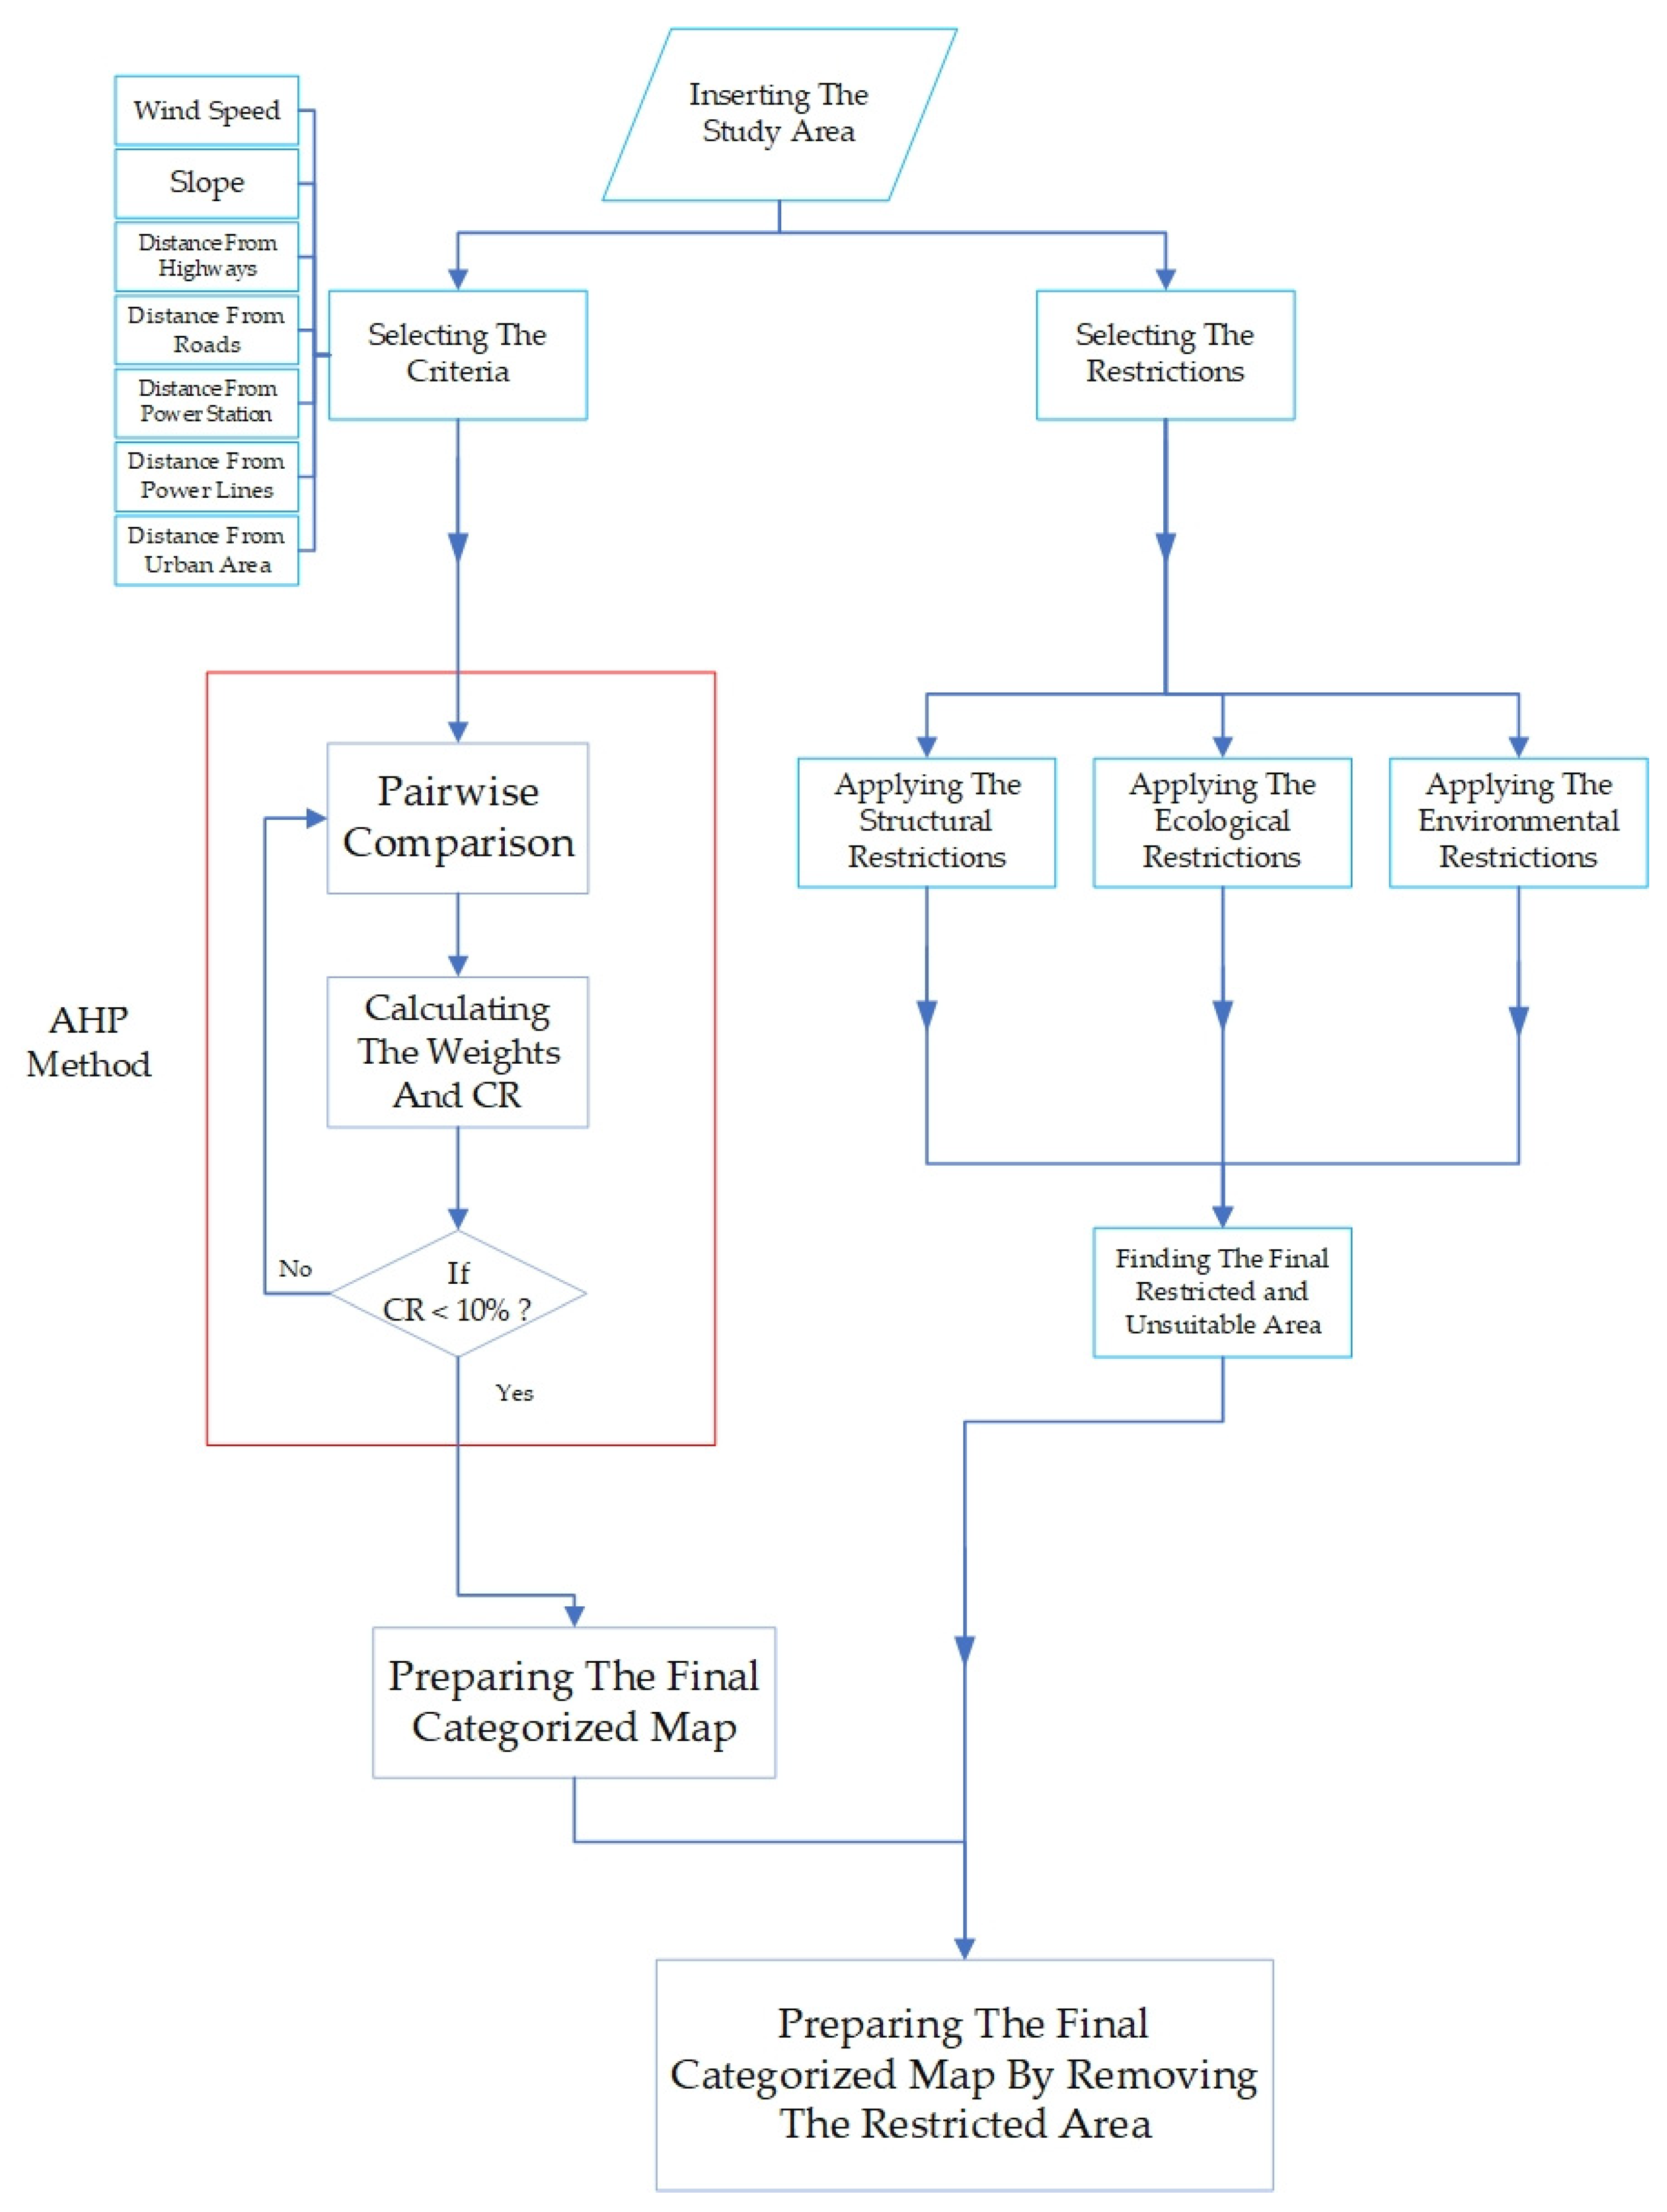
5. Materials and Methods
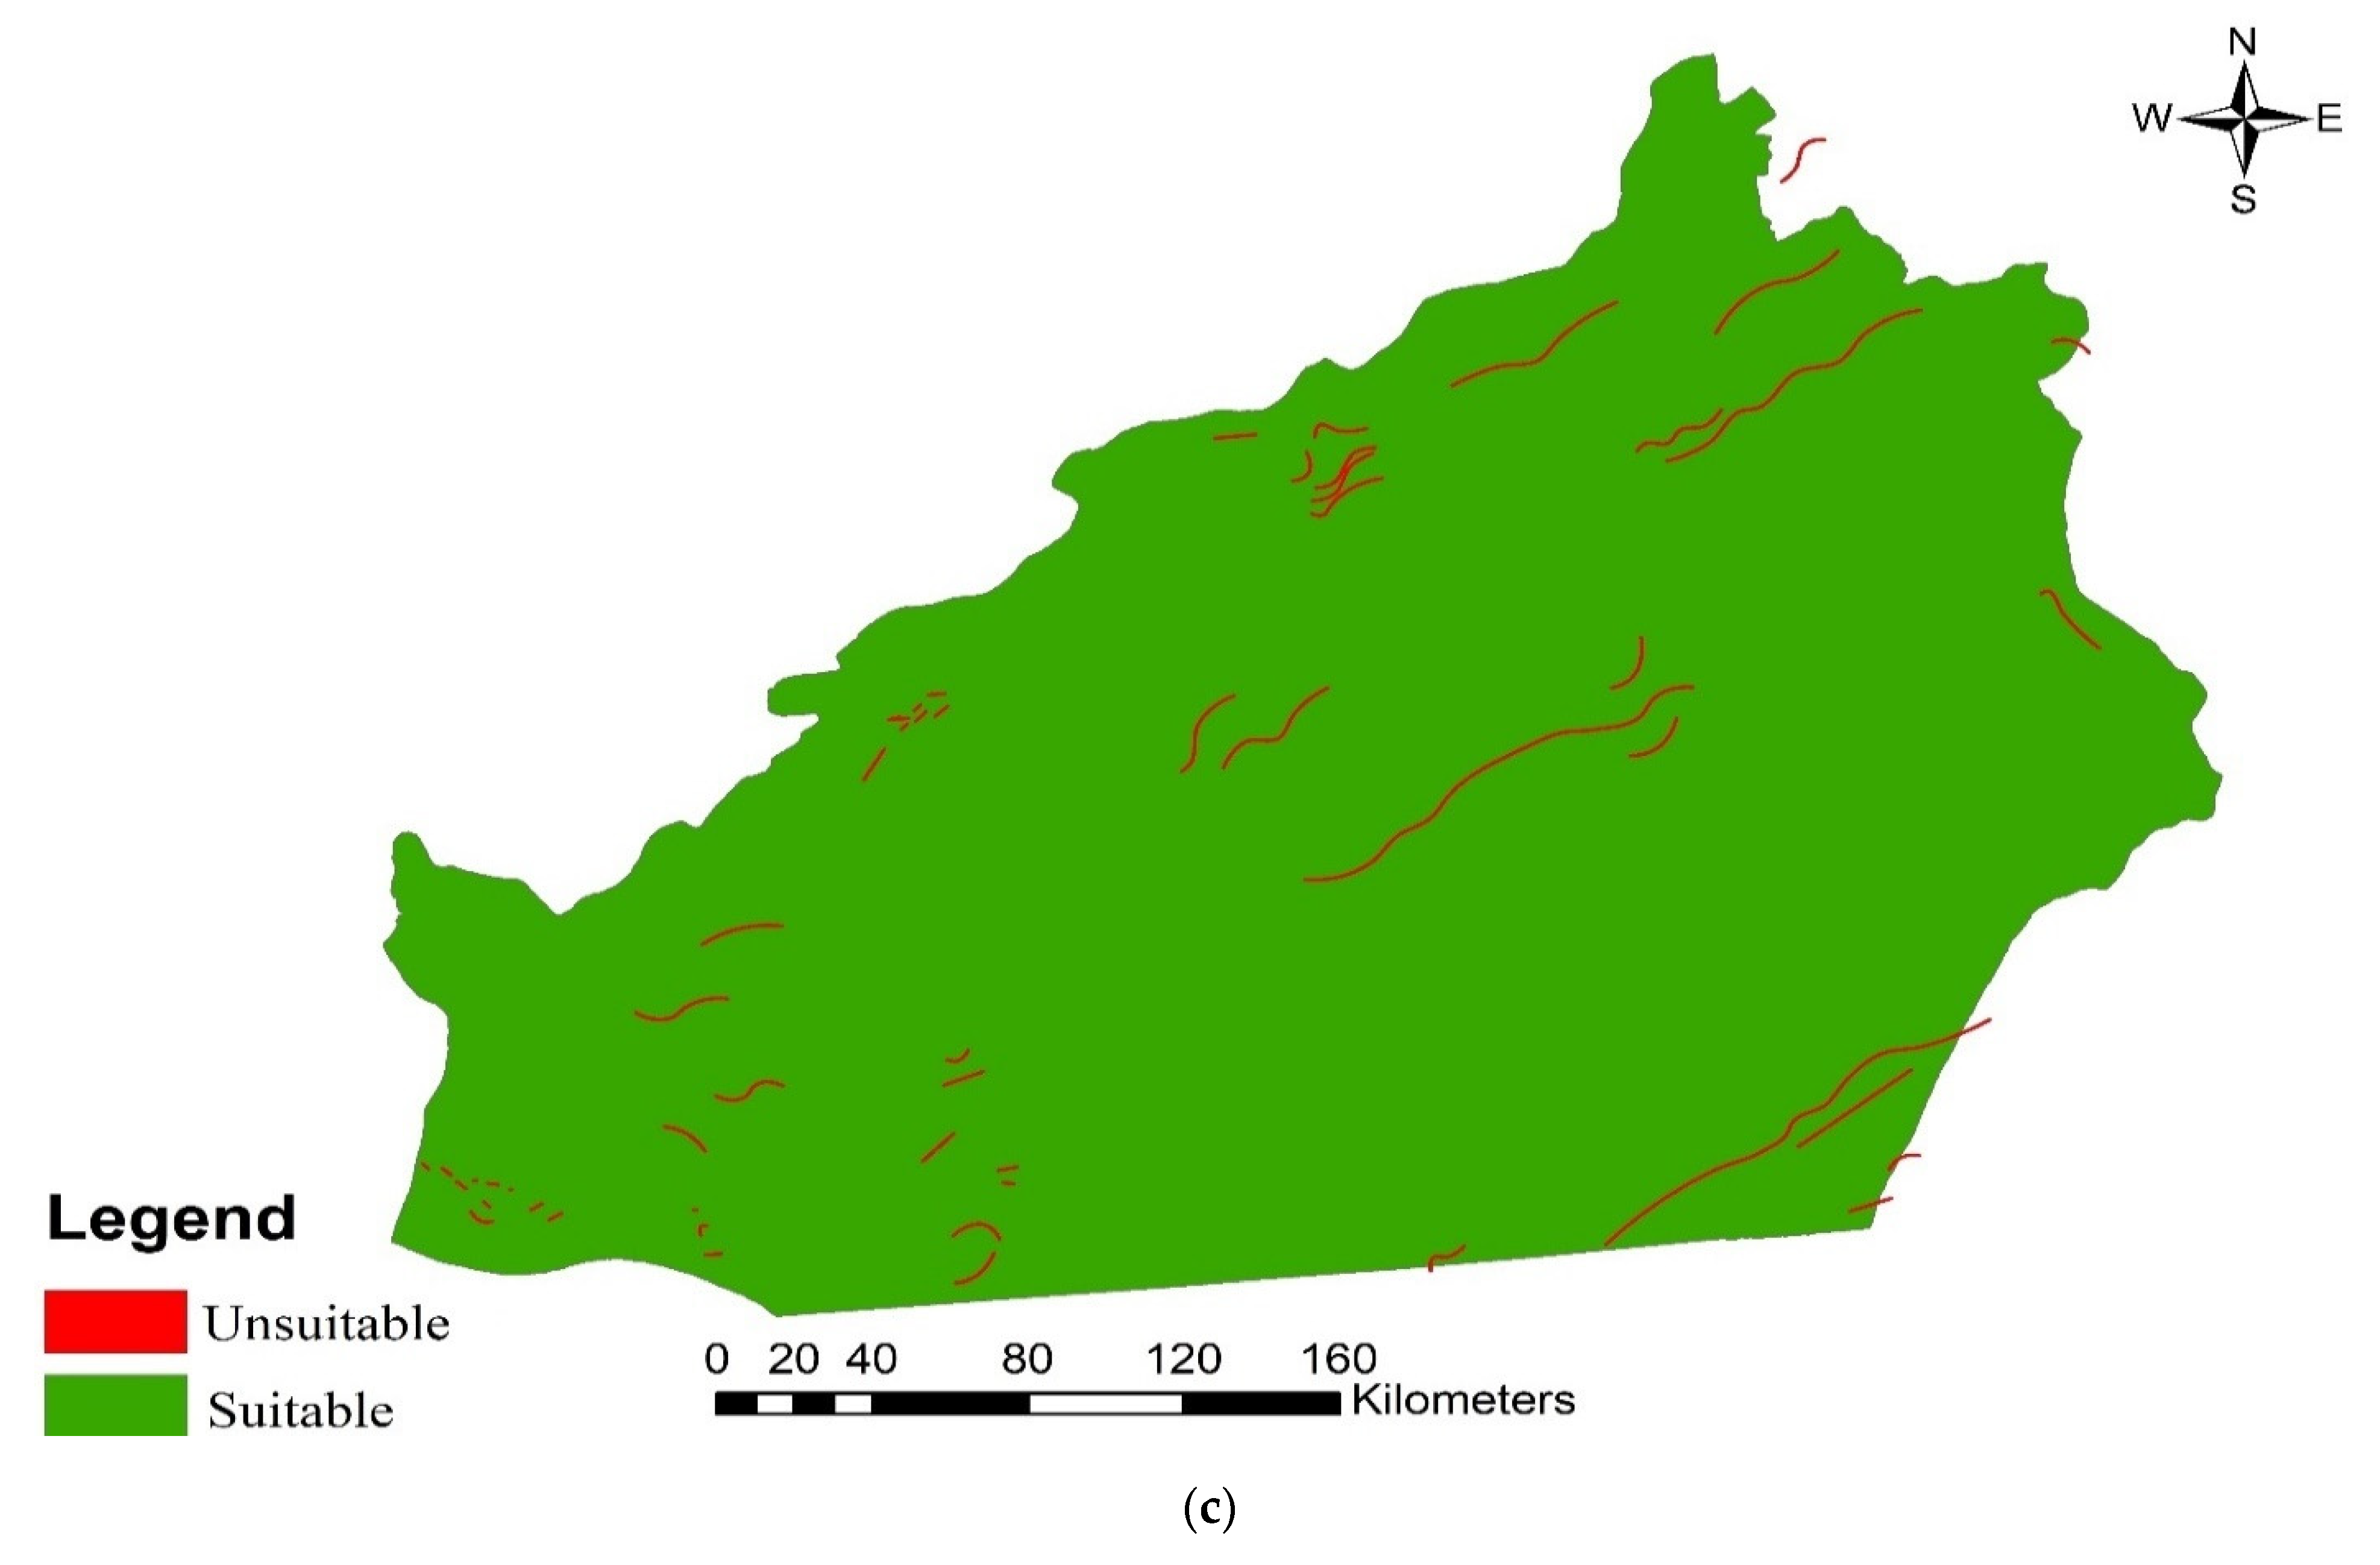
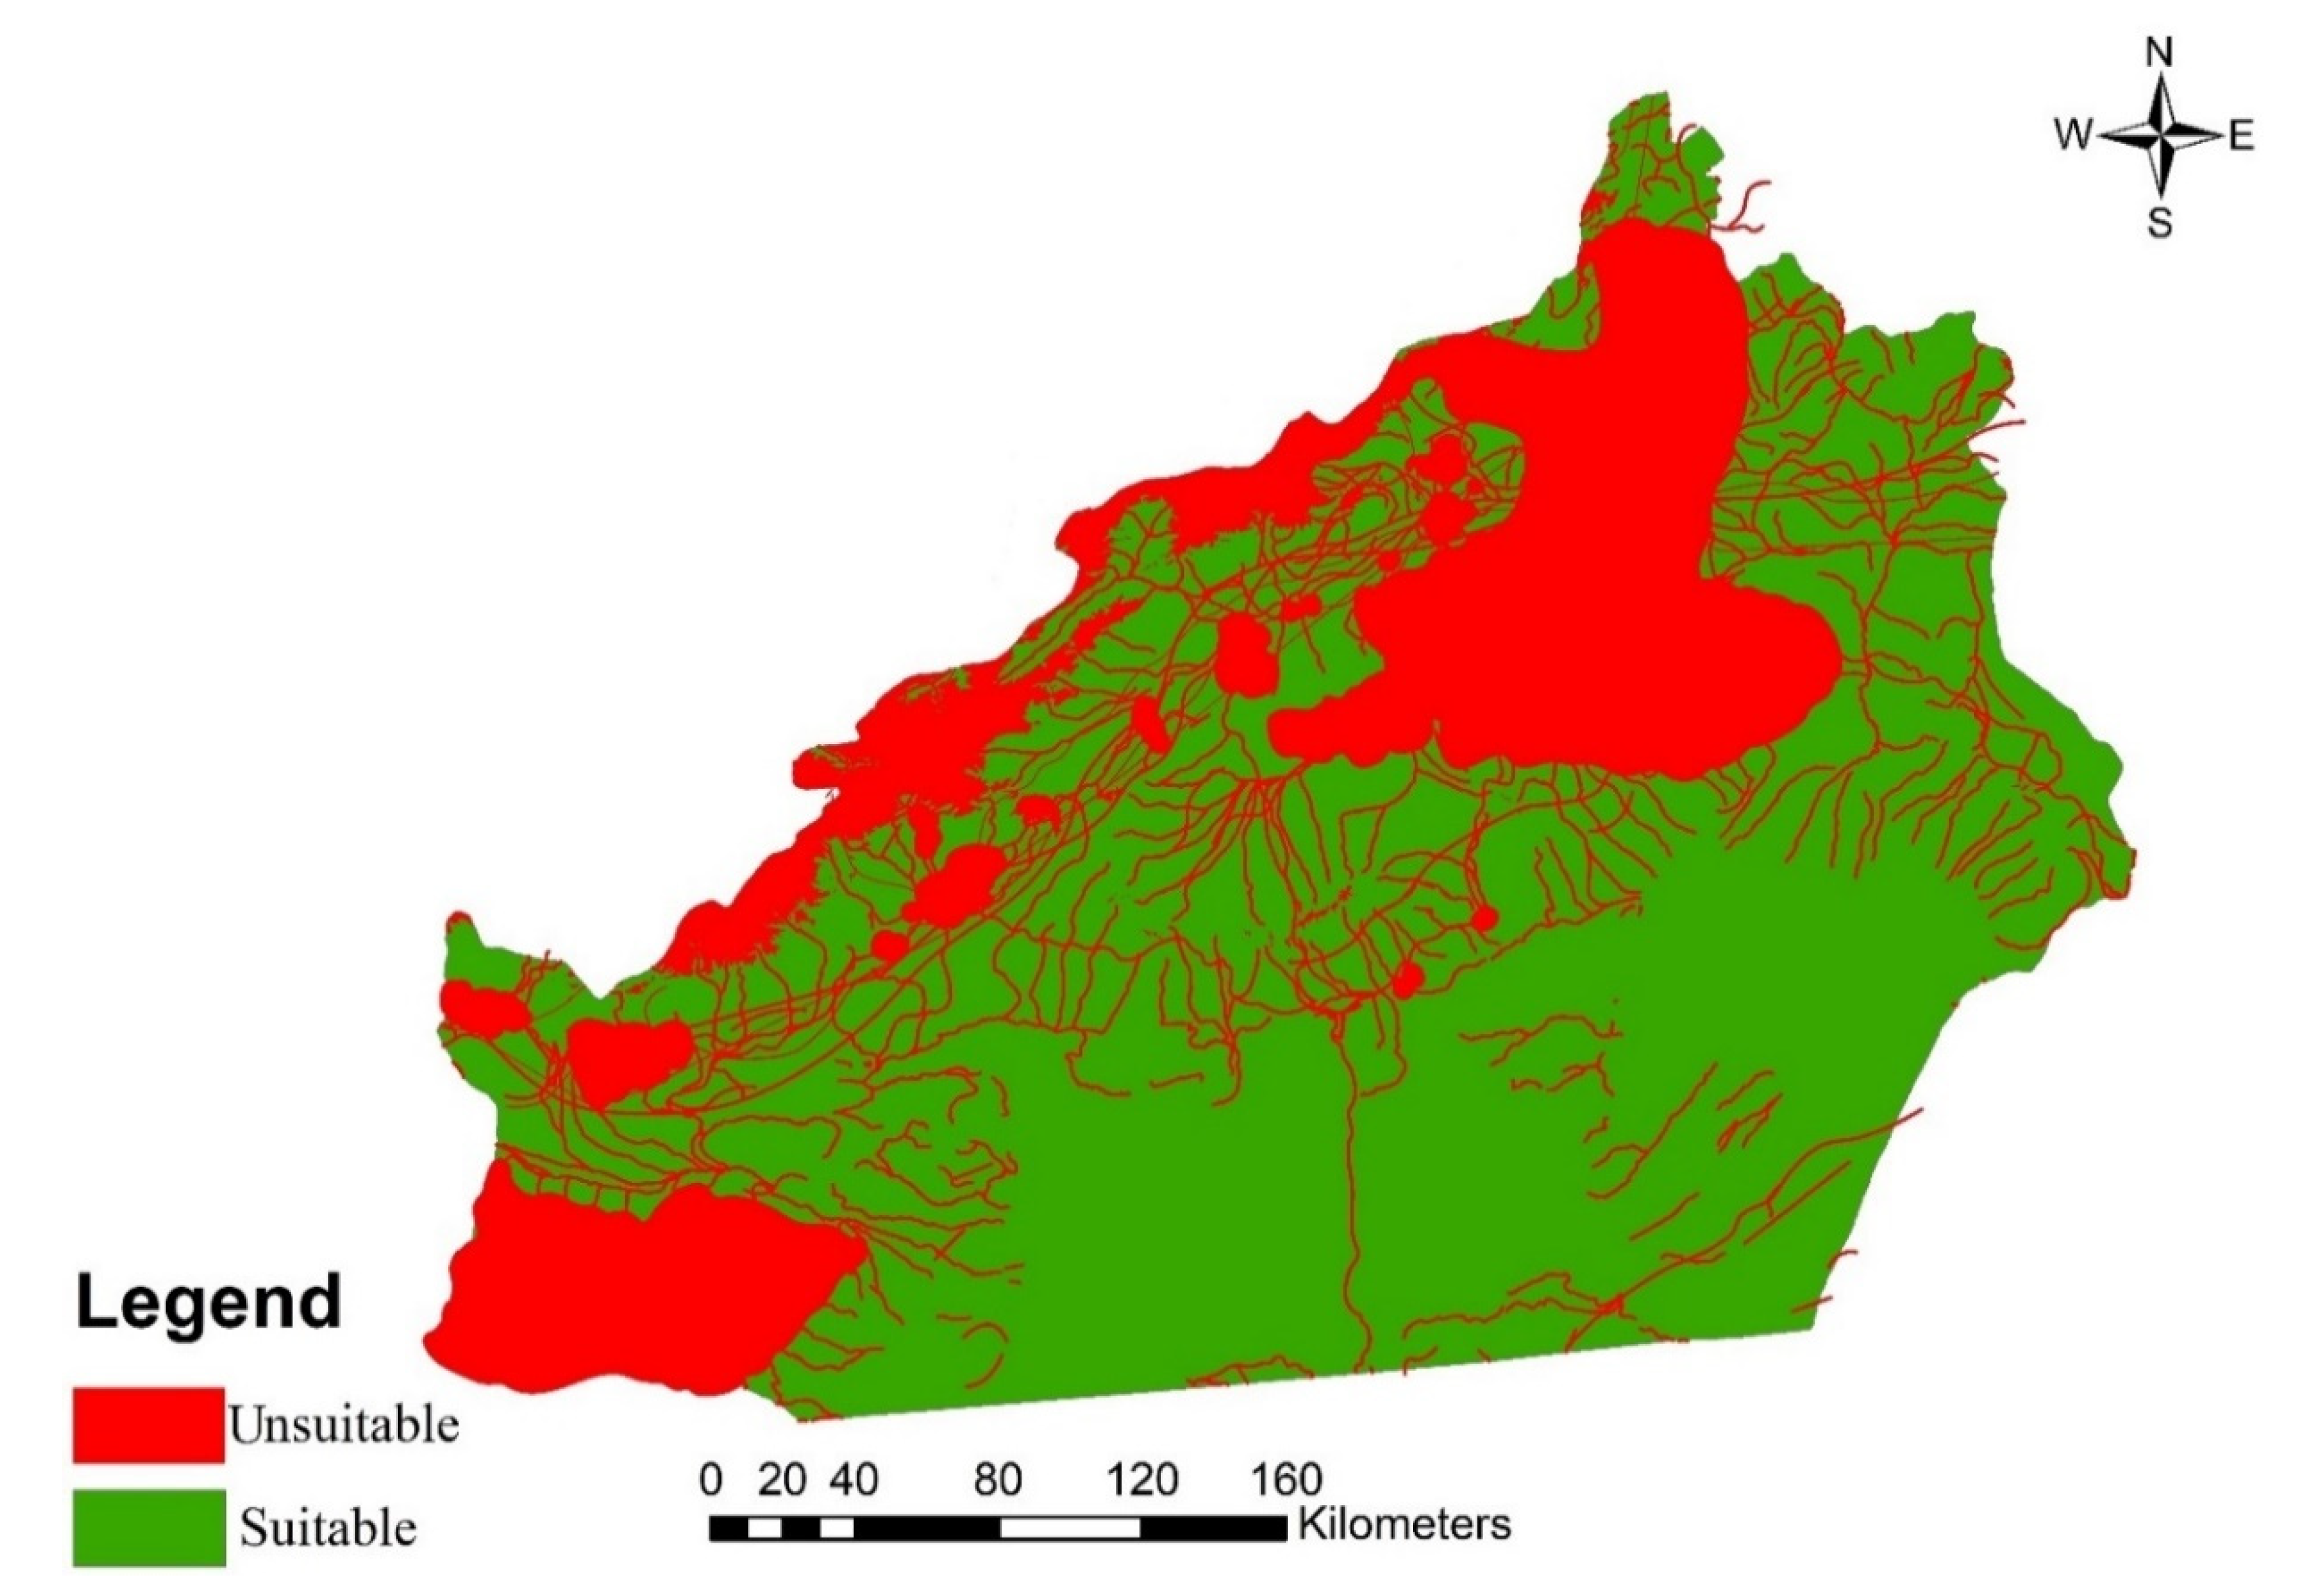
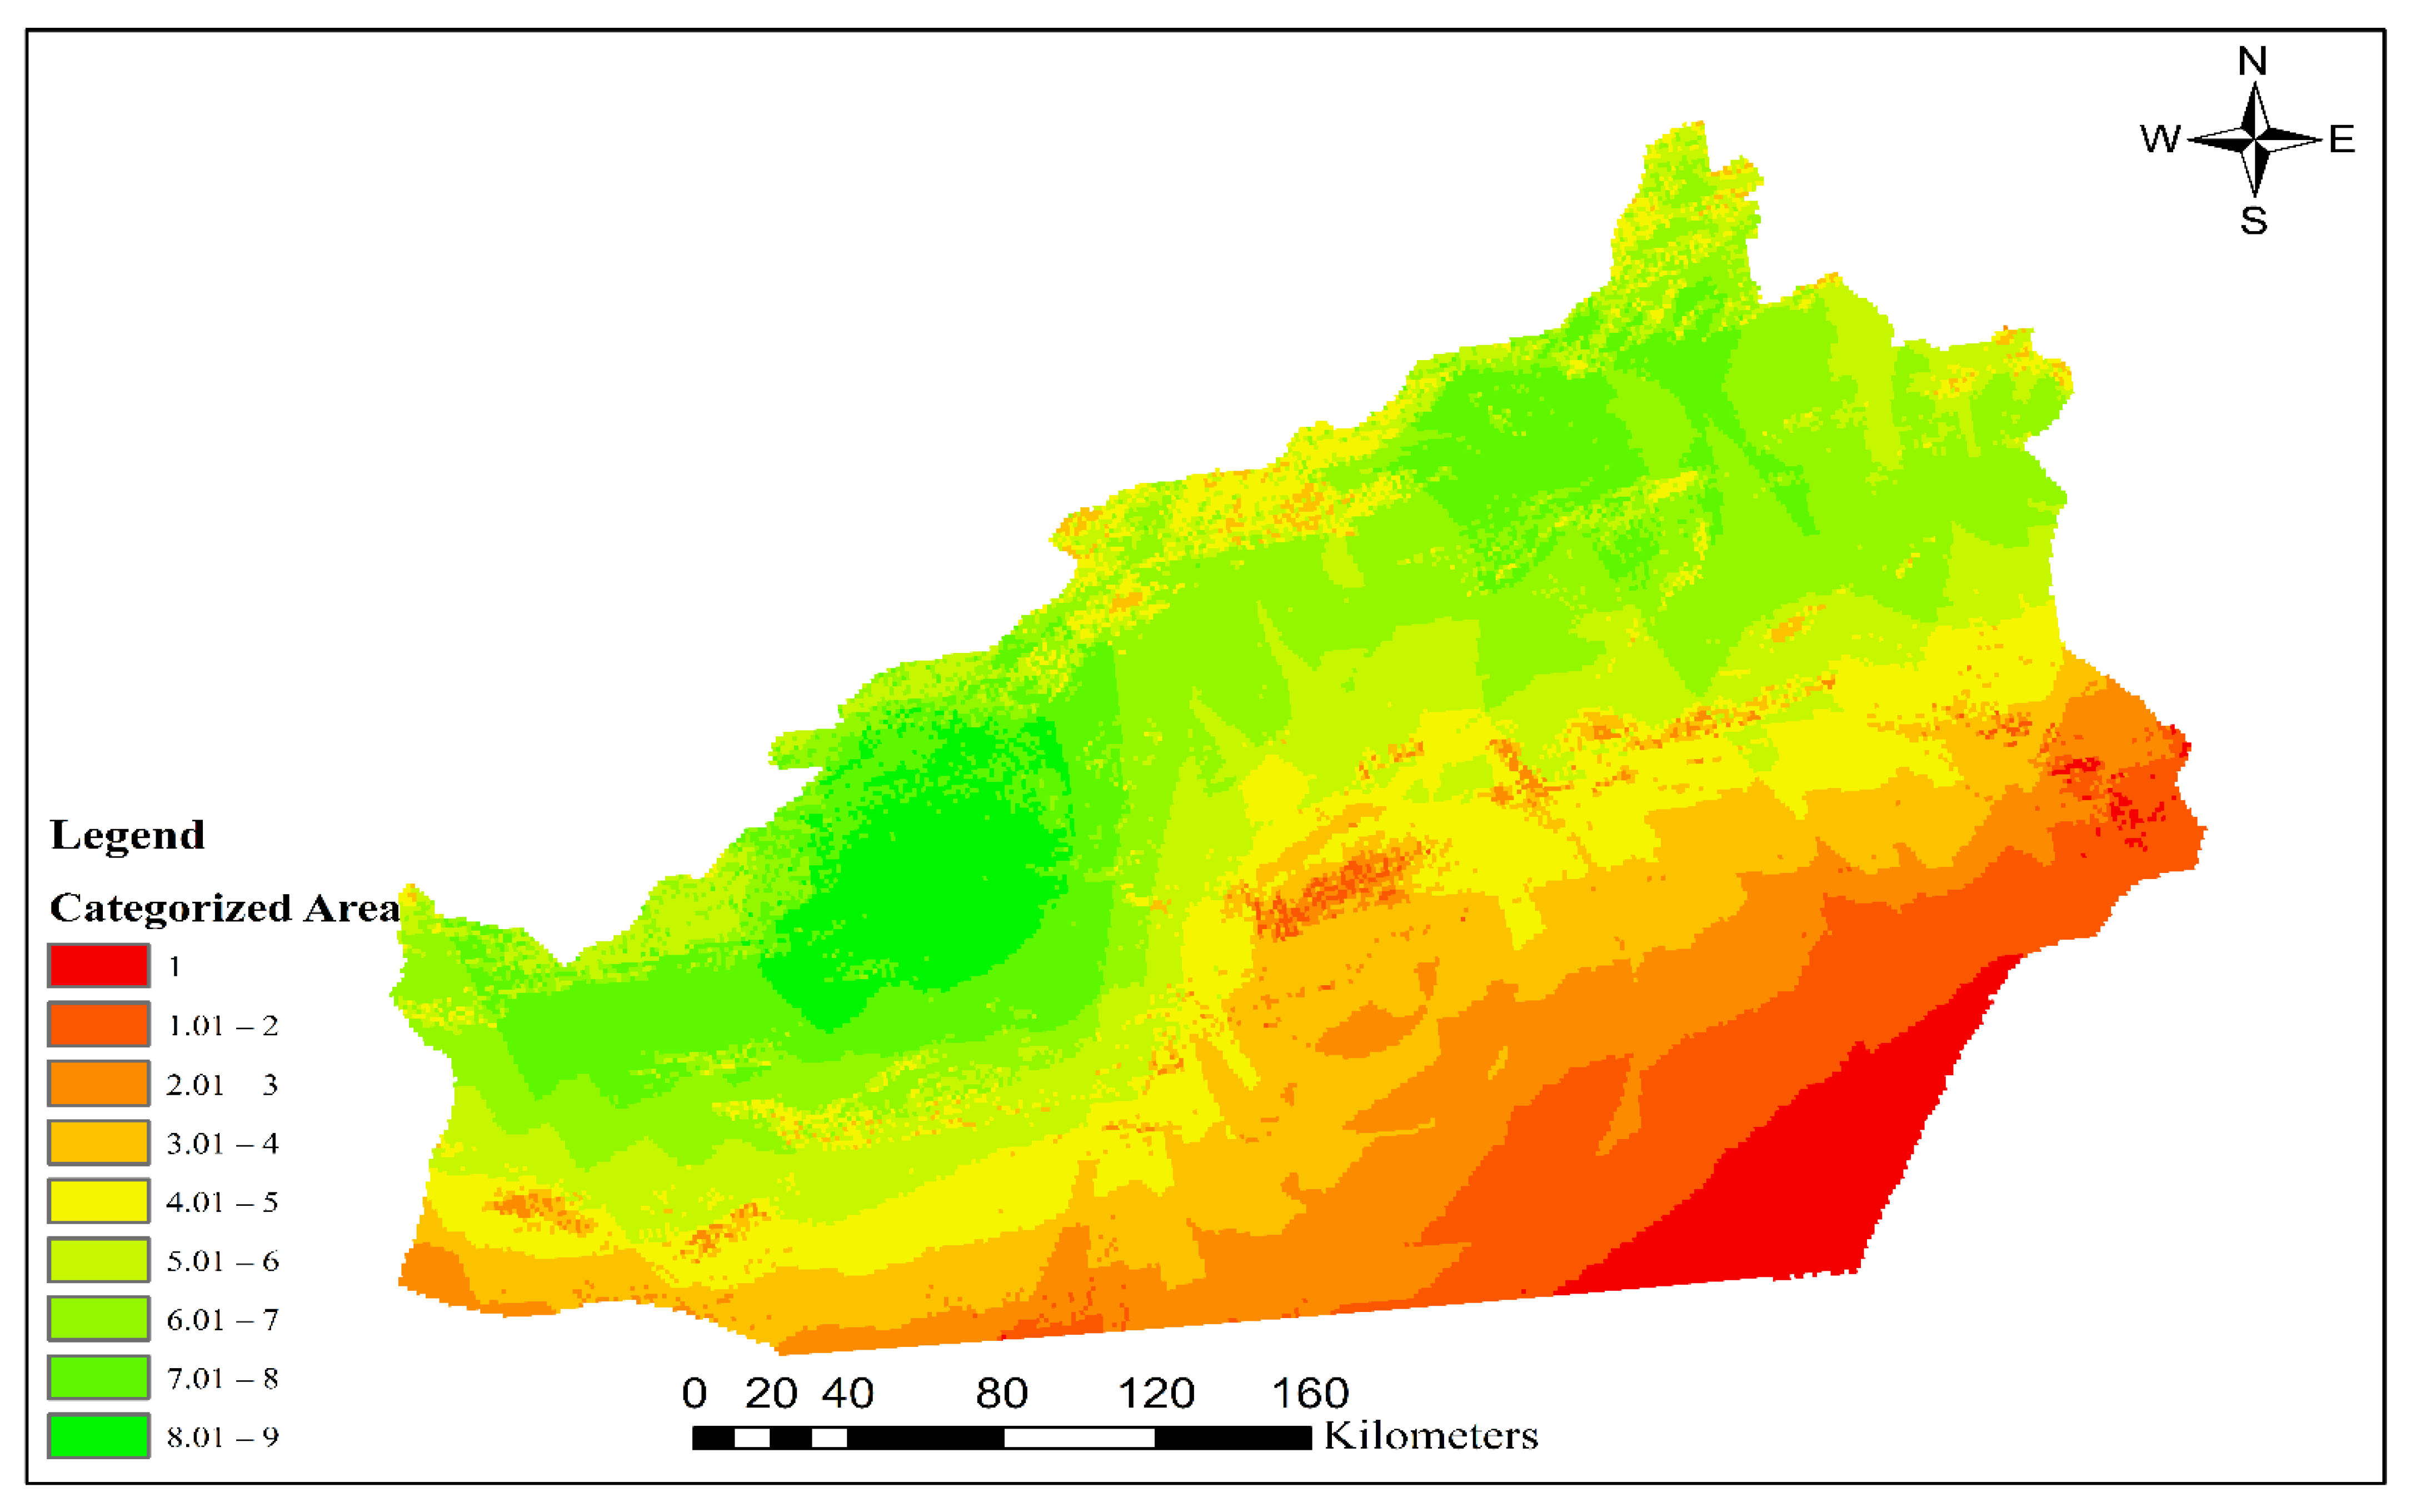
- The province has been divided into two areas according to restrictions, suitable and unsuitable.
- The best areas have been chosen according to the weighted criteria among suitable regions.
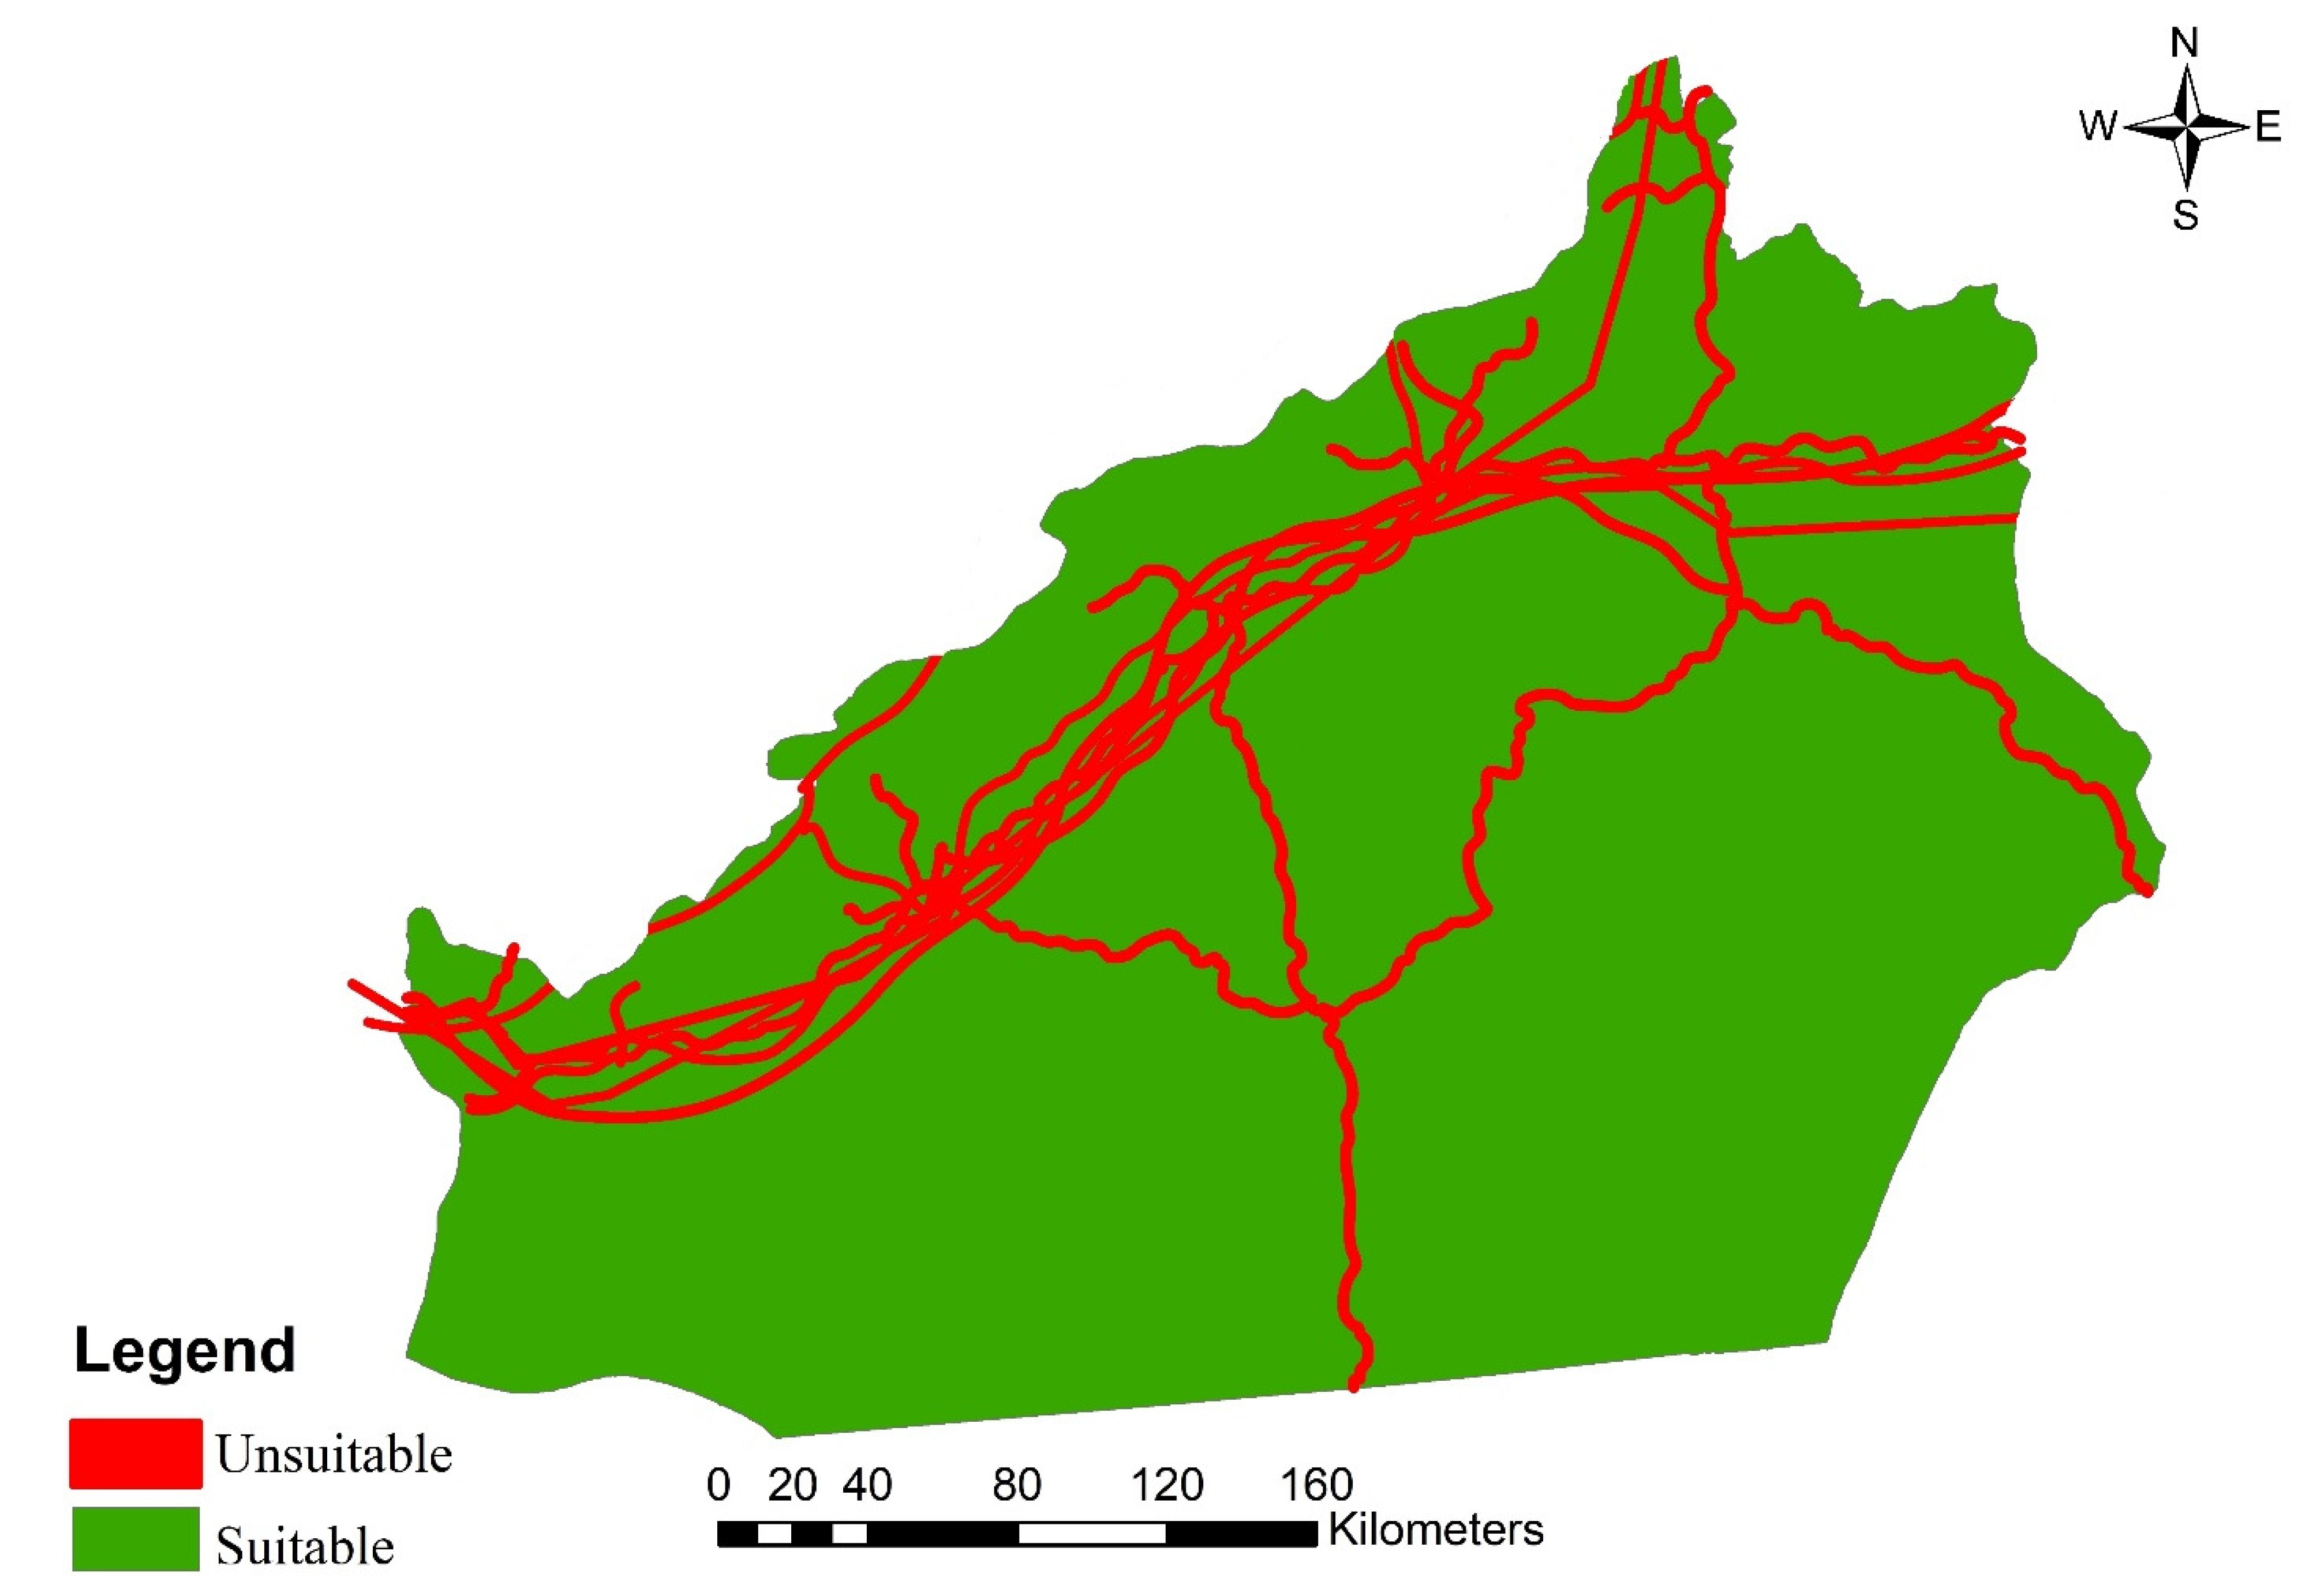
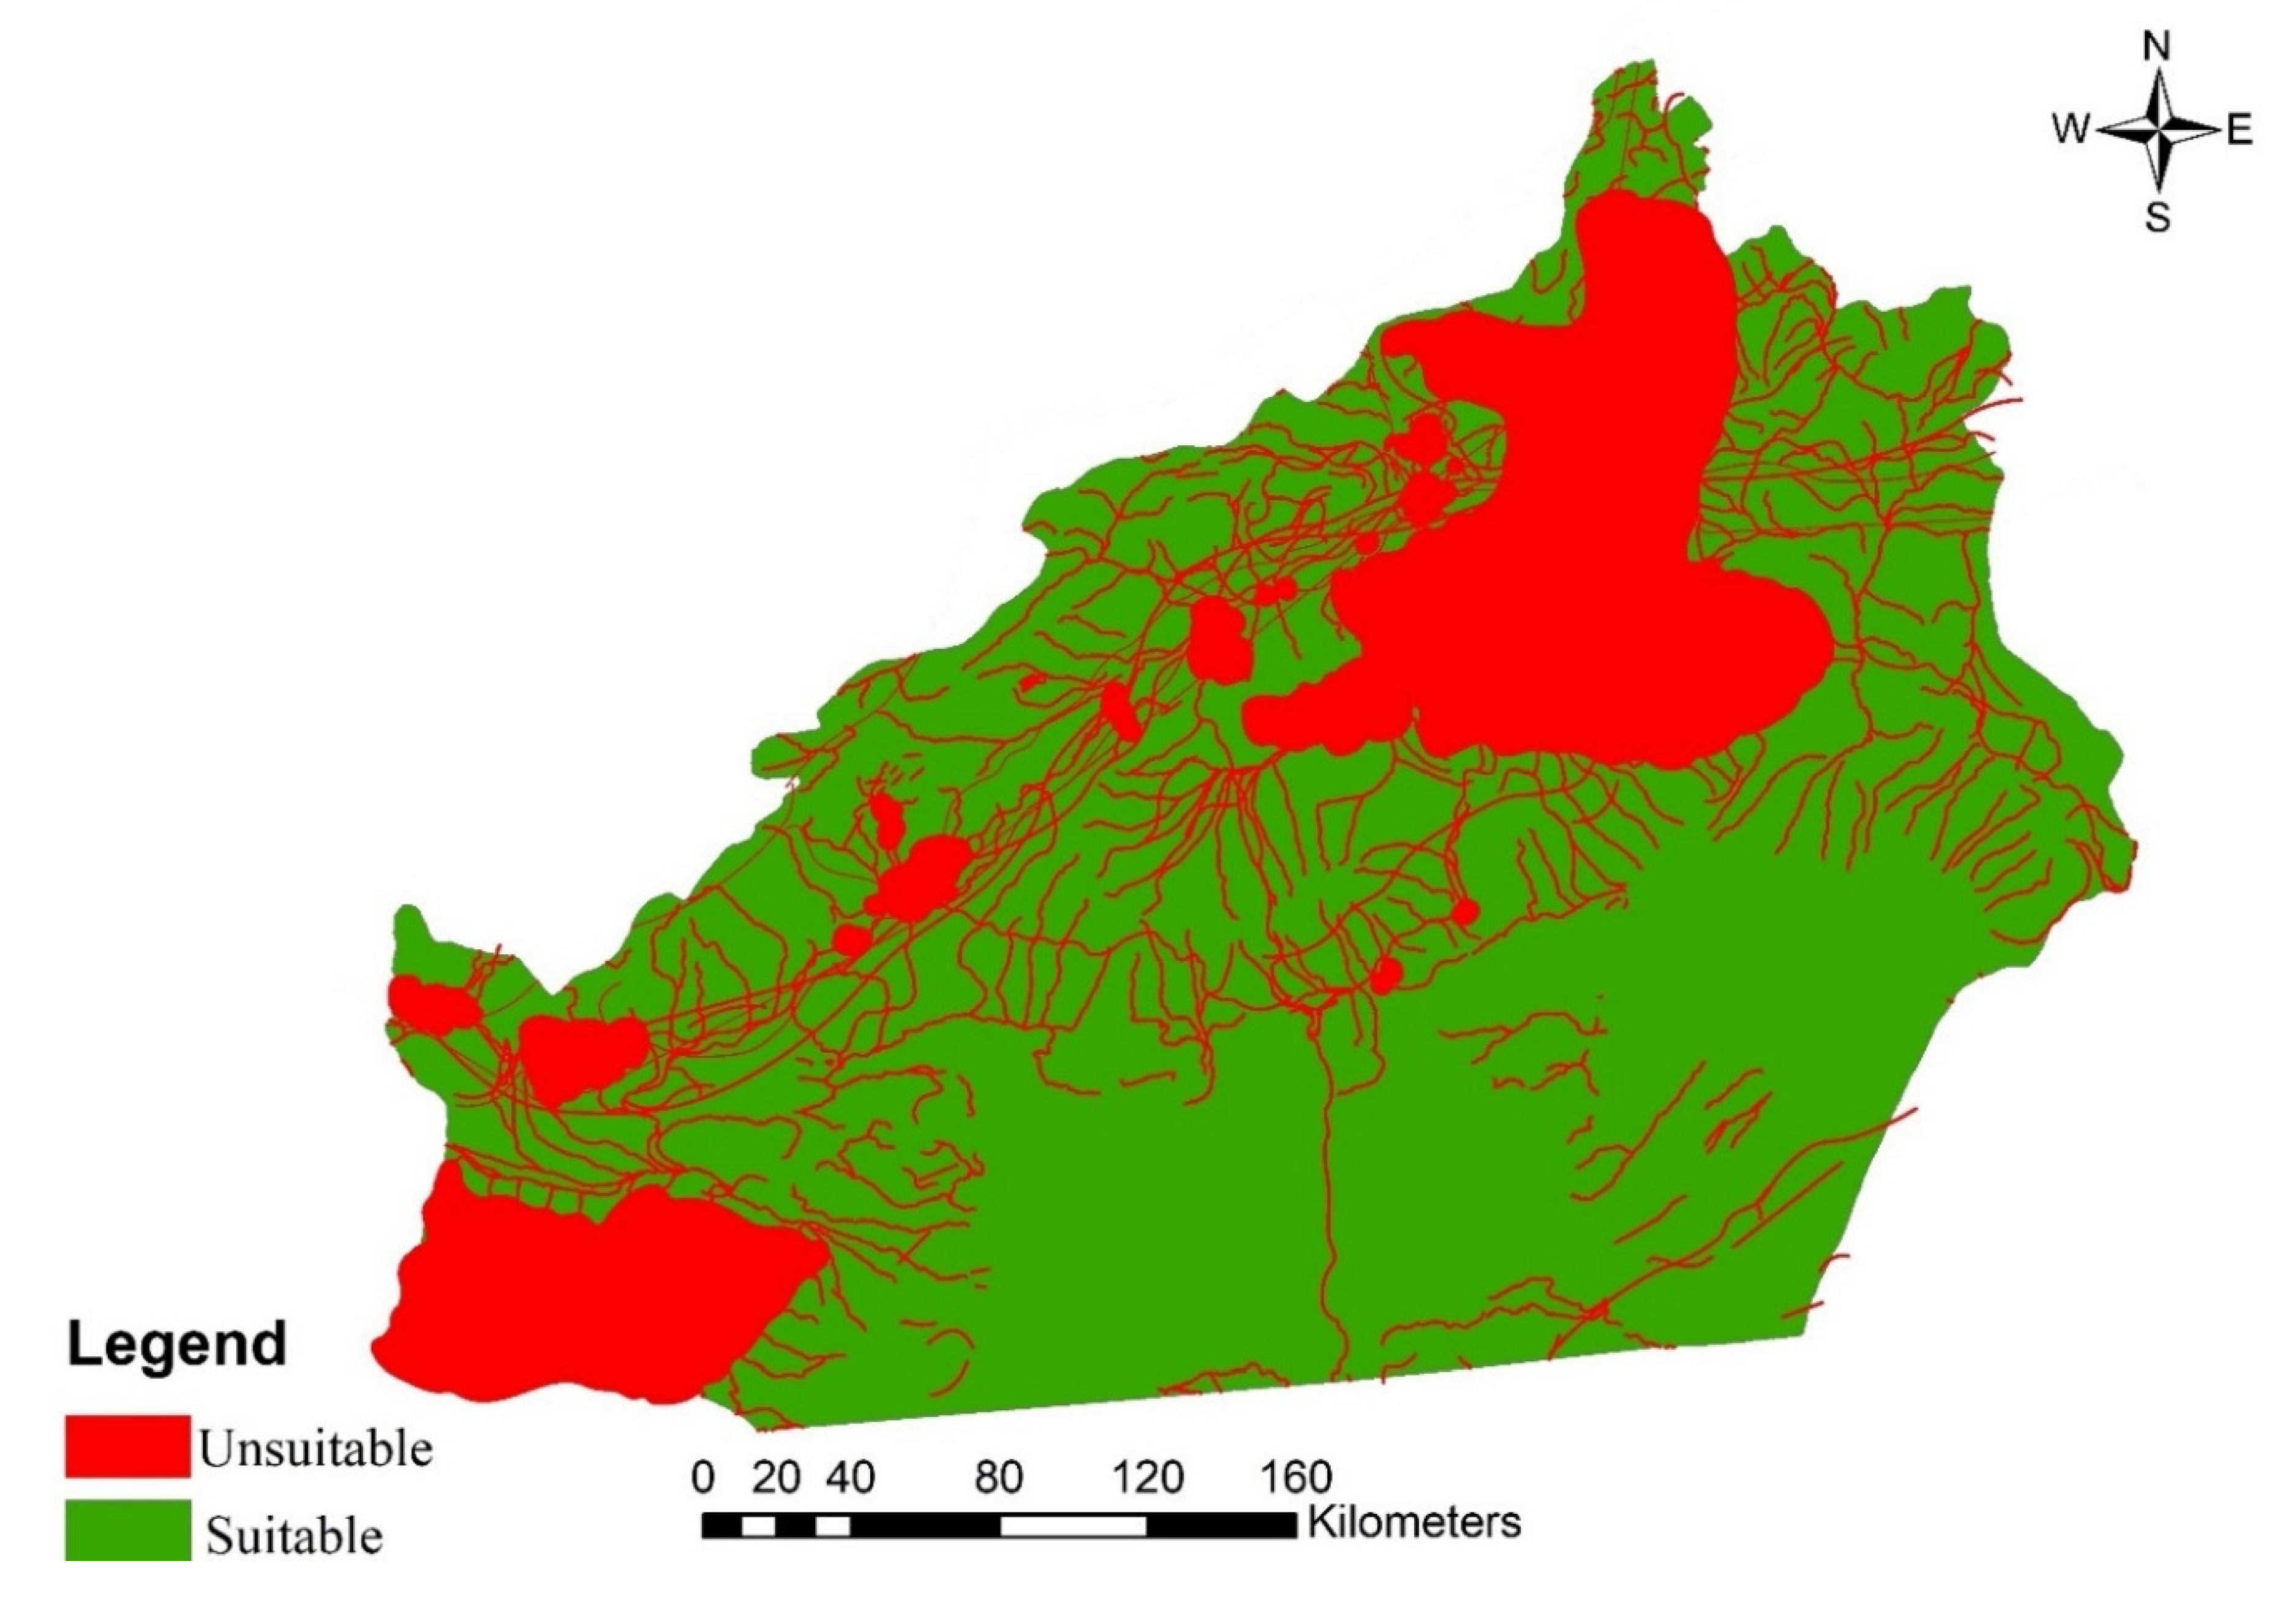
5.1. Restrictions
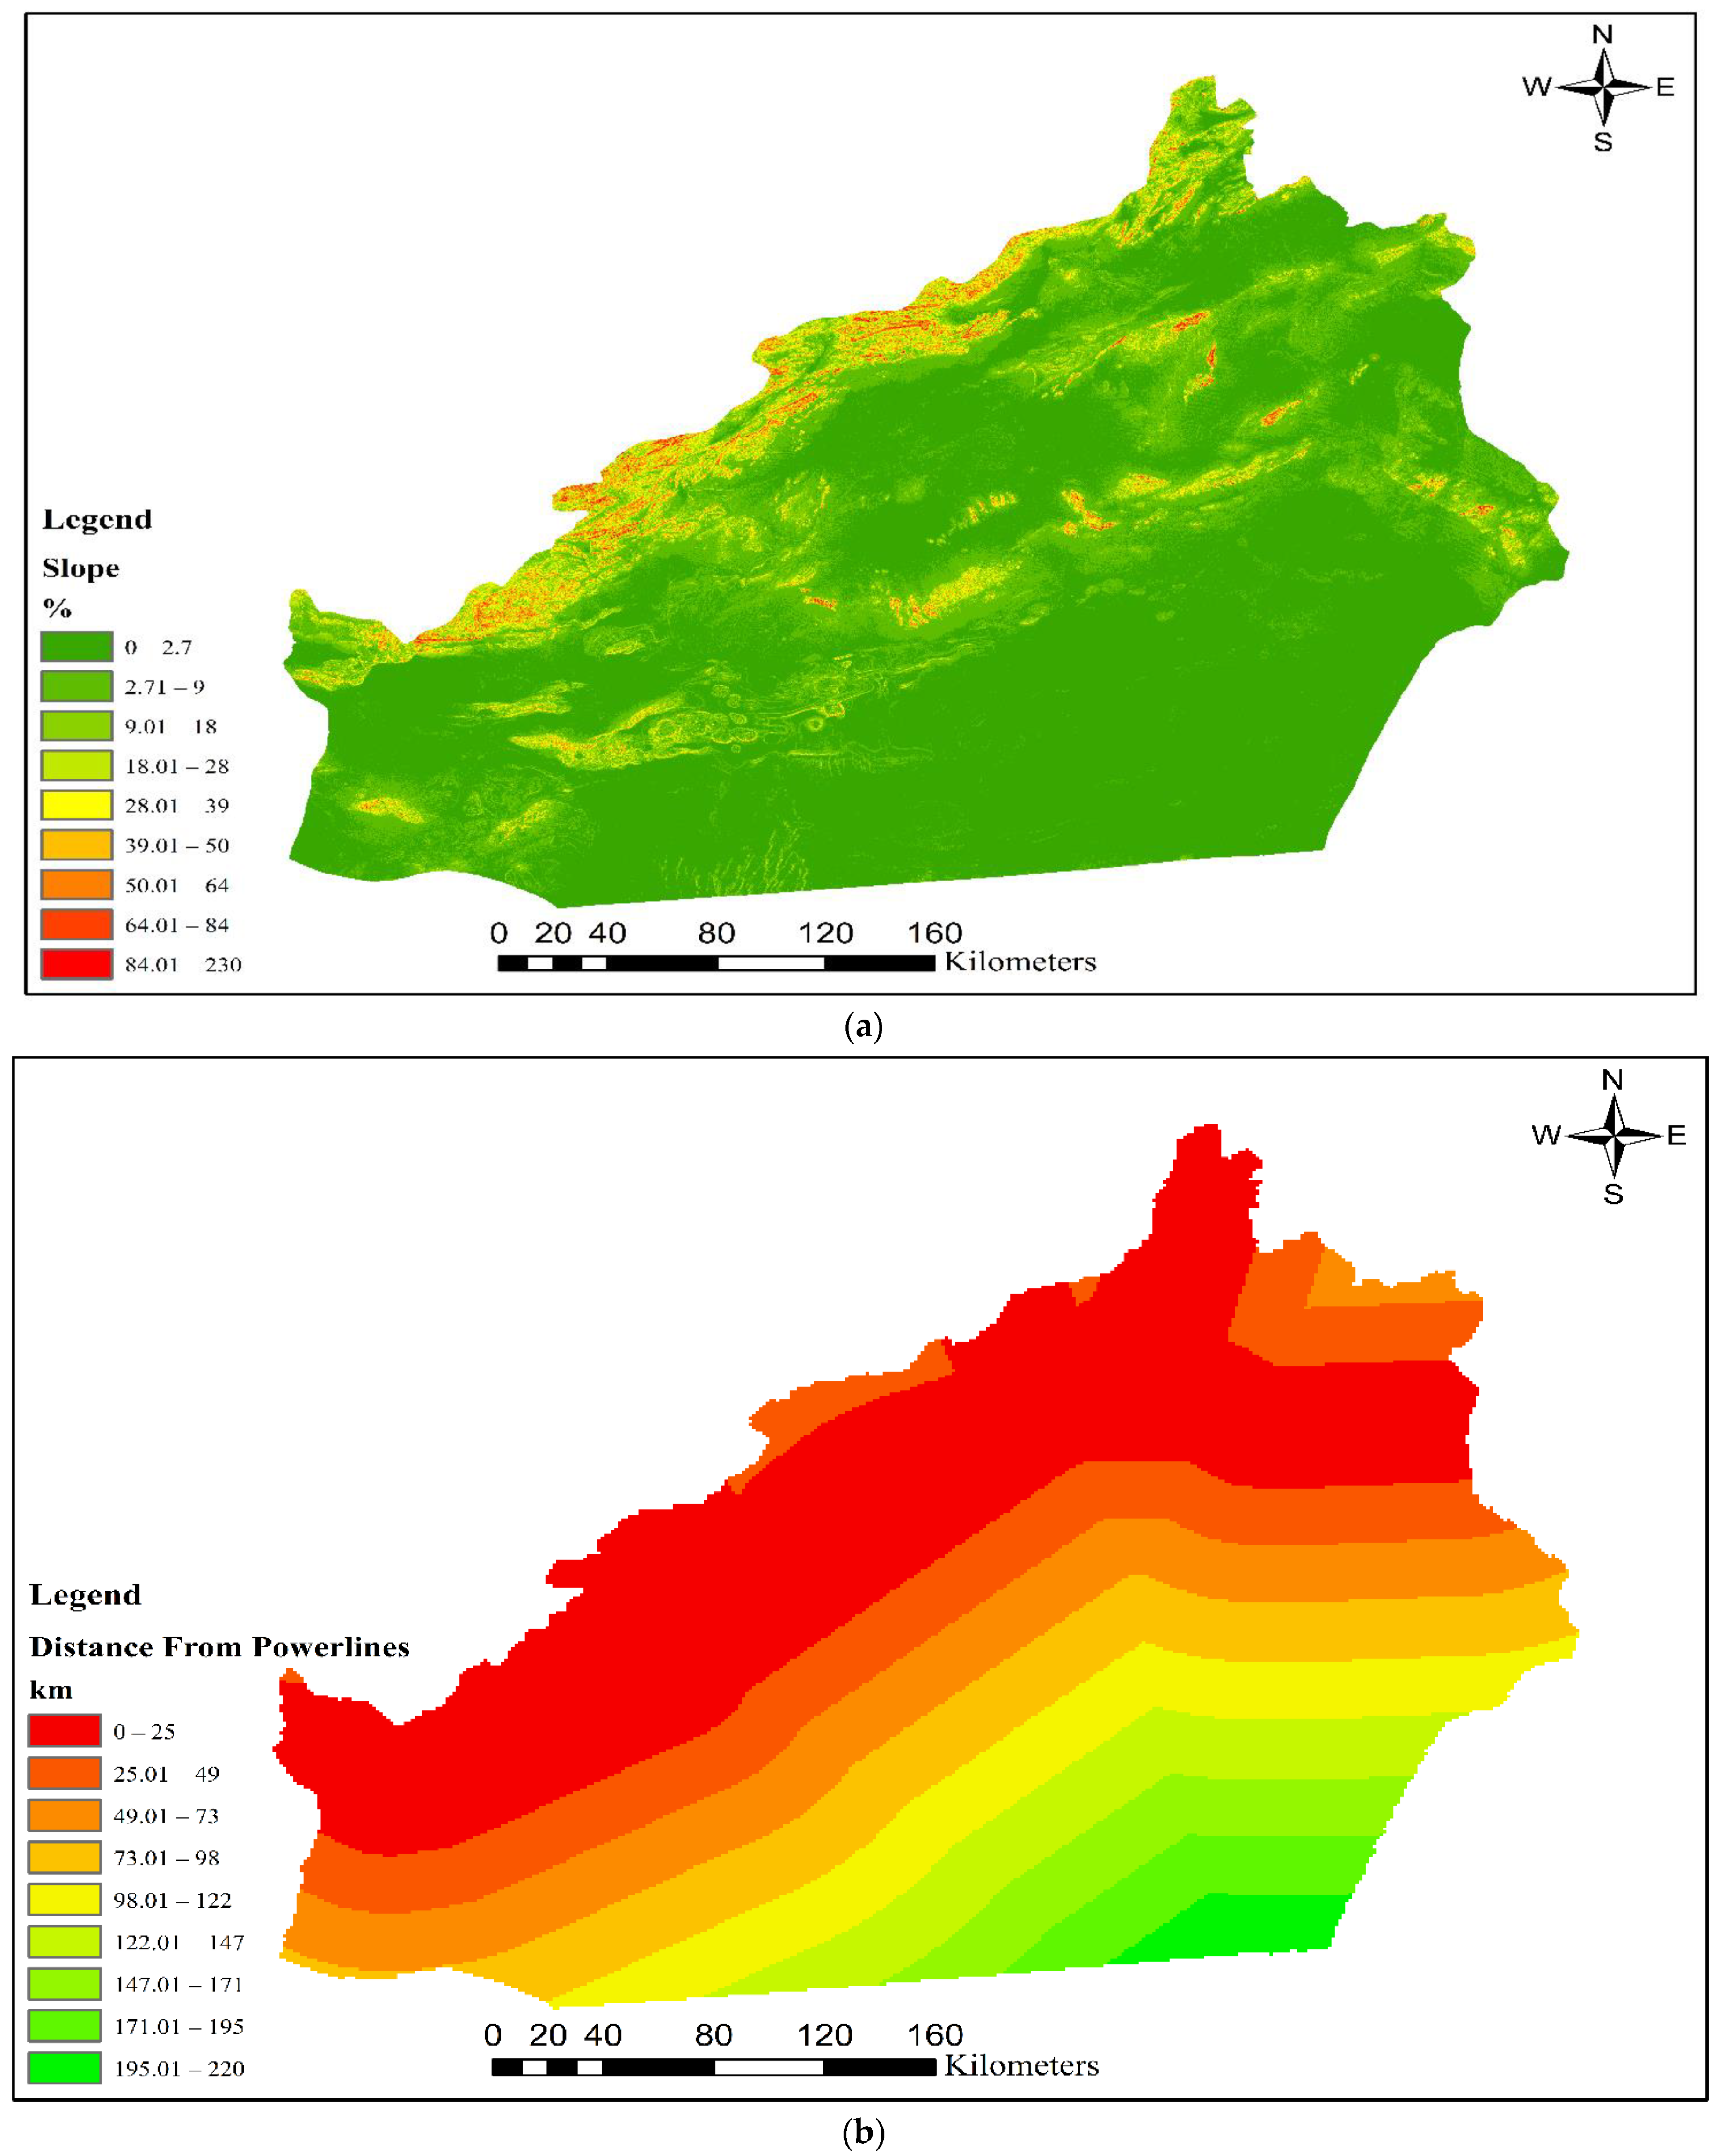
5.1.1. Topological Restrictions
5.1.2. Structural Restrictions
5.1.3. Ecological Restrictions
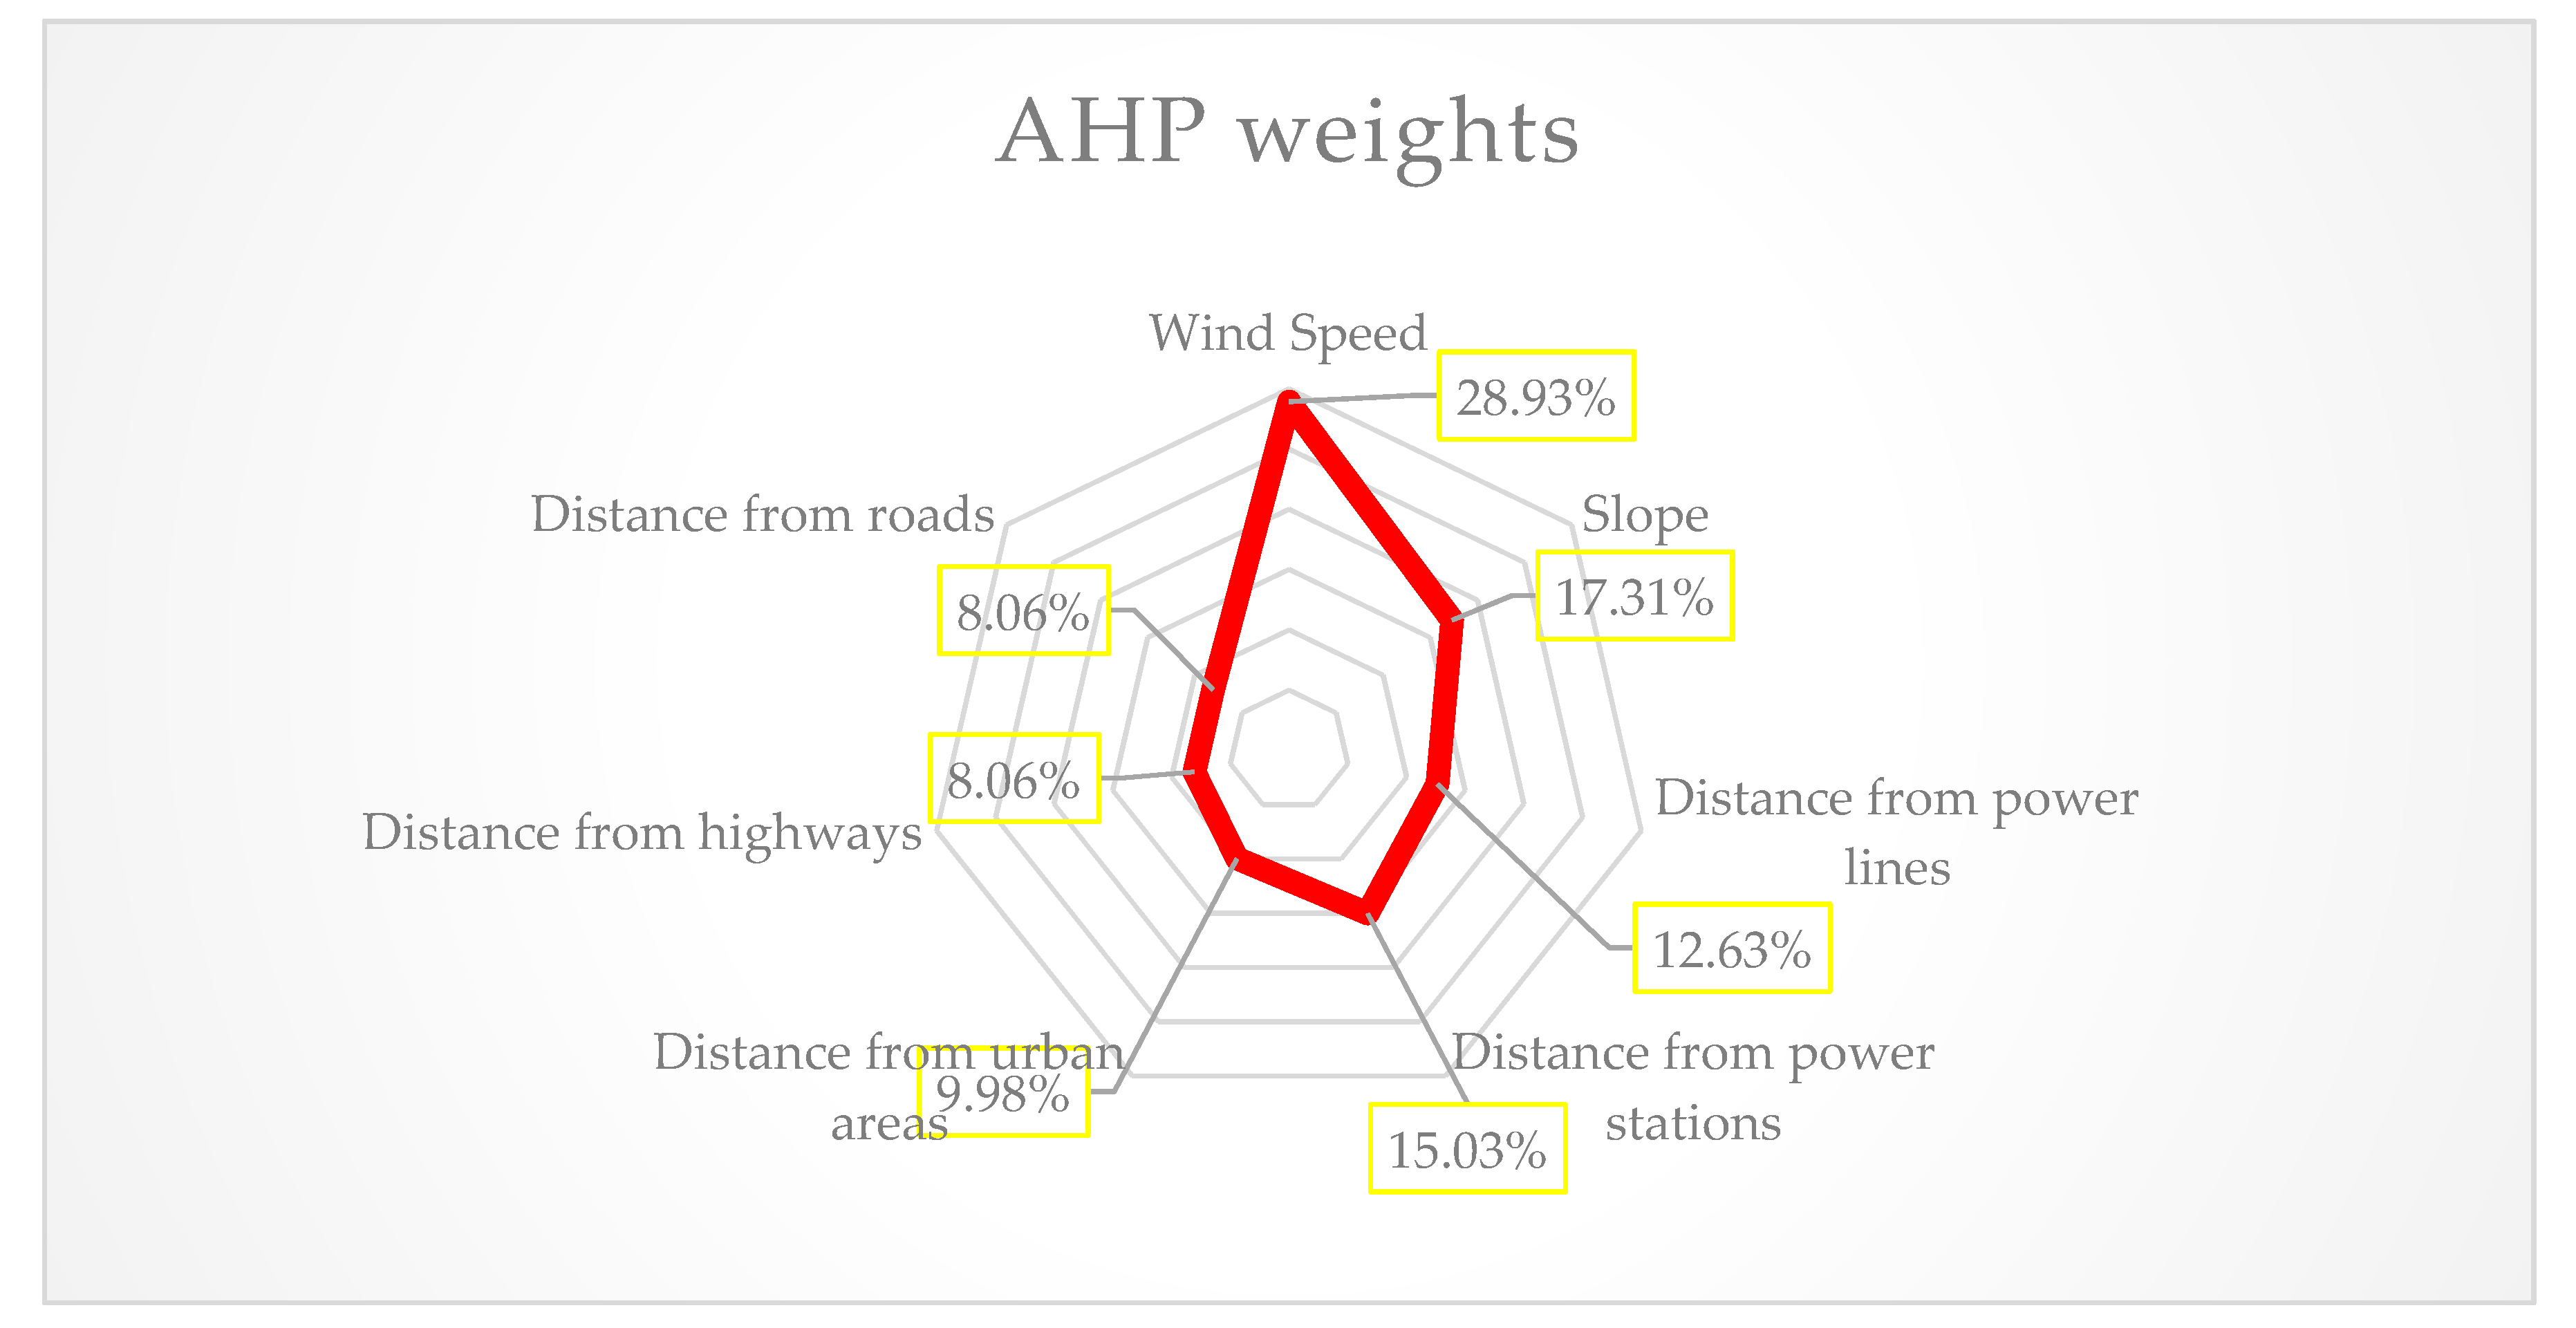
5.2. Executing AHP Weights
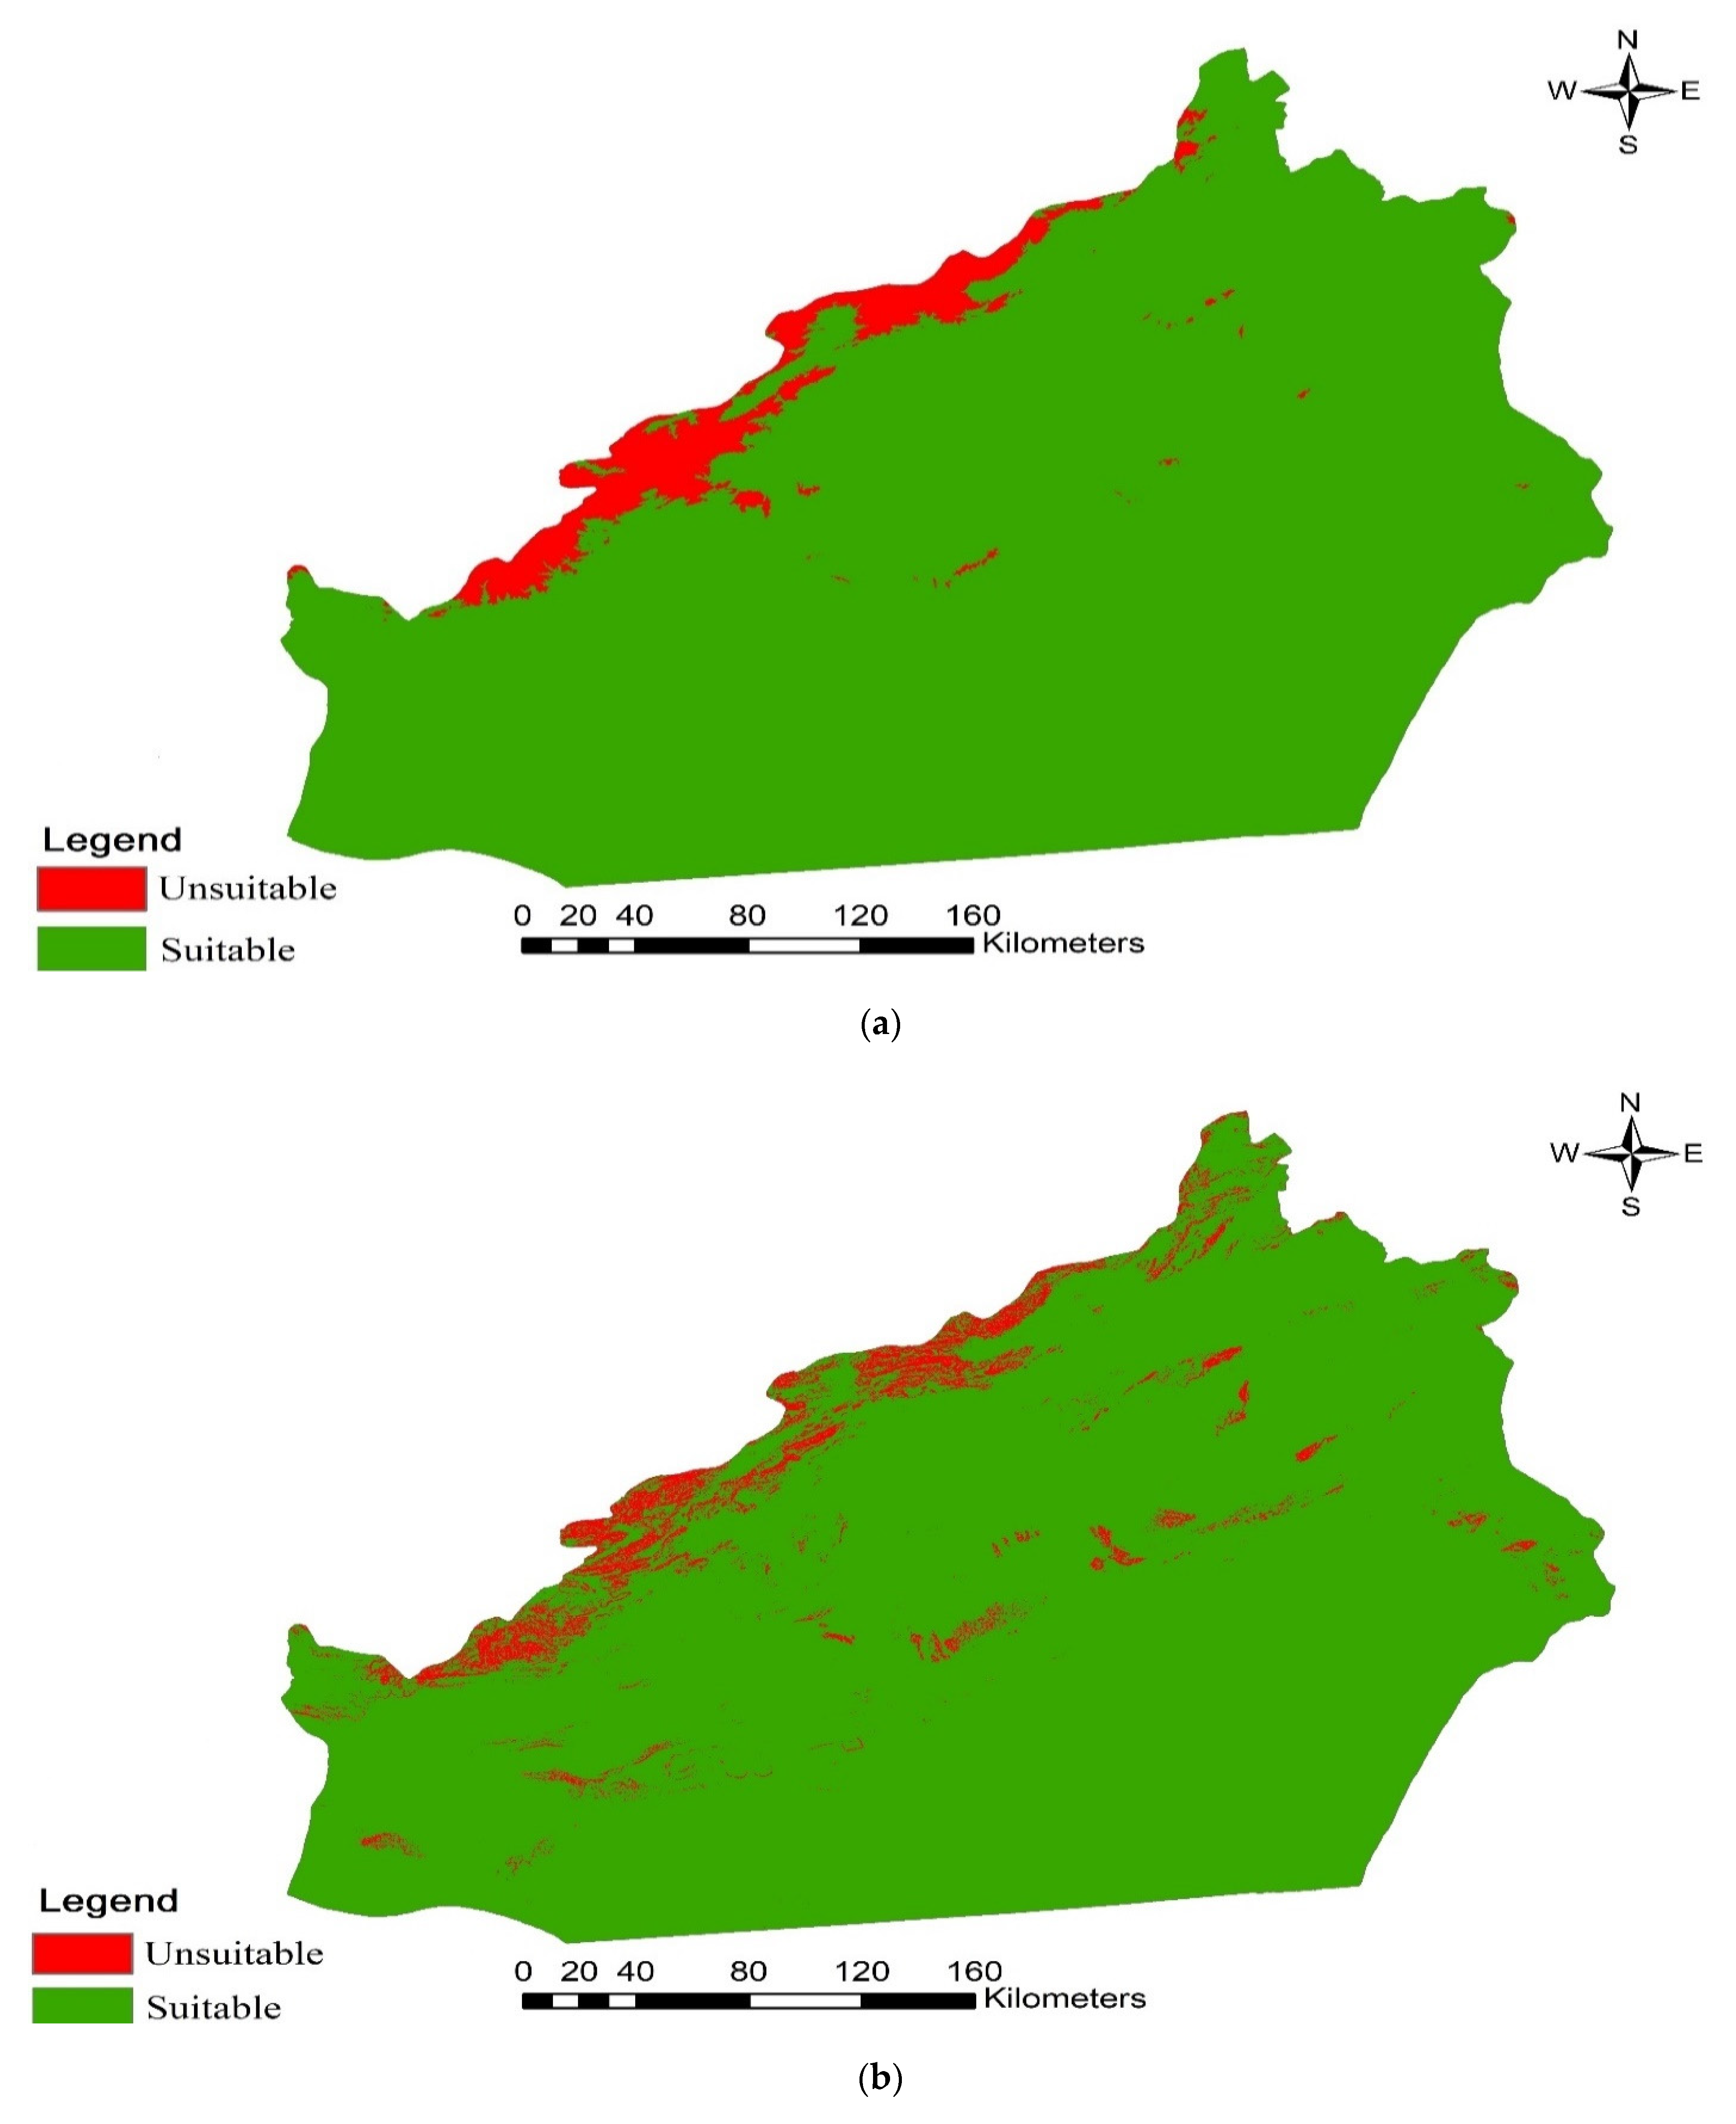
6. Results and Discussions
Comparison with Similar Studies
7. Conclusions
Author Contributions
Funding
Institutional Review Board Statement
Informed Consent Statement
Data Availability Statement
Conflicts of Interest
Appendix A

| Row | Number of Participants | Academic Degree | Organization | Field of Expertise or Related Job |
|---|---|---|---|---|
| 1 | 4 | University professor | Tehran University, Tehran, Iran | Energy and environment, Renewable energies |
| 2 | 2 | University professor | Shahid Beheshti University, Tehran, Iran | Civil engineering, Water and environmental science, Renewable energies |
| 3 | 4 | Industrial technician | - | Wind farm site engineers |
| 4 | 10 | University student (Master and PHD) | Tehran University, Tehran, Iran | Renewable energies engineering |
| Row | Latitude (Deg) | Longitude (Deg) | Average Wind Speed (m/s) | Wind Direction (Deg) | Solar Radiation (W/m2) | Station | Province |
|---|---|---|---|---|---|---|---|
| 1 | 50.88 | 34.64 | 4.92 | 208.14 | 117.35 | Qom | Qom |
| 2 | 50.94 | 34.19 | 4.92 | 208.14 | 117.35 | Vesf | Qom |
| 3 | 52.77 | 35.75 | 4.33 | 196.32 | - | Friruzhuh | Tehran |
| 4 | 54.45 | 37.01 | 3.6 | 185.58 | 178.04 | Aqqala | Golestan |
| 5 | 55.95 | 37.9 | 3.83 | 186.71 | 179.51 | Marave tappe | Golestan |
| 6 | 57.33 | 37.47 | 5.25 | 172.32 | 197.39 | Bojnurd | North Khorasan |
| 7 | 56.88 | 36.44 | 3.71 | 181.19 | 213.06 | Davaran | Isfahan |
| 8 | 57.31 | 36.03 | 5.21 | 131.67 | 203.89 | Rudab | Razavi Khorasan |
| 9 | 59 | 33.45 | 4.7 | 147.6 | 238.1 | Afriz | South Khorasan |
| 10 | 53.32 | 35.14 | 4.21 | 152.8 | 176.25 | Kahak | Qom |
| 11 | 54.56 | 35.21 | 5.3 | 181.84 | 222.54 | Moalleman | Semnan |
| 12 | 54.73 | 36.26 | 4.95 | 161.45 | 214.24 | Hadadeh | Semnan |
| 13 | 53.39 | 35.58 | 3.64 | 199.8 | 181.96 | Semnan | Semnan |
References
- Paris Climate Agreement. United Nations Climate Changes. 2015. Available online: https://unfccc.int/process-and-meetings/the-paris-agreement/the-paris-agreement (accessed on 20 May 2022).
- Sobouti, Y. Iran’s Commitments toward Meeting the Goals of Paris Agreement Harnessing the Global Temperature Rise. Reg. Issues 2018, 3, 112–114. [Google Scholar] [CrossRef]
- Yousefi, H.; Montazeri, M.; Rahmani, A. Techno-economic Analysis of Wind Turbines Systems to Reduce Carbon Emission of Greenhouses: A Case Study in Iran. In Proceedings of the 7th Iran Wind Energy Conference (IWEC2021), Shahrood, Iran, 17–18 May 2021. [Google Scholar]
- Ortega-Izquierdo, M.; del Río, P. An Analysis of the Socioeconomic and Environmental Benefits of Wind Energy Deployment in Europe. Renew. Energy 2020, 160, 1067–1080. [Google Scholar] [CrossRef]
- Sadorsky, P. Wind energy for sustainable development: Driving factors and future outlook. J. Clean. Prod. 2021, 289, 125779. [Google Scholar] [CrossRef]
- Noorollahi, Y.; Yousefi, H.; Mohammadi, M. Multi-criteria decision support system for wind farm site selection using GIS. Sustain. Energy Technol. Assess. 2016, 13, 38–50. [Google Scholar] [CrossRef]
- Dhar, A.; Naeth, M.A.; Jennings, P.D.; Gamal El-Din, M. Perspectives on environmental impacts and a land reclamation strategy for solar and wind energy systems. Sci. Total Environ. 2020, 718, 134602. [Google Scholar] [CrossRef]
- Barton, D.N.; Sundt, H.; Bustos, A.A.; Fjeldstad, H.P.; Hedger, R.; Forseth, T.; Köhler, B.; Aas, Ø.; Alfredsen, K.; Madsen, A.L. Multi-criteria decision analysis in Bayesian networks—Diagnosing ecosystem service trade-offs in a hydropower regulated river. Environ. Model. Softw. 2020, 124, 104604. [Google Scholar] [CrossRef]
- Aubert, A.H.; Bauer, R.; Lienert, J. A review of water-related serious games to specify use in environmental Multi-Criteria Decision Analysis. Environ. Model. Softw. 2018, 105, 64–78. [Google Scholar] [CrossRef]
- Zhang, J.; Zhong, D.; Zhao, M.; Yu, J.; Lv, F. An optimization model for construction stage and zone plans of rockfill dams based on the enhanced whale optimization algorithm. Energies 2019, 12, 466. [Google Scholar] [CrossRef] [Green Version]
- Shao, M.; Han, Z.; Sun, J.; Xiao, C.; Zhang, S.; Zhao, Y. A review of multi-criteria decision making applications for renewable energy site selection. Renew. Energy 2020, 157, 377–403. [Google Scholar] [CrossRef]
- Saaty, T.L. How to make a decision: The analytic hierarchy process. Eur. J. Oper. Res. 1990, 48, 9–26. [Google Scholar] [CrossRef]
- Saaty, T.L.; Vargas, L.G. The analytic network process. In International Series in Operations Research and Management Science; Springer: Berlin/Heidelberg, Germany, 2013; Volume 195, pp. 1–40. [Google Scholar]
- Ishii, K.; Sugeno, M. A model of human evaluation process using fuzzy measure. Int. J. Man Mach. Stud. 1985, 22, 19–38. [Google Scholar] [CrossRef]
- Zhu, Y.; Tian, D.; Yan, F. Effectiveness of Entropy Weight Method in Decision-Making. Math. Probl. Eng. 2020, 2020, 3564835. [Google Scholar] [CrossRef]
- Alinezhad, A.; Khalili, J. New Methods and Applications in Multiple Attribute Decision Making (MADM). In International Series in Operations Research and Management Science; Springer: Cham, Switzerland, 2019; pp. 115–125. [Google Scholar]
- Si, S.L.; You, X.Y.; Liu, H.C.; Zhang, P. DEMATEL Technique: A Systematic Review of the State-of-the-Art Literature on Methodologies and Applications. Math. Probl. Eng. 2018, 2018, 3696457. [Google Scholar] [CrossRef] [Green Version]
- Chang, Y.S. Multivariate CUSUM and EWMA control charts for skewed populations using weighted standard deviations. Commun. Stat. Simul. Comput. 2007, 36, 921–936. [Google Scholar] [CrossRef]
- Saaty, T.L.; Ozdemir, M.S. A Dictionary of Decisions with Dependence and Feedback Based on the Analytic Network Process; RWS Publication: Pittsburgh, PA, USA, 2005. [Google Scholar]
- Wang, T.C.; Chen, Y.H. Applying consistent fuzzy preference relations to partnership selection. Omega 2007, 35, 384–388. [Google Scholar] [CrossRef]
- Deng, H. Multicriteria analysis with fuzzy pairwise comparison. Int. J. Approx. Reason. 1999, 21, 215–231. [Google Scholar] [CrossRef] [Green Version]
- Kahraman, C.; Cebeci, U.; Ulukan, Z. Multi-criteria supplier selection using fuzzy AHP. Logist. Inf. Manag. 2003, 16, 382–394. [Google Scholar] [CrossRef]
- Nguyen, P.H.; Tsai, J.F.; Dang, T.T.; Lin, M.H.; Pham, H.A.; Nguyen, K.A. A hybrid spherical fuzzy MCDM approach to prioritize governmental intervention strategies against the COVID-19 pandemic: A case study from Vietnam. Mathematics 2021, 9, 2626. [Google Scholar] [CrossRef]
- Nguyen, P.H.; Tsai, J.F.; Lin, M.H.; Hu, Y.C. A hybrid model with spherical fuzzy-ahp, pls-sem and ann to predict vaccination intention against COVID-19. Mathematics 2021, 9, 3075. [Google Scholar] [CrossRef]
- Ding, X.; Chong, X.; Bao, Z.; Xue, Y.; Zhang, S. Fuzzy Comprehensive Assessment Method Based on the Entropy Weight Method and Its Application in the Water Environmental Safety Evaluation of the Heshangshan Drinking Water Source Area, Three Gorges Reservoir Area, China. Water 2017, 9, 329. [Google Scholar] [CrossRef] [Green Version]
- Zhao, H.; Guo, S. External benefit evaluation of renewable energy power in China for sustainability. Sustainability 2015, 7, 4783–4805. [Google Scholar] [CrossRef] [Green Version]
- Chen, C.H. A new multi-criteria assessment model combining GRA techniques with intuitionistic fuzzy entropy-based TOPSIS method for sustainable building materials supplier selection. Sustainability 2019, 11, 2265. [Google Scholar] [CrossRef] [Green Version]
- Godlewska, J.; Sidorczuk-Pietraszko, E. Taxonomic assessment of transition to the green economy in Polish regions. Sustainability 2019, 11, 5098. [Google Scholar] [CrossRef] [Green Version]
- Stanujkic, D.; Popovic, G.; Zavadskas, E.K.; Karabasevic, D.; Binkyte-Veliene, A. Assessment of progress towards achieving sustainable development goals of the “Agenda 2030” by using the CoCoSo and the shannon entropy methods: The case of the Eu countries. Sustainability 2020, 12, 5717. [Google Scholar] [CrossRef]
- Zhao, D.-Y.; Ma, Y.-Y.; Lin, H.-L. Using the Entropy and TOPSIS Models to Evaluate Sustainable Development of Islands: A Case in China. Sustainability 2022, 14, 3707. [Google Scholar] [CrossRef]
- Lu, X.; Li, L.Y.; Lei, K.; Wang, L.; Zhai, Y.; Zhai, M. Water quality assessment of Wei River, China using fuzzy synthetic evaluation. Environ. Earth Sci. 2010, 60, 1693–1699. [Google Scholar] [CrossRef]
- Cui, Y.; Feng, P.; Jin, J.; Liu, L. Water resources carrying capacity evaluation and diagnosis based on set pair analysis and improved the entropy weight method. Entropy 2018, 20, 359. [Google Scholar] [CrossRef] [Green Version]
- Ahmadi, M.H.; Dehshiri, S.S.H.; Dehshiri, S.J.H.; Mostafaeipour, A.; Almutairi, K.; Ao, H.X.; Rezaei, M.; Techato, K. A Thorough Economic Evaluation by Implementing Solar/Wind Energies for Hydrogen Production: A Case Study. Sustainability 2022, 14, 1177. [Google Scholar] [CrossRef]
- Tanackov, L.; Badi, I.; Stević, Ž.; Pamučar, D.; Zavadskas, E.K.; Bausys, R. A Novel Hybrid Interval Rough SWARA—Interval Rough ARAS Model for Evaluation Strategies of Cleaner Production. Sustainability 2022, 14, 4343. [Google Scholar] [CrossRef]
- Meng, R.; Zhang, L.; Zang, H.; Jin, S. Evaluation of environmental and economic integrated benefits of photovoltaic poverty alleviation technology in the Sanjiangyuan region of Qinghai province. Sustainability 2021, 13, 13236. [Google Scholar] [CrossRef]
- Ishizaka, A.; Labib, A. Analytic Hierarchy Process and Expert Choice: Benefits and limitations. OR Insight 2009, 22, 201–220. [Google Scholar] [CrossRef] [Green Version]
- Koundinya, S.; Chattopadhyay, D.; Ramanathan, R. Incorporating qualitative objectives in integrated resource planning: Application of analytic hierarchy process and compromise programming. Energy Sources 1995, 17, 565–581. [Google Scholar] [CrossRef]
- Moradi, S.; Yousefi, H.; Noorollahi, Y.; Rosso, D. Multi-criteria decision support system for wind farm site selection and sensitivity analysis: Case study of Alborz Province, Iran. Energy Strategy Rev. 2020, 29, 100478. [Google Scholar] [CrossRef]
- Mosadeghi, R.; Warnken, J.; Tomlinson, R.; Mirfenderesk, H. Comparison of Fuzzy-AHP and AHP in a spatial multi-criteria decision making model for urban land-use planning. Comput. Environ. Urban Syst. 2015, 49, 54–65. [Google Scholar] [CrossRef] [Green Version]
- Khajavi, A.; Reza, M.; Hosseinzadeh, F. Solar PV Power Plant Site Selection Using GIS-FFDEA Based Approach with Application in Iran. J. Renew. Energy Environ. 2021, 8, 28–43. [Google Scholar]
- Xu, Y.; Li, Y.; Zheng, L.; Cui, L.; Li, S.; Li, W.; Cai, Y. Site selection of wind farms using GIS and multi-criteria decision making method in Wafangdian, China. Energy 2020, 207, 118222. [Google Scholar] [CrossRef]
- Colak, H.E.; Memisoglu, T.; Gercek, Y. Optimal site selection for solar photovoltaic (PV) power plants using GIS and AHP: A case study of Malatya Province, Turkey. Renew. Energy 2020, 149, 565–576. [Google Scholar] [CrossRef]
- Castro-Santos, L.; Lamas-Galdo, M.I.; Filgueira-Vizoso, A. Managing the oceans: Site selection of a floating offshore wind farm based on GIS spatial analysis. Mar. Policy 2020, 113, 103803. [Google Scholar] [CrossRef]
- Sayl, K.N.; Mohammed, A.S.; Ahmed, A.D. GIS-based approach for rainwater harvesting site selection. IOP Conf. Ser. Mater. Sci. Eng. 2020, 737, 012246. [Google Scholar] [CrossRef]
- Wu, Y.; Liu, F.; Huang, Y.; Xu, C.; Zhang, B.; Ke, Y.; Jia, W. A two-stage decision framework for inland nuclear power plant site selection based on GIS and type-2 fuzzy PROMETHEE II: Case study in China. Energy Sci. Eng. 2020, 8, 1941–1961. [Google Scholar] [CrossRef]
- Ali, S.A.; Parvin, F.; Al-Ansari, N.; Pham, Q.B.; Ahmad, A.; Raj, M.S.; Anh, D.T.; Ba, L.H.; Thai, V.N. Sanitary landfill site selection by integrating AHP and FTOPSIS with GIS: A case study of Memari Municipality, India. Environ. Sci. Pollut. Res. 2021, 28, 7528–7550. [Google Scholar] [CrossRef] [PubMed]
- Neissi, L.; Albaji, M.; Boroomand Nasab, S. Combination of GIS and AHP for site selection of pressurized irrigation systems in the Izeh plain, Iran. Agric. Water Manag. 2020, 231, 106004. [Google Scholar] [CrossRef]
- Kaya, Ö.; Tortum, A.; Alemdar, K.D.; Çodur, M.Y. Site selection for EVCS in Istanbul by GIS and multi-criteria decision-making. Transp. Res. Part D Transp. Environ. 2020, 80, 102271. [Google Scholar] [CrossRef]
- Ahmadi, S.H.R.; Noorollahi, Y.; Ghanbari, S.; Ebrahimi, M.; Hosseini, H.; Foroozani, A.; Hajinezhad, A. Hybrid fuzzy decision making approach for wind-powered pumped storage power plant site selection: A case study. Sustain. Energy Technol. Assess. 2020, 42, 100838. [Google Scholar] [CrossRef]
- Alhuyi Nazari, M.; Assad, M.E.H.; Haghighat, S.; Maleki, A. Applying TOPSIS Method for Wind Farm Site Selection in Iran. In Proceedings of the 2020 Advances in Science and Engineering Technology International Conferences (ASET), Dubai, United Arab Emirates, 4 February–9 April 2020; p. 4. [Google Scholar]
- Ecer, F. Sustainability assessment of existing onshore wind plants in the context of triple bottom line: A best-worst method (BWM) based MCDM framework. Environ. Sci. Pollut. Res. 2021, 28, 19677–19693. [Google Scholar] [CrossRef]
- Mohammadzadeh Bina, S.; Jalilinasrabady, S.; Fujii, H.; Farabi-Asl, H. A comprehensive approach for wind power plant potential assessment, application to northwestern Iran. Energy 2018, 164, 344–358. [Google Scholar] [CrossRef]
- Gao, J.; Guo, F.; Ma, Z.; Huang, X.; Li, X. Multi-criteria group decision-making framework for offshore wind farm site selection based on the intuitionistic linguistic aggregation operators. Energy 2020, 204, 117899. [Google Scholar] [CrossRef]
- Li, M.; Xu, Y.; Guo, J.; Li, Y.; Li, W. Application of a GIS-Based Fuzzy Multi-Criteria evaluation approach for wind farm site selection in China. Energies 2020, 13, 2426. [Google Scholar] [CrossRef]
- Saraswat, S.; Digalwar, A.; Yadev, S.; Kumar, G. MCDM and GIS based modelling technique for assessment of solar and wind farm locations in India. Renew. Energy 2021, 169, 865–884. [Google Scholar] [CrossRef]
- Zalhaf, A.S.; Elboshy, B.; Kotb, K.M.; Han, Y.; Almaliki, A.H.; Aly, R.M.H.; Elkadeem, M.R. A high-resolution wind farms suitability mapping using gis and fuzzy ahp approach: A national-level case study in Sudan. Sustainability 2022, 14, 358. [Google Scholar] [CrossRef]
- Cunden, T.S.M.; Doorga, J.; Lollchund, M.R.; Rughooputh, S.D.D.V. Multi-level constraints wind farms siting for a complex terrain in a tropical region using MCDM approach coupled with GIS. Energy 2020, 211, 118533. [Google Scholar] [CrossRef]
- Erdin, C.; Akbaş, H.E. A comparative analysis of fuzzy TOPSIS and geographic information systems (GIS) for the location selection of shopping malls: A case study from Turkey. Sustainability 2019, 11, 3837. [Google Scholar] [CrossRef] [Green Version]
- Ertuǧrul, I.; Karakaşoǧlu, N. Comparison of fuzzy AHP and fuzzy TOPSIS methods for facility location selection. Int. J. Adv. Manuf. Technol. 2008, 39, 783–795. [Google Scholar] [CrossRef]
- Rediske, G.; Burin, H.P.; Rigo, P.D.; Rosa, C.B.; Michels, L.; Siluk, J.C.M. Wind power plant site selection: A systematic review. Renew. Sustain. Energy Rev. 2021, 148, 111293. [Google Scholar] [CrossRef]
- Statistical Center of Iran. Available online: https://www.amar.org.ir/english (accessed on 18 May 2022).
- WorldData. 2021. Available online: WorldData.info (accessed on 19 May 2022).
- Energy Balance Sheet. Ministry of Energy of Iran. Available online: https://moe.gov.ir/?lang=en-us (accessed on 17 May 2022).
- Semnan Regional Electricity Company. 2018. Available online: https://semrec.co.ir/page-MyMainEn/en/0 (accessed on 17 April 2022).
- Semnan Power Distribution Company. 2018. Available online: https://www.semepd.ir/page-enmain/en/0#tabcontrol_15 (accessed on 17 April 2022).
- Chakraborty, R.; Ray, A.; Dan, P.K. Multi criteria decision making methods for location selection of distribution centers. Int. J. Ind. Eng. Comput. 2013, 4, 491–504. [Google Scholar] [CrossRef]
- Bertolini, M.; Braglia, M.; Carmignani, G. Application of the AHP methodology in making a proposal for a public work contract. Int. J. Proj. Manag. 2006, 24, 422–430. [Google Scholar] [CrossRef]
- Bowen, W.M. Subjective judgements and data envelopment analysis in site selection. Comput. Environ. Urban Syst. 1990, 14, 133–144. [Google Scholar] [CrossRef]
- Kunasekaran, V.; Krishnamoorthy, K. Multi criteria decision making to select the best method for the preparation of solid lipid nanoparticles of rasagiline mesylate using analytic hierarchy process. J. Adv. Pharm. Technol. Res. 2014, 5, 115–121. [Google Scholar]
- Saaty, T.L.; Tran, L.T. On the invalidity of fuzzifying numerical judgments in the Analytic Hierarchy Process. Math. Comput. Model. 2007, 46, 962–975. [Google Scholar] [CrossRef]
- Kablan, M.M. Decision support for energy conservation promotion: An analytic hierarchy process approach. Energy Policy 2004, 32, 1151–1158. [Google Scholar] [CrossRef]
- Satkin, M.; Noorollahi, Y.; Abbaspour, M.; Yousefi, H. Multi criteria site selection model for wind-compressed air energy storage power plants in Iran. Renew. Sustain. Energy Rev. 2014, 32, 579–590. [Google Scholar] [CrossRef]
- Höfer, T.; Sunak, Y.; Siddique, H.; Madlener, R. Wind farm siting using a spatial Analytic Hierarchy Process approach: A case study of the Städteregion Aachen. Appl. Energy 2016, 163, 222–243. [Google Scholar] [CrossRef]
- Plan and Budget Organization of Iran. 2022. Available online: https://www.mporg.ir/en (accessed on 18 May 2022).
- Ameri, M.; Ghadiri, M.; Hosseini, M. Recent advances in the implementation of wind energy in Iran. In Proceedings of the Joint International Conference on Sustainable Energy and Environment (SEE-2), Bangkok, Thailand, 1–3 November 2006; pp. 21–23. [Google Scholar]
- Bennui, A.; Rattanamanee, P.; Puetpaiboon, U.; Phukpattaranont, P.; Chetpattananondh, K. Site Selection for Large Wind Turbine Using Gis. In Proceedings of the PSU-UNS International Conference on Engineering and Environment—ICEE-2007, Hat Yai, Thailand, 10–11 May 2007; pp. 90–112. [Google Scholar]
- Gorsevski, P.V.; Cathcart, S.C.; Mirzaei, G.; Jamali, M.M.; Ye, X.; Gomezdelcampo, E. A group-based spatial decision support system for wind farm site selection in Northwest Ohio. Energy Policy 2013, 55, 374–385. [Google Scholar] [CrossRef]
- Tegou, L.I.; Polatidis, H.; Haralambopoulos, D.A. Environmental management framework for wind farm siting: Methodology and case study. J. Environ. Manag. 2010, 91, 2134–2147. [Google Scholar] [CrossRef]
- Baban, S.M.J.; Parry, T. Developing and applying a GIS-assisted approach to locating wind farms in the UK. Renew. Energy 2001, 24, 59–71. [Google Scholar] [CrossRef]
- Watson, J.J.W.; Hudson, M.D. Regional Scale wind farm and solar farm suitability assessment using GIS-assisted multi-criteria evaluation. Landsc. Urban Plan. 2015, 138, 20–31. [Google Scholar] [CrossRef]
- Mirhosseini, M.; Sharifi, F.; Sedaghat, A. Assessing the wind energy potential locations in province of Semnan in Iran. Renew. Sustain. Energy Rev. 2011, 15, 449–459. [Google Scholar] [CrossRef]
- Barzehkar, M.; Parnell, K.E.; Mobarghaee Dinan, N.; Brodie, G. Decision support tools for wind and solar farm site selection in Isfahan Province, Iran. Clean. Technol. Environ. Policy 2021, 23, 1179–1195. [Google Scholar] [CrossRef]
- Nadizadeh Shorabeh, S.; Argany, M.; Rabiei, J.; Karimi Firozjaei, H.; Nematollahi, O. Potential assessment of multi-renewable energy farms establishment using spatial multi-criteria decision analysis: A case study and mapping in Iran. J. Clean. Prod. 2021, 295, 126318. [Google Scholar] [CrossRef]
- Hosseini Dehshiri, S.S.; Hosseini Dehshiri, S.J. Locating wind farm for power and hydrogen production based on Geographic information system and multi-criteria decision making method: An application. Int. J. Hydrogen Energy 2022, 3, 83. [Google Scholar] [CrossRef]


| Ref | Location | Type of Site Selection | Applied Method |
|---|---|---|---|
| [50] | Shahrood, Khorramdareh, Zabol, and Abadeh In Iran | Wind farm | TOPSIS |
| [51] | Izmir, Turkey | Wind farm | MCDM-(best-worst method) (BWM) |
| [52] | Northeast of Iran | Wind farm | Equal importance criteria |
| [53] | China | Offshore wind farm | MCDM-intuitionistic linguistic aggregation operators |
| [54] | China | Wind farm | MCDM-Fuzzy |
| [55] | India | Wind farm | MCDM-Fuzzy AHP |
| [56] | Sudan | Wind farm | MCDM-Fuzzy AHP |
| [57] | Mauritius | Wind farm | MCDM-AHP |
| Scale | Numerical Rating | Reciprocal |
|---|---|---|
| Extreme importance | 9 | 1/9 |
| Very to extremely strong importance | 8 | 1/8 |
| Very strong importance | 7 | 1/7 |
| Strong to very strong importance | 6 | 1/6 |
| Strong importance | 5 | 1/5 |
| Moderate to strong importance | 4 | 1/4 |
| Moderate importance | 3 | 1/3 |
| Equal to moderate importance | 2 | 1/2 |
| Equal importance | 1 | 1 |
| N | 1 | 2 | 3 | 4 | 5 | 6 | 7 | 8 | 9 | 10 |
|---|---|---|---|---|---|---|---|---|---|---|
| RI | 0 | 0 | 0.52 | 0.89 | 1.11 | 1.25 | 1.35 | 1.4 | 1.45 | 1.49 |
| Criteria | Wind Speed | Slope | Power Lines | Power Stations | Urban Areas | Highways | Roads |
|---|---|---|---|---|---|---|---|
| Wind Speed | 1 | 2 | 3 | 3 | 2 | 3 | 3 |
| Slope | 0.5 | 1 | 2 | 2 | 1 | 2 | 2 |
| Power Lines | 0.33 | 0.5 | 1 | 0.5 | 2 | 2 | 2 |
| Power Stations | 0.33 | 0.5 | 2 | 1 | 2 | 2 | 2 |
| Urban Areas | 0.5 | 1 | 0.5 | 0.5 | 1 | 1 | 1 |
| Highways | 0.33 | 0.5 | 0.5 | 0.5 | 1 | 1 | 1 |
| Roads | 0.33 | 0.5 | 0.5 | 0.5 | 1 | 1 | 1 |
| Sum | 3.32 | 6 | 9.5 | 8 | 10 | 12 | 12 |
| Criteria | Wind Speed | Slope | Power Lines | Power Stations | Urban Areas | Highways | Roads | Weights |
|---|---|---|---|---|---|---|---|---|
| Wind Speed | 0.3012 | 0.3333 | 0.3157 | 0.375 | 0.2 | 0.25 | 0.25 | 0.2893 |
| Slope | 0.1506 | 0.1666 | 0.2105 | 0.25 | 0.1 | 0.1666 | 0.1666 | 0.1730 |
| Power Lines | 0.0993 | 0.0833 | 0.1052 | 0.0625 | 0.2 | 0.1666 | 0.1666 | 0.1262 |
| Power Stations | 0.0993 | 0.0833 | 0.2105 | 0.125 | 0.2 | 0.1666 | 0.1666 | 0.1502 |
| Urban Areas | 0.1506 | 0.1666 | 0.0526 | 0.0625 | 0.1 | 0.0833 | 0.0833 | 0.0998 |
| Highways | 0.0993 | 0.0833 | 0.0526 | 0.0625 | 0.1 | 0.0833 | 0.0833 | 0.0806 |
| Roads | 0.0993 | 0.0833 | 0.0526 | 0.0625 | 0.1 | 0.0833 | 0.0833 | 0.0806 |
| Criteria | Wind Speed | Slope | Power Lines | Power Stations | Urban Areas | Highways | Roads | Weighted Sum Value | Weighted Sum Value/Weights |
|---|---|---|---|---|---|---|---|---|---|
| Wind Speed | 0.2893 | 0.346 | 0.3786 | 0.4506 | 0.1996 | 0.2418 | 0.2418 | 2.1477 | 7.423 |
| Slope | 0.1446 | 0.173 | 0.2524 | 0.3004 | 0.0998 | 0.1612 | 0.1612 | 1.29265 | 7.471 |
| Power Lines | 0.0954 | 0.0865 | 0.1262 | 0.0751 | 0.1996 | 0.1612 | 0.1612 | 0.905269 | 7.172 |
| Power Stations | 0.0954 | 0.0865 | 0.2524 | 0.1502 | 0.1996 | 0.1612 | 0.1612 | 1.106569 | 7.3668 |
| Urban Areas | 0.1446 | 0.173 | 0.0631 | 0.0751 | 0.0998 | 0.0806 | 0.0806 | 0.71685 | 7.1823 |
| Highways | 0.0954 | 0.0865 | 0.0631 | 0.0751 | 0.0998 | 0.0806 | 0.0806 | 0.581169 | 7.209 |
| Roads | 0.0954 | 0.0865 | 0.0631 | 0.0751 | 0.0998 | 0.0806 | 0.0806 | 0.581169 | 7.209 |
| Weights | 0.2893 | 0.173 | 0.1262 | 0.1502 | 0.0998 | 0.0806 | 0.0806 | λmax = 7.29 |
| Sub-Criteria | Buffer Zones | References |
|---|---|---|
| Elevation (m) | >2000 | [6,72] |
| Slope (percent) | >30 | [73] |
| Faults (m) | <500 | [6] |
| Sub-Criteria | Buffer Zones | References |
|---|---|---|
| Highways and roads (m) | <500 | [6] |
| Oil and gas transmission lines (m) | <500 | [6,72] |
| High voltage power lines (m) | <250 | [6,72,75] |
| Substations (m) | <250 | [72] |
| Railways (m) | <300 | [6] |
| Airports (m) | <2500 | [6] |
| Sub-Criteria | Buffer Zones | References |
|---|---|---|
| Environmental protected areas (m) | <2000 | [6] |
| Urban areas (m) | <2500 | [76] |
| Water bodies (m) | <1000 | [6] |
| Rivers (m) | <500 | [6] |
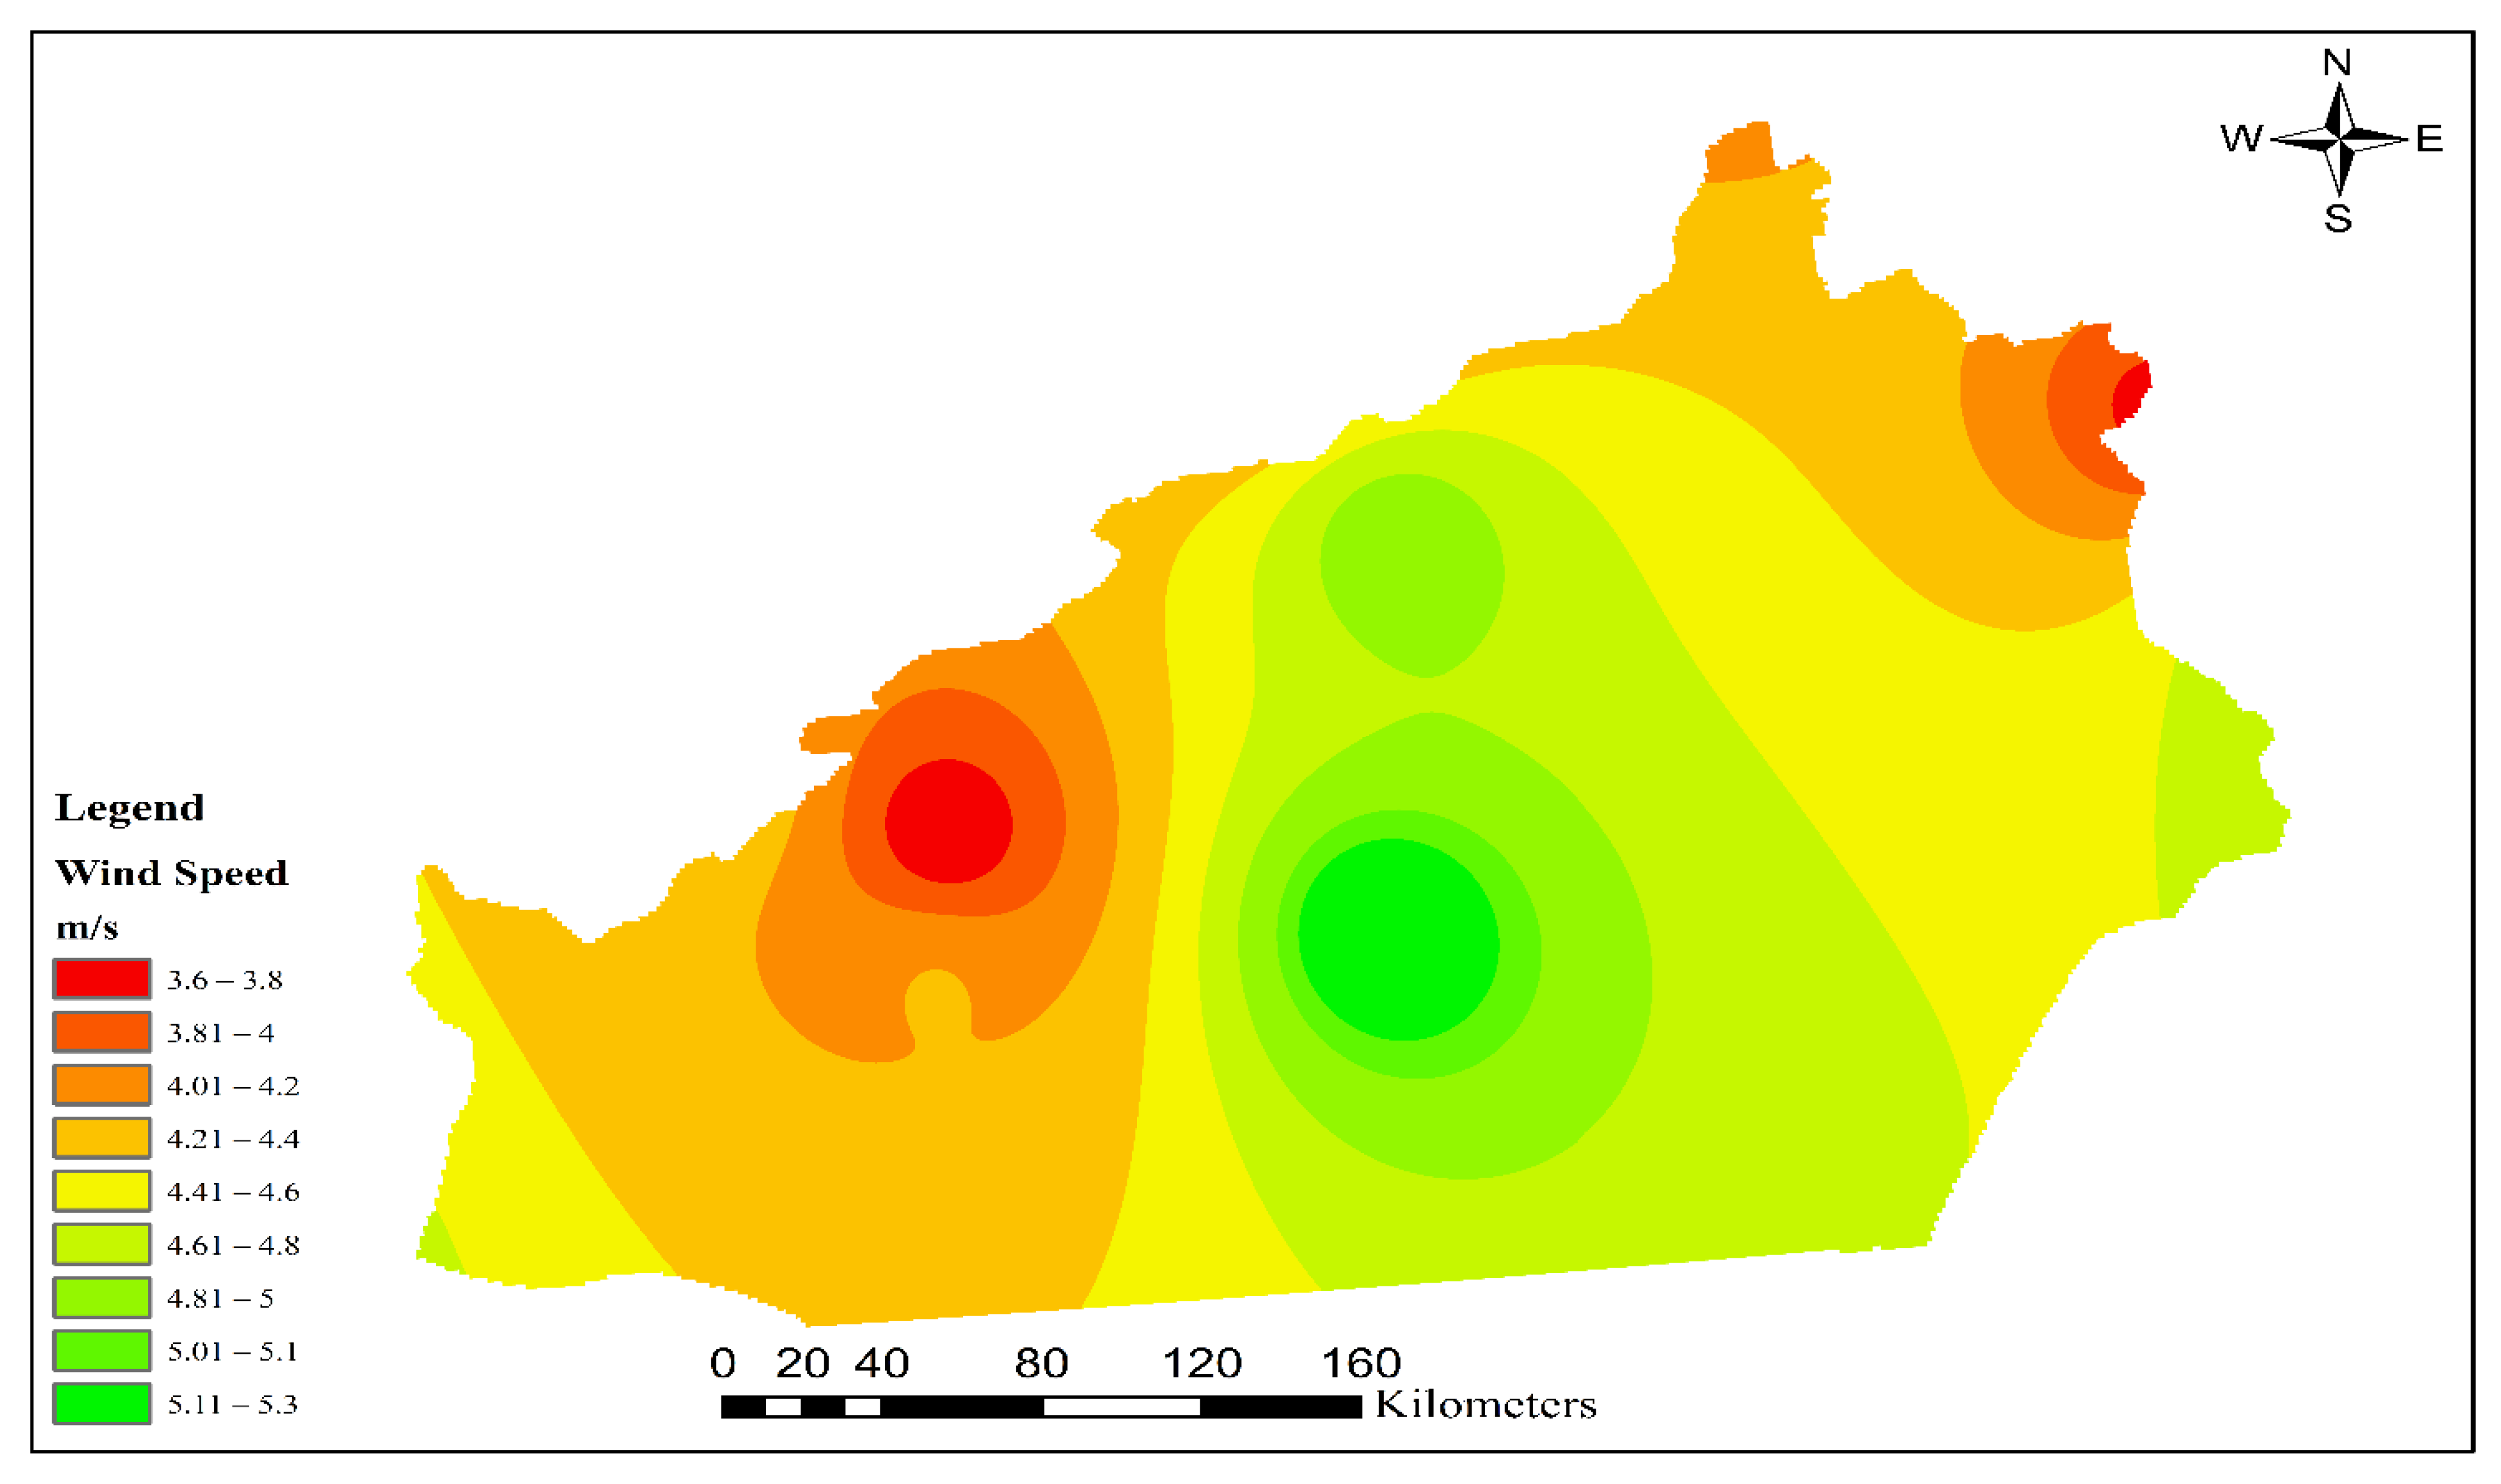
| Row | Station | Latitude (Deg) | Longitude (Deg) | Average Wind Speed (m/s) |
|---|---|---|---|---|
| 1 | Qom | 50.88 | 34.64 | 4.92 |
| 2 | Vesf | 50.94 | 34.19 | 4.92 |
| 3 | Friruzhuh | 52.77 | 35.75 | 4.33 |
| 4 | Aqqala | 54.45 | 37.01 | 3.6 |
| 5 | Marave tappe | 55.95 | 37.9 | 3.83 |
| 6 | Bojnurd | 57.33 | 37.47 | 5.25 |
| 7 | Davaran | 56.88 | 36.44 | 3.71 |
| 8 | Rudab | 57.31 | 36.03 | 5.21 |
| 9 | Afriz | 59 | 33.45 | 4.7 |
| 10 | Kahak | 53.32 | 35.14 | 4.21 |
| 11 | Moalleman | 54.56 | 35.21 | 5.3 |
| 12 | Hadadeh | 54.73 | 36.26 | 4.95 |
| 13 | Semnan | 53.39 | 35.58 | 3.64 |
Publisher’s Note: MDPI stays neutral with regard to jurisdictional claims in published maps and institutional affiliations. |
© 2022 by the authors. Licensee MDPI, Basel, Switzerland. This article is an open access article distributed under the terms and conditions of the Creative Commons Attribution (CC BY) license (https://creativecommons.org/licenses/by/4.0/).
Share and Cite
Yousefi, H.; Motlagh, S.G.; Montazeri, M. Multi-Criteria Decision-Making System for Wind Farm Site-Selection Using Geographic Information System (GIS): Case Study of Semnan Province, Iran. Sustainability 2022, 14, 7640. https://doi.org/10.3390/su14137640
Yousefi H, Motlagh SG, Montazeri M. Multi-Criteria Decision-Making System for Wind Farm Site-Selection Using Geographic Information System (GIS): Case Study of Semnan Province, Iran. Sustainability. 2022; 14(13):7640. https://doi.org/10.3390/su14137640
Chicago/Turabian StyleYousefi, Hossein, Saheb Ghanbari Motlagh, and Mohammad Montazeri. 2022. "Multi-Criteria Decision-Making System for Wind Farm Site-Selection Using Geographic Information System (GIS): Case Study of Semnan Province, Iran" Sustainability 14, no. 13: 7640. https://doi.org/10.3390/su14137640
APA StyleYousefi, H., Motlagh, S. G., & Montazeri, M. (2022). Multi-Criteria Decision-Making System for Wind Farm Site-Selection Using Geographic Information System (GIS): Case Study of Semnan Province, Iran. Sustainability, 14(13), 7640. https://doi.org/10.3390/su14137640