Abstract
Species diversity plays an important role in urban ecosystem stability and sustainability. Research on woody plant diversity among different administrative districts is vital to effectively improving urban biodiversity. In this study, a stratified random sampling method was used to set the sample plot, a spatial mapping of the diversity indices was conducted, and methods of principal component analysis and similarity analysis were used to analyze the species composition and dissimilarity among different administration districts. Finally, the model based on the relationship between the diversity indices and forest landscape pattern indices was built. The results showed that woody plant species diversity differed significantly among different administrative districts in Changchun. The species diversity levels in the Qikai (QK), Lvyuan (LY), and Kuancheng (KC) districts were higher, and those in the Nanguan (NG) and Erdao (ED) districts were lower. The species composition of every district basically complied with the 10/20/30 “rule of thumb”. The most common species, genera, and families in urban forests should not exceed the proportion of the total abundance of all species. There was a significant correlation between the diversity indices and the forest landscape indices of each district. The Margalef index (dMa) and the Shannon–Wiener index (H′) decreased significantly while CONTIG-MN increased, and increased significantly while LSI increased. Species evenness index J decreased significantly while LPI increased, and increased significantly while DIVISION increased. In future tree species selection, native tree species should be given priority as much as possible, the planting of Salicaceae should be reduced, and the species diversity of each district should be increased. Chaoyang (CY), ED, and LY districts should strengthen the links between forest patches.
1. Introduction
Rapid urban expansion and associated environmental problems have posed serious threats to urban biodiversity [1,2,3,4,5], which affects the functions and services of urban ecosystems [6]. Species diversity is an important component of urban biodiversity. It not only reflects the species richness, species variation, and evenness of the community, but also helps to understand the structures, types, and the inter-species relationships in different communities, as well as the stability of urban ecosystem [7]. In an urban ecosystem, a higher level of species diversity helps to protect urban forests from catastrophic losses caused by the attack of pests and diseases [8,9]. Furthermore, a higher level of species can provide aesthetic value for citizens, which is a significant factor to effectively enhance citizens’ willingness to protect the environment [10]. Thus, species diversity plays an irreplaceable role in maintaining the health and sustainable development of urban forest ecosystems [5].
Numerous studies have been focused on the variance of forest species composition and diversity along the urban to rural gradient, the differences in plant diversity among different types of urban forests, and the relationship between land-use types and urban forest plant diversity [11,12,13,14]. In addition, it has been confirmed that the influences of social and economic factors, urban design, government policies, residential density, and green space management policies on urban vegetation coverage and plant diversity have been greater [15,16,17,18,19,20,21]. However, few studies have focused on the internal differences in species diversity among administrative districts within an urban region. Research on species diversity among different administrative districts can help policymakers effectively understand the current species level of each district.
A great number of studies on landscape ecology and landscape planning have used metric analyses to describe the patterns of landscape change. However, some studies have also shown that landscape heterogeneity and ecological land fragmentation can lead to changes in species richness and biodiversity [22,23]. Yet, the relationship between landscape pattern and species diversity of urban forest remains largely open to debate. Systematic studies on woody plant species diversity and its relationship with landscape patterns are urgently needed to maintain urban biodiversity and support landscape-scale conservation planning.
The aims of this study are to ascertain the woody plant diversity dissimilarity among different administrative districts, to explore the connections between woody plant diversity characteristics and forest landscape patterns, and to supply constructive recommendations to improve the woody plant diversity and stability of urban forest ecosystems.
2. Methods
2.1. Study Area
This study area was located within the ring expressway of Changchun, Jilin Province, China. The study area was 524 km2 (125°07′–125°26′ E, 43°44′–44°02′ N) and had a population of 3.63 × 10⁶. There were eight administrative districts in the study area. They were as follows: Kuancheng district (KC); Lvyuan district (LY); Nanguan district (NG); Chaoyang district (CY); Erdao district (ED); Jingkai district (JK); Changchun New district (CCN); and Qikai district (QK), respectively. The city of Changchun was located in the hinterland of the Great Plains in Northeast China, with an average annual temperature of 4.8 °C and an average annual precipitation of 567 mm. The main woody plant species in urban forests include coniferous species, such as Pinus sylvestris var. mongolica Litv., Pinus tabuliformis var. mukdensis (Uyeki ex Nakai) Uyeki, Picea koraiensis Nakai, Pinus koraiensis Siebold et Zuccarini, and Abies nephrolepis (Trautv.) Maxim, as well as broad-leaved species, such as Quercus mongolica Fischer ex Ledebour, Catalpa ovata G. Don, Populus × canadensis Moench, Armeniaca sibirica (L.) Lam., Padus avium Miller, etc.
2.2. Plot Selection and Investigation
In this study, stratified random sampling method was used to determine and allocate the number of sample plots. The number of sample plots in the Kuancheng district (KC); Lvyuan district (LY); Nanguan district (NG); Chaoyang district (CY); Erdao district (ED); Jingkai district (JK); Changchun New district (CCN); and Qikai district (QK) were 53, 30, 16, 54, 36, 53, 51, and 38, respectively (Figure 1). The size of each plot was 20 m × 20 m, and the species’ names of woody plants and the number of each species in each plot were recorded.
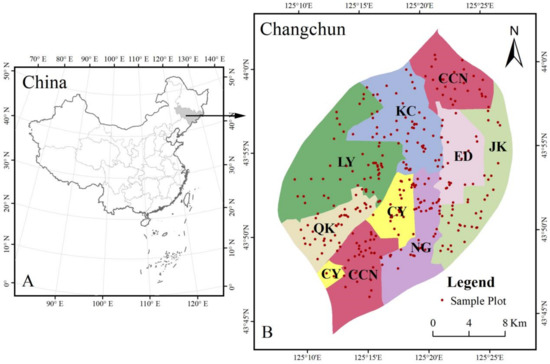
Figure 1.
(A) Map of China; the Jilin province is indicated in grey color. (B) Study area and sample plots distribution in Changchun. KC, Kuancheng district; LY, Lvyuan district; NG, Nanguan district; CY, Chaoyang district; ED, Erdao district; JK, Jingkai district; CCN, Changchun New district; QK, Qikai district.
Species Diversity Indices and Important Value (IV) Calculation
These indices included species important value (IV) (Equation (1)), Margalef richness index (dMa) (Equation (2)), Shannon—Wiener index (H′) (Equation (3)), and Pielou index (J) (Equation (4)). The calculation formula of each index was as follows.
where S was the number of species in each plot; N was the total number of individuals; RAi represented the relative abundance of the ith species; RDi represented the relative significance of the ith species; and RFQi represented the relative frequency of the ith species.
2.3. Landscape Pattern Indices Selection and Calculation
Compared with natural forests, urban forests were in an artificial environment and more affected by human actions. In this study, a total of nine landscape pattern indices were selected, including Total Area (TA), Patch Density (PD), Largest Patch Index (LPI), Mean Shape Index (LSI), Contiguity Index Distribution (CONTIG-MN), Perimeter-Area Fractal Dimension Index (PAFRAC), Landscape Division Index (DIVISION), Patch Cohesion Index (COHESION), PLADJ (Percentage of Like Adjacencies), and Aggregation Index (AI). In this study, the landscape indices of the overall landscape patches in different administrative districts and the landscape indices of each sampling point were calculated, respectively, in which the landscape indices of each sampling point was set to 100 m buffer. The landscape indices were calculated by Fragstates 4.1 and the formula is shown in Appendix A Table A1.
2.4. Data Analysis
Principal component analysis (PCA) was used to reduce the dimension of species composition in different administrative districts with Canoco 5.0 (Centre for Biometry, Wageningen, The Netherlands). Species richness was log-transformed prior to principal component analysis. SIMPER analysis was used to assess species dissimilarity between different administrative districts using PRIMER version 5.0 (Primer-E Ltd., Roborough, UK).
Differences in diversity attributes across administrative districts were examined by a one-way analysis of variance and followed by multiple comparison tests. When variances were homogeneous, we used Tukey tests; otherwise, Games–Howell tests were used. Cluster similarity analysis was performed on species among different administrative districts using R, and correlations between different diversity indices and landscape patterns were obtained by linear regression using R.
3. Results and Discussion
3.1. Species Composition and Important Values in Different Administrative Districts
As shown in Table 1, a total of 88 species of common woody plants were investigated in this study area, belonging to 50 genera, and 24 families, with a total of 7778 plants. Among them, 66 arbors species belonged to 37 genera and 20 families, and 22 shrub species belonged to 14 genera and 8 families. There were 15 conifer species and 51 broad-leaved species. There were 80 native species with a total of 7183 plants, accounting for 92.35% of the total number of plants, and only eight alien species, accounting for 7.65% of the total number of plants.

Table 1.
Species classification of urban forest in different administrative districts.
Among different administrative districts, the CCN district had the largest number of plants with a total of 1611 plants; the ED district had the least number of plants, with only 340 plants. The administrative district with the greatest species richness was the QK district with a total of 60 species, while the administrative district with the smallest species richness was the ED district, with only 26 species. The importance values of Picea asperata, Pinus tabuliformis var. mukdensis (Uyeki ex Nakai) Uyeki, and Pop dav were all in the top five in different administrative districts, and they were the main common species.
3.2. Spatial Pattern of Species Diversity Attributes in Different Administrative Districts
The spatial distribution characteristics of woody plant species richness index, diversity index, evenness index, and the percentage of alien species in Changchun were analyzed (Figure 2). The results showed that the grids with the highest richness index (dMa = 1.80~3.56) were mainly distributed in the southwest region of Changchun, and the species richness in the northern, eastern, and central regions was relatively poor. The higher values of the Shannon–Wiener index (H′ = 1.22~2.18) were mainly distributed in the southwest and northern regions of the urban areas, and those between the fourth and fifth rings were relatively low. However, evenness index J′ (J′ = 0.79~1) had larger values in more grids, indicating that the evenness of urban forest species in Changchun is relatively good. The alien species were mainly distributed in parts of the eastern and central regions, but were fewer in the western and northern regions.
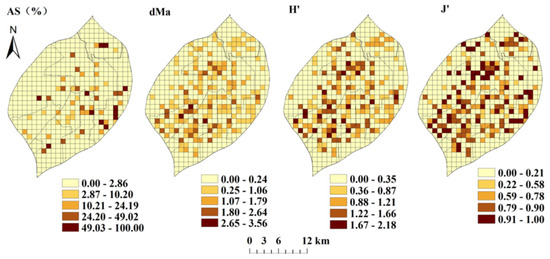
Figure 2.
Spatial distribution of alien species, dMa, H′, and J at 1 km net level.
Analysis of species diversity attributes showed that there were significant differences in dMa, H′, J, and SR across different administrative districts (Figure 2). The dMa in the QK district was significantly higher than in the JK, LY, NG, and ED districts (p < 0.05). The Shannon–Wiener index H′ in the QK district was significantly higher than in the LY, NG, and ED districts (p < 0.05). The evenness index J in the QK district also was significantly higher than in the NG and ED districts (p < 0.05). The species richness SR in the ED, JK, LY, and NG districts was significantly lower than that in QK district (p < 0.05). In general, the dMa, H′, J, and SR in the QK, KC and CY districts performed better, while performing poorly in the NG and ED districts (Table 2).
Table 2.
Species diversity indices among different administrative districts.
3.3. PCA and Dissimilarity Analysis of Species Composition in Different Administrative Districts
The PCA results showed that the first and second axes accounted for 52.62% of the total variances (Figure 3). The woody plant species distribution was highly heterogeneous among different administrative districts, and more species dwelt in the QK, CCN, LY, KC, and NG districts than in JK, LY, and ED districts. (Figure 3). The QK district had the highest species richness with 61 species, followed by the CCN, LY, and KC districts with 58, 58, and 57 species, respectively. Moreover, the ED district had the lowest species richness with only 30 species. Among the 50% best fitted species (Figure 3), the richness of Sal Mat, Pad Rac, Sal Bab, Arm Man, Pop Dav, Ace Neg, Amy Day, and Cat Ova in KC district were higher than those in other districts. The richness of Ulm Pum, Pic Asp, Pru Uss, Alb Kal, Que Mon, Pyr Uss, Pru Cer, Lig Qui, Swi Alb, Pop Alb, Pin Syl, Fra Rhy, Pin Kor, Mal Pum, Ace Bue, Ulm Pum, Jap Map, Syr Pub, Syr Vil, and Car Arb were the highest in the CCN district. The richness of Gle Sin, Tax Chi, Amo cru, Lar Olg, Sab chi, Pin Syl Sl, and Ace Tru were higher in the CY district than in other districts (Figure 3). Moreover, the richness of Pop Max in the ED district is higher than in other districts (Figure 3).
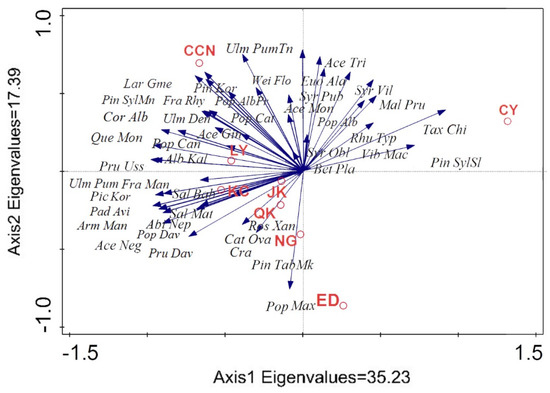
Figure 3.
PCA showing richness and distribution of the about 50% best fitted species among different administrative districts. Refer to Appendix B Table A2 for the abbreviated species names.
The SIMPER analysis among different administrative districts showed that species distribution in the CY district had higher dissimilarity with other districts, with the value basically close to or above 60%, and its clustering distance was the biggest compared to other districts. Among them, the species in CY district had the highest dissimilarity with ED district, with a dissimilarity ratio of 73%. Sal mat, Tax chi, Pop max, Mal pru, Pop dav, and Amy dav contributed to about 23% of this result. Except for the CY district, species dissimilarities between all other districts were lower than 45%. The species dissimilarity between the JK and CCN districts was the lowest, only about 29.17% (Figure 4), and that between the CCN and LY districts was also lower with the value of 29.67%. Among them, the CCN and JK districts were both newly built urban districts, and the species, such as Fra man, Pru tri, Lon maa, Fra rhy, and Ulm den, contributed greatly to this result.
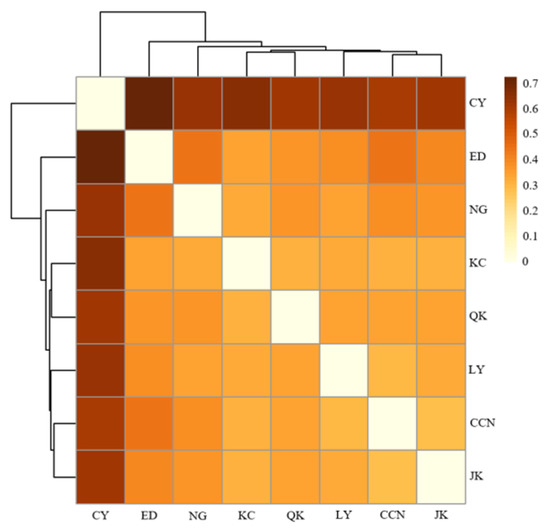
Figure 4.
Analysis of species dissimilarity in different districts.
3.4. Characteristics of Urban Forest Landscape Pattern in Different Administrative Districts
As shown in Figure 5, the landscape TA of the LY district was the largest among the eight administrative districts, which had reached 1970.4784 hm2 and more than twice the landscape area of the ED district. Except for the ED district and CY district, the landscape area of the other administrative districts exceeded 1000 hm2. The CY district was 813.8184 hm2, and the ED district had the smallest urban forest landscape area with the value of 787.2708 hm2.
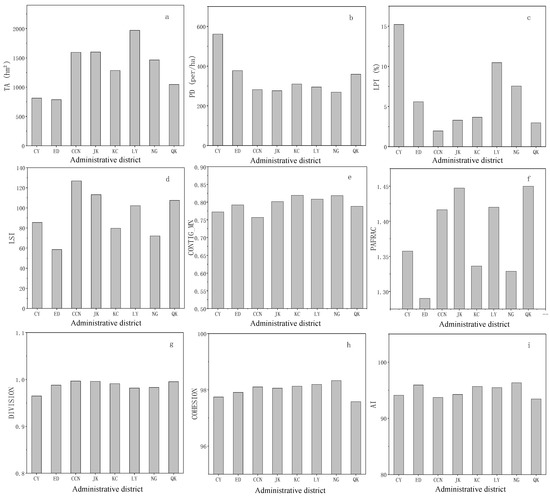
Figure 5.
Landscape indices of different administrative districts in Changchun. (a) Total Area (TA) of different districts, (b) Patch Density (PD) of different districts, (c) Largest Patch Index (LPI) of different districts, (d) Mean Shape Index (LSI) of different districts, (e) Contiguity Index Distribution (CONTIG-MN) of different districts, (f) Perimeter-Area Fractal Dimension Index (PAFRAC) of different districts, (g) Landscape Division Index (DIVISION) of different districts, (h) Patch Cohesion Index (COHESION) of different districts, (i) and Aggregation Index (AI) of different districts.
Although the urban forest landscape TA in the CY district was relatively low, ranked second from the bottom among the eight administrative districts, the patch index was second from the top with as many as 4570 pieces. The CY district had the highest PD and LPI, and its TA was also far more than other administrative districts. But the DIVISION was the lowest in the CY district, which indicated that the urban forest in the CY district was composed of large patches and many broken small patches. In terms of the complexity of the patch shape, the CCN district had an LSI higher than the other administrative districts, but its PAFRAC and CONTIG_MN were lower than the others, which indicated that the shape of the forest landscape in the CCN district was more complex and diverse. On the other hand, the ED district was contrary to the CCN district; its landscape patches’ shape was simple. In terms of the connectivity index COHENSION and the aggregation index AI of the eight administrative districts, the results of the two indices in the NG district were the highest, but in the QK district were the lowest; the ratio of the LPI in the QK district was also low. These indicated that the overall landscape of the QK district was relatively fragmented. However, the NG district performed well, with higher patch aggregation and integrity.
3.5. Correlation Analysis between Species Diversity Attributes and Landscape Pattern Indices in Different Administrative Districts
According to Figure 6, the species diversity attributes of dMa, H′, and J all associated well with the forest-related landscape indices. After linear regression and curve fitting, it was found that dMa and H′ were negatively correlated with CONTIG-MN. The fitting equations were y = 0.7514x2 − 0.3244 and y = 2.2773 − 1.5236x + 0.7805x2, and the coefficients R2 were 0.029 and 0.027, respectively. While LSI was positively correlated with dMa and H′, the fitting equations were y = 0.6121exp (0.1277x) and y = 0.1358x + 1.2609. R2 were 0.042 and 0.044, respectively. The results showed that complex landscape shapes contributed to the maintenance and enhancement of species diversity. In addition, J was positively correlated with DIVISION, the fitting equation was y = 0.7837 + 0.1335x − 0.4132x2 + 0.3809x3, and the R2 was 0.066, which indicated that when DIVISION was 0, there was only 1 patch. At the same time, J fell while LPI rose, the fitted equation was y = −0.0012x + 0.8835, and the R2 was 0.06.
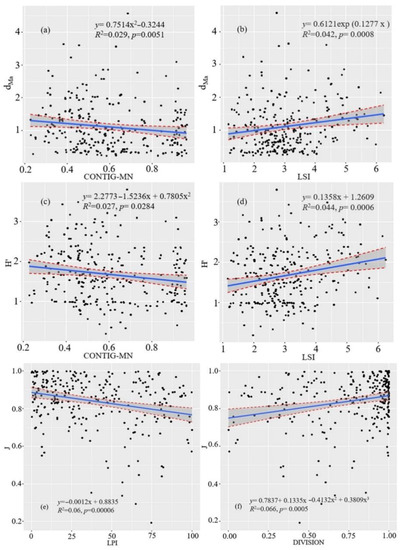
Figure 6.
Correlation between species diversity attributes and landscape pattern indices. (a) correlation between dMa and CONTIG-MN; (b) correlation between dMa and LSI; (c) correlation between H′ and CONTIG-MN; (d) correlation between H′ and LSI; (e) correlation between J and LPI; (f) correlation between J and DIVISION.
4. Discussion
4.1. Species Composition and Diversity in Different Administrative Districts
Climate was an important factor affecting the distribution of species. Species coexistence was inseparable from the support of suitable climate and environment; the tropical regions with warm and humid climates had high species diversity [24,25,26]. In different administrative districts of Changchun, the scope of Shannon–Wiener index was between 1.43 and 0.75, and the scope of Margalef richness index dMa was between 1.34 and 0.75. Compared with many other cities in China, the species diversity was lower in Changchun [13,27,28]. This can be attributed to the regions’ short summers and severe cold winters, which puts significant pressure on the survival of species.
A high species diversity will affect the stability and health of urban forest ecosystems. As early as the last century, Frank Santamour (1990) proposed the 10/20/30 “rule of thumb” for the species ratio of urban forests. The proportion of the most common species in urban forests should not exceed 10% of the abundance of all species, the proportion of species in the most common genera should not exceed 20% of the abundance of all species, and the proportion of species in the most common family should not exceed 30% of the abundance of all species [29]. Such a plant composition ratio not only maintains species diversity, but also effectively prevents large-scale pests and diseases from happening. This rule of thumb has been accepted by many scholars, and has been widely recognized in some cities. Based on the 10/20/30 “rule of thumb”, the ED district exceeded 30%, 20%, and 10% at the levels of families, genera, and species, respectively. The families and species in excess were Salicaceae, Populus, and Salix matsudana Koidz. In the CY district, Pinaceae exceeded 30% at the family level. In the LY district, Populus davidiana Dode exceeded 10% at the species level. However, the newly built CCN districts performed well. Moreover, the ED district had the lowest values of H′, J, and dMa (Figure 7). Salicaceae occupies a dominant position in the species composition of all administrative districts. This should be noted for future species management in the old districts of ED, CY and LY. Previous studies have showed that there were significant differences in species diversity between the new and old urban districts [30,31]. Xiao et al. (2016) found that the Daowai district and Xiangfang district of Harbin, both of which were old urban districts, had low species diversity due to the aggregation of Salicaceae [32]. The main reasons for this difference maybe associated with the social background and economic factors of different districts [19,33,34].
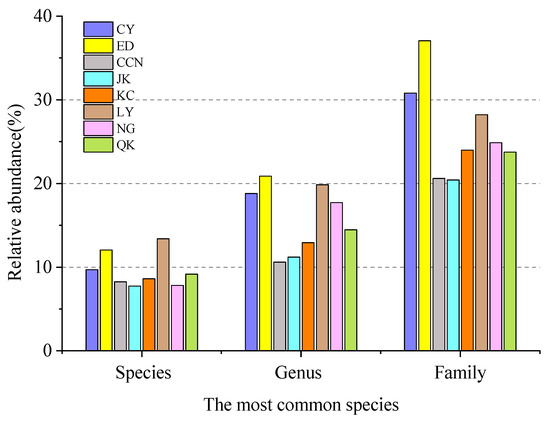
Figure 7.
Proportion of the most common species in different administrative districts.
4.2. Influencing Factors of Species Diversity Characteristics in Different Administrative Districts
There are many factors affecting the species diversity of urban forests in different districts, including the afforestation management policy of each district, intra-community factors, social and economic factors, natural and historical backgrounds, and the forests’ landscape patterns [35,36]. Zhang et al. (2017) showed that woody plant species diversity attributes were significantly correlated with urban forest landscape patterns, and the correlations were affected by urbanization intensity [37]. Research on the Shunyi District of Beijing showed that landscape pattern indices at the landscape level, such as the Shannon–Wiener index, evenness index, edge density, and landscape shape index, were positively associated with plant diversity, while the largest patch index was negatively associated with plant diversity [38]. In this study, it was found that the evenness index J was positively correlated with PAFRAC, and negatively correlated with PLANDJ and AI. The Margalef dominance index dMa was negatively correlated with COHESION (Figure 6), which indicated that the urban forest species evenness can be enhanced by decreasing patch fragmentation or increasing patch aggregation and shape complexity.
Furthermore, a large number of studies have showed that socioeconomic factors have affected species diversity in urban forests [18,36]. In this study, socioeconomic factors, including the gross domestic product of the administrative district, the gross domestic product per capita, the population, the population density, the green area, the ratio of green spaces, and the area of the administrative district were analyzed. The results indicated that there were no significant correlations between these socioeconomic factors and the species diversity attributes.
4.3. Suggestions on the Selection of Urban Forest Species and Landscape Pattern Regulation in Different Administrative Districts of Changchun
Understanding the composition and pattern of woody plant diversity in urban forests is of great significance for urban planners and managers to design and protect urban forests and improve urban environments. According to this study, the ED district, as an administrative district with low species diversity, should reduce the use of Salicaceae and Rosaceae species in the future, and strengthen the use of Tiliaceae and Juglandaceae species, which were the main contributing species that caused the gap between the species diversity in the ED district and other administrative districts (Table 3). The monoculture of Pop dav and Pru uss should be reduced in the LY district, and the application and collocation of species, such as Pin kor and Bet pla, should be strengthened. The CY district should strengthen the selection of Betulaceae and Tiliaceae plants species, and reduce the selection of species of Pinaceae. There are many alien species in the JK district (Figure 2), and the application of native species should be strengthened in future species planning. The extensive use of native tree species will be the main measure to achieve the goal of building a near-natural, structurally stable urban forest.
Table 3.
Proposals for plant changes in different districts.
In addition, this study found significant differences in forest landscape patterns across administrative districts. Diversity was higher when the forest landscape mainly consisted of several large patches. Based on the principle of combining concentration and dispersal [39], the CY, ED, and LY districts should strengthen the establishment of corridors between patches, and enhance the connectivity and integrity of landscape structure, so that the landscape can be separated but not dispersed. The AI and COJESION of the NG and ED districts were higher (Figure 5), and the patch distributions were more concentrated. The CONTIG-MN in the ED, NG, and LY districts was higher and the shape landscape indices were lower, which indicated that the patch edges of the three administrative districts were relatively flat and the similarity was strong, which was also reflected in the species diversity attributes. The dMa and H′ decreased while the CONTIG-MN index rose, and were positively correlated with LSI. The species diversity indices were lower than those in other administrative districts and need to be improved. Complex landscape shapes mean human-induced disturbances are heavier, and complex boundaries and patch shapes can ensure high species diversity and resist external disturbances [40]. The ED, NG, and LY districts performed poorly in terms of species diversity and species evenness. In addition to the effect of landscape shape on species diversity, the larger LPI was one of the reasons for the lower species evenness in the above three districts. In the future, the CY district not only needs to increase the coverage area of green space, but also integrate existing small patches into urban forest patches with a larger unit area through green space. The ED, NG, and LY districts need to improve species diversity and uniformity by controlling the edge shape of landscape patches.
5. Conclusions
There were 88 species of woody plants in 24 families and 50 genera in Changchun urban forest, among which Swi mat, Pop dav, Pinus tabuliformis var. mukdensis (Uyeki ex Nakai) Uyeki and Picea asperata Mast were the dominant species in different administrative districts. Among the eight administrative districts, the QK district and KC district performed better than other districts in terms of species diversity index, and the NG district was the lowest. The main contributing species were Pinus tabuliformis var. mukdensis (Uyeki ex Nakai) Uyeki, Pop can and Swi mat. In terms of species selection, the ED district should reduce the use of Salicaceae and Rosaceae, and increase the selection of Tiliaceae and Juglandaceae. In the LY district, the use of Pop dav and Pru uss should be reduced, and the application and combination of species, such as Pin kor and Bet pla, should be increased. The CY district needs to increase the selection of Betulaceae and Tiliaceae species, and reduce the use of Pinaceae species.
For the regulation of urban forest landscape patterns, the CY, ED, and LY districts should strengthen the establishment of corridors between patches to enhance the connectivity and integrity of landscape structures and integrate the existing dispersed small patches into large urban forest patches to improve species diversity and evenness. At the same time, the ED, NG, and LY districts need to increase the complexity of the landscape shape to enhance species diversity.
Author Contributions
Conceptualization, D.Z.; Formal analysis, Y.C. and Y.F.; Supervision, D.Z.; Writing—original draft preparation, Y.C. and Z.W.; Visualization, Y.C. and Z.W.; Investigation, C.Z., T.W., Y.Y. and J.W.; Writing—review and editing, D.Z. All authors have read and agreed to the published version of the manuscript.
Funding
This work was supported by the Young Scholar Climbing Program of Changchun University (ZKP202015), the Breeding Program of Changchun University (ZKQ201913, ZKC202005) and the Science and Technology Project during the 13th Five-year Plan Period of the Education Department of Jilin Province (JJKH20200559KJ).
Institutional Review Board Statement
Not applicable.
Informed Consent Statement
Not applicable.
Data Availability Statement
Not applicable.
Conflicts of Interest
The authors declare no conflict of interest.
Appendix A
Table A1.
Landscape Pattern Indices.
Table A1.
Landscape Pattern Indices.
| Landscape Index | Formula |
|---|---|
| Landscape Area (TA) | A = Total landscape area (m2); TA > 0; unit, hectare. |
| PD | N = Total number of plaques; PD > 0; unit, per/100 hectare |
| Largest Patch Index (LPI) | |
| Mean Shape Index (LSI) | A = Total landscape area (m2); E = Total landscape edge length |
| CONTIG-MN | cijr = Connectivity value of patch r within patch ij, v = 3 × 3 sum of temporary pixel values, aij = the area of patch ji consisting of a single member of multiple pixels |
| PAFRAC | aij = area of patch ij; pij = perimeter of patch ij; ni = number of plaques |
| DIVISION | aij = Area of patch ij (m2); A = Total landscape area (m2) |
| COHESION | pij = Side length of patch ij within the cell involved, aij = Area of patch ij within the cell involved, Z = The number of units in the landscape. 1 < COHESION < 100 |
| AI | (100) gii = Number of similar adjacent patches for corresponding landscape types |
MN (Mean) equals the sum, across all patches in the landscape, of the corresponding patch metric values, divided by the total number of patches.
Appendix B
Table A2.
Species Latin name and the abbreviation.
Table A2.
Species Latin name and the abbreviation.
| Latin Name | Abbreviation |
|---|---|
| Abies nephrolepis (Trautv.) Maxim | Abi nep |
| Acer tataricum subsp. ginnala (Maxim.) Wesmael | Ace gin |
| Acer pictum subsp. mono (Maxim.) H. Ohashi | Ace mon |
| Acer negundo L. | Ace neg |
| Acer triflorum Kom. | Ace tri |
| Albizia kalkora (Roxb.) Prain | Alb kal |
| Armeniaca mandshurica (Maxim.) Skv. | Arm man |
| Betula platyphylla Suk. | Bet pla |
| Catalpa ovata G. Don | Cat ova |
| Cornus alba L. | Cor alb |
| Crataegus pinnatifida Bge. | Cra |
| Euonymus alatus (Thunb.) Sieb. | Euo ala |
| Fraxinus mandshurica Rupr. | Fra man |
| Fraxinus chinensis subsp. rhynchophylla (Hance) E. Murray | Fra rhy |
| Larix gmelinii (Rupr.) Kuzen. | Lar gme |
| Malus prunifolia (Willd.) Borkh. | Mal pru |
| Padus avium Miller | Pad avi |
| Picea koraiensis Nakai | Pic kor |
| Pinus koraiensis Siebold et Zuccarini | Pin kor |
| Pinus sylvestris L. | Pin syl mon |
| Pinus sylvestris var. sylvestriformis (Takenouchi) Cheng et C.D. Chu | Pin syl syl |
| Pinus tabuliformis Carrière | Pin tab |
| Populus alba L. | Pop alb |
| Populus alba var. pyramidalis Bunge | Pop alb pyr |
| Populus maximowiczii A. Henry | Pop max |
| Populus × canadensis Moench | Pop can |
| Populus ussuriensis Kom. | Pop uss |
| Populus davidiana Dode | Pop dav |
| Prunus davidiana (Carrière) Franch. | Pru dav |
| Prunus triloba (Lindl.) Ricker | Pru tri |
| Prunus ussuriensis Kovalev & Kostina | Pru uss |
| Quercus mongolica Fischer ex Ledebour | Que mon |
| Rhus typhina L. | Rhu typ |
| Rosa xanthina Lindl. | Ros xan |
| Salix babylonica L. | Sal bab |
| Salix matsudana Koidz | Swi mat |
| Syringa oblata Lindl. | Syr obl |
| Syringa pubescens subsp. microphylla (Diels) M. C. Chang & X. L. Chen | Syr pub |
| Syringa villosa Vahl | Syr vil |
| Taxus cuspidata Sieb. et Zucc | Tax chi |
| Ulmus densa Litw. | Ulm den |
| Ulmus pumila L. | Ulm pum |
| Ulmus pumila ‘Tenue’ S.Y.Wang | Ulm pum Ten |
| Viburnum macrocephalum Fort. | Vib mac |
| Weigela florida (Bunge) A. DC. | Wei flo |
References
- Grimm, N.B.; Faeth, S.H.; Golubiewski, N.E.; Redman, C.L.; Wu, J.; Bai, X.; Briggs, J.M. Global change and the ecology of cities. Science 2008, 319, 756–760. [Google Scholar] [CrossRef] [PubMed] [Green Version]
- Güneralp, B.; Seto, K.C. Futures of global urban expansion: Uncertainties and implications for biodiversity conservation. Environ. Res. Lett. 2013, 8, 014025. [Google Scholar] [CrossRef]
- Seto, K.C.; Güneralp, B.; Hutyra, L.R. Global forecasts of urban expansion to 2030 and direct impacts on biodiversity and carbon pools. Proc. Natl. Acad. Sci. USA 2012, 109, 16083–16088. [Google Scholar] [CrossRef] [PubMed] [Green Version]
- Shwartz, A.; Turbé, A.; Simon, L.; Julliard, R. Enhancing urban biodiversity and its influence on city-dwellers: An experiment. Biol. Conserv. 2014, 171, 82–90. [Google Scholar] [CrossRef]
- Botzat, A.; Fischer, L.K.; Kowarik, I. Unexploited opportunities in understanding liveable and biodiverse cities. A review on urban biodiversity perception and valuation. Global Environ. Chang. 2016, 39, 220–233. [Google Scholar] [CrossRef]
- Wu, J.; Jenerette, G.D.; Buyantuyev, A.; Redman, C.L. Quantifying spatiotemporal patterns of urbanization: The case of the two fastest growing metropolitan regions in the United States. Ecol. Complex. 2011, 8, 1–8. [Google Scholar] [CrossRef]
- Li-Xia, Z.; Feng, Z.; Tie-Liang, S. Vegetation diversity of Luya Mountains. Biodiv. Sci. 2000, 8, 361. [Google Scholar] [CrossRef]
- Morgenroth, J.; Östberg, J.; van den Bosch, C.K.; Nielsen, A.B.; Hauer, R.; Sjöman, H.; Chen, W.; Jansson, M. Urban tree diversity—Taking stock and looking ahead. Urban. For. Urban. Gree. 2016, 15, 1–5. [Google Scholar] [CrossRef] [Green Version]
- Jim, C.Y.; Liu, H.T. Species diversity of three major urban forest types in Guangzhou City, China. Forest Ecol. Manag. 2001, 146, 99–114. [Google Scholar] [CrossRef]
- Goddard, M.A.; Dougill, A.J.; Benton, T.G. Scaling up from gardens: Biodiversity conservation in urban environments. Trends Ecol. Evol. 2010, 25, 90–98. [Google Scholar] [CrossRef]
- Burton, M.L.; Samuelson, L.J.; Mackenzie, M.D. Riparian woody plant traits across an urban–rural land use gradient and implications for watershed function with urbanization. Landscape Urban Plan. 2009, 90, 42–55. [Google Scholar] [CrossRef]
- Ranta, P.; Viljanen, V. Vascular plants along an urban-rural gradient in the city of Tampere, Finland. Urban Ecosyst. 2011, 14, 361–376. [Google Scholar] [CrossRef]
- Xu, K.; Wu, Z.; Chen, J. Comparison of species diversity of different urban forest types in Hefei City. J. Northeast Agric. Univ. 2010, 38, 26–30. [Google Scholar]
- Lin, L.P.; Tian, D.L.; Yan, W.D.; Liu, Q.; Guo, Y.; Zhu, J. Study on species diversity of three different forest types of karst vegetation in Guiyang. J. Cent. South Univ. T. 2011, 31, 127–134. [Google Scholar]
- Walker, J.S.; Grimm, N.B.; Briggs, J.M.; Gries, C.; Dugan, L. Effects of urbanization on plant species diversity in central Arizona. Front. Ecol. Environ. 2009, 7, 465–470. [Google Scholar] [CrossRef]
- Conway, T.M.; Urbani, L. Variations in municipal urban forestry policies: A case study of Toronto, Canada. Urban For Urban Gree. 2007, 6, 181–192. [Google Scholar] [CrossRef]
- Luck, G.W.; Smallbone, L.T.; O’Brien, R. Socio-economics and vegetation change in urban ecosystems: Patterns in space and time. Ecosystems 2009, 12, 604–620. [Google Scholar] [CrossRef]
- He, Y.J. Socioeconomic Factors and Green Space Management Influence Plant Diversity Pattern along Urban-Rural Gradient in Shanghai, China. Master’s Thesis, East China Normal University, Shanghai, China, 2015. [Google Scholar]
- Hope, D.; Gries, C.; Zhu, W.; Fagan, W.F.; Redman, C.L.; Grimm, N.B.; Nelson, A.L.; Martin, C.; Kinzig, A. Socioeconomics drive urban plant diversity. Proc. Natl. Acad. Sci. USA 2003, 100, 8788–8792. [Google Scholar] [CrossRef] [Green Version]
- Martin, C.A.; Warren, P.S.; Kinzig, A.P. Neighborhood socioeconomic status is a useful predictor of perennial landscape vegetation in residential neighborhoods and embedded small parks of Phoenix, AZ. Landscape Urban Plan. 2004, 69, 355–368. [Google Scholar] [CrossRef]
- Kirkpatrick, J.B.; Daniels, G.D.; Zagorski, T. Explaining variation in front gardens between suburbs of Hobart, Tasmania, Australia. Landscape Urban Plan. 2007, 79, 314–322. [Google Scholar] [CrossRef]
- McKinney, M.L. Urbanization, Biodiversity, and Conservation The impacts of urbanization on native species are poorly studied, but educating a highly urbanized human population about these impacts can greatly improve species conservation in all ecosystems. Bioscience 2002, 52, 883–890. [Google Scholar] [CrossRef]
- FAN, M.; PENG, Y.; WANG, Q.; MI, K.; QING, F. Correlations between landscape pattern and plant diversity at multiple spatial scales: A case study of Hunshandak Sandland. Acta Ecol. Sin. 2018, 7, 22. [Google Scholar]
- Zhu, F.T.; Liao, X.R. The formation mechanism of the latitudinal gradient distribution pattern of species diversity. Sci. Technol. Inf. 2009, 118, 214–215. [Google Scholar]
- Feng, J.; Dong, X.; Xu, C.; Zha, F. Effects of sampling scale on latitudinal patterns of species diversity in seed plants in northwestern Yunnan, China. Biodiv. Sci. 2009, 17, 266. [Google Scholar]
- He, J.S.; Chen, W.L. A REVIEW of gradirnt changes in species diversity of land plant communities. Acta Ecol. Sin. 1997, 17, 92–99. [Google Scholar]
- Ma, J.; Jia, B.; Zhang, W.; Liu, X.; Li, X.; Liu, J. The characteristics of urban forest structure within the Sixth Ring Road of Beijing. Chin. J. Ecol. 2019, 38, 2318–2325. [Google Scholar]
- Zhai, S.; Chen, B.; Lin, N.; Shi, X.; Pan, Y.; Zou, Z. Structure and species diversity of typical forests in Guangzhou City. Ecol. Environ. Sci. 2015, 24, 1625–1633. [Google Scholar]
- Santamour, F.S. Trees for urban planting: Diversity, uniformity, and common sense. In 504 Proceedings of the Seventh Conference of the Metropolitan Tree Improvement Alliance 505. METRIA 1990, 7, 57–65. [Google Scholar]
- Jim, C.Y.; Zhang, H. Species diversity and spatial differentiation of old-valuable trees in urban Hong Kong. Urban For. Urban Gree. 2013, 12, 171–182. [Google Scholar] [CrossRef]
- Gopal, D.; von der Lippe, M.; Kowarik, I. Sacred sites, biodiversity and urbanization in an Indian megacity. Urban Ecosyst. 2019, 22, 161–172. [Google Scholar] [CrossRef]
- Xiao, L.; Wang, W.; Zhang, D.; He, X.; Wei, C.; Lv, H.; Zhou, W.; Zhang, B. Urban forest tree species composition and arrangement reasonability in Harbin, northeast China. Chin. J. Ecol. 2016, 35, 2074–2081. [Google Scholar]
- Kinzig, A.P.; Warren, P.; Martin, C.; Hope, D.; Katti, M. The effects of human socioeconomic status and cultural characteristics on urban patterns of biodiversity. Ecol. Soc. 2005, 10, 1. [Google Scholar] [CrossRef] [Green Version]
- Smith, R.M.; Thompson, K.; Hodgson, J.G.; Warren, P.H.; Gaston, K.J. Urban domestic gardens (IX): Composition and richness of the vascular plant flora, and implications for native biodiversity. Biol. Conserv. 2006, 129, 312–322. [Google Scholar] [CrossRef]
- DeCandido, R.; Calvanese, N.; Alvarez, R.V.; Brown, M.I.; Nelson, T.M. The naturally occurring historical and extant flora of Central Park, New York City, New York 1857–2007. J. Torrey Bot. Soc. 2007, 134, 552–569. [Google Scholar] [CrossRef]
- Li, X.; Jia, B.; Zhang, W.; Ma, J.; Liu, X. Woody plant diversity spatial patterns and the effects of urbanization in Beijing, China. Urban For. Urban Gree. 2020, 56, 126873. [Google Scholar] [CrossRef]
- Zhang, D.; Wang, W.; Zheng, H.; Ren, Z.; Zhai, C.; Tang, Z.; Shen, G.; He, X. Effects of urbanization intensity on forest structural-taxonomic attributes, landscape patterns and their associations in Changchun, Northeast China: Implications for urban green infrastructure planning. Ecol. Indic. 2017, 80, 286–296. [Google Scholar] [CrossRef]
- Peng, Y.; Mi, K.; Wang, H.; Liu, Z.; Lin, Y.; Sang, W.; Cui, Q. Most suitable landscape patterns to preserve indigenous plant diversity affected by increasing urbanization: A case study of Shunyi District of Beijing, China. Urban For. Urban Gree 2019, 38, 33–41. [Google Scholar] [CrossRef]
- Zhao, Q.; Zheng, G.Q.; Huang, Q.H. Characteristics of Urban Forest Landscape Pattern and Optimization of Urban Forest Spatial Structure: A Case Study of Nanjing City. Acta Geograph. Sin. 2007, 62, 870–878. [Google Scholar]
- Peng, Y.; Wang, W.T.; Lu, Y.T.; Dong, J.H.; Zhou, Y.Q.; Shang, J.X.; Li, X.; Mi, K. Multiscale influences of urbanized landscape metrics on the diversity of indigenous plant species: A case study in Shunyi District of Beijing, China. J. Appl. Ecol. 2020, 31, 4058–4066. [Google Scholar]
Publisher’s Note: MDPI stays neutral with regard to jurisdictional claims in published maps and institutional affiliations. |
© 2022 by the authors. Licensee MDPI, Basel, Switzerland. This article is an open access article distributed under the terms and conditions of the Creative Commons Attribution (CC BY) license (https://creativecommons.org/licenses/by/4.0/).