Article

Exploring Transiency in Four Urban Forest Patch Neighborhoods: Atlanta, Georgia, USA

by
Cassandra Johnson Gaither
1,*,
Denzell A. Cross
2 and
G. Rebecca Dobbs
3
1
United States Department of Agriculture, Forest Service, Southern Research Station, Athens, GA 30602, USA
2
Odum School of Ecology, University of Georgia, Athens, GA 30602, USA
3
Oak Ridge Institute for Science and Education, Athens, GA 30602, USA
*
Author to whom correspondence should be addressed.
Sustainability 2022, 14(12), 7220; https://doi.org/10.3390/su14127220
Submission received: 1 April 2022 / Revised: 24 May 2022 / Accepted: 27 May 2022 / Published: 13 June 2022
(This article belongs to the Special Issue Urban Forests and Sustainable Urban Residents’ Well-Being)

Abstract

:
This exploratory study begins to unpack the association between involuntary neighborhood transiency (i.e., forced household moves) and civic environmental stewardship, focusing on four neighborhoods adjacent to urban forest patches in the City of Atlanta, Georgia, USA. The patches emerged on the sites of former public housing communities after the city razed housing projects in the first decade of the 2000s. Given intense competition for city land, e.g., affordable housing needs versus greenspace preservation, we might expect neighborhood-level inquiry regarding plans for these properties; however, there is no indication of popular interest in the sites. We suggest that such engagement is inhibited, in part, by involuntary neighborhood transiency as the neighborhoods surrounding the patches are inhabited mostly by low-income African American renters, a highly transient population. This is the first phase of a study that will eventually examine the association between transiency and greenspace civic engagement. In this exploratory step, we examine involuntary neighborhood transiency as an a priori social condition that necessarily influences people’s engagement with urban greenspaces. Building on input from community members, research by Stephanie DeLuca and colleagues, and Matthew Desmond’s work on evictions in Milwaukee, Wisconsin, we operationalize transiency in terms of Housing Choice Voucher units and eviction rate to assess the extent to which these indicators localize in the four urban patch neighborhoods. A geospatial cluster analysis indicated that both measures concentrate in the neighborhoods adjacent to the forest patches, and they are positively associated. Given these associations, we recommend further research examining how various forms of involuntary moving may ultimately inhibit civic environmental stewardship.

1. Introduction

This study addresses the larger backdrop of challenges and constraints impacting lower-income, predominantly African American communities in the City of Atlanta, Georgia, USA. The focus is on involuntary neighborhood transiency (hereafter, “transiency”) in communities adjacent to four urban forest patches in southeast Atlanta, where transiency is defined as higher-than-average rates of household moves by renter households. We posit that greenspace civic engagement, that is, neighborhood-level care and concern for nearby nature, may be constrained by frequent moves, especially when these moves are compelled rather than planned.
Forest patches are a common feature in the City of Atlanta, which has a canopy cover of 47.9%, the highest extent of any city in the United States (US) that has conducted a canopy study [1]. However, patches on the sites of four former public housing project communities in southeast Atlanta—Thomasville Heights, Leila Valley, Jonesboro North, and Jonesboro South—are inadvertent, anticipated by neither the city’s quasi-governmental housing authority, Atlanta Housing, which owns the properties, nor residents who live adjacent to the sites. Although Atlanta has a self-acknowledged, affordable housing crisis, only recently has the city indicated that any of these vacant properties are slated for eventual residential development (Thomasville Heights) [2]. The conversion of the sites from built structure to natural area may be attributed to what Atlanta Housing referred to at one point as “limited market potential” in the overwhelmingly African American and low-wealth areas of the city where the old projects are located [3] (p. 30). This lag created an unintentional vegetation redux on the properties as the patches emerged gradually over the space of a decade or more. The sites now contain an arguably benevolent nature that has supplanted not just built structures but, crucially, social pathologies (that can be attributed in large part to disinvestment and neglect), as this relates to the violent drug culture that overwhelmed many of Atlanta’s public housing communities in the 1980s and 1990s [4,5]. This reformation is a juxtaposition and irony that reflect the dynamism of socioecological processes in urban spaces.
While this accidental ecology is likely providing measurable ecosystem services (Appendix A contains results of I-tree Hydro simulations showing that vegetation on all four sites mitigates stormwater runoff and pollutant off-loading), the future provision of these benefits is less certain because there is no apparent citizen advocacy or recognition of the sites as ecologically beneficial [6]. We suggest that this vocalization may be hampered by transiency, an unrecognized factor limiting collective action by residents in neighborhoods adjoining or nearby the former public housing communities. We do not examine the association between transiency and greenspace civic engagement but focus rather on the existing social milieu in which such engagement occurs. This is similar to what Lindsay et al. [7] refer to as an “intersectional or cross-sectoral” approach that considers problems affecting the broader community when urban greening projects are introduced. In our case, we focus singularly on transiency in nearby neighborhoods. As a manifestation of housing instability, we suggest that transiency is an overlooked yet crucial influence in efforts to effect environmental equity.

2. Literature Review

2.1. Greenspace Civic Activism

The scholarship on urban greenspace civic activism and civic ecology discusses urban nature in terms of socio-ecological outcomes, necessarily involving participation by community members [8]. Examples abound of such collective action, and not only of engagement by well-heeled White people in the Global North but also by inhabitants of poor, working-, and middle-class communities of color around the world [6,8,9]. Describing efforts to reforest Detroit, Salminen Witt et al. [10] (p. 213) observe: “urban nature’s social-ecological benefits do not accrue on their own… whether community gardens, or greenways, a wildflower meadow or a grassy field… [any of these] must be recognized, valued, experienced, and attended to by people who live nearby” (emphasis added). Successful civic environmental stewardship presupposes a dedicated and semi-permanent cadre of stewards in situ to advocate for and shepherd projects. Certainly, key to such networks is the presence of human beings in a place sufficiently long to bring about the “stabilization of a heterogeneous collective” [6] (p. 4). Arguably, the most successful outcomes for urban green space preservation or restoration involve scenarios where human advocates know that place, in both physical and metaphorical terms. For that perception to occur, people must be in place long enough for familiarity with both the human and non-human components of place to develop.
When people move in and out of places more often than average, they cannot form bonds with their human neighbors, which is the basis for local-level collective consciousness and social integration, prerequisites for meaningful collective action [11]. Housing instability, whether in the form of foreclosures of owned property or removals from rental properties, has wide-reaching negative impacts on people’s social and emotional well-being, for instance, exacerbating mental health challenges, detracting from children’s academic performance, and heightening the chances of job loss [12,13]. Frequent moving also diminishes human awareness of and interaction with local biota and concern for the same.

2.2. Public Housing Projects and Adjacent Neighborhoods

Atlanta won the 1996 Summer Olympics bid, which boosted its efforts to become a world-class city; but city officials had to contend with the stubborn reality of a still racially segregated and economically bifurcated city, where, in 1990, roughly 87% of those below the poverty line were African American, compared to just 11% of Whites [14]. Like the current scenario (See Figure 4 in Results section for a contemporary display of percent African American by Census tract in Atlanta), high-poverty neighborhoods in the 1990s concentrated almost exclusively on the city’s south side. These included housing project communities that coincided with the Olympic Ring Boundary, where competitions would be held, and the Olympic Village constructed [15]. To make way for the Olympic Village, two of the city’s oldest public housing projects, Techwood Homes and Clark Howell Homes, were demolished. This instigated a more comprehensive plan to raze and replace all the city’s public housing projects, with the goal of deconcentrating poverty [16].
Several of these reimagined housing project communities, such as the Villages of East Lake Meadows and downtown’s Centennial Place, are hailed as post-project success stories, although not without controversy [5,17]. We selected neighborhoods surrounding the former Thomasville Heights, Leila Valley, Jonesboro North, and Jonesboro South as study sites because all are located within a two-to-three-mile radius and are impacted by similar landscape changes and socio-ecological conditions. The neighborhoods are in southeast Atlanta within the South River watershed, a sub-basin of the Ocmulgee River Basin (Figure 1).
All four housing project communities were constructed in the late-1960s to early 1970s. A 1971 article in the city’s newspaper The Atlanta Constitution stresses that, at the time, southeast Atlanta (including our study area) had two-and-a-half times the number of public housing projects as all the other quadrants in the city combined [18]. (See Figure 2 for community life depiction at Thomasville projects in the early 1980s). The disproportionate siting of public housing in this part of the city aggravated the city’s racial bifurcation by concentrating poverty within these geographically delineated public housing communities. This catalyzed first White and eventually Black working- and middle-class flight from neighborhoods near the projects in the ensuing decades. Exiting homeowners in communities similar to our study area left behind a supply of single-family homes with relatively few family investors [19,20].
Neighborhoods surrounding the old housing project sites are still overwhelmingly African American (93.3%) [21]; Hispanics make up between 4.7% and 7.1% of the population. Median annual household income ranges from $18,668 to $34,511, compared to about $55,000 for the city [21]. Percent of the population in poverty ranges from 28.4% (Leila Valley/Rebel Valley Forest) to 37.6% (Browns Mill Park) to 64.1% (Thomasville Heights). Roughly 60% of all occupied housing units in Browns Mill Park and Leila Valley/Rebel Valley Forest are renter-occupied, and 74% are occupied by renters in Thomasville Heights [21]. These characteristics typify neighborhoods with high transiency rates, both for rental homes with federally subsidized rents and for those with non-subsidized rental units [22,23,24,25].

2.3. Neighborhood Transiency

Neighborhood transiency can result from both voluntary and involuntary household moves. As indicated, neighborhood characteristics would suggest that transiency in our study area is more likely to be a function of involuntary moves, in the form of eviction, housing unit failure, domestic violence, or neighborhood crime/violence, for instance [22]. With respect to eviction, Desmond’s [25] foundational study in Milwaukee, Wisconsin found that the number of evictions for African American women in mostly Black neighborhoods were 2.5 times higher than those of Black men and almost three times the number for White women in majority-White neighborhoods. Desmond [25] (p. 88) likened eviction for Black women to incarceration for Black men in the US, writing that eviction is “a typical but severely consequential occurrence contributing to the reproduction of urban poverty.” Shelton’s [12] analysis of foreclosures and evictions in Lexington, Kentucky also found that both foreclosures and evictions were spatially concentrated in census tracts with higher percentages of poor African American and Hispanic residents.
Atlanta ranked 16th among large American cities in 2016 for the number of evictions (notices) issued (6201) and 38th for (actual) eviction rate (5.12%) [26]. From 2000 to 2016, the city’s eviction rate peaked in 2011 at 8.56%. Notable increases for both number of evictions and eviction rate began in 2006 when the number of evictions increased six times over the prior year’s number. For the ZIP code in which our study communities are located (30,315), the eviction rate was 9% in 2015, which actually exceeded the citywide peak rate for 2000 to 2016 [23]. These numbers take on greater import considering the lack of affordable housing in Atlanta. The number of affordable rental units priced from $500 to $750 monthly decreased by 15.7% from 2010 to 2014, while gross rents increased 54.6% over the same period [19].
Specific kinds of housing subsidies, such as those provided by the federal housing voucher program, may also exacerbate transiency. The 1974 Housing and Community Development Act shifted the federal government’s focus from spatially concentrated and multi-family public housing construction to providing low-income renters with Housing Choice Voucher (HCV) or “Section 8” rent subsidies that could be used to subsidize private market rents [27,28]. Ostensibly, housing vouchers would allow recipients to rent homes in low-poverty neighborhoods, thus breaking apart high-poverty clusters and encouraging residential stability. However, a three-year study of compulsory moves in Baltimore, Maryland and Mobile, Alabama by DeLuca et al. [22] found that receipt of housing vouchers (i.e., HCV or Section 8 housing) contributed to neighborhood instability as it was the second-highest reason reported for involuntary moves by the respondents in that study. This finding is suggestive of the national-level study by Lundberg et al. [28] that found that rent subsidies such as vouchers reduce the probability of evictions by just 1%, compared to an 8% reduction for public housing.
According to DeLuca et al. [22], the receipt of vouchers in Baltimore and Mobile catalyzed unplanned moving for at least two reasons. First, because of the long wait times to receive a voucher and time limits set on finding HCV-approved homes, once a voucher is obtained, the often-unexpected receipt forces recipients to act quickly to find housing before they become ineligible (usually within three months). This pressure creates scenarios where willy-nilly moving is more likely to occur. Secondly, HCV recipients may move more often because they accept substandard housing to continue their participation in the program. One participant in the study reported that she was pressured repeatedly (by the process of finding housing) to accept inferior HCV housing, which subsequently failed inspection. She was forced to move three times in three years. Wang and Walter’s [24] nuanced look at the relationship between HCV household moves also found that African American voucher-holders in Florida were more transient than either non-Hispanic White or Hispanic recipients. More than one-half of Black HCV households had moved after four years, while less than 40% of either non-Hispanic White or Hispanic HCV households had done so.
An important question for our study is whether evictions or other forms of involuntary moves equate to neighborhood transiency to the extent that people actually move away from their current neighborhood. Do exiting householders simply recycle through the same disadvantaged neighborhoods, or do they leave these neighborhoods? Desmond and Shollenberger’s [29] (p. 1763, footnote) Milwaukee data showed that evicted renters landed in neighborhoods with poverty rates 5.4% points higher and crime rates 1.8 points higher than neighborhoods where voluntary movers relocated. Moreover, subsequent analyses suggested “only weak evidence that the distance between movers’ current and previous address was smaller for the involuntarily displaced” after adjusting for large moves made by voluntary movers. Thus, the evicted and others relocating because of factors beyond their control may end up in a place worse off than the one from which they came, and these places could be at some distance from their current locations, albeit in the same kind of distressed environments [23]. Findings from Milwaukee and other cities suggest that renters who are compelled to move do not simply pick back up where they left off two doors down or three streets over but rather that they often move to unfamiliar places where their sense of place and embeddedness are severely compromised.

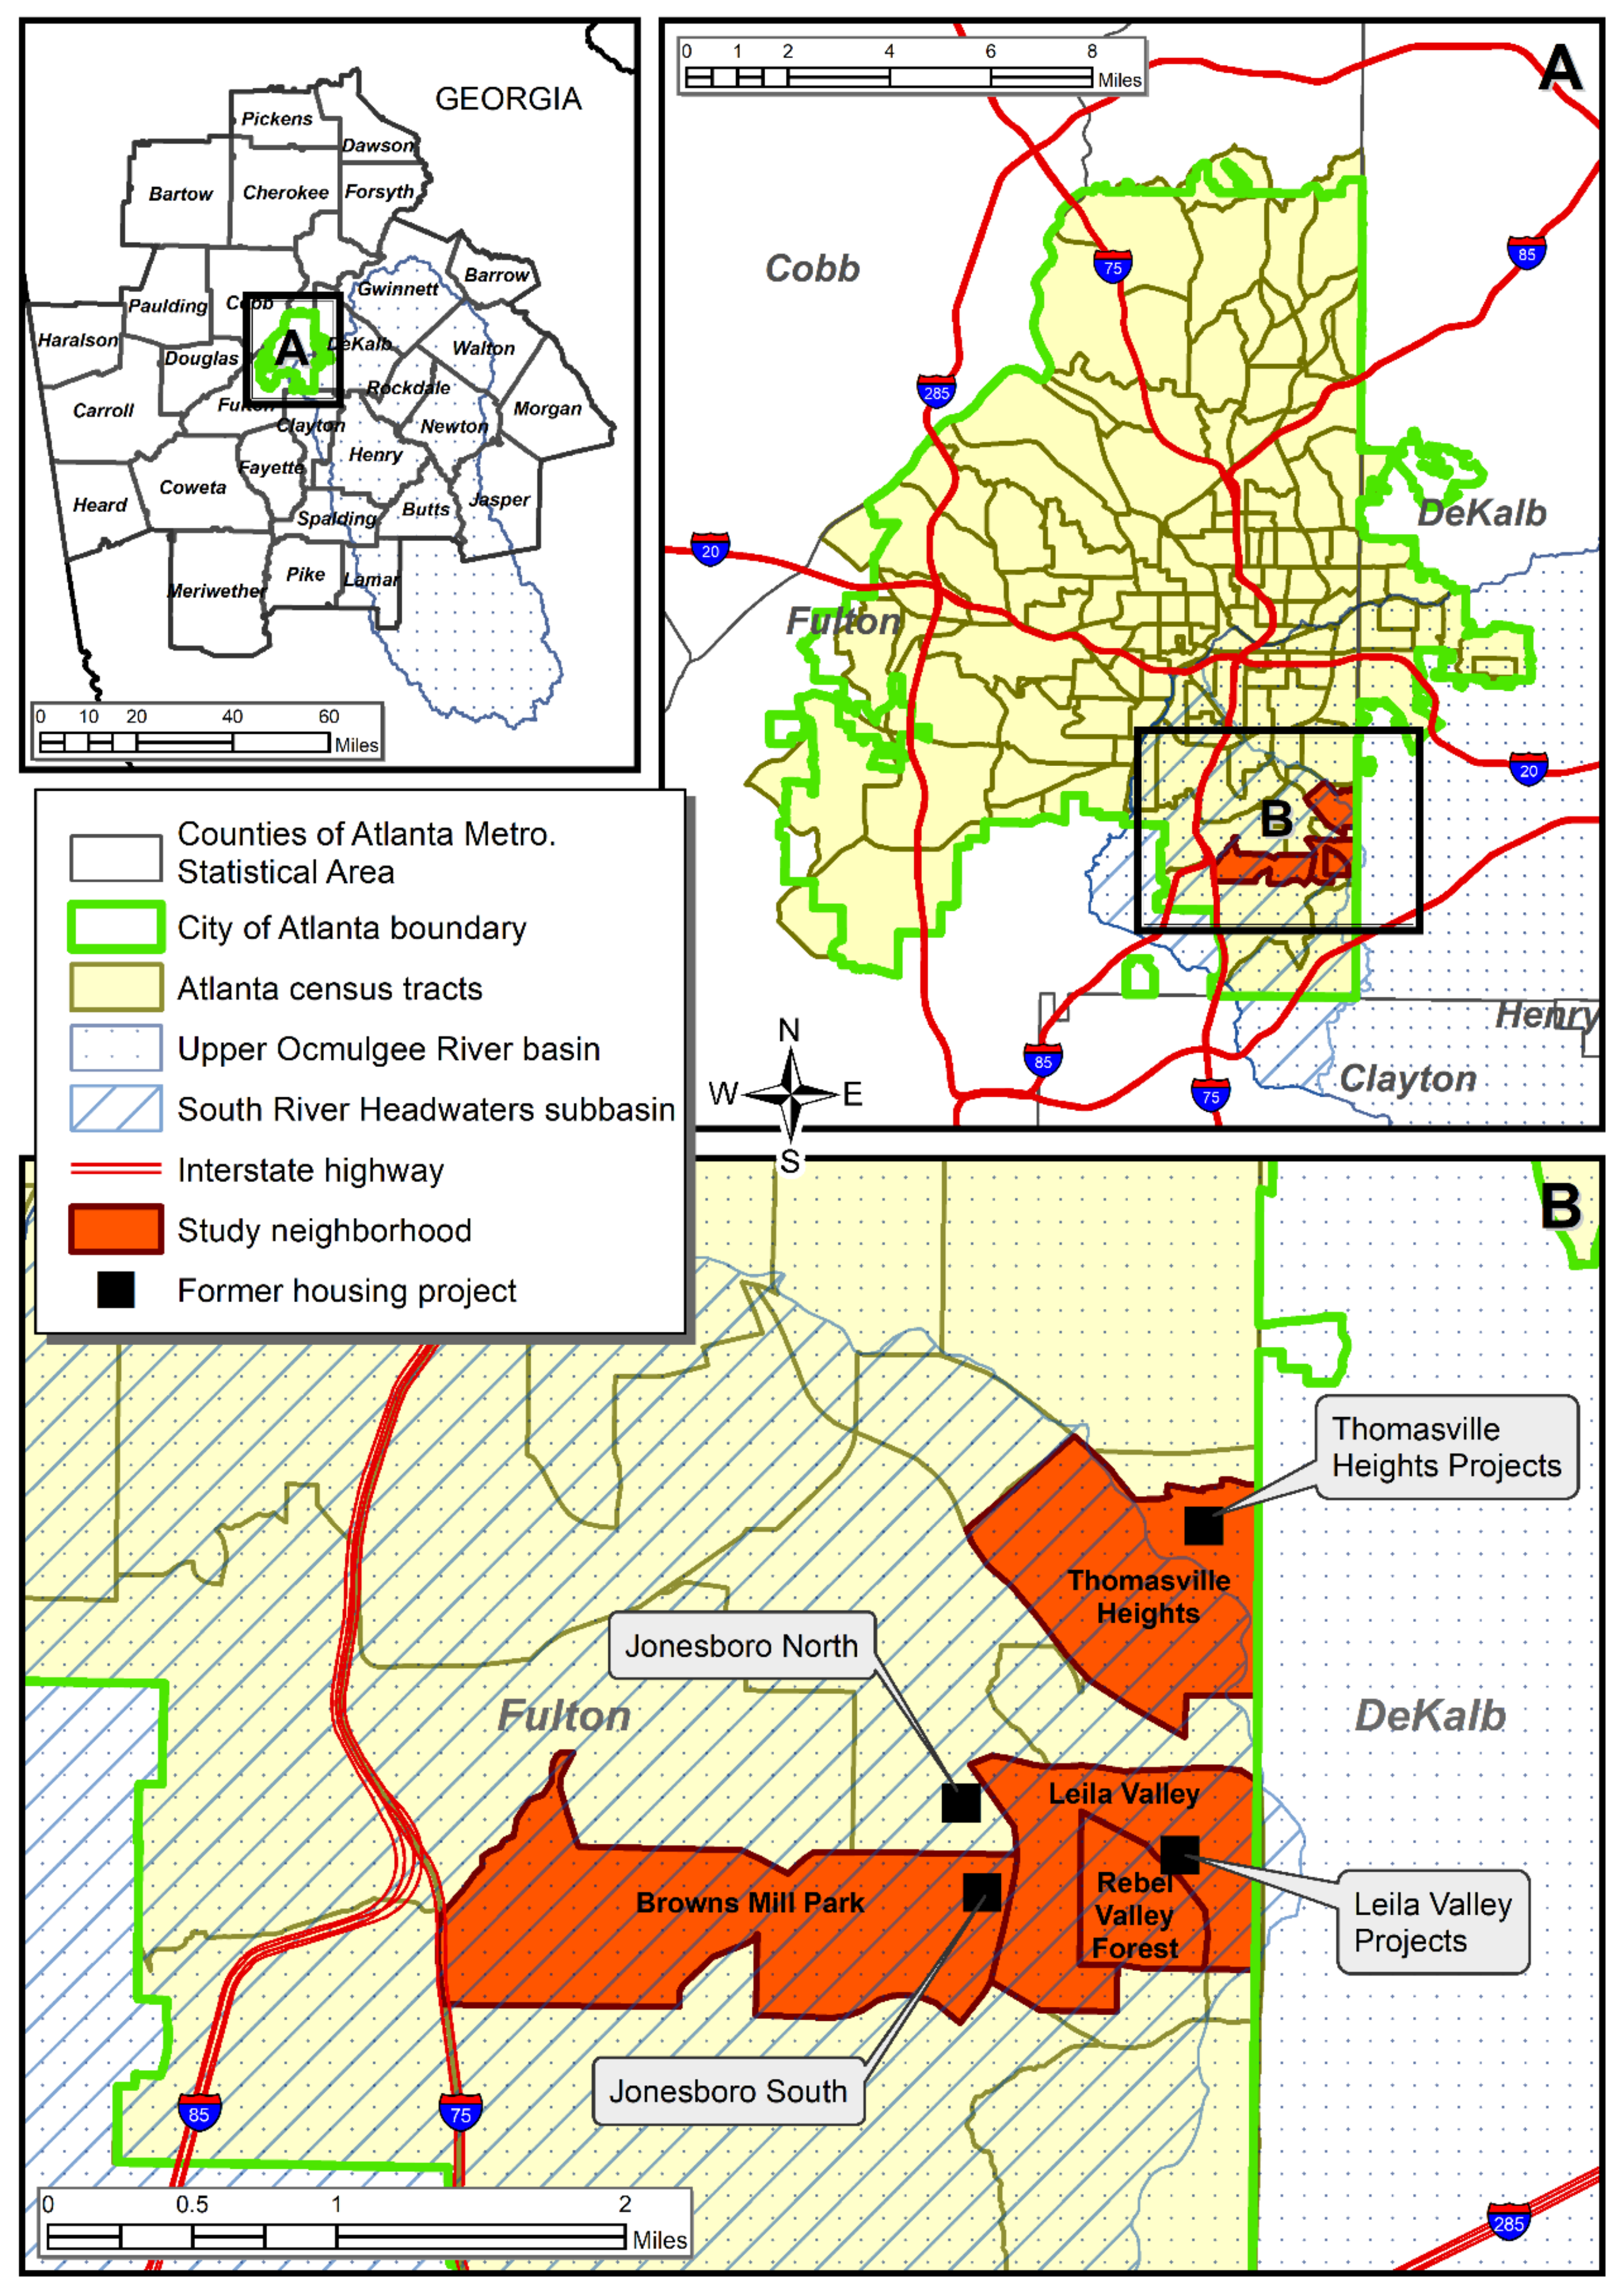
3. Materials and Methods

3.1. Informant Impressions of Urban Patch Neighborhoods: Unstructured Conversations

We began the study with unstructured conversations with residents and others affiliated with our study neighborhoods. These were not interviews with a set of approved questions but more open-ended probes, which provide views of people’s everyday lived experiences of both the communities and the forest patches. This input helped us to identify transiency as a key factor inhibiting civism broadly. These discussions were triangulated with oral histories of the Thomasville community that were conducted as a part of the “Planning Atlanta” project conducted by Georgia State University in 2015 [30,31]. Oral histories were provided by 11 community members recalling the Thomasville’s origins, culture, economics, and respondents’ views of urban renewal. As discussed, our subsequent literature reinforced residents’ impressions of transiency and its impact on civic engagement. That review also identified HCV housing and eviction as two key transiency indicators.
The discussions we initiated were with three people in the spring and summer of 2020 and with three others in the summer of 2019 and fall of 2020. An additional interview was conducted in spring 2022. All were African American. Four individuals either currently lived in or grew up in the communities, and three held neighborhood leadership positions in a civic or religious capacity. Four people were identified either through our contact with a local church or as a result of our describing our project at a virtual Neighborhood Planning Unit (NPU Z) meeting in September 2020. NPUs are city-designated citizen advisory councils. The other three informants were identified via cold call neighborhood canvassing in summer 2019 and as a result of one author’s prior acquaintance. Four of these individuals’ tenures in the communities date back to the 1950s and 1970s, so they brought both a depth and length of knowledge about these communities and their major challenges.

3.2. Neighborhood Transiency: Local Indicators of Spatial Association (LISA) Analysis

We operationalized transiency using 2015 HCV data obtained from the US Department of Housing and Urban Development (HUD) [32], downloaded as shapefiles. We also used eviction rate data from Princeton University’s Eviction Lab for 2016 as a transiency measure [26]. We calculated the percent of HCV housing units by dividing total HCV units by the number of occupied housing units per census tract. Eviction rate is the number of households that receive an eviction judgement per occupied renter household. Eviction data are a composite of court records and eviction data purchased from commercial providers LexisNexis Risk Solutions and American Information Research Services Inc.
Local indicator of spatial association (LISA) analysis was used to examine transiency in the four study neighborhoods. We chose this method of analysis because we wanted to examine how both transiency indicators concentrated across the city and how the two variables were associated spatially. Both analyses allow us to see the extent to which the transiency proxies centralize and correlate in our study area, allowing for an empirical examination of our supposition that involuntary transiency is problematic in the study area. Spatial correlation offers advantages over static measures of association, such as the Pearson’s or Spearman’s correlation, because the former indicates where correlations are significant in space. Static correlation indices provide only a generalized measure of correlation with no indication of how that relationship might vary by areal unit.
To conduct the spatial analysis, values for eviction rate and percent HCV were joined to the attribute table of a 2018 TIGER/Line census tract shapefile downloaded from the US Census Bureau [33]. Census tracts wholly or predominantly within the boundaries of the City of Atlanta [34] were retained for the spatial analysis (n = 128) (see Figure 1).
Techniques to measure local indicators of spatial association (LISA) typically look for locations (census tracts, in this instance) that have both similarity of attribute values and proximity in space, thereby identifying clusters or hotspots and cold spots. In each such technique, the null hypothesis is that the values for relevant variables are distributed randomly across geographic space, and the noted outputs represent “significant” difference from that spatial randomness. With no sample distribution on which to apply p-values, this “significance” is derived from pseudo p-values achieved by running hundreds or thousands or permutations with small variations, approximating a normal distribution of outputs. To identify proximity in space, in contrast, the researcher defines how the computation will recognize the “neighbors” of the reference census tract. The most commonly used neighbor definitions are rook’s or queen’s contiguity, a distance band, or a specified number of the tract’s nearest neighbor tract. A queen’s contiguity matrix means that tracts touching the reference tract by either line or vertex are included as neighbors, while a rook’s contiguity includes only those connected by line. LISA methods were developed in a univariate context and are still often used that way, but development continues and options for bi- or multivariate computations exist, although with limitations, as noted above [35,36,37].
We used Bivariate Local Moran’s I with a queen contiguity matrix to define neighbors as the most appropriate LISA technique to compute and visualize correlations between our two transiency measures. The method calculates associations between the value of the first variable at the reference tract location and the mean values of the second variable at the defined neighbor tracts (a Moran’s I measure is thus “spatially lagged”). We ran the computations (999 permutations) in GeoDa 1.18.0 [38], which returns each reference census tract in a given cluster, designated as one of High–High, Low–Low, Low–High, High–Low, or Not Significant. For instance, a High–High cluster would be one where both the value for eviction rate is higher than (city) average and the mean value for percent HCV in the surrounding weight-defined cluster of tracts is also higher than average. Note that, since only the core tract of each neighbor set is so designated, the remaining tracts in the neighbor set, although not differentiated in GeoDa’s output map, can be considered part of the core’s cluster [36]. From GeoDa, we exported the output data for cartographic treatment in ArcGIS Desktop 10.7.1.

4. Results

4.1. Informant Impressions of Forest Patch Neighborhoods

As indicated, the qualitative data were generated from conversations rather than formal interviews. As such, the information should be taken to represent only the views of the seven people with whom we spoke.
Two people we spoke with emphasized that the lack of engagement by community members in civic matters was troublesome. One of these individuals felt strongly that transiency was the main factor limiting any kind of civic engagement, including nature engagement. This person stressed that it was very difficult to get people to come to neighborhood association meetings, and that the lack of engagement stemmed from this person’s view that people are not in their homes long enough to be interested in the neighborhood, not long enough to even notice a forest patch that might be down the street from them, and certainly not long enough to organize around that greenspace. This person emphasized that transiency was made worse by the frequent moving of HCV households. Related, a participant in the Planning Atlanta oral history project also commented about HCV households:
They sold [home owning neighbors], the family ended up selling the house to…investors. And the investors brought in Section 8 [HCV households]. And I don’t have a problem with Section 8. But they just threw them in there…. These people, probably because they’re so young…, they didn’t have that same buy-in to the community. And so that, “It’s-not-mine-I-ain’t-got-to-take care-of-it”—they brought that same thing to the community
[30].
A longtime community activist with whom we spoke estimated that 30% to 40% of the privately owned homes in Thomasville Heights were HCV households. This person thought that the problems with low-income rentals should not be placed on residents but rather on landlords who failed to maintain their properties. This informant also suggested that transiency was problematic. This person stressed that a serious concern in southeast Atlanta neighborhoods was that original homeowners had either passed away or that homes were now owned by real estate investors or family members who are not socially or fiscally invested in the neighborhoods. As a result, properties are neglected, and neighborhood cohesion has disseminated. Like another respondent, this person also talked about the struggle to engage residents civically—even in programs specifically designed for single-parent families with young children, which predominate in the neighborhoods. When asked what the best use is for all four of the former housing project sites, this respondent maintained that mixed income housing would provide the greatest benefit for that sector of the city because of the affordable housing shortage, although the informant is a strong advocate of urban greening projects. A person who grew up in the Browns Mill Park community also pointed to the problem of “Section 8” renters in terms of their appearing to be less vested in the community. However, this person did not comment on the transiency of these renters.

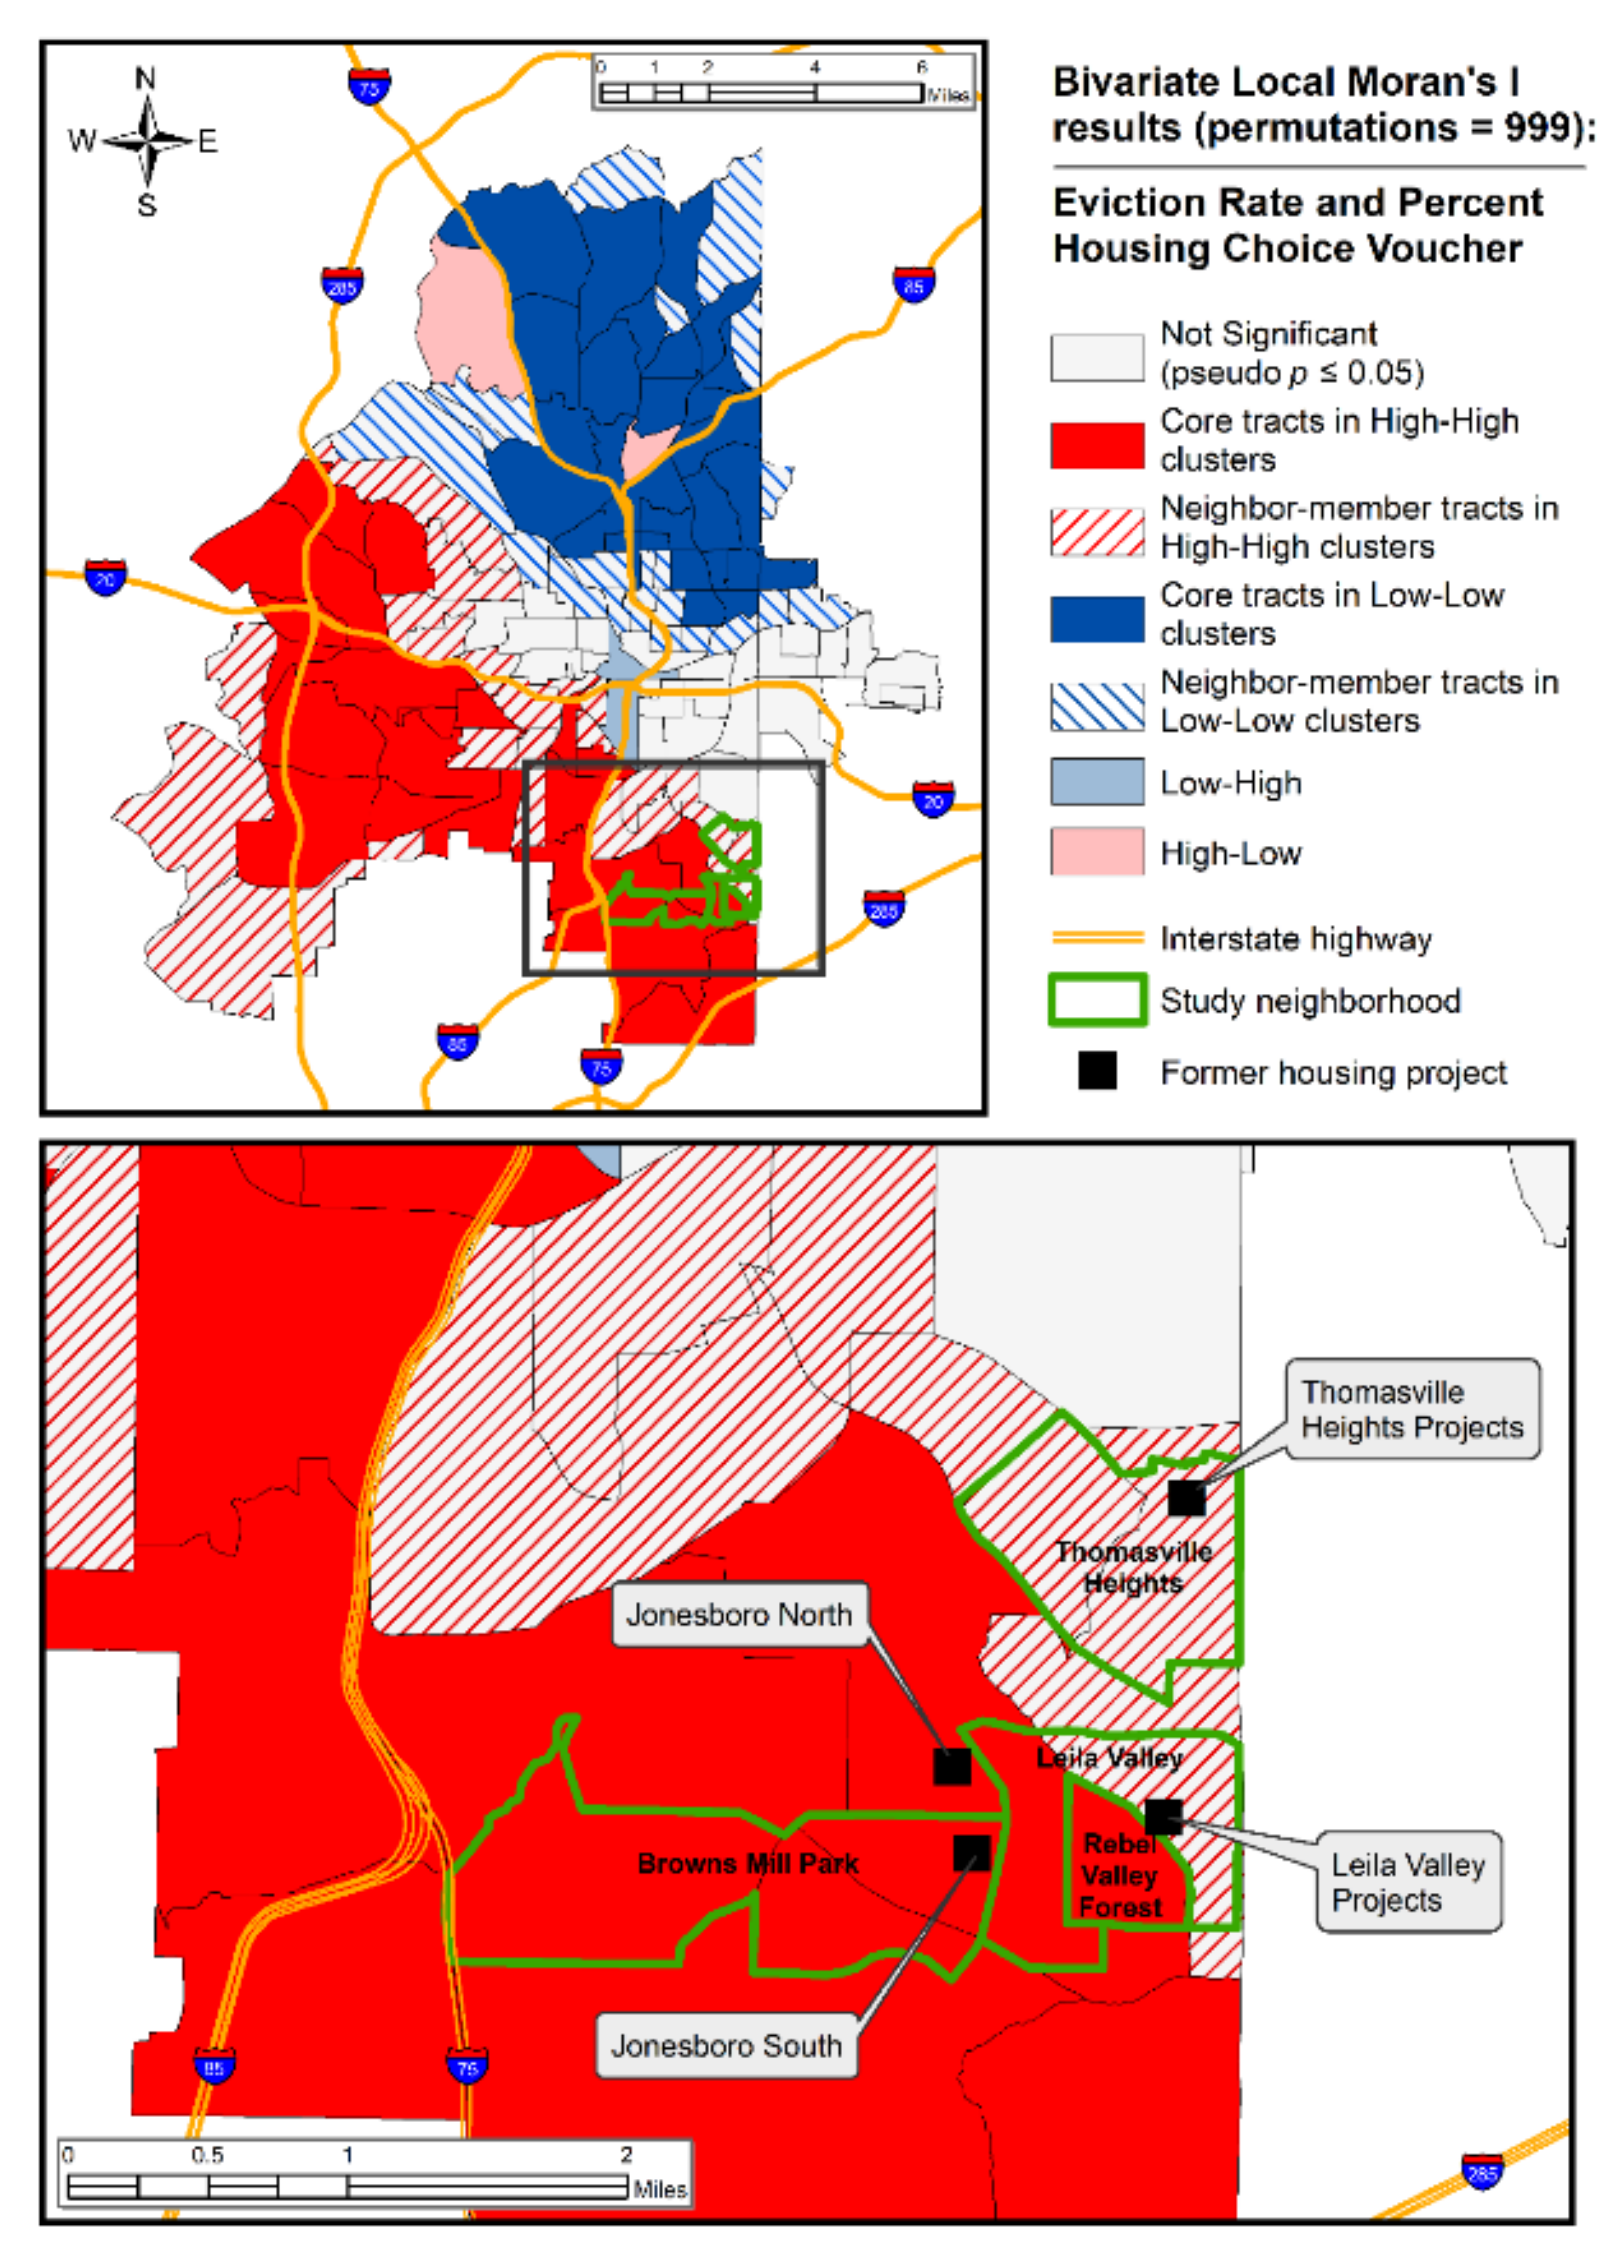
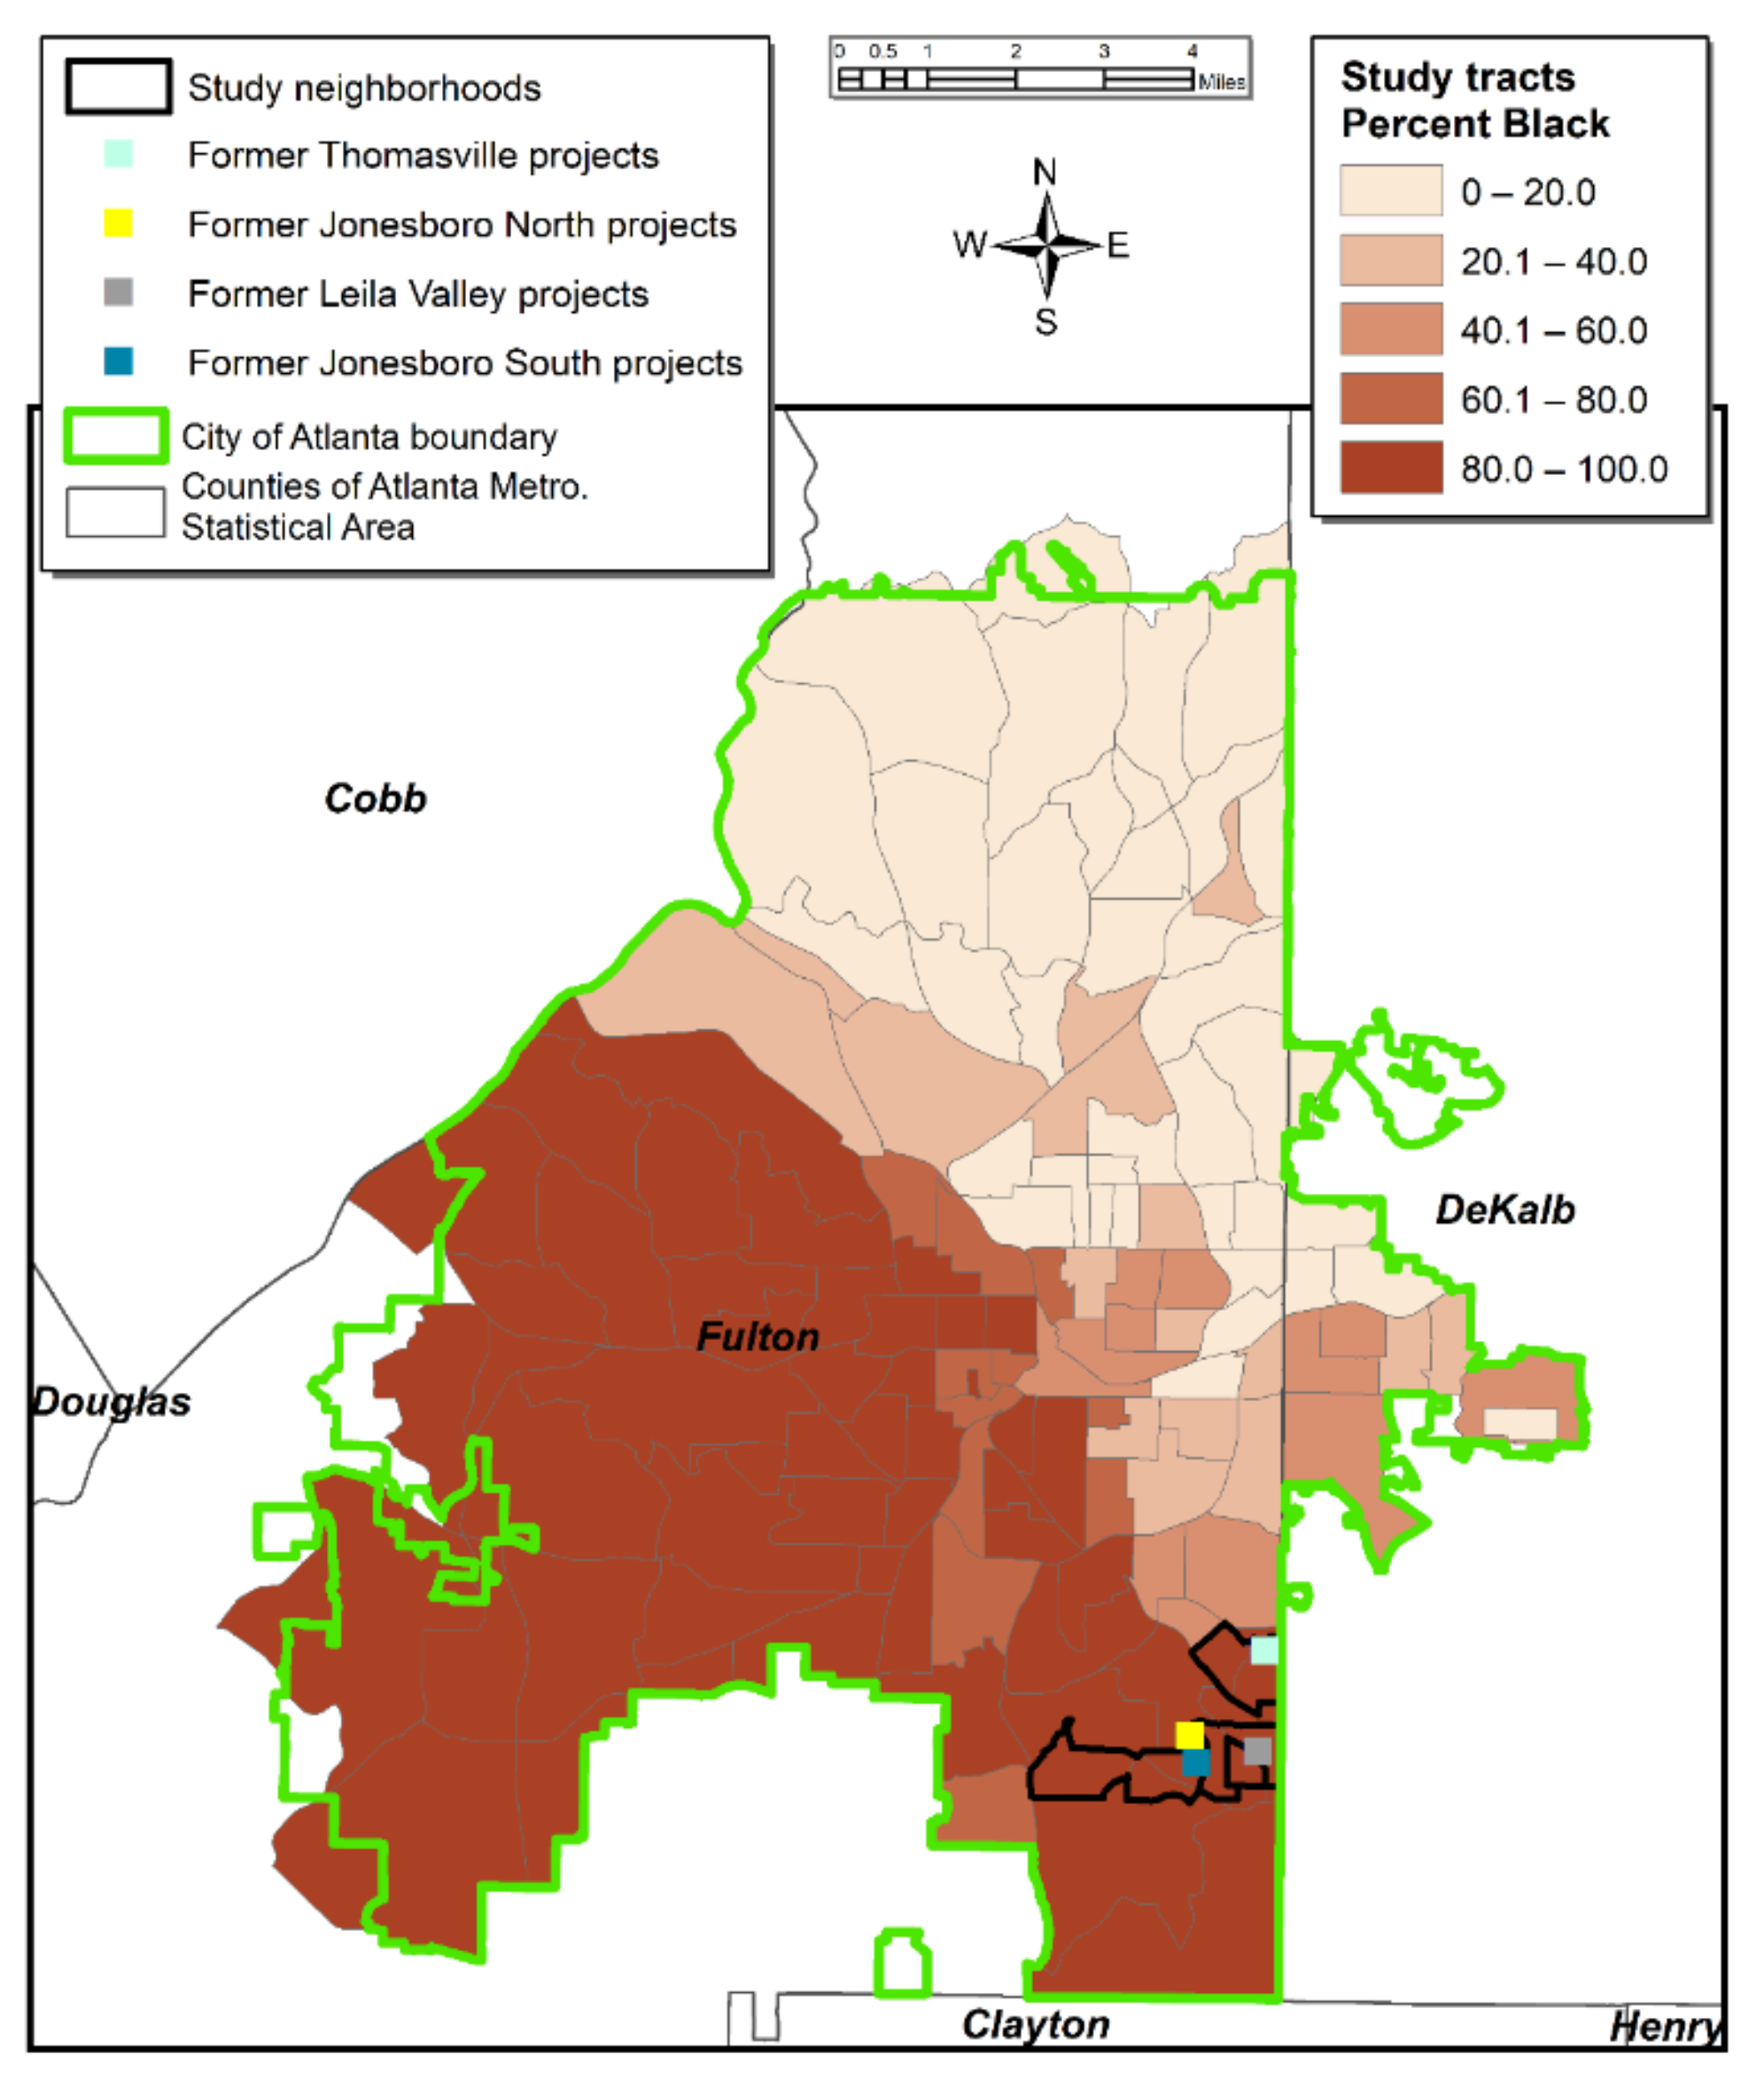
4.2. Neighborhood Transiency: Bivariate LISA Analysis

Results from the LISA analysis revealed important patterns of local spatial association between HCV housing and evictions. Figure 3 shows that eviction rate and HCV percent are correlated in a stark spatial pattern at the city scale, with north Atlanta mostly having low values for both variables and south Atlanta with high values for both variables. In Figure 3, a solid red census tract is a core or reference tract, again where both the eviction rate value for the core tract is higher than average and the mean value for percent HCV in the surrounding cluster of census tracts is also higher than average—and this association can be interpreted as statistically significant based on pseudo p-values (see Discussion in Section 3 of this paper). The solid blue census tracts are core tracts within a cluster where eviction values are lower than average and the mean value for percent HCV in the surrounding cluster of census tracts is also lower than average. Following Anselin [36], we also recognize that the neighbor tracts of calculated core tracts comprise part of a calculated cluster, and we designate them as such in Figure 3 (red and blue hatch lines, respectively). A census tract with red or blue hatch lines is not a core or reference census tract but is part of a cluster where the association between the core and lagged variable is either significantly (again, see Section 3) higher (red hatch) or lower (blue hatch) than average. The solid coral color indicates a core tract in a cluster where eviction rate is higher than average and mean HCV in the adjacent cluster tracts is lower than average. Similarly, the solid light blue tracts show a core tract with a lower than average eviction rate but higher than average HCV values in neighboring tracts.
At the scale of our study neighborhoods, the high eviction rate—high HCV percent space encompasses all the study neighborhoods and former housing projects, supporting the findings of DeLuca et al. [22] regarding transiency and its relationship to both HCV housing and eviction prevalence. The city-scale map also indicates that hot spots, i.e., both evictions and HCV housing, are more likely to occur in the predominantly Black areas of south and west Atlanta (comparing top portion of Figure 3 with Figure 4), whereas the opposite (cold spots) is true in north Atlanta, where the White population is higher.

5. Discussion

Atlanta’s move away from concentrated public housing as an antidote to slums promised economic and social revitalization for the places where these projects stood. In areas of the city with favorable real estate markets, some of these communities have been successfully repurposed. However, for lower-profile communities such as those in our study, efforts to overhaul these spaces have progressed more slowly and apparently without broadscale input by residents in the surrounding neighborhoods. We suggest that this engagement is interrupted by neighborhood instability in the form of transiency, a neglected topic in the environmental justice and greenspace equity literature. Similar to Desmond’s findings in Milwaukee, Wisconsin, and Shelton’s in Lexington, Kentucky, [12,25], we also found that evictions are more pervasive in Atlanta’s predominantly African American neighborhoods. We found as well that HCV housing is more common in these same neighborhoods and is correlated spatially with evictions. These concentrations across the city, especially their associations in our study neighborhoods, lend support for our use of both variables as proxies for transiency.
Our supposition of transiency as a constraint for greenspace civic engagement should not be taken as condoning or supporting an anti-Black or anti-poor narrative of minority apathy or failure. Instead, our intention is to highlight the consequences of housing inequity in predominantly Black Atlanta communities—and what that might ultimately mean for greenspace civic engagement. Moving forward, we recommend a second phase of this study to elicit household-level data from these communities on additional measures of transiency, such as housing unit failure and neighborhood violence. The subsequent investigation will also gauge community members’ impressions of various types of involuntary moves on advocacy and interest in nearby urban forest patches. This will include residents’ views of how these sites might impact navigation of their respective neighborhoods, their views on how the sites convey impressions about the neighborhood to those who do not live there, and how the spaces might be repurposed for ecological or other purposes.

Author Contributions

C.J.G. conceptualized the research, conducted the literature review and informant interviews, and wrote much of the manuscript. D.A.C. conducted the I-tree Hydro analysis and the writeup of that analysis. G.R.D. conducted the LISA analyses and the writeup of those analyses. All authors have read and agreed to the published version of the manuscript.

Funding

This research was funded by the USDA Forest Service, the University of Georgia, and Oakridge National Laboratory via author salaries.

Institutional Review Board Statement

Institutional Review Board approval was governed by the US government’s Office of Management and Budget stipulations, which does not require approval for research where data from fewer than ten people are gathered.

Informed Consent Statement

Informed consent was not obtained from human subjects because information received from them was derived from informal conversations that varied rather than from systematic questioning with an approved interview guide.

Data Availability Statement

Eviction data can be found at Princeton Eviction Laboratory: https://evictionlab.org/get-the-data/, accessed on 6 May 2020. Housing Choice Voucher data can be obtained from the US Department of Housing and Urban Development, Office of Policy Development and Research (PD&R). http://hudgis-hud.opendata.arcgis.com/datasets/housing-choice-vouchers-by-tract?geometry=-96.248%2C-0.614%2C-147.224%2C76.538, accessed on 3 June 2020.

Acknowledgments

We thank seven community members for sharing their opinions and insights about the study neighborhoods. We also appreciate Eric Kuehler, former USDA Forest Service arborist, for advising and instructing the research team on I-tree Hydro methods and analysis.

Conflicts of Interest

The authors declare no conflict of interest.

Appendix A

I-Tree Hydro Simulations

We used the I-tree Hydro model to simulate impacts of vegetation change on water quality and quantity from the sites at two points in time, 2007 and 2020 [39]. The outputs generated from I-tree Hydro displayed in Table A1 show consistent patterns related to total annual stormwater runoff and pollutant loadings for all the study sites. The total annual stormwater runoff decreased by 38% for Jonesboro North, 34% for Jonesboro South, 29% for Thomasville Heights, and 23% for Leila Valley between 2007 and 2020. Similar relationships were observed for pervious and impervious flow, with Jonesboro North and Jonesboro South showing a complete reduction in impervious flow in 2020. Although greatly reduced from the 2007 levels, remnants of connected impervious surface (roadway segments) remained on the Thomasville and Leila Valley parcels following the removal of the housing developments, which likely caused the minimal contribution of impervious flow to the total annual stormwater runoff on those parcels in 2020. Moreover, all four parcels exhibited greater water retention in 2020 compared to the earlier scenario, with more than 50% of the total annual stormwater being retained on each parcel. Overall, the model results indicate that the removal of impervious surfaces and subsequent increases in tree, shrub, and herbaceous landcover promote greater stormwater retention and infiltration at each of our study sites. These patterns are further reflected in the total annual pollutant loadings for each parcel (Table A2) and are suggestive of the additive benefits of the removal of gray infrastructure on water quality. These simulations would suggest positive contributions to the health of the South River and the larger Ocmulgee River Basin (see Figure 1 in text body).
Table A1. Former Atlanta housing projects: I-tree Hydro results comparing total annual stormwater runoff for landcover on the sites in 2007 and 2020.
ParcelParcel Acreage (ha)Landcover
Scenario
Total Runoff (m3/yr)Pervious
Flow (m3/yr)
Impervious Flow (m3/yr)
Jonesboro North9.28
(3.76)
200731,13624,6145507
202019,29015,8300
Jonesboro South15.0
(6.07)
200746,63138,87524,704
202030,46424,7040
202017,05211,624346
Leila Valley14.0
(5.67)
200722,32816,6792863
202017,05211,624346
Thomasville36.42
(14.74)
2007123,76893,37517,096
202087,00160,64632
Table A2. Former Atlanta housing projects: I-tree Hydro results comparing total annual pollutant loading for landcover on the sites in 2007 and 2020.
ParcelLandcover ScenarioTSS (kg/yr)BOD (kg/yr)COD (kg/yr)TP (kg/yr)SolP (kg/yr)TKN (kg/yr)NO2− & NO3− (kg/yr)Cu (kg/yr)Pb (kg/yr)Zn (kg/yr)
Jonesboro North20072315.31416.401559.299.303.8151.0919.430.401.994.78
20201240.86223.16835.684.992.0427.3810.410.211.072.56
Jonesboro South20073563.37640.862399.8214.325.8678.6329.910.613.077.36
20201980.68356.221333.937.963.2643.7116.620.341.714.09
Leila Valley20071532.16275.551031.866.162.5233.8112.860.261.323.17
2020938.41168.77631.993.771.5420.717.880.160.811.94
Thomasville20078660.881557.635832.8334.8014.25191.1172.691.497.4617.90
20204757.12855.553203.7719.117.83104.9739.930.824.109.83
TSS = total suspended solids, BOD = biological oxygen demand, COD = chemical oxygen demand, TP = total phosphorus, SolP = soluble phosphorus, TKN = total Kjeldahl nitrogen, NO2− & NO3− = nitrite and nitrate, Cu = copper, Pb = lead, Zn = zinc.

References

  1. Giarrusso, T.; Smith, S. Assessing Urban Tree Canopy in the City of Atlanta: A Baseline Canopy Study; Development Arborist Division: Atlanta, GA, USA, 2014. Available online: https://www.atlantaga.gov/Home/ShowDocument?id=14722 (accessed on 25 February 2017).
  2. Atlanta Housing. Atlanta Housing FY 2021 Moving to Work (MTW) Annual Report. Available online: https://www.atlantahousing.org/wp-content/uploads/2021/10/HA-GA006-FY2021-Ann.-MTW-Report.pdf (accessed on 1 April 2022).
  3. Atlanta Housing. Atlanta Housing FY 2018 MTW [Moving to Work] Annual Report: For Fiscal Year Ending 30 June 2018; Atlanta Housing: Atlanta, GA, USA, 2018; Available online: https://www.atlantahousing.org/wp-content/uploads/2018/12/AtlantaHousing-FY2018-MTW-Annual-Report-Board-Approved-FINAL-2018.0928ForWeb.pdf (accessed on 15 July 2020).
  4. Mcnulty, T.; Holloway, S. Race, Crime, and Public Housing in Atlanta: Testing a Conditional Effect Hypothesis. Soc. Forces 2000, 79, 707–729. [Google Scholar] [CrossRef]
  5. Burns, S.; McMahon, D. East Lake Meadows. 2021. Available online: https://kenburns.com/films/east-lake-meadows-a-public-housing-story/ (accessed on 1 April 2022).
  6. Ernstson, H. The Social Production of Ecosystem Services: A Framework for Studying Environmental Justice and Ecological Complexity in Urbanized Landscapes. Landsc. Urban Plan. 2013, 109, 7–17. [Google Scholar] [CrossRef] [Green Version]
  7. Campbell, L.K.; Svendsen, E.S.; Johnson, M.L.; Plitt, S. Not by Trees Alone: Centering Community in Urban Forestry. Landsc. Urban Plan. 2022, 224, 104445. [Google Scholar] [CrossRef]
  8. Johnson, M.L.; Campbell, L.K.; Svendsen, E.S.; Silva, P. Why Count Trees? Volunteer Motivations and Experiences with Tree Monitoring in New York City. Arboric. Urban For. 2018, 44, 59–72. [Google Scholar] [CrossRef]
  9. Jelks, N.O.; Hawthorne, T.L.; Dai, D.; Fuller, C.H.; Stauber, C. Mapping the Hidden Hazards: Community-Led Spatial Data Collection of Street-Level Environmental Stressors in a Degraded, Urban Watershed. Int. J. Environ. Res. Public. Health 2018, 15, 825. [Google Scholar] [CrossRef] [PubMed] [Green Version]
  10. Saliminen Witt, R.; Svendsen, E.; Krasny, M. Civic Stewardship as a Catalyst for Social-Ecological Change in Detroit, Michigan. In Grassroots to Global: Broader Impacts of Civic Ecology; Cornell University Press: New York, NY, USA, 2018; pp. 213–230. [Google Scholar] [CrossRef]
  11. Desmond, M.; Kimbro, R.T. Eviction’s Fallout: Housing, Hardship, and Health. Soc. Forces 2015, 94, 295–324. [Google Scholar] [CrossRef]
  12. Shelton, T. Mapping Dispossession: Eviction, Foreclosure and the Multiple Geographies of Housing Instability in Lexington, Kentucky. Geoforum 2018, 97, 281–291. [Google Scholar] [CrossRef]
  13. Rotolo, T.; Wilson, J.; Hughes, M.E. Homeownership and Volunteering: An Alternative Approach to Studying Social Inequality and Civic Engagement. Sociol. Forum 2010, 25, 570–587. [Google Scholar] [CrossRef]
  14. Gustafson, S. Displacement and The Racial State in Olympic Atlanta 1990–1996. Southeast. Geogr. 2013, 53, 198–213. [Google Scholar] [CrossRef]
  15. Schank, K.M. Producing the Projects: Atlanta and the Cultural Creation of Public Housing, 1933–2011. Ph.D. Thesis, ProQuest National Agriculture Library—Dissertation. The George Washingtion University, Washington, DC, USA, 2016. Available online: https://www.proquest.com/docview/1779975993?pq-origsite=gscholar&fromopenview=true (accessed on 29 March 2021).
  16. Goldstein, A. A Purposely Built Community: Public Housing Redevelopment and Resident Replacement at East Lake Meadows. Atlanta Studies. Available online: https://atlantastudies.org/2017/03/14/a-purposely-built-community-public-housing-redevelopment-and-resident-replacement-at-east-lake-meadows/ (accessed on 25 March 2022).
  17. Oakley, D.; Ruel, E.; Wilson, G.E. A Choice with No Options: Atlanta Public Housing Residents’ Lived Experiences in the Face of Relocation. p. 34. Available online: http://www.thecyberhood.net/documents/projects/atlanta.pdf (accessed on 25 March 2022).
  18. Nations, H. Most Public Housing in Small Area. The Atlanta Journal Constitution, 4 April 1971. [Google Scholar]
  19. Immergluck, D.; Carpenter, A.; Lueders, A. Hot City, Cool City: Explaining Neighbourhood-Level Losses in Low-Cost Rental Housing in Southern US Cities. Int. J. Hous. Policy 2018, 18, 454–478. [Google Scholar] [CrossRef]
  20. Immergluck, D. The Role of Investors in the Single-Family Market in Distressed Neighborhoods: The Case of Atlanta; Joint Center for Housing Studies: Cambridge, MA, USA, 2013; Available online: https://www.jchs.harvard.edu/research-areas/working-papers/role-investors-single-family-market-distressed-neighborhoods-case (accessed on 26 March 2022).
  21. Neighborhood Nexus. City of Atlanta Neighborhoods. Available online: https://neighborhoodnexus.org/dashboard/city-of-atlanta/ (accessed on 12 December 2021).
  22. DeLuca, S.; Wood, H.; Rosenblatt, P. Why Poor Families Move (And Where They Go): Reactive Mobility and Residential Decisions. City Community 2019, 18, 556–593. [Google Scholar] [CrossRef]
  23. Raymond, E.; Duckworth, R.; Miller, B.; Lucas, M.; Pokharel, S. Corporate Landlords, Institutional Investors, and Displacement: Eviction Rates in Single-Family Rentals. 2016, p. 22. Available online: https://www.atlantafed.org/-/media/documents/community-development/publications/discussion-papers/2016/04-corporate-landlords-institutional-investors-and-displacement-2016-12-21.pdf (accessed on 16 October 2020).
  24. Wang, R.; Walter, R.J. Tracking Mobility in the Housing Choice Voucher Program: A Household Level Examination in Florida, USA. Hous. Stud. 2018, 33, 455–475. [Google Scholar] [CrossRef]
  25. Desmond, M. Eviction and the Reproduction of Urban Poverty. Am. J. Sociol. 2012, 118, 88–133. [Google Scholar] [CrossRef] [Green Version]
  26. Princeton University Eviction Laboratory. Eviction and Eviction Rate. Available online: https://evictionlab.org/rankings/#/evictions (accessed on 5 July 2020).
  27. Briggs, X.d.S.; Comey, J.; Weismann, G. Struggling to Stay out of High-Poverty Neighborhoods: Housing Choice and Locations in Moving to Opportunity’s First Decade. Hous. Policy Debate 2010, 20, 383–427. [Google Scholar] [CrossRef]
  28. Lundberg, I.; Gold, S.L.; Donnelly, L.; Brooks-Gunn, J.; McLanahan, S.S. Government Assistance Protects Low-Income Families from Eviction. J. Policy Anal. Manag. 2021, 40, 107–127. [Google Scholar] [CrossRef] [PubMed]
  29. Desmond, M.; Shollenberger, T. Forced Displacement From Rental Housing: Prevalence and Neighborhood Consequences. Demography 2015, 52, 1751–1772. [Google Scholar] [CrossRef] [PubMed]
  30. Allen, L.J. Planning Atlanta—A New City in the Making, 1930s–1990s. Norwood Manor Civic Association Oral History Interview. 29 January 2015. Available online: https://digitalcollections.library.gsu.edu/digital/collection/PlanATL/id/2805/rec/1 (accessed on 30 March 2022).
  31. Allen, L.J. Planning Atlanta—A New City in the Making, 1930s–1990s. Thomasville Group Oral History Interview. 12 March 2015. Available online: https://digitalcollections.library.gsu.edu/digital/collection/planatl/search/searchterm/joy%20allen (accessed on 18 March 2022).
  32. US Department of Housing and Urban Development, Office of Policy Development and Research (PD&R). Enterprise Geospatial Information System (eGIS). Housing Choice Vouchers by Tract. Available online: http://hudgis-hud.opendata.arcgis.com/datasets/housing-choice-vouchers-by-tract?geometry=-96.248%2C-0.614%2C-147.224%2C76.538 (accessed on 28 July 2020).
  33. US Census Bureau. TIGER/Line Shapefiles 2018. Available online: https://www.census.gov/geographies/mapping-files/time-series/geo/tiger-line-file.2018.html (accessed on 8 July 2020).
  34. City of Atlanta, Department of City Planning GIS. Atlanta City Limits; Department of City Planning Geographic Information Systems (GIS): Atlanta, GA, USA, 2021; Available online: https://dpcd-coaplangis.opendata.arcgis.com/datasets/atlanta-city-limits/explore?location=33.728850%2C-84.448300%2C9.29 (accessed on 2 June 2022).
  35. Anselin, L. Local Indicators of Spatial Association—LISA. Geogr. Anal. 1995, 27, 93–115. Available online: https://onlinelibrary.wiley.com/doi/abs/10.1111/j.1538-4632.1995.tb00338.x (accessed on 23 March 2022). [CrossRef]
  36. Anselin, L. A Local Indicator of Multivariate Spatial Association: Extending Geary’s c. Geogr. Anal. 2019, 51, 133–150. [Google Scholar] [CrossRef]
  37. Anselin, L.; Li, X. Tobler’s Law in a Multivariate World. Geogr. Anal. 2020, 52, 494–510. [Google Scholar] [CrossRef]
  38. GeoDa on Github. Available online: https://geodacenter.github.io/ (accessed on 25 March 2022).
  39. Wang, J.; Endreny, T.A.; Nowak, D.J. Mechanistic Simulation of Tree Effects in an Urban Water Balance Model. J. Am. Water Resour. Assoc. 2008, 44, 75–85. [Google Scholar] [CrossRef]
Figure 1. Study area.
Sustainability 14 07220 g001
Figure 2. Children and youth at Thomasville housing projects, circa early 1980s. Reprinted with permission from Atlanta Housing Archives. The photograph is not copyrighted. https://www.atlantahousing.org/about-us/archives/ (accessed on 3 November 2020).
Sustainability 14 07220 g002
Figure 3. Local indicators of spatial association (LISA) analysis. Housing Choice Voucher percent and eviction rate.
Sustainability 14 07220 g003
Figure 4. Percent African American at census tract scale in Atlanta, Georgia, 2019.
Sustainability 14 07220 g004
Publisher’s Note: MDPI stays neutral with regard to jurisdictional claims in published maps and institutional affiliations.

