Article

Identify the Impacts of the Grand Ethiopian Renaissance Dam on Watershed Sediment and Water Yields Dynamics

1
School of Public Affairs, Zhejiang University, Hangzhou 310058, China
2
Zhejiang Forestry Technology Extended Station, Hangzhou 310020, China
3
Tongxiang Forestry Working Station, Jiaxing 314599, China
4
The Rural Development Academy, Zhejiang University, Hangzhou 310058, China
5
College of Environmental and Resource Sciences, Zhejiang University, Hangzhou 310058, China
6
Zhejiang Ecological Civilization Academy, Anji 313300, China
*
Authors to whom correspondence should be addressed.
Sustainability 2022, 14(13), 7590; https://doi.org/10.3390/su14137590
Submission received: 7 April 2022 / Revised: 1 June 2022 / Accepted: 3 June 2022 / Published: 22 June 2022

Abstract

:
The construction of large-scale water reservoir facilities in transboundary river basins always arouses intense concern and controversy. The Grand Ethiopian Renaissance Dam (GERD) under construction in Ethiopia is perceived to affect water security in Egypt and Sudan. Therefore, this study investigated the water and sediment balance of the Blue Nile River (BNR) basin and identified the spatio-temporal variation in sediment and water yields along with the construction of GERD using Integrated Valuation of Ecosystem Services and Tradeoffs (InVEST) sediment and water yield models. The BNR basin experienced increasing water and sediment yields between 1992 and 2020 and has shown a growth trend since 2020. The lion’s share of water and sediment yields come from upstream of the GERD. Taken together, these results imply that the construction of the GERD will serve as a water storage and silt trap for Sudan and Egypt.

1. Introduction

Energy is a general condition that has a significant impact on economic development. Economic growth is directly related to large infrastructure projects, such as hydropower plants, to meet the increase in electricity demand that accompanies urbanization and industrialization [1]. Hydropower is known to be renewable, clean, efficient, and harmless compared to other non-renewable energy sources, although the construction of mega-dams on transboundary rivers poses well-known environmental and political problems [2]. Hence, the concept of sustainable development has been a guiding principle for economic development in all United Nations member countries [3]. In the last decade, an increasing trend of sustainable development studies has been observed [4]. The primary goal of sustainable development is to ensure environmental protection in the pursuit of rapid economic growth [5]. To achieve this goal, the United Nations formulated the Millennium Development Goals (MDGs) in 2000 and the Sustainable Development Goals (SDGs) in 2015 [6,7,8]. Countries are encouraged to use their natural resources to achieve the 2030 SDGs. These include water resource management and development to eradicate poverty through improved irrigation, renewable energy, and water supply [4].
Although Ethiopia—the most populous country in Africa, along with Nigeria—generates more than 80% of the annual runoff from the Nile River [9], it has used very little water from the Blue Nile River (BNR) until recently due to poor infrastructure, the rain-fed agriculture-based farming system, the inaccessibility of the basin, and lack of funding [10]. On the other hand, the downstream riparian countries of Egypt and Sudan are largely dependent on Blue Nile water for domestic consumption, hydropower production, and irrigation [11]. Recently, Ethiopia started the construction of the Grand Ethiopian Renaissance Dam (GERD) with the primary goal of achieving the 2030 United Nations SDGs. When completed, the GERD will be the largest hydropower dam in Africa and one of the 10 most significant globally. According to Ethiopian Ministry of Water and Energy, GERD is a 6450 MW hydroelectric project on the Blue Nile River in Ethiopia, located about 30 km upstream from the border with Sudan and nearing completion. The 145 m high gravity dam made of roller compacted concrete will flood 1874 km2 with a normal basin height of 640 m and will have a catchment area of 172,250 km2 (https://mowe.gov.et/en/project/grand-ethiopian-renaissance-dam-1 (accessed 18 May 2022)). The dam will boost the fast-growing economy and provide cheap and reliable electricity for both Ethiopians and neighboring countries, promoting regional cooperation and economic growth [12]. However, all proposed hydropower and irrigation water resource projects in Ethiopia are considered a threat to Egypt and Sudan [9].
Several researchers have studied the potential impact of the GERD on water resources in Sudan and Egypt. Ahmed and Helmy Elsanabary [13] assessed the ecological and hydrological impacts of the GERD on the Nile River. They concluded that the construction of the GERD on the Blue Nile would reduce Egypt’s water share and is a source of CO2 emissions. In contrast, Negm et al. [14] found that the GERD will significantly reduce sediment deposition, which will increase the operating life of the Aswan High Dam (AHD). The most controversial study was conducted by Dandrawy and Omran [15] on the GERD reservoir, which concluded that the GERD is a curse for Egypt and Sudan. 14 water resource experts highly criticized this study [16]. To date, there is no consensus on the potential impacts of the GERD among scientists and riparian states. “One side claims GERD will be a curse for downstream countries. The other side claims it will be a boon and a game-changer for growth and prosperity” [17].
Previous studies on the impacts of the GERD have focused only on political boundaries, rather than hydrologically defined systems [13,18,19,20,21]. Nevertheless, the Earth’s subsystems that control geophysical processes and support the SDGs have been mostly ignored [4]. The studies overlook the geophysical processes and spatial boundaries as the unit of analysis. If we consider the spatial boundary as the unit of research, the impacts of the GERD may be different [4]. In addition, no study has examined the ecosystem services, such as water and sediment yields, provided by the BNR basin where the GERD is located. This demonstrates the need to assess the spatio-temporal variations in water and sediment yields in the BNR basin to understand the implication of the GERD fully. Hence, the central thesis of this study is that the GERD will change the water and sediment balance of the BNR basin.
Researchers suggest that new SDG indicators such as a change in water production and the sediment transport of a river basin that characterize ecological change are needed [6,22]. This work therefore aims to investigate the spatiotemporal variation in water and sediment yields in the BNR basin between 1992 and 2020, along with the construction of the GERD. The significance and originality of this study is that it is the first to examine the water and sediment balance of the BNR basin with the GERD. It provides new insights into the sustainable management of soil and water in the basin based on the intensity of the problem. This will help conserve scarce resources by allocating labor and finance to high-risk areas rather than distributing them evenly across the basin.

2. Materials and Methods

In the study, the Sediment Delivery Ratio (SDR) and Annual Water Yield (AWY) models, embedded in the InVEST (Integrated Valuation of Environmental Services and Tradeoffs) stand-alone tool collection for mapping ecosystem services, were applied to the BNR basin and Northeast Africa using globally available remote sensing data and geospatial technologies (ArcGIS and QGIS).

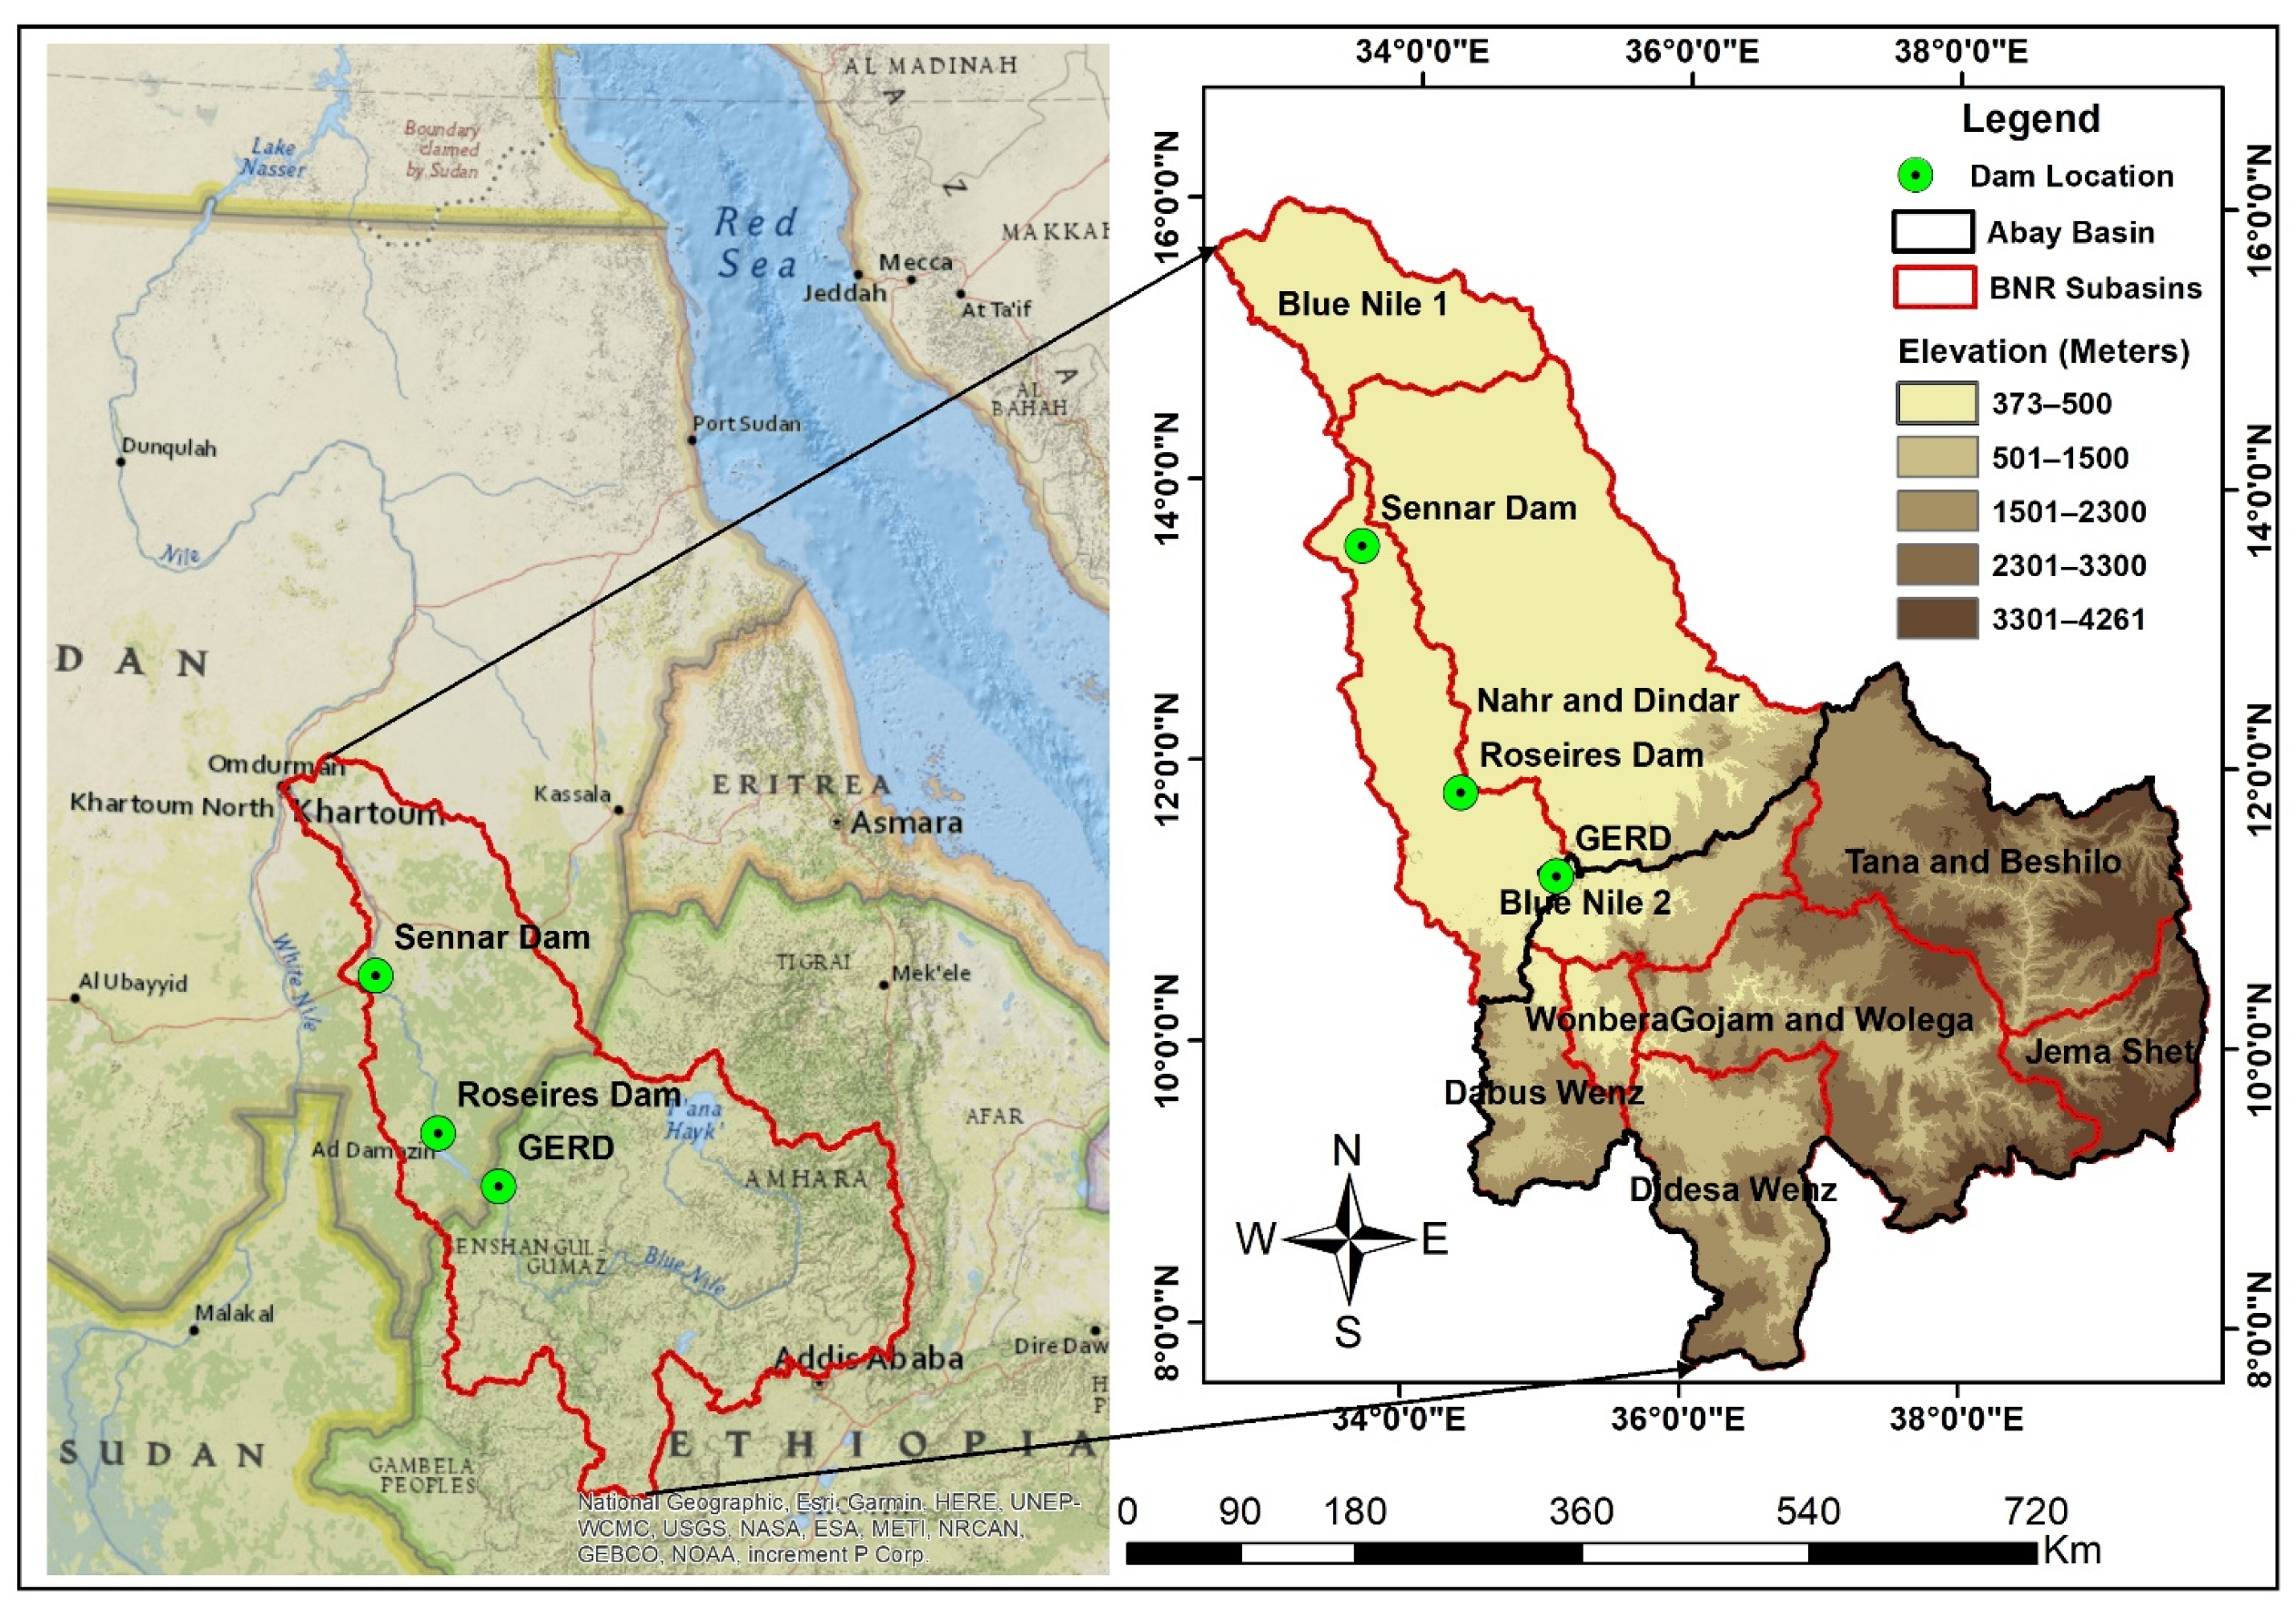
2.1. Study Site Description

The BNR basin is located between Khartoum, the capital of Sudan, and Addis Ababa, the capital of Ethiopia, within 32.5–40° east and 7.5–16° north (Figure 1). The shapefiles for the watershed and sub-watersheds were provided by the Nile Basin Initiative (NBI) and the Abay Basin Authority (ABA), respectively, upon request. It covers an area of 320,029 km2 of the Nile River Basin. Different landforms, land uses, and climates characterize the BNR basin, reflecting the area’s complex topography. The basin has an average elevation of 1300 m a.s.l. (meters above sea level). The lowest point is in the northern part of the basin (373 m a.s.l.), near Khartoum, and the highest point is above the Ethiopian Highlands, in the southeastern part (4261 m a.s.l.) around Mount Dejen. The southern part of the BNR basin is primarily dominated by rugged topography, which makes the region vulnerable to soil erosion and runoff sources.
The physiography of the BNR basin is diverse. The mean annual rainfall is 1023 mm/yr. However, it is unevenly distributed and is primarily controlled by altitude. It has ranged from 105 mm/yr in Sudan to 2296 mm/yr in Ethiopia during the last decades. The average annual rainfall in the lower part of the basin, which lies in Sudan, is less than 500 mm/yr [10]. The upper BNR basin, in Ethiopia, receives more than 1000 mm of average annual rainfall [23]. The temperature of the basin also varies from 44 °C in Sudan to 3 °C in Ethiopia. According to Awulachew et al. [10], 90% of the BNR basin is occupied by cropland (36%), grassland (25%), woodland (17%), and shrubland (12%). Nitisols (24%), leptosols (19%), and vertisols (29%) are the predominant soil types occupying the BNR basin.
The BNR basin has ecological and economic impacts from the Ethiopian Highlands to the Mediterranean Sea. This basin contributes nearly 60% of the annual average Nile River flow [24,25]. The livelihoods of hundreds of millions of people in Ethiopia, Sudan, and Egypt depend on the water of the BNR. However, environmental degradation such as soil erosion, deforestation, and drought threaten the basin due to population pressure and climate change. The health of the GERD, which is under construction, depends on the normal functioning of the BNR basin [26].

2.2. Description of the Models

Several models have been developed for studying ecosystem services, including water yield and sediment retention. One of the recently developed tools that is gaining popularity among researchers is InVEST [27,28]. InVEST is a public domain tool consisting of 18 ecosystem service and support models [29]. It is designed to assess ecosystem service changes due to development interventions. The ultimate goal of InVEST is to make informed decisions about the management of natural resources such as water and soil. The main advantages of the InVEST tool include ease of use, simple structure, acceptance of globally available remote sensing data, generation of spatially explicit outputs, and flexibility of data requirements. Therefore, this tool is particularly useful in Africa, where model input data are scarce. InVEST Annual Water Yield and Sediment Delivery Ratio models were used in this study.

2.2.1. Annual Water Yield (AWY) Model

The AWY model consists of two components: the biophysical component, which estimates and maps the water yield of a diverse landscape, and the valuation component, which calculates the water provisioning capacity for people. The biophysical component adopted for this study attracts researchers in hydrology [30]. It is based on Budyko’s theory and average annual precipitation [31]. The AWY of a landscape at the pixel level, the results given at the watershed or sub-watershed level, is determined using annual precipitation and actual evapotranspiration as follows [29].
y x = 1 AET x p x × p x
where AET(x) and p(x) are the annual actual evapotranspiration (mm) and precipitation (mm) at pixel x, respectively.
For vegetated landscapes, the InVEST AWY model uses Equation (2), formulated by Zhang et al. [32] and Fu [33], to calculate the evapotranspiration intercept of the annual water balance by including ω, a catchment parameter.
AET x p x = 1 + PET x p x 1 + PET x p x ω 1 / ω  
where PET(x) is the potential evapotranspiration (mm) and ω is a non-physical parameter that depends on soil and climatic factors that determine the disentanglement of precipitation into runoff and evapotranspiration [30]. A watershed with a large ω-value can efficiently convert precipitation into evapotranspiration and vice versa.
PET is calculated as follows:
PET x = Kc x × ETo x
where Kc x is the vegetation evapotranspiration coefficient at each pixel associated with LULC and ETo is the reference evapotranspiration of pixel x .
To partition the effects of rainfall frequency, soil depth, and other hydrological factors, the parameter ω is further calculated using the formula of Donohue et al. [34].
ω x = Z AWC x P x + 1.25
where Z is a seasonality factor that captures the precipitation and additional hydrogeological characteristics of the watershed at the local scale. AWC is the available water content of the plants (mm).

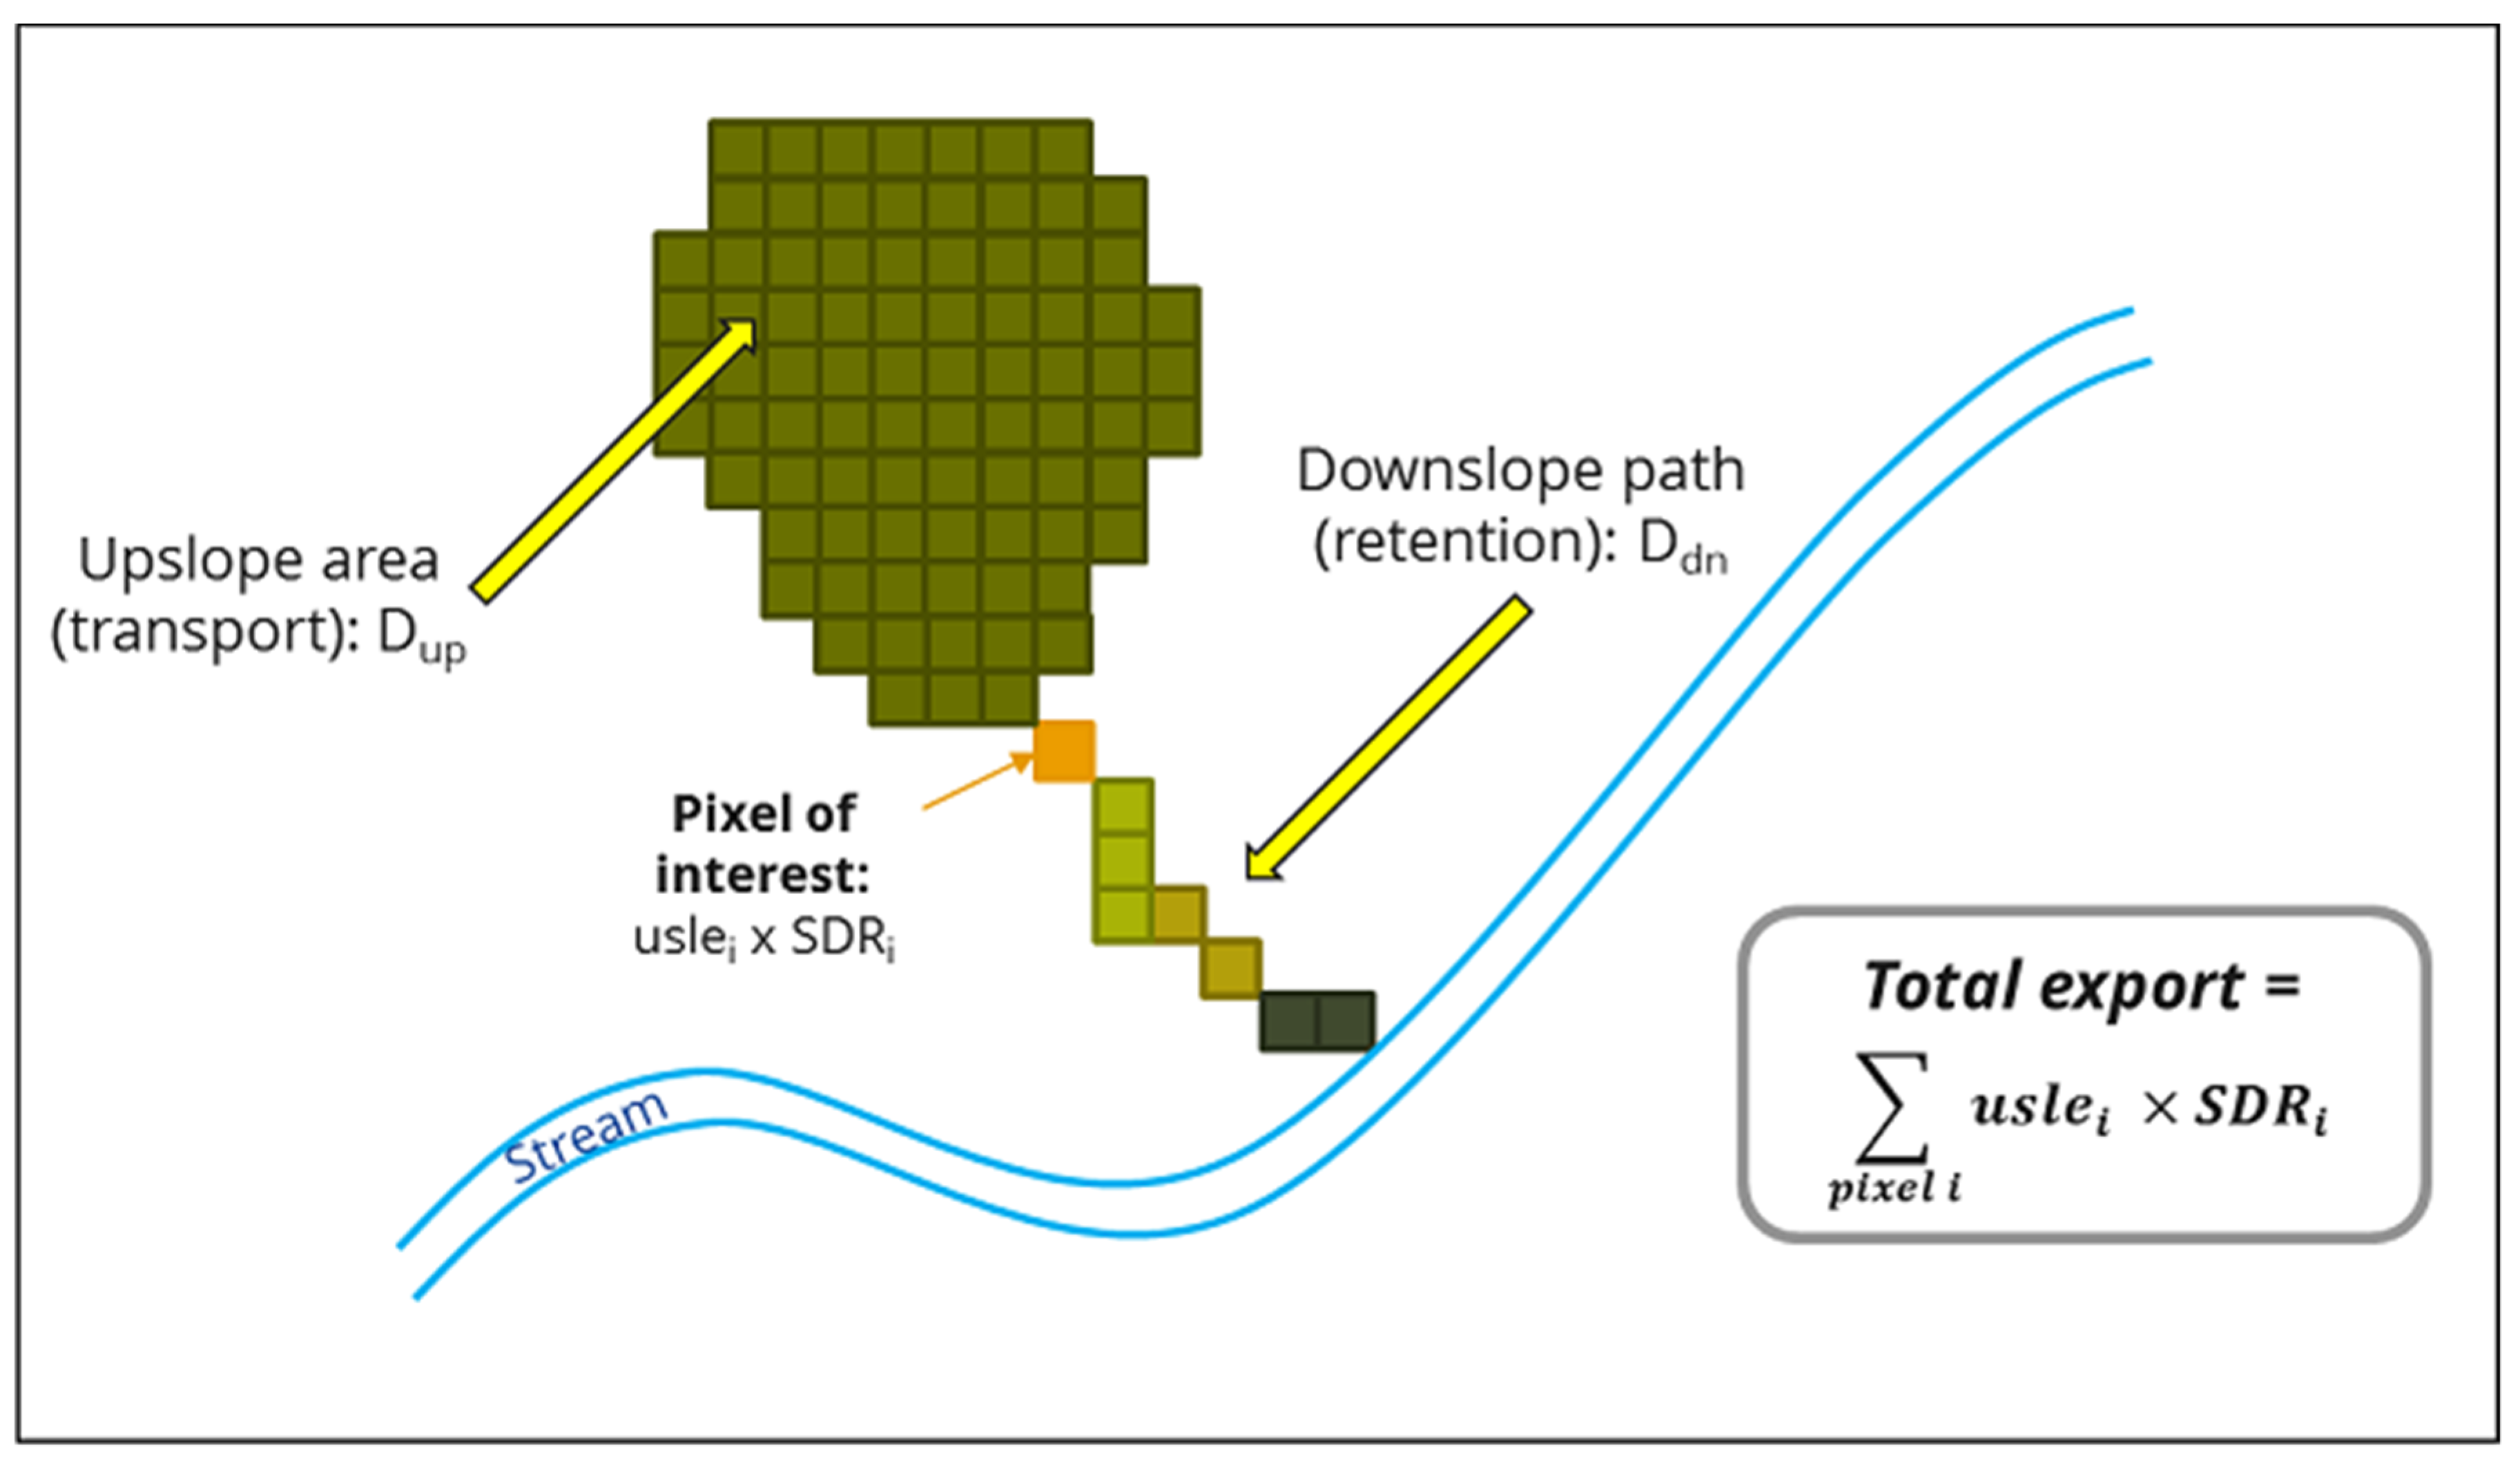
2.2.2. Sediment Delivery Ratio (SDR) Model

The SDR model aims to quantify and map soil loss over land, sediment yield, and retention performance of a watershed, especially in rural areas, which is essential for water quality and reservoir management [35]. The model first estimates annual soil loss or eroded sediment and then the amount of sediment that reaches the river before it leaves the watershed (SDR). Finally, the model calculates sediment export by multiplying the soil loss by the SDR that actually reaches the outlet of a given geographic area, following an approach proposed by Borselli et al. [36] and Cavalli et al. [37].
The SDR model uses the Revised Universal Soil Loss Equation (RUSLE) proposed by Renard et al. [38] to calculate the amount of mean annual soil loss over land or sediment at pixel i (ton·ha−1·yr−1) as follows:
usle i =   R i ×   K i ×   LS i ×   C i ×   P i
where R i is the erosivity of precipitation (MJ·mm (ha·hr)−1), K i is the erodibility of soil (ton·ha·hr (MJ·ha·mm)−1), LS i is a slope length–gradient factor, C i is a factor for crop management (unitless), and P i is a factor for support measures (unitless).
Before calculating the SDR factor, the model calculates the index of connectivity (IC), which is a function of the landscape above the pixel of interest ( D up ) and the downslope area between the nearest sink and the pixel ( D dn ) [36]. Both IC and SDR factors are also a function of slope and the C-factor, as shown in the following equations [39].
Ic = log 10 D up D dn
where ( D up ) is the section of the landscape above the pixel of interest, defined as
D up = CS ¯ A
where A is the uphill area (m2) determined by the D-infinity flow direction algorithm [40],   C ¯ is the average C-factor of A, and   S ¯ is the average slope gradient of A (m/m).
The downhill portion of the landscape D dn is further broken down as
D dn = i d i C i S i
where d i is the length of the flow path (m) (see Figure 2).
Following the calculation of IC, the SDR factor can be calculated as follows:
S D R i = S D R M a x 1 + e x p   I C 0 I C i k b
where I C 0 , k b , and S D R M a x are parameters of the SDR model [39,42].
The sediment yield of the landscape at the pixel level is estimated as the product of SDR and soil loss.
s e d _ e x p o r t i = u s l e i × S D R i  
Finally, the total annual sediment export or yield from overland erosion (tons·ha−1·yr−1) is the aggregation of pixel-level sediment yields across the landscape used to calibrate the model and validate the result in combination with other available sediment sources [29].

2.3. Data Sources

The InVEST AWY and SDR models require biophysical and tabular input data. These include climate, soil, land use, and environmental parameters.

2.3.1. AWY Model Input Parameters

The most important parameters for water yield change are precipitation and evapotranspiration. Climate Hazards Group InfraRed Precipitation with Station data version two (CHIRPS—v2.0) was selected for this study [43,44]. CHIRPS v2.0 was chosen for its best performance in the study area [45]. Ready-made, high spatio-temporal resolution and freely available ETo data are available through the TerraClimate dataset, which was used in this study [46]. The TerraClimate dataset is recommended for ecological and hydrological studies [47].
Site factor input parameters are required for the AWY model, including the plant available water content (PAWC), depth of the root-limiting layer, and root depth. The PAWC and the depth of the root-limiting layer were calculated using a weighted average of AWC classes and reference soil depth, respectively, from the Harmonized World Soil Database (HWSD) version 1.2 [48,49], whereas root depth was estimated according to Canadell et al. [50]. Parameter Z, which informs about the hydrological characteristics and rainfall patterns of the site, is also required by the AWY model. The calibration method was used to determine the Z parameter following Hamel and Guswa [30].
Land Use and Land Cover (LULC) raster data are essential inputs to all spatially explicit water balance models. Annual LULC data of the BNR basin from 1992 to 2020 with a spatial resolution of 300 m were obtained from the Climate Change Initiative of the European Space Agency [51]. The data were reclassified into 11 classes. For each LULC class, model information such as land use code, land cover type, root depth, and plant evapotranspiration coefficient (Kc) is required in a table. The coefficients were calculated using the method developed by Allen et al. [52]. Root depths of the different land covers were determined according to Canadell et al. [50].

2.3.2. SDR Model Input Parameters

RUSLE factors, Borselli parameters, maximum SDR value, Digital Elevation Model (DEM), LULC, biophysical table, and watershed are the required input data for SDR model simulation. The input parameters were prepared according to the format of data needed for the SDR model.
One of the critical RUSLE factors is erosivity®, which is a function of rainfall duration and intensity [29]. It captures the ability of rainfall to cause soil erosion [53]. Although the original RUSLE requires rainfall intensity data recorded on the ground to estimate R, it is unlikely that ground data would be found in the study area. Therefore, the empirical equation was used to calculate R based on precipitation total (p, mm) [54]. The equation was developed for the BNR basin and used in many studies [23,27].
R = 0.562 P 8.12
Soil erodibility (K) measures the degree of erosion and transport of a soil particle by rainwater [55]. The main factors determining K are soil texture and organic matter, but structure and permeability also play their part [56]. In data-poor regions such as the BNR basin, data on structure and permeability are not available. Therefore, the K-factor was estimated using soil organic matter and texture based on the recommendation of Sharp et al. [41].
The SDR model applied the algorithm developed by Desmet and Govers [57] to calculate the LS factor from DEM. Although Zhu et al. [58] pointed out the sensitivity of this algorithm to the resolution of DEM, it performed well at a resolution of 30 m [59]. Therefore, DEM data with a spatial resolution of 30 m were used and obtained from the USGS web portal (https://earthexplorer.usgs.gov/, (accessed on 6 April 2022)).
The SDR model requires a biophysical table consisting of C and P factors corresponding to each land use class of the LULC grid (Table S1). The P factor considers the effects of different land use management practices (contour farming, terracing, earthen berms, etc.) relative to upslope and downslope farming on soil loss from water erosion, whereas the C factor considers the effects of crop management and land cover relative to bare soil on soil erosion from surface runoff [38]. For the C and P factors, local values were obtained from previous studies in the study area [23,60].
Before estimating the flow accumulation threshold, the flow accumulation raster of the BNR basin was created using ArcGIS software 10.5 (Hydrology Tool). The stream map from the Abay Basin was overlaid to determine the optimal threshold. Values between 500 and 1300 were determined for intermittent and perennial stream networks, respectively. For the first run, we used the lower threshold because soil erosion occurs during the wet season [35]. Finally, 1100 was determined as the optimal flow accumulation threshold value.

2.4. Calibration and Validation

Although Sharp et al. [41] suggested that I C 0 , k b , and S D R M a x are calibration parameters of the SDR model, we only used k b to calibrate the model [42] because I C 0 is site-independent and S D R M a x is recommended in complex models. The relative difference between the reference data and the estimated value (model bias) was calculated to calibrate the model and validate the result following the work of Hamel et al. [35] for the Abay Basin (see Figure 1), which consists of the seven sub-watersheds of the BNR basin, by using Zonal Statistics Tool embedded in ArcGIS 10.5. After the initial calculation of the average bias, several adjustments were made to the k b value until the optimal bias value (1.00) was reached. The k b value (1.36) obtained through rigorous calibration gave a sediment yield of 128.3 million tons (Mt)/year for the Abay Basin in 1992. Ali et al. [61] reported that the measured annual sediment yield at the station El Deim, the outlet of the Abay Basin, was 128 Mt/year in 1992 and 1993. The value for the bias between the model result and the reference data was 1.002, which is very close to the ideal value of the bias (1.00). Thus, the model and input parameters were appropriate for the BNR basin.
Calibration of the AWY model is also critical to reducing the model’s bias on water yield. The model bias was used to compare the model output with reference data. The source of the reference data, calibration parameters, and more details on the calibration processes can be found in our previous work for the Abay Basin [31].

3. Results

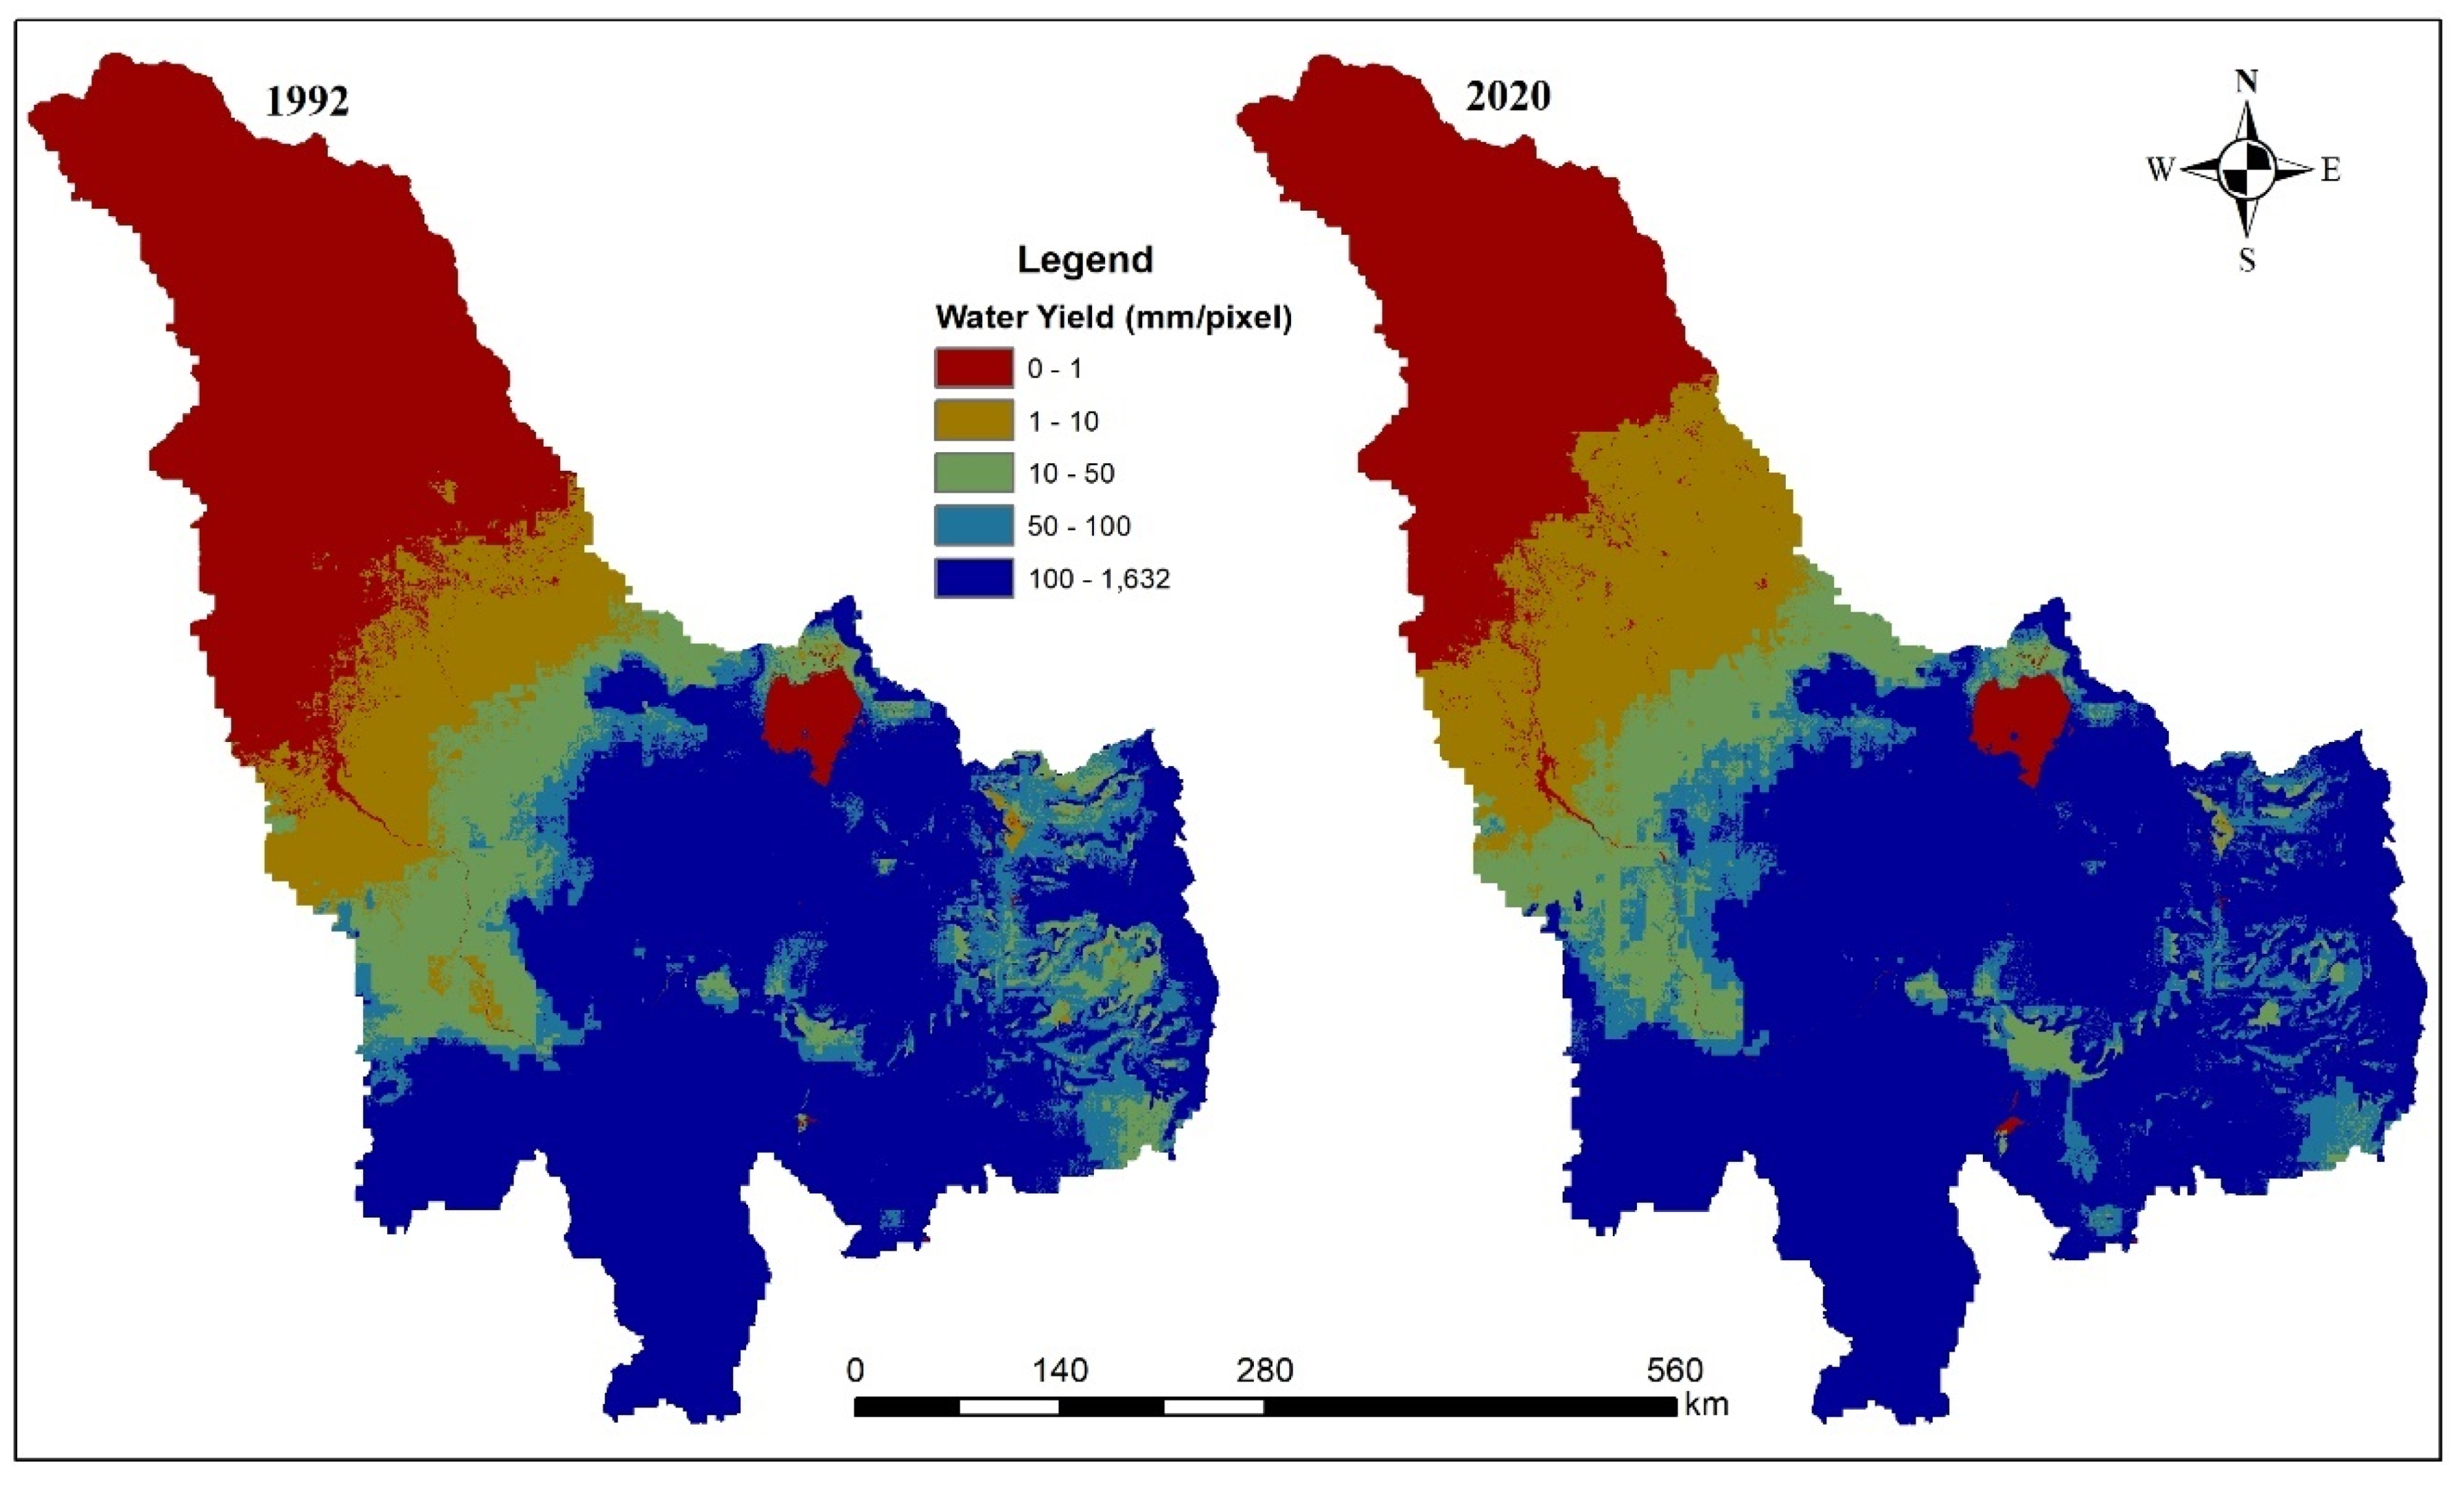
3.1. Spatio-Temporal Dynamics of Water Yields

Spatially explicit water yield simulations and mapping were conducted to investigate the temporal and spatial variation of water yield in the BNR basin from 1992 to 2020. The annual water yield at the outlet of the study basin in Khartoum was 48.26 billion cubic meters (bcm) in 1992, 52.53 bcm in 2000, 51.89 bcm in 2010, and 57.83 bcm in 2020 (Table 1). Further analysis of the four results showed that the annual water yield has been subject to significant interdecadal variations over the last 30 years. Linear trend analysis showed that water yield increased by 3 bcm each year between 1992 and 2020. However, in the second study period (2000–2010), there was a slight decrease in water yield. This could be related either to the decrease in rainfall or to the adoption of water conservation practices in the Ethiopian Highlands [26]. Water yield, which decreased slightly in 2010, increased by 5.94 bcm in 2020. This implies that water yield is likely to increase in the future.
Water yield in the BNR basin showed significant spatial variations between 1992 and 2020. A closer look at Figure 3 shows that water yield varied from 0 mm in Sudan to 1632 mm in Ethiopia. Further analysis showed that the northern part of the basin was dry and the southern part was wet throughout the study period. The Didesa and Dabus sub-basins, which constitute only 14% of the BNR basin, contributed 40% of the total annual flow of the BNR (22.86 bcm) in 2020. However, the Rahad and Dindar sub-basins contributed only 2.64 bcm in the same year, despite comprising 25% of the BNR basin. This means that most of the water yield of the BNR basin comes from the Ethiopian highlands in general and the southwestern part of the basin in particular.

3.2. Spatio-Temporal Dynamics of Soil Loss and Sediment Yields

Spatially explicit estimates and mapping of soil loss and sediment yield were carried out to quantify soil loss and sediment yield and examine their temporal and spatial changes in the BNR basin from 1992 to 2020.

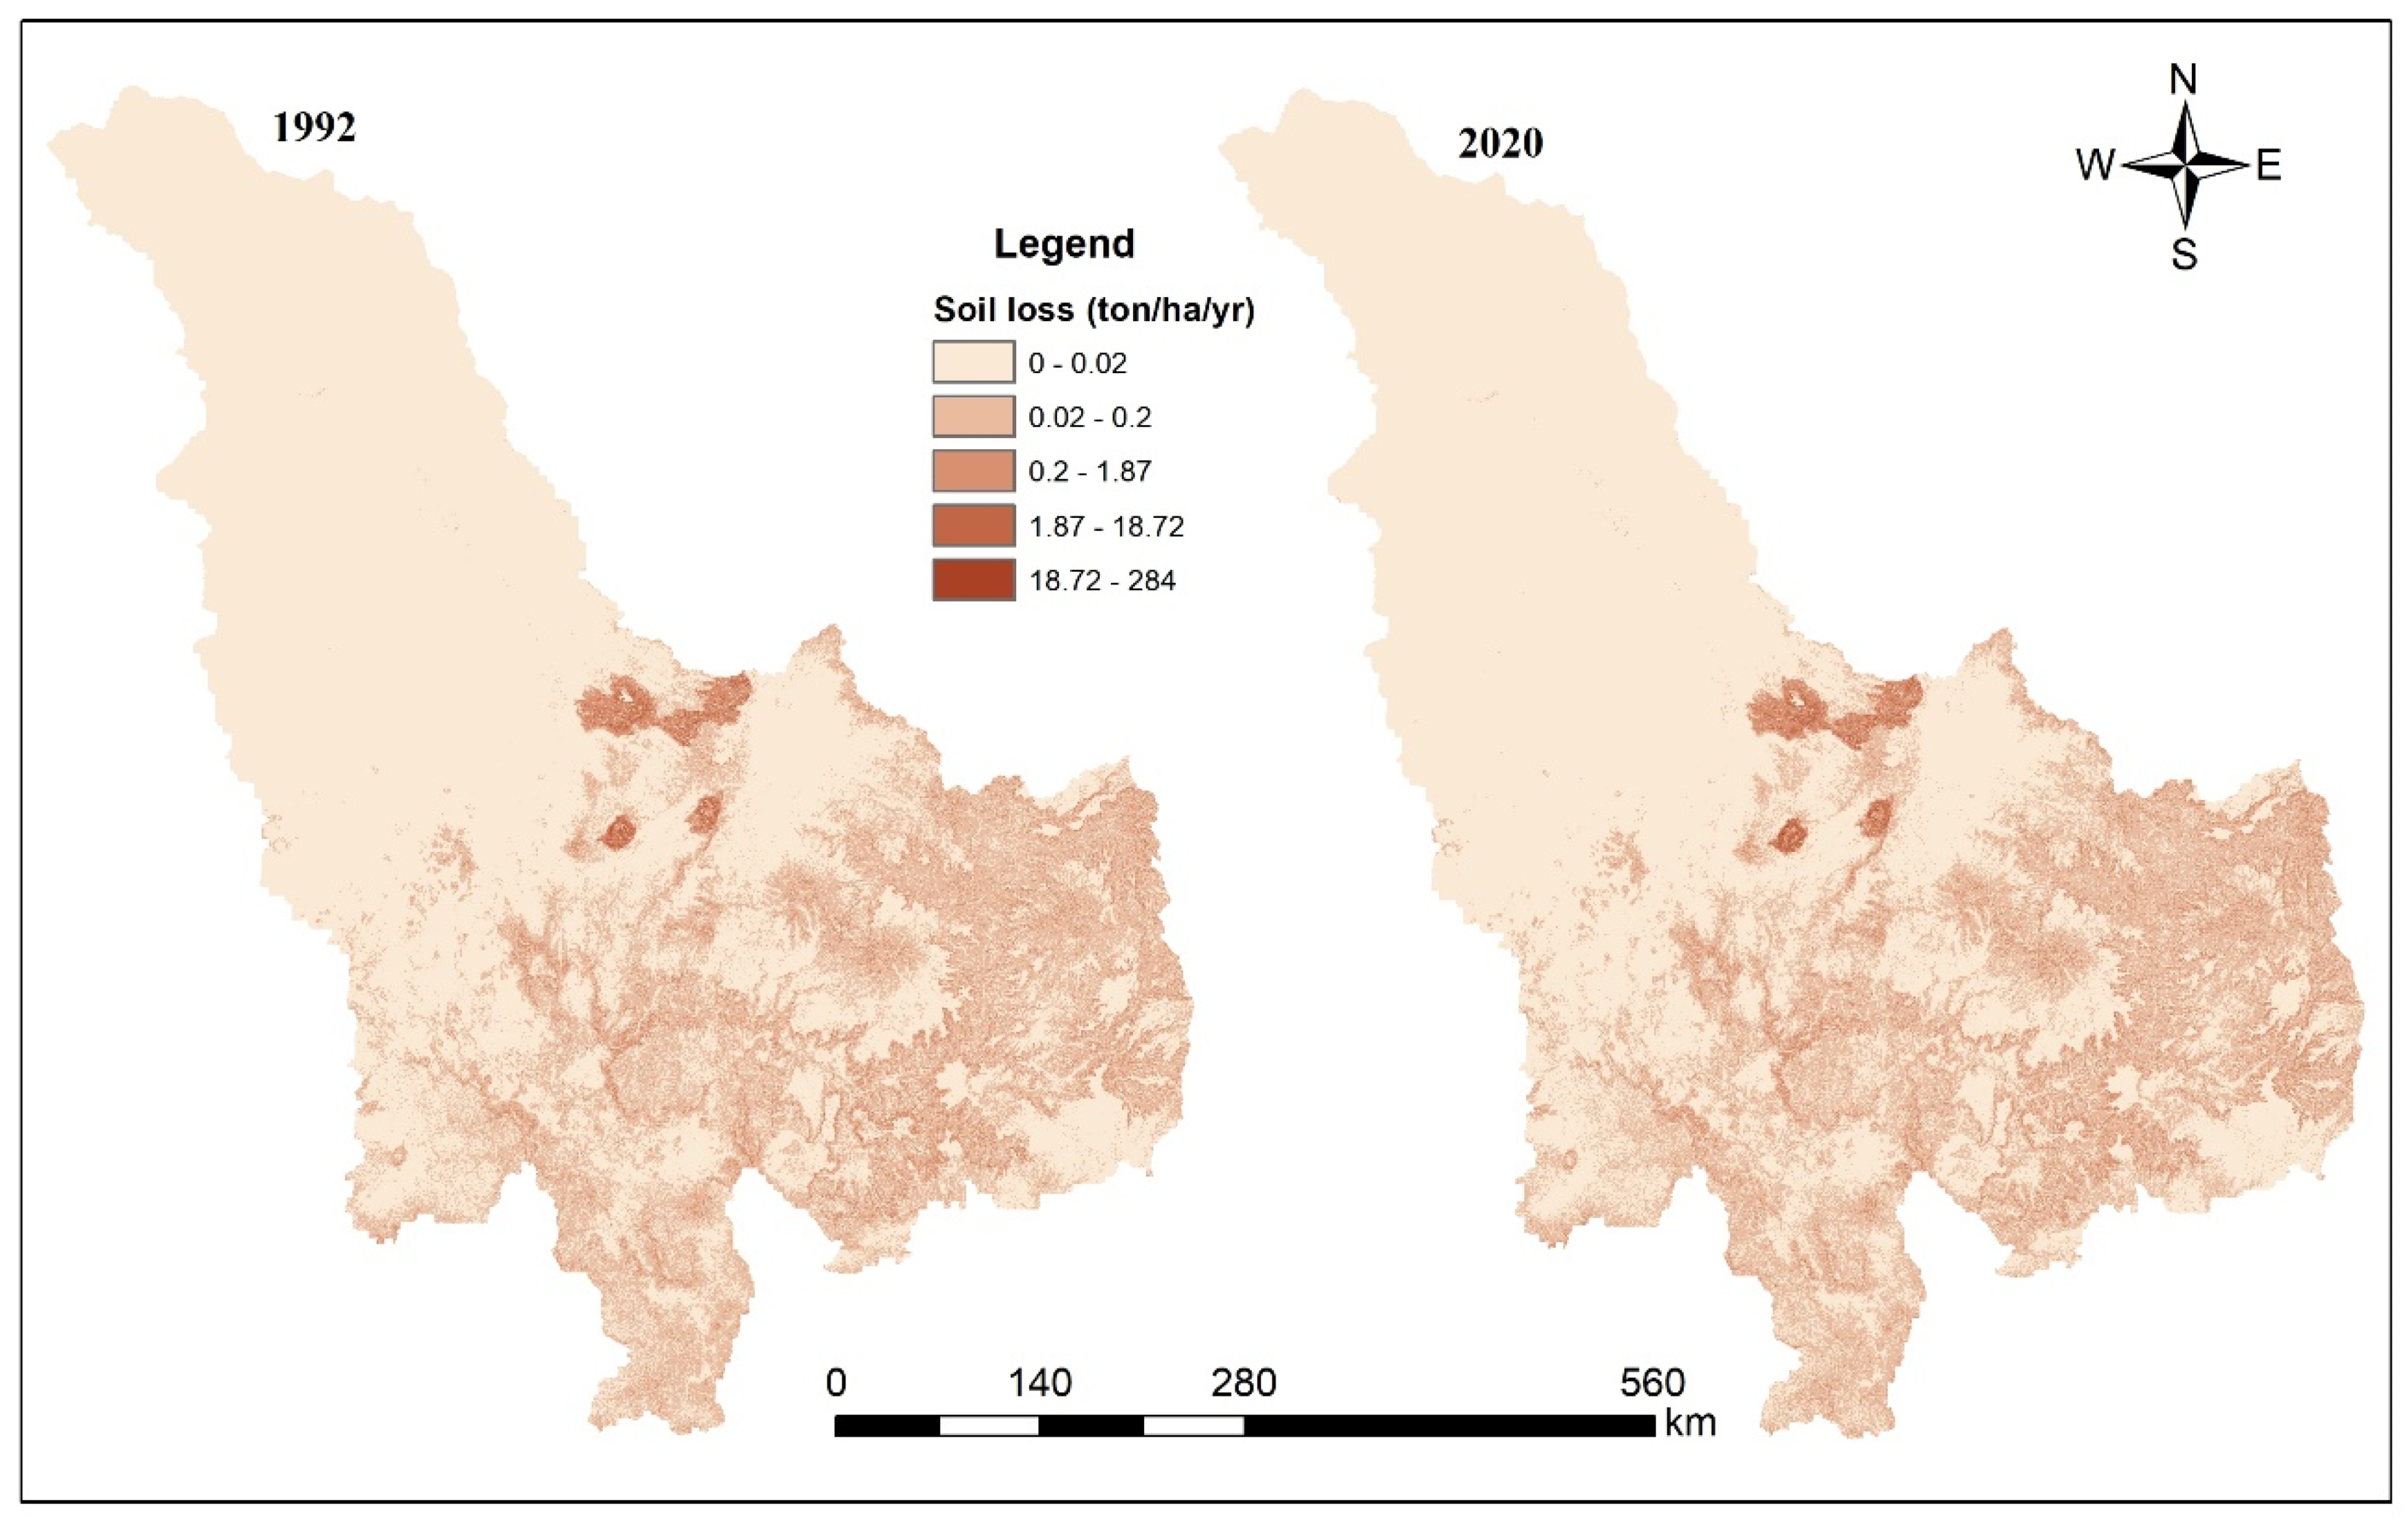
3.2.1. Dynamics of Soil Loss

Potential soil loss increased significantly from 1992 to 2020. The simulated soil loss of the BNR basin increased from 1316 Mt in 1992 to 1413 Mt in 2020, but there was no significant change between 2000 and 2010. It was 1393 Mt in 2000 and 1374 Mt in 2010. These results are consistent with the findings of Moges and Bhat [62] in the upper BNR basin. The mean annual soil loss between 1992 and 2020 was 1373 Mt/year, which is 68.4% of the annual soil loss in Ethiopia (1900 Mt) reported by the FAO [63]. In the same report, soil loss from cropland (11.7 million ha) was reported as 1520 Mt, which is close to our 1992 estimate (bias = 0.87). This represented 86.7% of the soil loss for all of Ethiopia (1493 Mt), as reported by Hurni [64].
Our spatially explicit mapping showed that soil loss varied spatially in the BNR basin. It ranged from 0 around the outlet of the basin to 284 ton·ha−1·yr−1 in the upstream area, with an average value of 31.42 ton·ha−1·yr−1 for the whole basin. The intensity of soil erosion decreased from south to north (Figure 4). At the country level, the largest hotspots for soil loss were in Ethiopia, which is predominantly characterized by a steep slope compared to Sudan. A low slope characterizes the Sudanese part of the BNR basin (see Figure 1). We found that the major hotspots for soil loss were found in the mountains and gorges, including Choke Mountain in Gojam, Guna Mountain in South Gondar, Molle Mountain in South Wello, and Abay Gorge in North Shewa, West Shewa, Horo Guduru, and Gojam administrative zones, respectively, of Amhara and Oromia regional states in Ethiopia.

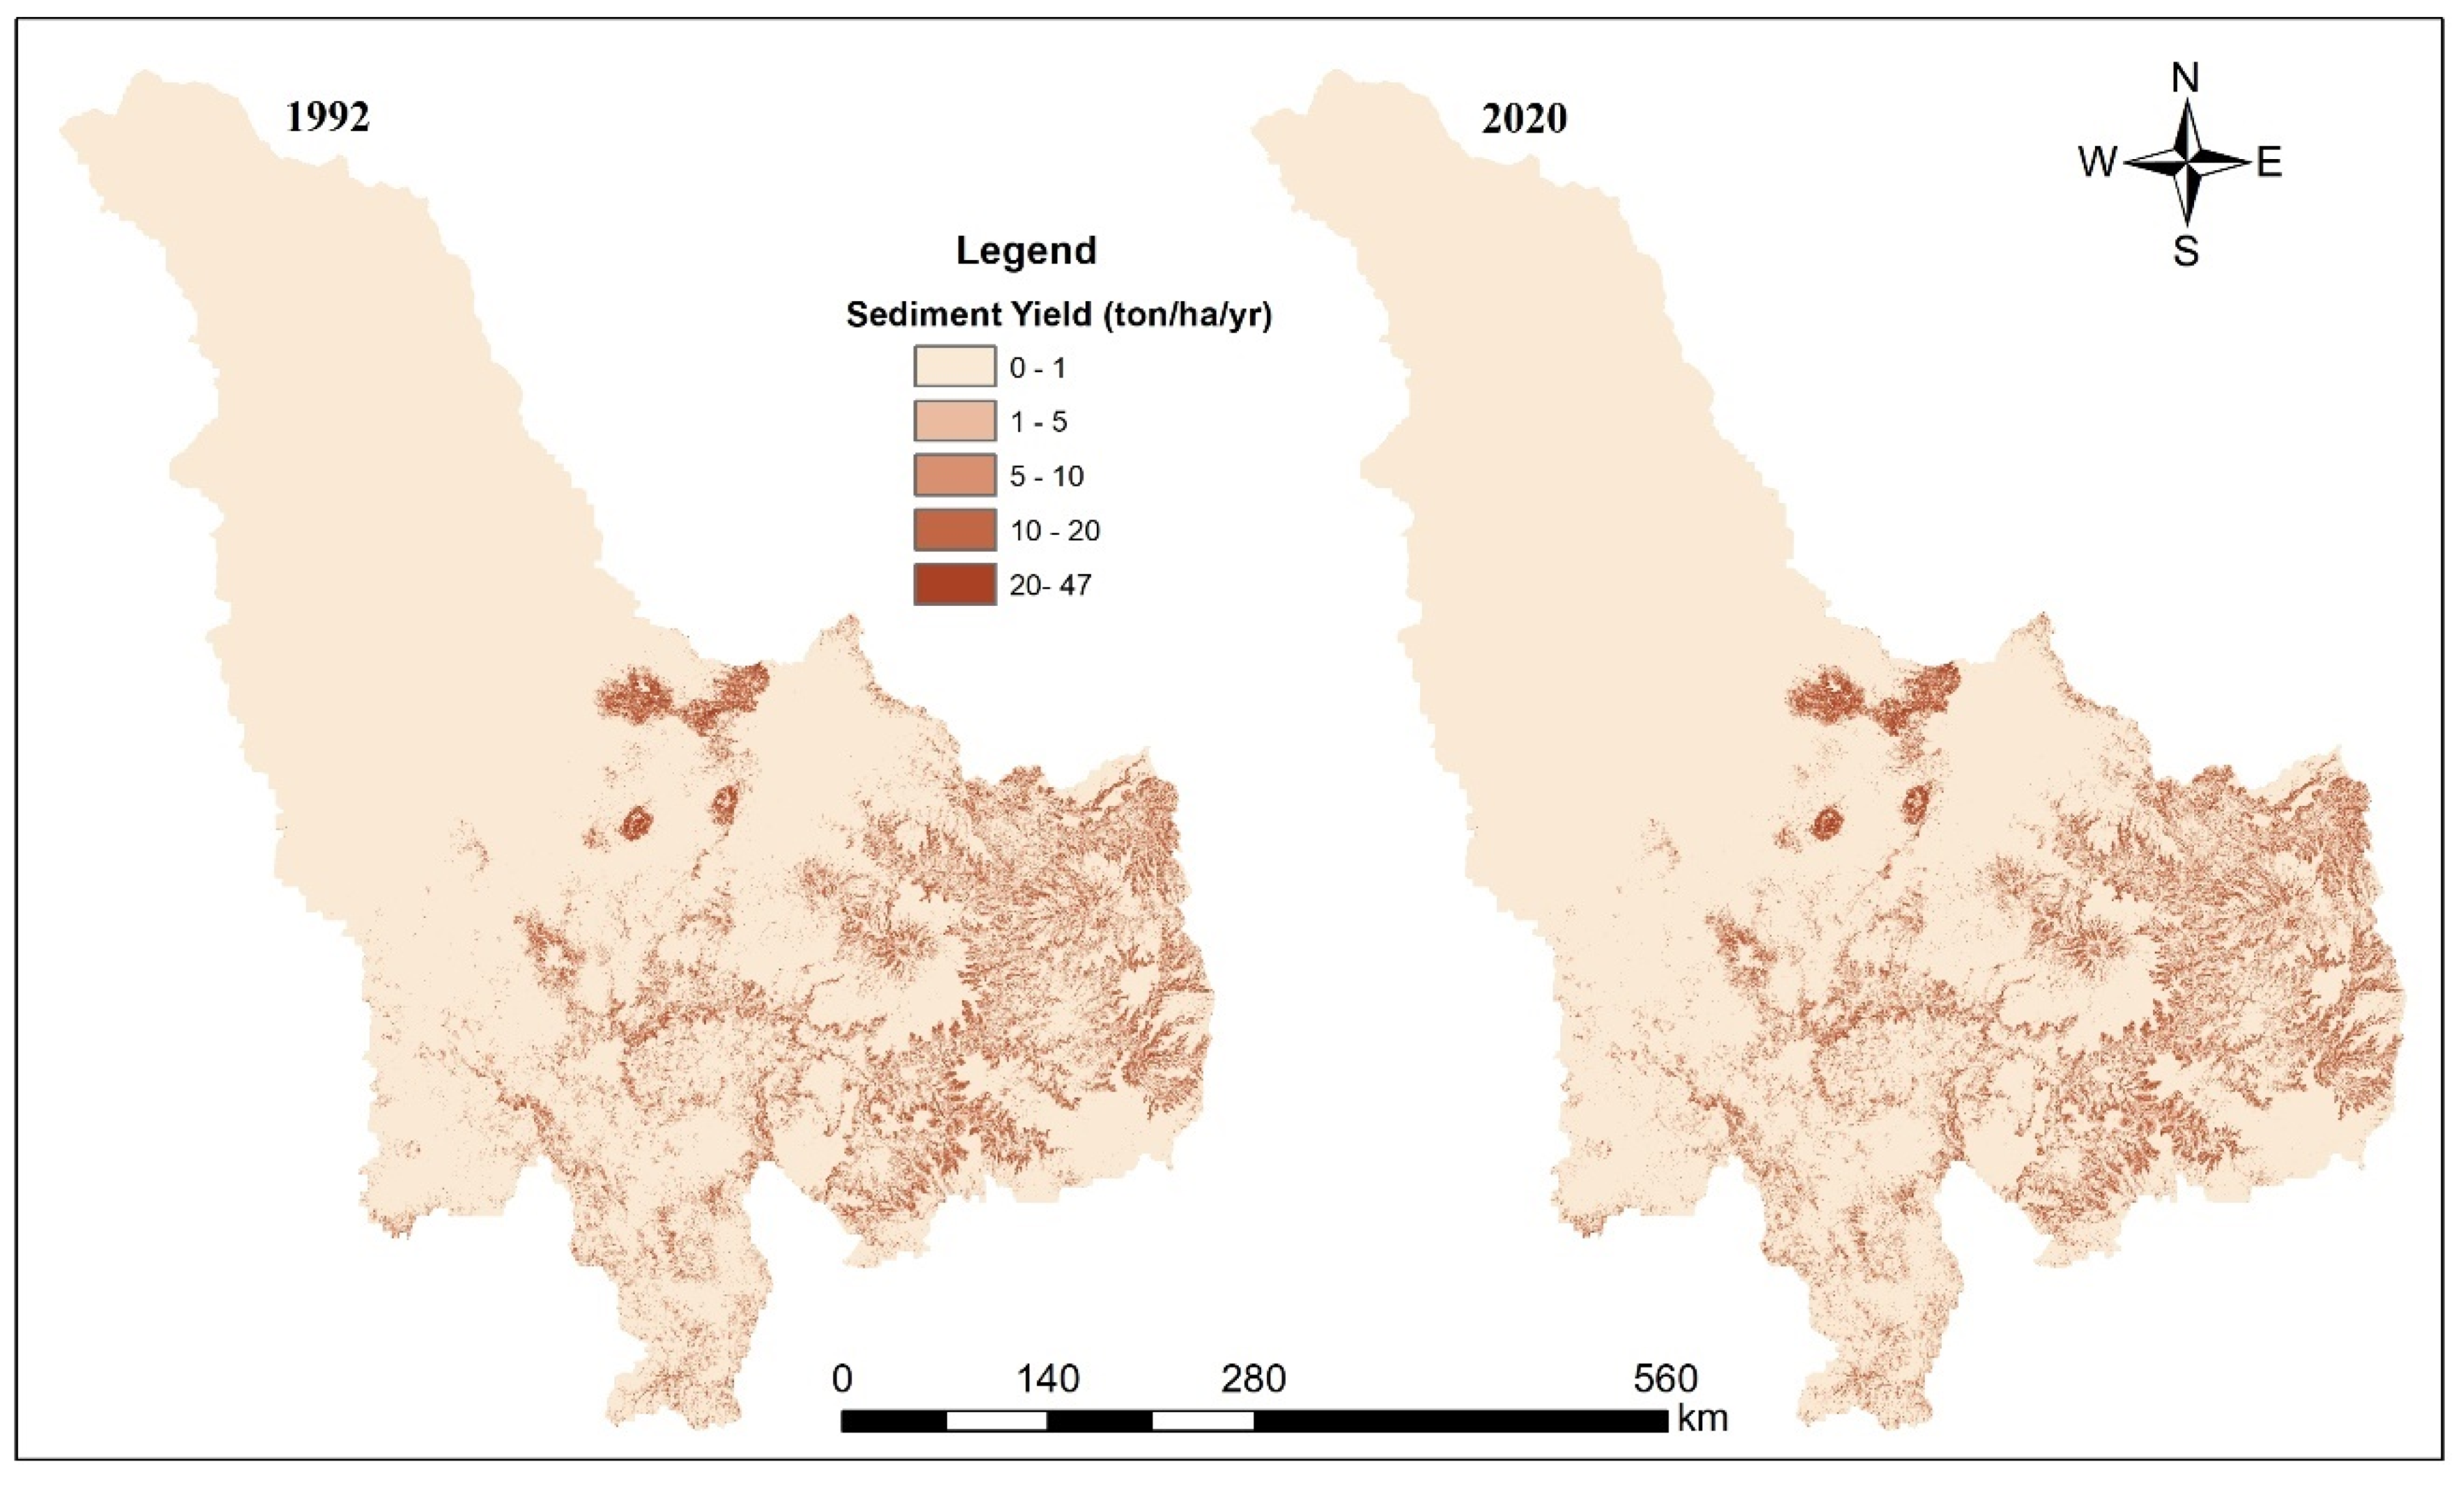
3.2.2. Sediment Yield Dynamics

Between 1992 and 2020, there was an interdecadal variability in sediment yield. The annual sediment yield increased from 135 Mt in 1992 to 145 Mt in 2020. Like the trend in soil losses, sediment export also declined slightly from 143 Mt in 2000 to 142 Mt in 2010. The result suggests that the temporal trend in sediment yield is consistent with the trend in soil losses. These results are in agreement with those of Gebremicael et al. [65], who also reported that sediment yield increased from 91 Mt/yr in 1980–1992 to 147 Mt/yr in 1993–2009 and did not change between 2002 and 2007 in the upper BNR basin. The average annual sediment yield (141 Mt) was also within the range of 140 ± 20 Mt reported by Garzanti et al. [66] for the BNR basin.
Consistent with the spatial pattern of soil erosion, the sediment yield ranged from 0 to 47 tons·ha−1·yr−1 with an average value of 3.9 for the BNR basin and 6.29 for the Abay Basin. This means that almost 10% of the eroded soil or 128 Mt/yr and 141 Mt/yr left Ethiopia and the BNR basin, respectively. These estimates are very close to the 10% reported by the FAO [63] but lower than the 30% reported by Hurni [54] for Ethiopia. The largest contribution to sediment yield was from Wollo, South Gondar, North Shewa, West Shewa, Gojam, Horo Guduru, and East Wellega, located in the Highlands of Ethiopia (Figure 5). The contribution of the areas in Sudan was negligible. At the sub-watershed level, the highest sediment yield was generated from Beshilo, Tana, Jemma, Muger, Guder, Gojam, and Welaka, which are located in the southwestern part of the BNR basin.

3.3. Contributions of Land-Use Type for Water and Sediment Yields

There was a noticeable difference in the contribution of each land-use type to water yield. The maximum rate of water yield was generated from mosaic cropland, ranging from 260 mm in 2010 to 278 mm in 2020. The second-largest water yield rate was observed in woodland or pastoral area between 1992 and 2010. However, unlike the other land-use type, the water yield rate in woodland showed a sharp increase from 234 mm in 1992 to 280 mm in 2020. The water yield rate in 2020 from the pastoral area (280 mm) was the highest single result in the study period. The lowest rate of water yield was recorded from water bodies (0.66 mm), followed by grassland (3.74 mm). Although the water yield rate of the urban area ranged from 142 mm to 168 mm, its contribution to the total water yield was insignificant due to its low area coverage in the basin (733 km2 in 2020). This implies that apart from the water yield rate, the size of the land use type has a significant effect on water yield. Therefore, cropland, mosaic natural vegetation, woodland, and shrubland contributed to the lion’s share of the water yield in the BNR basin (Table 2). The contribution of grassland was insignificant despite its large size, nearly 20,000 km2.
As shown in Table 2, the sediment yield rate varied across time and land-use type. The maximum sediment yield rate was 6.94 tons·ha−1·yr−1, recorded from mosaic natural vegetation in 2020, but the average sediment yield rate from mosaic natural vegetation and mosaic cropland was 6.44 tons·ha−1·yr−1 between 1992 and 2020. The second-largest average sediment yield rate was observed in woodland or pastoral area (5.2 tons·ha−1·yr−1), followed by cropland (3.85 tons·ha−1·yr−1) and shrubland (1.44 tons·ha−1·yr−1). The contributions of grassland, forest, wetland, urban area, bare area, and water bodies to sediment export were insignificant, ranging from 0.52 tons·ha−1·yr−1 over the wetland to 0 tons·ha−1·yr−1 over the water bodies. Their contribution was insignificant because of their low sediment export and their small share of the BNR basin (3.2%).
The most unexpected aspect of the result was the low mean sediment export from cropland compared with woodland and mosaic natural vegetation. A huge number of studies in the study basin reported that cropland had the highest sediment yield export rate. For example, Hurni [67] reported the highest soil loss from cropland in the Upper BNR basin (300 tons·ha−1·yr−1). Similarly, Moges and Bhat [62] found that cropland has the highest soil erosion in the Rib watershed (41 tons·ha−1·yr−1). Interestingly, our result was related to the slope of land use. Nearly half of the BNR basin (44%) located in Sudan and Ethiopia (Dinder and Rahad sub-basins) contributed only 6.7 (5%) of the total BNR basin sediment export in 1992 due to its low elevation (<1500 m a.s.l). Although some soil erosion occurs in the Sudanese part of the BNR basin, only a small amount of this eroded soil reaches to the rivers [10].

4. Discussion

The clearest result of the study was that the water yield showed both spatial and temporal variations between 1992 and 2020. Spatially, the upper part of the basin produced the lion’s share of the water yield. In contrast, the contribution of the lower part of the basin to the total water yield was negligible, although it covers almost half of the study area. A comparison of the water yield map with previous studies in the BNR basin confirms that the Ethiopian Highlands is the major producer of water yield [10,31,68]. Moreover, the annual water yield increased over time despite its interdecadal variations. For example, water yield increased from 51.89 bcm in 2010 to 57.83 bcm in 2020. This result may be explained by an increase in rainfall both in intensity and quantity. The other possible cause could be the deterioration of land cover due to high population pressure. Therefore, increasing land cover degradation coupled with increasing rainfall trends leads to high runoff. This highlights the need for runoff control mechanisms.
Furthermore, the water yield of the BNR basin at the outlet, Khartoum, was much lower than that of the Abay Basin. For instance, it was 57.83 bcm in Khartoum and 89.08 bcm at the Ethio-Sudan border, including the Rahad and Dinder sub-catchments of the Abay Basin. This result is in line with expectations and previous research findings [10]. The reduction in water yield at the outlet was largely due to transmission loss. The long-term average annual potential evapotranspiration ranges from 1294 mm in the Abay Basin to 3377 mm in Khartoum. According to Sutcliffe and Parks [69], the annual transmission loss was estimated to be 2.5 bcm between Khartoum and Roseires Dam. This result may help policymakers and water managers to identify the best location for water storage to overcome water scarcity.
In terms of the main sources of sediment and delivery, the higher elevation areas in Ethiopia were the main sources of sediment yield, consistent with the pattern of water yield. For example, the mean sediment yield between 3300 and 4261 m a.s.l. was 9.4 tons·ha−1·yr−1, whereas areas below 1000 m a.s.l. it generated 0.27 tons·ha−1·yr−1, mostly located in Sudan. This implies that altitude and sediment yield have a direct relationship. Another important factor was land cover. The highest sediment yield was recorded in mosaic natural vegetation and mosaic cropland. However, contrary to previous findings [23,27], woodland contributed the most to sediment yield, followed by cropland. This result was attributed to the size of land use. Therefore, sediment yield was a function of land-use type and size, as well as slope characteristics. These results have important implications for identifying priority areas for soil conservation measures.
The Abay River yielded 128.3 Mt of sediment in 1992 and 54.6 bcm of water in 2020 at the GERD site. Both sediment and water yields showed an increasing trend during the study period, which also suggests a higher probability of a further increase in the future. Therefore, it can be assumed that water and sediment yields will increase in the future. Sedimentation has unprecedented consequences in Ethiopia, Sudan, and Egypt [23]. Sedimentation of water infrastructures such as reservoirs and irrigation canals is reducing hydropower generation, drinking water, and crop production, and increasing flood risks in Sudan. For example, Sennar Dam lost 28% of its dam capacity between 1925 and 1981 and 43% between 1981 and 1986 [70]. In total, 71% of the Sennar reservoir has been lost. The same authors also reported that the Roseires reservoir, located near the GERD, lost 0.427 bcm between 1985 and 1992, which is almost 14% of its original capacity. The construction of the GERD has an obvious impact on sediment export and water flow. It will regulate water flow and restrain sediment discharge.
The final part of this study was to assess the impact of the GERD on water flow and sediment export in the Eastern Nile riparian countries. Countries are encouraged in the structure of the 2030 Agenda to build hydropower plants to increase renewable energy and water supply [4]. The construction of the GERD has indeed caused concern and controversy among countries. The results of this study show that the annual water yield increased over time and the transmission loss of water was much lower at the GERD site than at the downstream sites. Since the primary objective of the GERD is to generate hydropower, it will not consume water. Overall, the GERD will not reduce water flow except during prolonged drought [71]. When completed, the GERD will sink nearly 90% of the annual BNR sediment yield, which will shorten its life expectancy. This estimation is consistent with that of Tesfa [72], who reported that the GERD will intercept 86% of the sediment yield. Thus, the GERD could serve as a sediment trap and water storage for Sudan and Egypt, which will protect them from flooding, pollution, and sedimentation. However, the fertility of the soil in Sudan is likely to decrease. Although the contribution of the GERD to the 2030 SDGs is undisputed, the impacts of changes in water and sediment yield remain unanswered. Further studies are needed to quantify the impact of changes in water and sediment yield due to construction of the GERD on sustainable development beyond the national boundary and the 2030 SDGs.

5. Conclusions

The primary objective of this study was to investigate the water and sediment balance of the BNR basin and identify the spatio-temporal variation in sediment and water yields along with the construction of the GERD. The results show significant spatio-temporal variation between 1992 and 2020 in the BNR basin. The linear trend analysis showed that the amount of water and sediment yield increased significantly. For example, the amount of water yield increased by 3 billion m³ each year. The spatial mapping of water and sediment yields showed that the lion’s share of both yields came from the southern part of the basin, which is located in Ethiopia. Specifically, the highest water yield was produced in the Didesa and Dabus sub-basins in the southwestern part of the BNR basin. Consistent with the pattern of water yield, the main source of sediment yield was the southern part of the BNR basin: Beshilo, Tana, Jemma, Muger, Guder, Welaka, and some parts of Gojam.
The spatial variation in water and sediment yield was largely associated with the slope and land-use types of the basin. Elevated areas with cropland and pasture use were the main sources of water and sediment yields. The most obvious implication of these results is that most of the water and sediment yields are produced above the GERD construction site. The GERD will serve as a water storage and sediment sink. For example, our analysis showed that nearly 90% of the annual sediment yield comes from upstream of the GERD. With the current soil erosion rate, the GERD will not serve its intended purposes. Therefore, urgent soil and water conservation measures and proper implementation of land-use policies in the upstream areas are needed. The GERD will have a positive impact on the 2030 SDGs by providing clean and reliable energy. However, the impact of the GERD on the SDGs may likely be different if we consider longer periods and different environmental contexts.
Although the GERD will serve as a water reservoir and sediment sink for downstream countries, the current rate of sediment yield in the Abay Basin will shorten the life of the GERD itself. Hence, elevated areas with cropland and pasture use in the southern part of the BNR basin, Beshilo, Tana, Jemma, Muger, Guder, Welaka, Didesa, and Dabus sub-basins, require urgent soil and water conservation measures and proper implementation of land-use policies to sustainably manage water and soil resources. Much more research should also be done to understand the impact of the GERD on soil fertility and crop production in the downstream areas.

Supplementary Materials

The following supporting information can be downloaded at: https://www.mdpi.com/article/10.3390/su14137590/s1, Table S1: Root depth, Kc, C, and P factors corresponding to every LULC class; Figure S1: Precipitation in mm; Figure S2: Potential evapotranspiration (pet) in mm; Figure S3: Plant available water content (PAWC); Figure S4: Soil depth in mm; Figure S5: Land use land cover (LULC); Figure S6: Erosivity (R) in mm; Figure S7: Soil erodibility (K); Figure S8: Digital Elevation Model (DEM).

Author Contributions

Research idea, J.D. and S.W.; Methodology, M.B. and P.L.; Software, M.B. and Z.H.; Analysis and Validation, M.B. and J.C.; Writing, M.B. and P.L.; Review & Editing, J.Z., J.D. and S.W. All authors have read and agreed to the published version of the manuscript.

Funding

This research was funded by the Key Research and Development Program of National Key Re-search and Development Program of China, grant number 2020YFC1807500, Forestry Science and Technology Promotion Project Financed by the Central Government, grant number (2020) TS01 and Development Program of Zhejiang Province, grant number 2022C03078.

Institutional Review Board Statement

Not applicable.

Informed Consent Statement

Not applicable.

Data Availability Statement

The model and most of the model input data are in the public domain. (1) The InVEST (Integrated Valuation of Environmental Services and Tradeoffs) is available at https://naturalcapitalproject.stanford.edu/invest-software-platform/software-support-resources. (2) Climate Hazards Group InfraRed Precipitation with Station data version two (CHIRPS—v2.0) is available at https://data.chc.ucsb.edu/products/CHIRPS-2.0/. (3) TerraClimate is available at http://thredds.northwestknowledge.net:8080/thredds/catalog/TERRACLIMATE_ALL/data/catalog.html. (4) Harmonized World Soil Database (HWSD) version 1.2 is available at https://www.fao.org/soils-portal/data-hub/soil-maps-and-databases/harmonized-world-soil-database-v12/en/. (5) The Land Cover CCI Climate Research Data is available at http://maps.elie.ucl.ac.be/CCI/viewer/download.php. (6) DEM is available at https://earthexplorer.usgs.gov/. In addition, all model input data and model calibration and validation data are available on request via contacting the corresponding authors.

Conflicts of Interest

The authors declare no conflict of interest.

References

  1. Fearnside, P.M. Environmental and Social Impacts of Hydroelectric Dams in Brazilian Amazonia: Implications for the Aluminum Industry. World Dev. 2016, 77, 48–65. [Google Scholar] [CrossRef]
  2. Velastegui-Montoya, A.; de Lima, A.; Herrera-Matamoros, V. What Is the Socioeconomic Impact of the Tucuruí Dam on Its Surrounding Municipalities? Sustainability 2022, 14, 1630. [Google Scholar] [CrossRef]
  3. UNDPC. Report on the Sustainable Development of Chinese Enterprises Overseas; United Nations Development Programme: Beijing, China, 2017. [Google Scholar]
  4. Scown, M.W. The Sustainable Development Goals Need Geoscience. Nat. Geosci. 2020, 13, 714–715. [Google Scholar] [CrossRef]
  5. Brundtland, G.H. Report of the World Commission on Environment and Development: Our Common Future; United Nations: Oslo, Norway, 1987. [Google Scholar]
  6. Zeng, Y.; Maxwell, S.; Runting, R.K.; Venter, O.; Watson, J.E.M.; Carrasco, L.R. Environmental Destruction Not Avoided with the Sustainable Development Goals. Nat. Sustain. 2020, 3, 795–798. [Google Scholar] [CrossRef]
  7. Elder, M.; Olsen, S.H. The Design of Environmental Priorities in the SDGs. Glob. Policy 2019, 10, 70–82. [Google Scholar] [CrossRef] [Green Version]
  8. Griggs, D. Sustainable Developmnet Goals for People and Planet. Nature 2013, 495, 305–307. [Google Scholar] [CrossRef]
  9. Johnston, R.; Smakhtin, V. Hydrological Modeling of Large River Basins: How Much Is Enough? Water Resour. Manag. 2014, 28, 2695–2730. [Google Scholar] [CrossRef] [Green Version]
  10. Awulachew, S.B.; McCartney, M.; Steenhuis, T.S.; Ahmed, A.A. A Review of Hydrology, Sediment and Water Resource Use in the Blue Nile Basin; International Water Management Institute: Colombo, Sri Lanka, 2008; Volume 131, ISBN 978-92-9090-699-5. [Google Scholar]
  11. Negm, M.; Abdel-Fattah, S. Grand Ethiopian Renaissance Dam Versus Aswan High Dam: A View from Egypt; Hutzinger, O., Dami a Barcelo, A.G.K., Eds.; Springer: Berlin/Heidelberg, Germany, 2019; Volume 79, ISBN 9783319955995. [Google Scholar]
  12. Verhoeven, H. Black Gold for Blue Gold? Sudan’s Oil, Ethiopia’s Water and Regional Integration; Chatham House: London, UK, 2011. [Google Scholar]
  13. Ahmed, A.T.; Helmy Elsanabary, M. Hydrological and Environmental Impacts of Grand Ethiopian Renaissance Dam on the Nile River. In Proceedings of the Eighteenth International Water Technology Journal, IWTJ18, Sharm El Sheikh, Egypt, 12–14 March 2015; Volume 5, pp. 336–347. [Google Scholar]
  14. Negm, A.; Elsahabi, M.; Abdel-Nasser, M.; Mahmoud, K.; Ali, K. Impacts of GERD on the Accumulated Sediment in Lake Nubia Using Machine Learning and GIS Techniques. In Handbook of Environmental Chemistry; Damià Barceló, A.G.K., Ed.; Springer: Berlin/Heidelberg, Germany, 2019; Volume 79, pp. 271–327. [Google Scholar]
  15. Dandrawy, M.E.; Omran, E.-S.E. Integrated Watershed Management of Grand Ethiopian Renaissance Dam via Watershed Modeling System and Remote Sensing; Springer: Berlin/Heidelberg, Germany, 2020; pp. 533–574. ISBN 9783030395933. [Google Scholar]
  16. Abera, W.; Haregeweyn, N.; Dile, Y.; Fenta, A.A.; Berihun, M.L.; Demissie, B.; Mulatu, C.A.; Nigussie, T.A.; Billi, P.; Meaza, H.; et al. Scientific Misconduct and Partisan Research on the Stability of the Grand Ethiopian Renaissance Dam: A Critical Review of a Contribution to Environmental Remote Sensing in Egypt (Springer, 2020). In Nile and Grand Ethiopian Renaissance Dam; Springer: Cham, Switzerland, 2021; pp. 273–293. [Google Scholar] [CrossRef]
  17. Heubl, B. Why Ethiopia and Egypt Can’t Agree over Hydro Dam|E&T Magazine. Available online: https://eandt.theiet.org/content/articles/2020/08/why-ethiopia-and-egypt-can-t-agree-over-the-grand-ethiopian-renaissance-dam-gerd-africa-s-largest-hydroelectric-power-project/ (accessed on 17 November 2020).
  18. Batisha, A.F. Sustainability Assessment in Transboundary Context: Grand Ethiopian Renaissance Dam. Model. Earth Syst. Environ. 2015, 1, 36. [Google Scholar] [CrossRef] [Green Version]
  19. Soliman, G.; Soussa, H.; El-Sayed, S. Assessment of Grand Ethiopian Renaissance Dam Impacts Using Decision Support System. IOSR J. Comput. Eng. 2015, 18, 2278–2661. [Google Scholar] [CrossRef]
  20. Zhang, Y.; Block, P.; Hammond, M.; King, A. Ethiopia’s Grand Renaissance Dam: Implications for Downstream Riparian Countries. J. Water Resour. Plan. Manag. 2015, 141, 05015002. [Google Scholar] [CrossRef]
  21. Aziz, S.A.; Zelenáková, M.; Mésároš, P.; Purcz, P.; Abd-Elhamid, H. Assessing the Potential Impacts of the Grand Ethiopian Renaissance Dam on Water Resources and Soil Salinity in the Nile Delta, Egypt. Sustainability 2019, 11, 7050. [Google Scholar] [CrossRef] [Green Version]
  22. Reyers, B.; Stafford-Smith, M.; Erb, K.H.; Scholes, R.J.; Selomane, O. Essential Variables Help to Focus Sustainable Development Goals Monitoring. Curr. Opin. Environ. Sustain. 2017, 26–27, 97–105. [Google Scholar] [CrossRef]
  23. Haregeweyn, N.; Tsunekawa, A.; Poesen, J.; Tsubo, M.; Meshesha, D.T.; Fenta, A.A.; Nyssen, J.; Adgo, E. Comprehensive Assessment of Soil Erosion Risk for Better Land Use Planning in River Basins: Case Study of the Upper Blue Nile River. Sci. Total Environ. 2017, 574, 95–108. [Google Scholar] [CrossRef] [PubMed] [Green Version]
  24. NBI Nile Basin Water Resources Atlas: Hydrology of the Nile; Chapter 6. Available online: https://nilebasin.org/index.php/information-hub/technical-documents/44-nile-basin-water-resources-atlas (accessed on 28 December 2020).
  25. Swain, A. Ethiopia, the Sudan, and Egypt: The Nile River Dispute. J. Mod. Afr. Stud. 1997, 35, 675–694. [Google Scholar] [CrossRef]
  26. Belete, M.; Deng, J.; Abubakar, G.A.; Teshome, M.; Wang, K.; Woldetsadik, M.; Zhu, E.; Comber, A.; Gudo, A. Partitioning the Impacts of Land Use/Land Cover Change and Climate Variability on Water Supply over the Source Region of the Blue Nile Basin. Land Degrad. Dev. 2020, 31, 2168–2184. [Google Scholar] [CrossRef]
  27. Aneseyee, A.B.; Elias, E.; Soromessa, T.; Feyisa, G.L. Land Use/Land Cover Change Effect on Soil Erosion and Sediment Delivery in the Winike Watershed, Omo Gibe Basin, Ethiopia. Sci. Total Environ. 2020, 728, 138776. [Google Scholar] [CrossRef]
  28. Zhou, M.; Deng, J.; Lin, Y.; Belete, M.; Wang, K.; Comber, A.; Huang, L.; Gan, M. Identifying the Effects of Land Use Change on Sediment Export: Integrating Sediment Source and Sediment Delivery in the Qiantang River Basin, China. Sci. Total Environ. 2019, 686, 38–49. [Google Scholar] [CrossRef]
  29. Sharp, R.; Nelson, E.; Ennaanay, D.; Wolny, S.; Olwero, N.; Vigerstol, K.; Pennington, D.; Mendoza, G.; Aukema, J.; Foster, J.; et al. InVEST User Guide; The Natural Capital Project: Stanford, CA, USA, 2014. [Google Scholar]
  30. Hamel, P.; Guswa, A.J. Uncertainty Analysis of a Spatially Explicit Annual Water-Balance Model: Case Study of the Cape Fear Basin, North Carolina. Hydrol. Earth Syst. Sci. 2015, 19, 839–853. [Google Scholar] [CrossRef] [Green Version]
  31. Belete, M.; Deng, J.; Zhou, M.; Wang, K.; You, S.; Hong, Y.; Weston, M. A New Approach to Modelingwater Balance in Nile River Basin, Africa. Sustainability 2018, 10, 810. [Google Scholar] [CrossRef] [Green Version]
  32. Zhang, L.; Hickel, K.; Dawes, W.R.; Chiew, F.H.S.; Western, A.W.; Briggs, P.R. A Rational Function Approach for Estimating Mean Annual Evapotranspiration. Water Resour. Res. 2004, 40, W02502. [Google Scholar] [CrossRef]
  33. Fu, B.P. On the Calculation of the Evaporation from Land Surface. Chin. J. Atmos. Sci. 1981, 5, 23–31. [Google Scholar]
  34. Donohue, R.J.; Roderick, M.L.; McVicar, T.R. Roots, Storms and Soil Pores: Incorporating Key Ecohydrological Processes into Budyko’s Hydrological Model. J. Hydrol. 2012, 436–437, 35–50. [Google Scholar] [CrossRef]
  35. Hamel, P.; Chaplin-Kramer, R.; Sim, S.; Mueller, C. A New Approach to Modeling the Sediment Retention Service (InVEST 3.0): Case Study of the Cape Fear Catchment, North Carolina, USA. Sci. Total Environ. 2015, 524–525, 166–177. [Google Scholar] [CrossRef] [PubMed]
  36. Borselli, L.; Cassi, P.; Torri, D. Prolegomena to Sediment and Flow Connectivity in the Landscape: A GIS and Field Numerical Assessment. Catena 2008, 75, 268–277. [Google Scholar] [CrossRef]
  37. Cavalli, M.; Trevisani, S.; Comiti, F.; Marchi, L. Geomorphometric Assessment of Spatial Sediment Connectivity in Small Alpine Catchments. Geomorphology 2013, 188, 31–41. [Google Scholar] [CrossRef]
  38. Renard, K.; Foster, G.; Weesies, G.; McCool, D.; Yoder, D. Predicting Soil Erosion by Water: A Guide to Conservation Planning with the Revised Universal Soil Loss Equation (RUSLE); United States Government Printing: Washington, DC, USA, 1997; p. 404.
  39. Hamel, P.; Falinski, K.; Sharp, R.; Auerbach, D.A.; Sánchez-Canales, M.; Dennedy-Frank, P.J. Sediment Delivery Modeling in Practice: Comparing the Effects of Watershed Characteristics and Data Resolution across Hydroclimatic Regions. Sci. Total Environ. 2017, 580, 1381–1388. [Google Scholar] [CrossRef]
  40. Tarboron, D.G. A New Method for the Determination of Flow Directions and Upslope Areas in Grid Digital Elevation Models. Water Resour. Res. 1997, 33, 309–319. [Google Scholar] [CrossRef] [Green Version]
  41. Sharp, R.; Douglass, J.; Wolny, S.; Arkema, K.; Bernhardt, J.; Bierbower, W.; Chaumont, N.; Denu, D.; Fisher, D.; Glowinski, K.; et al. InVEST User Guide.The Natural Capital Project, Stanford University, University of Minnesota, The Nature Conservancy, and World Wildlife Fund. Available online: https://invest-userguide.readthedocs.io/en/latest/index.html (accessed on 30 December 2021).
  42. Vigiak, O.; Borselli, L.; Newham, L.T.H.; McInnes, J.; Roberts, A.M. Comparison of Conceptual Landscape Metrics to Define Hillslope-Scale Sediment Delivery Ratio. Geomorphology 2012, 138, 74–88. [Google Scholar] [CrossRef]
  43. Maidment, R.I.; Grimes, D.; Black, E.; Tarnavsky, E.; Young, M.; Greatrex, H.; Allan, R.P.; Stein, T.; Nkonde, E.; Senkunda, S.; et al. Data Descriptor: A New, Long-Term Daily Satellite-Based Rainfall Dataset for Operational Monitoring in Africa. Sci. Data 2017, 4, 170063. [Google Scholar] [CrossRef]
  44. Funk, C.; Peterson, P.; Landsfeld, M.; Pedreros, D.; Verdin, J.; Shukla, S.; Husak, G.; Rowland, J.; Harrison, L.; Hoell, A.; et al. The Climate Hazards Infrared Precipitation with Stations—A New Environmental Record for Monitoring Extremes. Sci. Data 2015, 2, 150066. [Google Scholar] [CrossRef] [Green Version]
  45. Belete, M.; Deng, J.; Wang, K.; Zhou, M.; Zhu, E.; Shifaw, E.; Bayissa, Y. Evaluation of Satellite Rainfall Products for Modeling Water Yield over the Source Region of Blue Nile Basin. Sci. Total Environ. 2020, 708, 134834. [Google Scholar] [CrossRef] [PubMed]
  46. Abatzoglou, J.T.; Dobrowski, S.Z.; Parks, S.A.; Hegewisch, K.C. TerraClimate, a High-Resolution Global Dataset of Monthly Climate and Climatic Water Balance from 1958–2015. Sci. Data 2018, 5, 170191. [Google Scholar] [CrossRef] [PubMed] [Green Version]
  47. Gudo, A.J.A.; Belete, M.; Abubakar, G.A.; Deng, J. Spatio-temporal Analysis of Solar Energy Potential for Domestic and Agricultural Utilization to Diminish Poverty in Jubek State, South Sudan, Africa. Energies 2020, 16, 1399. [Google Scholar] [CrossRef] [Green Version]
  48. Fischer, G.; Nachtergaele, F.O.; Prieler, S.; Teixeira, E.; Toth, G.; van Velthuizen, H.; Verelst, L.; Wiberg, D. Global Agro-Ecological Zones (GAEZ): Model Documentation; Food and Agriculture Organization: Rome, Italy, 2012. [Google Scholar]
  49. FAO/IIASA/ISRIC/ISS-CAS/JRC Harmonized World Soil Database (Version 1.2). Available online: http://webarchive.iiasa.ac.at/Research/LUC/External-World-soil-database/HWSD_Documentation.pdf (accessed on 15 December 2018).
  50. Canadell, J.; Jackson, R.; Ehleringer, J.; Mooney, H.A.; Sala, O.E.; Schulze, E.-D. Maximum Rooting Depth of Vegetation Types at the Global Scale. Oecologia 1996, 108, 583–595. [Google Scholar] [CrossRef] [PubMed]
  51. ESA-CCI. Land Cover CCI Product User Guide Version 2.0. 2017. Available online: http://maps.elie.ucl.ac.be/CCI/viewer/download/ESACCI-LC-Ph2-PUGv2_2.0.pdf (accessed on 14 December 2021).
  52. Allen, R.G.; Pereira, L.S.; Raes, D.; Smith, M.; Ab, W. Crop Evapotranspiration—Guidelines for Computing Crop Water Requirements, FAO Irrigation and Drainage Paper 56; Food and Agriculture Organization: Rome, Italy, 1998; pp. 1–15. [Google Scholar]
  53. Wischmeier, W.H.; Smith, D.D. Predicting Rainfall Erosion Losses: A Guide to Conservation Planning with the Universal Soil Loss Equation; Department of Agriculture, Science and Education Administration: Washington, DC, USA, 1978.
  54. Hurni, H. Erosion–Productivity–Conservation Systems in Ethiopia. In Proceedings of the International Conference on Soil Conservation, Maracay, Venezuela, 3–9 November 1985; pp. 654–674. [Google Scholar]
  55. Parysow, P.; Wang, G.; Gertner, G.; Anderson, A.B. Spatial Uncertainty Analysis for Mapping Soil Erodibility Based on Joint Sequential Simulation. Catena 2003, 53, 65–78. [Google Scholar] [CrossRef]
  56. Wischmeier, W.H.; Mannering, J.V. Relation of Soil Properties to Its Erodibility. Soil Sci. Soc. Am. J. 1969, 33, 131–137. [Google Scholar] [CrossRef]
  57. Desmet, P.J.J.; Govers, G. A GIS Procedure for Automatically Calculating the USLE LS Factor on Topographically Complex Landscape Units. J. Soil Water Conserv. 1996, 51, 427–433. [Google Scholar]
  58. Shi-Jie, Z.; Tang, G.-A.; Xiong, L.-Y.; Zhang, G. Uncertainty of Slope Length Derived from Digital Elevation Models of the Loess Plateau, China. J. Mt. Sci. 2014, 11, 1169–1181. [Google Scholar] [CrossRef]
  59. Winchell, M.F.; Jackson, S.H.; Wadley, A.M.; Srinivasan, R. Extension and Validation of a Geographic Information System-Based Method for Calculating the Revised Universal Soil Loss Equation Length-Slope Factor for Erosion Risk Assessments in Large Watersheds. J. Soil Water Conserv. 2008, 63, 105–111. [Google Scholar] [CrossRef]
  60. Taye, G.; Vanmaercke, M.; Poesen, J.; Van Wesemael, B.; Tesfaye, S.; Teka, D.; Nyssen, J.; Deckers, J.; Haregeweyn, N. Determining RUSLE P- and C-Factors for Stone Bunds and Trenches in Rangeland and Cropland, North Ethiopia. Land Degrad. Dev. 2018, 29, 812–824. [Google Scholar] [CrossRef]
  61. Ali, Y.S.A.; Crosato, A.; Mohamed, Y.A.; Abdalla, S.H.; Wright, N.G. Sediment Balances in the Blue Nile River Basin. Int. J. Sediment Res. 2014, 29, 316–328. [Google Scholar] [CrossRef]
  62. Moges, D.M.; Bhat, H.G. Integration of Geospatial Technologies with RUSLE for Analysis of Land Use/Cover Change Impact on Soil Erosion: Case Study in Rib Watershed, North-Western Highland Ethiopia. Environ. Earth Sci. 2017, 76, 765. [Google Scholar] [CrossRef]
  63. Food and Agriculture Organization. Ethiopian Highlands Reclamation Study; Food and Agriculture Organization: Rome, Italy, Italy, 1986; Volume 1. [Google Scholar]
  64. Hurni, H. Degradation and Conservation of the Resources in the Ethiopian Highlands. Mt. Res. Dev. 1988, 8, 123–130. [Google Scholar] [CrossRef]
  65. Gebremicael, T.G.; Mohamed, Y.A.; Betrie, G.D.; van der Zaag, P.; Teferi, E. Trend Analysis of Runoff and Sediment Fluxes in the Upper Blue Nile Basin: A Combined Analysis of Statistical Tests, Physically-Based Models and Landuse Maps. J. Hydrol. 2013, 482, 57–68. [Google Scholar] [CrossRef]
  66. Garzanti, E.; Andò, S.; Vezzoli, G.; Ali Abdel Megid, A.; El Kammar, A. Petrology of Nile River Sands (Ethiopia and Sudan): Sediment Budgets and Erosion Patterns. Earth Planet. Sci. Lett. 2006, 252, 327–341. [Google Scholar] [CrossRef]
  67. Hurni, H. Land Degradation, Famine, and Land Resource Scenarios in Ethiopia. In World Soil Erosion and Conservation; Cambridge University Press: Cambridge, UK, 1993; pp. 27–62. [Google Scholar]
  68. Bastiaanssen, W.G.M.; Karimi, P.; Rebelo, L.; Duan, Z.; Senay, G.; Muthuwatte, L.; Smakhtin, V. Earth Observation Based Assessment of the Water Production and Water Consumption of Nile Basin Agro-Ecosystems. Remote Sens. Environ. 2014, 6, 10306–10334. [Google Scholar] [CrossRef] [Green Version]
  69. Sutcliffe, J.V.; Parks, Y.P. The Hydrology of the Nile; International Association of Hydrological Sciences: Wallingford, UK, 1999; Volume 5, p. 192. [Google Scholar]
  70. Ahmed, A.A.; Ismail, U.H.A.E. Sediment in the Nile River System; UNESCO: Khartoum, Sudan, 2008; Available online: http://isi.irtces.org/isi/rootfiles/2017/07/07/1487239390353757-1498713528334367.pdf (accessed on 23 December 2021).
  71. Wheeler, K.G.; Jeuland, M.; Hall, J.W.; Zagona, E.; Whittington, D. Understanding and Managing New Risks on the Nile with the Grand Ethiopian Renaissance Dam. Nat. Commun. 2020, 11, 5222. [Google Scholar] [CrossRef]
  72. Tesfa, B.C. Benefit of Grand Ethiopian Renaissance Dam Project (GERDP) for Sudan and Egypt; EIPSA Communicating Article: Energy, Water, Environment & Economic; University of Huddersfield: Huddersfield, UK, 2013; Volume 1, pp. 1–12. Available online: http://eprints.hud.ac.uk/19305/ (accessed on 21 February 2022).
Figure 1. The location map of the BNR basin.
Sustainability 14 07590 g001
Figure 2. Conceptual map of sediment export, adopted from Sharp et al. [41].
Sustainability 14 07590 g002
Figure 3. Estimated annual water yield (mm/pixel).
Sustainability 14 07590 g003
Figure 4. Spatial map of soil loss (tons·ha−1·yr−1).
Sustainability 14 07590 g004
Figure 5. Spatial map of sediment yield (tons·ha−1·yr−1).
Sustainability 14 07590 g005
Table 1. Precipitation, potential evapotranspiration, actual evapotranspiration, and water yield of the BNR basin.
YearPrecipitation (mm)PET (mm)AET (mm)Water Yield (mm)Water Yield Volume (m3)
1992974180082315148,264,761,929
20001038181987416452,531,853,703
20101024180986216251,885,682,435
20201062181088218057,833,607,276
Table 2. Different land-use types and their contributions to mean annual water and sediment yields.
Year CroplandMosaic CroplandMosaic Natural VegetationWoodland (Pastoral)ForestShrublandGrasslandWetlandUrban AreaBare AreaWater BodiesMean/
Total
1992MWY132.31261.81167.77234.2531.6497.973.74115.30156.416.606.20150.81
MSY3.726.576.804.870.341.310.080.550.040.010.003.71
Area (km2)88,33021,40836,76778,542681860,24318,03044021041744468319,434
2000MWY163.78261.50143.96241.6541.17122.624.05147.57175.9413.972.21164.25
MSY4.356.525.355.220.391.510.080.540.040.020.003.95
Area
(km2)
78,46122,45550,71680,018687853,59918,25746525039144416319,434
2010MWY137.75259.94165.09255.7537.45106.264.18125.36142.2910.830.82162.18
MSY3.656.316.665.270.391.450.090.460.030.020.003.90
Area
(km2)
93,5752315837,42581,983678949,48418,82550441229314342319,434
2020MWY151.44278.38192.60280.7351.13124.153.81136.61168.6219.170.66180.89
MSY3.676.356.945.460.471.490.090.520.020.030.004.00
Area
(km2)
93,33722,74736,46183,968726948,53719,00056773324534357319,434
Note: MWY: annual average water yield (mm) and MSY: average annual sediment yield (ton·ha−1·yr−1).
Publisher’s Note: MDPI stays neutral with regard to jurisdictional claims in published maps and institutional affiliations.

