Article

Field-Scale Evaluation of the Soil Quality Index as Influenced by Dairy Manure and Inorganic Fertilizers

1
Great Lakes Bioenergy Research Center, W. K. Kellogg Biological Station, Michigan State University, Hickory Corners, MI 49060, USA
2
Department of Plant, Soil and Microbial Sciences, Michigan State University, East Lansing, MI 48824, USA
3
Department of Soil Science and Plant Nutrition, Eskisehir Osmangazi University, Eskişehir 26040, Türkiye
4
Department of Soil Science and Plant Nutrition, Çukurova University, Adana 01330, Türkiye
5
Department of Soil Science and Plant Nutrition, Faculty of Agriculture, Ataturk University, Erzurum 25240, Türkiye
6
Department of Forest Engineering, Faculty of Forestry, Kahramanmaras Sutcu Imam University, Kahramanmaras 46050, Türkiye
7
Department of Biochemistry and Microbiology, School of Environmental and Biological Sciences, Rutgers, The State University of New Jersey, New Brunswick, NJ 08901, USA
*
Author to whom correspondence should be addressed.
Sustainability 2022, 14(13), 7593; https://doi.org/10.3390/su14137593
Submission received: 15 April 2022 / Revised: 12 May 2022 / Accepted: 17 June 2022 / Published: 22 June 2022

Abstract

:
Long-term addition of manure increases soil organic carbon (SOC), provides nutrient supply, enhances soil quality and crop yield (CY), but may also increase global warming potential (GWP). In this study, a long-term experiment was conducted to investigate impacts of organic dairy manure and inorganic fertilizer on the spatial distribution of soil quality indicators in field scale. The experiment was initiated in 2008 (seven years), and includes three manure and two inorganic fertilizer treatments along with a control (no manure or no inorganic fertilizer addition). The study was set into a randomized complete block design with six treatments and four replications in a total of 24 plots with an equal size each of 6 × 18 m (108 m2). Soil physical, chemical and biological properties (total 26 properties) were considered as the total data set and principal component analysis (PCA) was used to determine long-term organic and inorganic fertilizer-induced changes in soil quality. Ordinary kriging interpolation methods were used to predict the spatial distributions of soil quality index (SQI) and mean soil quality values were compared with fertilization treatments by using Duncan’s test. Results showed that most measured soil quality index parameters showed significant differences (p < 0.05). The long-term dairy manure applications had positive impacts on soil quality index parameters where overall SQI scores were higher under high manure (HM) compared to medium manure (MM), low manure (LM), medium fertilizer (MF), high fertilizer (HF), control (CK) by 25%, 27%, 47%, 55% and 92%. A similar trend was observed for CY and GWP. This indicates that long-term dairy manure can be an option to increase SQI values and provide higher CY, however, this may lead to greater GWP.

1. Introduction

Long-term fertilization not only helps to research nutrient dynamics [1], but also ensures greater chances to study crop yield trends, soil quality and environmental sustainability [2]. Manure application with/without inorganic fertilizer is a common fertility management practice to increase SOC and advance soil sustainability [2]. The theory behind positive manure impacts on the general soil quality concept is well documented. However, developing optimum rates for manure and/or inorganic fertilizer applications and their spatial impacts are still improvements that are needed in order to avoid long-term negative influences on soils and environmental health.
Soil quality is the capacity of the soil to maintain the crop productivity and the water and air quality in different ecosystems [3]. Soil quality implicates the combination of a soil physical, chemical and biological properties to define soil functioning [3,4]. Previous studies that developed conceptual frameworks to determine soil quality [4], generally use common approaches along with the combination of essential soil properties [3]. However, the complexity of soil processes and the spatial and temporal variability of soil properties [5] are prime challenges in order to delineate a single soil quality indicator and/or minimum set of indicators and hence the incorporation of soil quality aspects [6].
On the other hand, field-scale visualization of soil quality indexing comes with additional challenges due to availability of technology integrated with complexity in the soil. The developments in geo-computing and information technology brought new approaches like data mining and machine learning to understand large datasets by moving from existing soil maps [7] to the development of digital maps with greater resolutions and visualization of small-scale changes in the soil [8,9]. Therefore, soil quality mapping necessitates the integrative evaluation of essential soil properties and their spatial variations at different scales, locations and times [3].
Moreover, previous studies documented the positive effects of manure application on soil quality compared to inorganic fertilizers. For instance, in comparison to inorganic fertilizers, the application of manure increased SOC, water-stable aggregates (WSA), hydraulic properties [10], enzyme activities [11] and hence improved soil quality. However, manure application may also have negative impacts on soil properties compared to inorganic fertilizer applications such as electrical conductivity (EC) and greenhouse gas emissions [10]. There are few studies that spatially visualize soil quality indicators [3,12] and none of them visualize soil quality index for a field-scale evaluation under different rates of manure and inorganic fertilizer additions. The objective of this study was to evaluate the effects of different rates of manure and inorganic fertilizer applications on soil quality index and crop yield in field-scale.

2. Materials and Methods

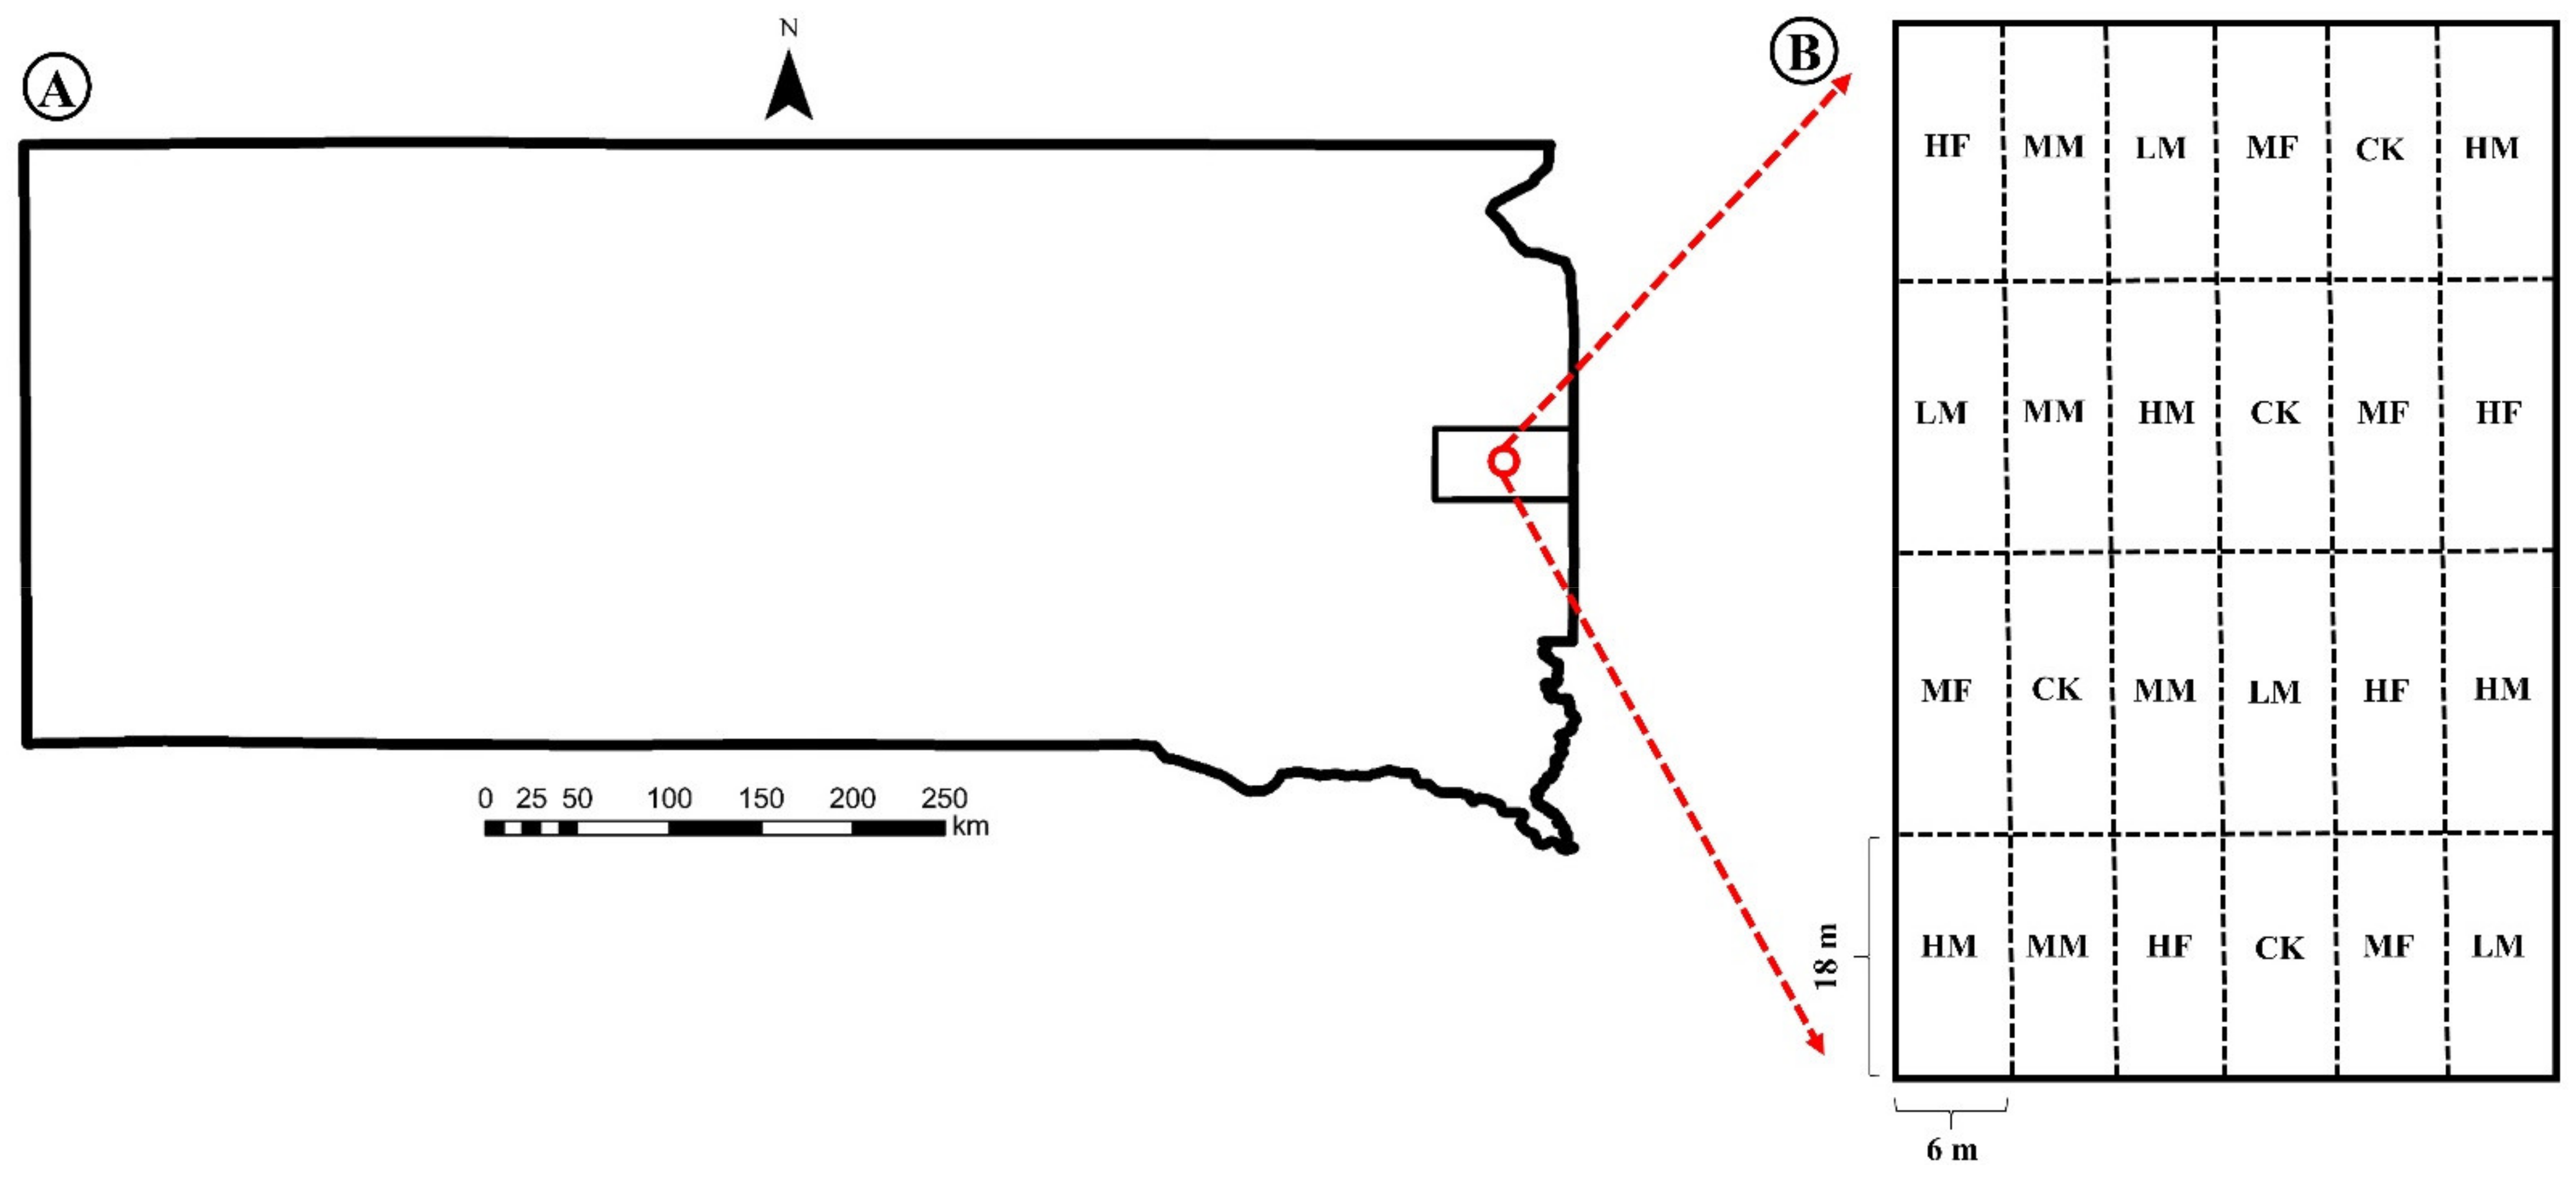
2.1. Study Area, Treatments and Dairy Manure Characteristics

The study site (Figure 1) was established under a corn-soybean cropping sequence in 2008 (7-yr) near Brookings, South Dakota (44°22′07.15″ N lat., 96°47′26.45″ W long). The experiment was on a nearly flat with a slope gradient of <1%, a well-drained silty loam Vienna soil (Mollisols) and an altitude of 518 m from sea level. The study area was characterized by a humid continental climate, having a mean annual precipitation of 637 mm and a mean annual air temperature of −15.8 °C in the winter and 27.8 °C in the summer. The study layout falls into a randomized complete block design with six treatments and four replications (24 plots in total). Each plot has dimensions of 6 m in width and 18 m in length, indicating about a 108 m2 area (see Figure 1).
The treatments of this study included different rates of dairy manure (LM, low manure; MM, medium manure; HM, high manure) and inorganic fertilizer (MF, medium-only nitrogen addition; HF, high-double the amount of MF) applications and control (CK, no application of manure or inorganic fertilizer). The South Dakota Department of Environmental and Natural Resources (DENR) was a tool used to determine the amount of manure and inorganic fertilizer to apply. In this calculation technique, the following equation was used:
M A A = C N N S N S / M N C
where MAA is the amount of manure to apply. CNN is the crop nutrient (P or N) need, which is calculated according to crop yield goals (179.3 kg ha–1 yield goal for corn and 44.8 kg ha–1 for soybean). SNS is a soil nutrient (P or N) stock. MNC is the nutrient (P or N) content of manure. A similar process was applied to determine the amount of inorganic fertilizer application for corn (there is not any nutrient recommendation of inorganic fertilizer for soybean). The dairy manure used in this study on average contained about 32.5% moisture, 6 kg t−1 N and 2.5 kg t−1 P. In addition, the amount of manure applied on average ranged from 8.23 tons acre−1 for LM to 18.66 tons acre−1 for MM and 33.79 tons acre−1 for HM. Moreover, MF received 46 kg ha−1 N, whereas HF received 84 kg ha−1 N, 67 kg ha−1 P2O5, 80 kg ha−1 K2O, 8 kg ha−1 Zn and 28 kg ha−1 S. These analyses were conducted by South Dakota Agricultural Laboratories. The manure was disked at 6 cm deep within a few days before planting in the spring.

2.2. Data Collection, Sampling and Soil Quality Index Indicators Analysis

The soil [10,11,13,14] and greenhouse gas emissions [15] data used in this study was collected from existing publications from the same experiment, except for AEC-6. Crop yield data, which is also not published elsewhere, was also collected in 2015. Briefly, study samples were collected from 0 to 10 cm soil depth using five different methods: (i) intact core samples; (ii) a push probe auger; (iii) penetrometer used in the field for soil penetration resistance (SPR) analysis; (iv) CO2, N2O and CH4 gases; and (v) crop yield were collected by a chamber method and a total of these gasses were used to calculate global warming potential in the summer of 2015.
Intact core samples were used for bulk density (Pb), WSA and soil water release curve. Soil Pb was determined by core method [16] and the percentage of WSA (1–2 mm) was determined using the procedure of [17]. The soil water released curve was determined using the tension table and pressure plate method [18].
Moreover, push probe composited (a mixture of four replications) auger samples were collected per plot, where these soils were later sieved and passed through 2 mm for pending analysis. By using these samples, soil pH and EC analysis were measured using electronic Orion pH and EC meter with a glass electrode in 1:1 and 1:2 of soil/water ratio, respectively. The SOC and N contents were also analyzed using the method outlined by [19] from these samples after removing visible crop residues and sieved through at 0.5 mm. In addition, chemical SOC and N fractions (cold water extractable carbon, CWEC; hot water extractable carbon, HWEC; 1 molar HCL extractable carbon, AEC-1; 6 molar HCL extractable carbon, AEC-6; cold water extractable nitrogen, CWEN; hot water extractable nitrogen, HWEN; 1 molar HCL extractable nitrogen, AEN-1; 6 molar HCL extractable nitrogen, AEN-6) were determined using water and acid extractable methods [19,20] and Shimadzu liquid TOC analyzer. Soil microbial community composition analysis was determined using the PLFA method [21] and microbial activities (urease activity, UA and beta-glucosidase activity, βA) according to [22]. Further details about these experimental sites and study analyses can be found at [10].

2.3. Soil Quality Index Assessments

Soil physical, chemical and biological properties (totally 26 properties) were considered as the total data set. Principal component analysis (PCA) was used to identify the suitable indicators representing the minimum data set (MDS) due to its ability to reduce data redundancy, while minimizing the loss of information [23]. The principal components (PCs) with high eigenvalues were assumed to be indicators that best represent fertilizer-induced changes in soil quality. Therefore, only the PCs with eigenvalues >1 [24] and those that explained at least 5% of the data variation were selected [25]. The selected PCs were subjected to varimax rotation to maximize the correlation between PC and the soil properties by distributing the variance [26]. Under each PC, only the indicators with loading values within 10% of the highest value were retained [27]. When more than one indicator was retained in a PC, correlation values among them were analyzed. If the indicators were well-correlated (r ≥ 0.70), only the one with the highest factor loading was retained in the MDS to avoid redundancy.
After determining the MDS indicators, the standard scoring function was used to normalize observations by assigning scores ranging between 0 and 1 [4]. There are three standard scoring functions (SSFs) for SQI, which indicate whether the indicator has a “positive” or “negative” relationship according to their soil quality function or if it is positively related within an “optimum range”, after which it is negatively related [28]. The SSF Equations (2) and (3) were described as follows:
f x = 1 x L 1 0.9 × x L U L L x U Negative 0.1 x U
f x = 0.1 x L 0.9 × x L U L + 0.1 L x U Positive 1 x U
where x is the monitoring value of the indicator; ƒ( x ) is the score of indicators ranging between 0 and 1; and L and U are the lower and the upper threshold values of the indicator, respectively. For scoring some indicators, the optimum range or value is required. For such indicators, the optimum range or value is determined from the literature and the indicators are converted to a unitless score value using the equations according to whether they are above or below optimum range or value.
The transformed MDS indicators were weighted using the results of PCA. Each PC explained a certain amount (%) of the variation in the total data set. This percentage, divided by the total percentage of variation explained by all PC with eigenvalues >1, provided the weightage factor for variables [29]. When more than one indicator is selected from PC, the weightage factor given to PC is given by dividing it by the number of indicators selected from PC. The final step in soil quality assessment was combining the selected indicators into an overall SQI using the following Equation (4).
S Q I = i = 1 n W i × S i
where W is the PC weightage factor and S is the indicator score. The combination of selected indicators into the SQI is site-specific and can be used to recognize sustainable management practices and decisions in agricultural ecosystems [30]. Higher SQI values were assumed to mean better soil quality, as SQI is considered as the overall assessment of soil quality, reflecting the effects of management practices on soil function [31].

2.4. Data Analysis

Principal component analysis was used to create a minimum data set used to determine long term organic and inorganic fertilizer-induced changes in soil quality. Duncan’s test (p < 0.05) was used for mean soil quality comparisons and crop yields among organic and inorganic fertilization treatments. The data were analyzed using XLSTATTM statistical and data analysis solution (Addinsoft Inc., New York, NY, USA).

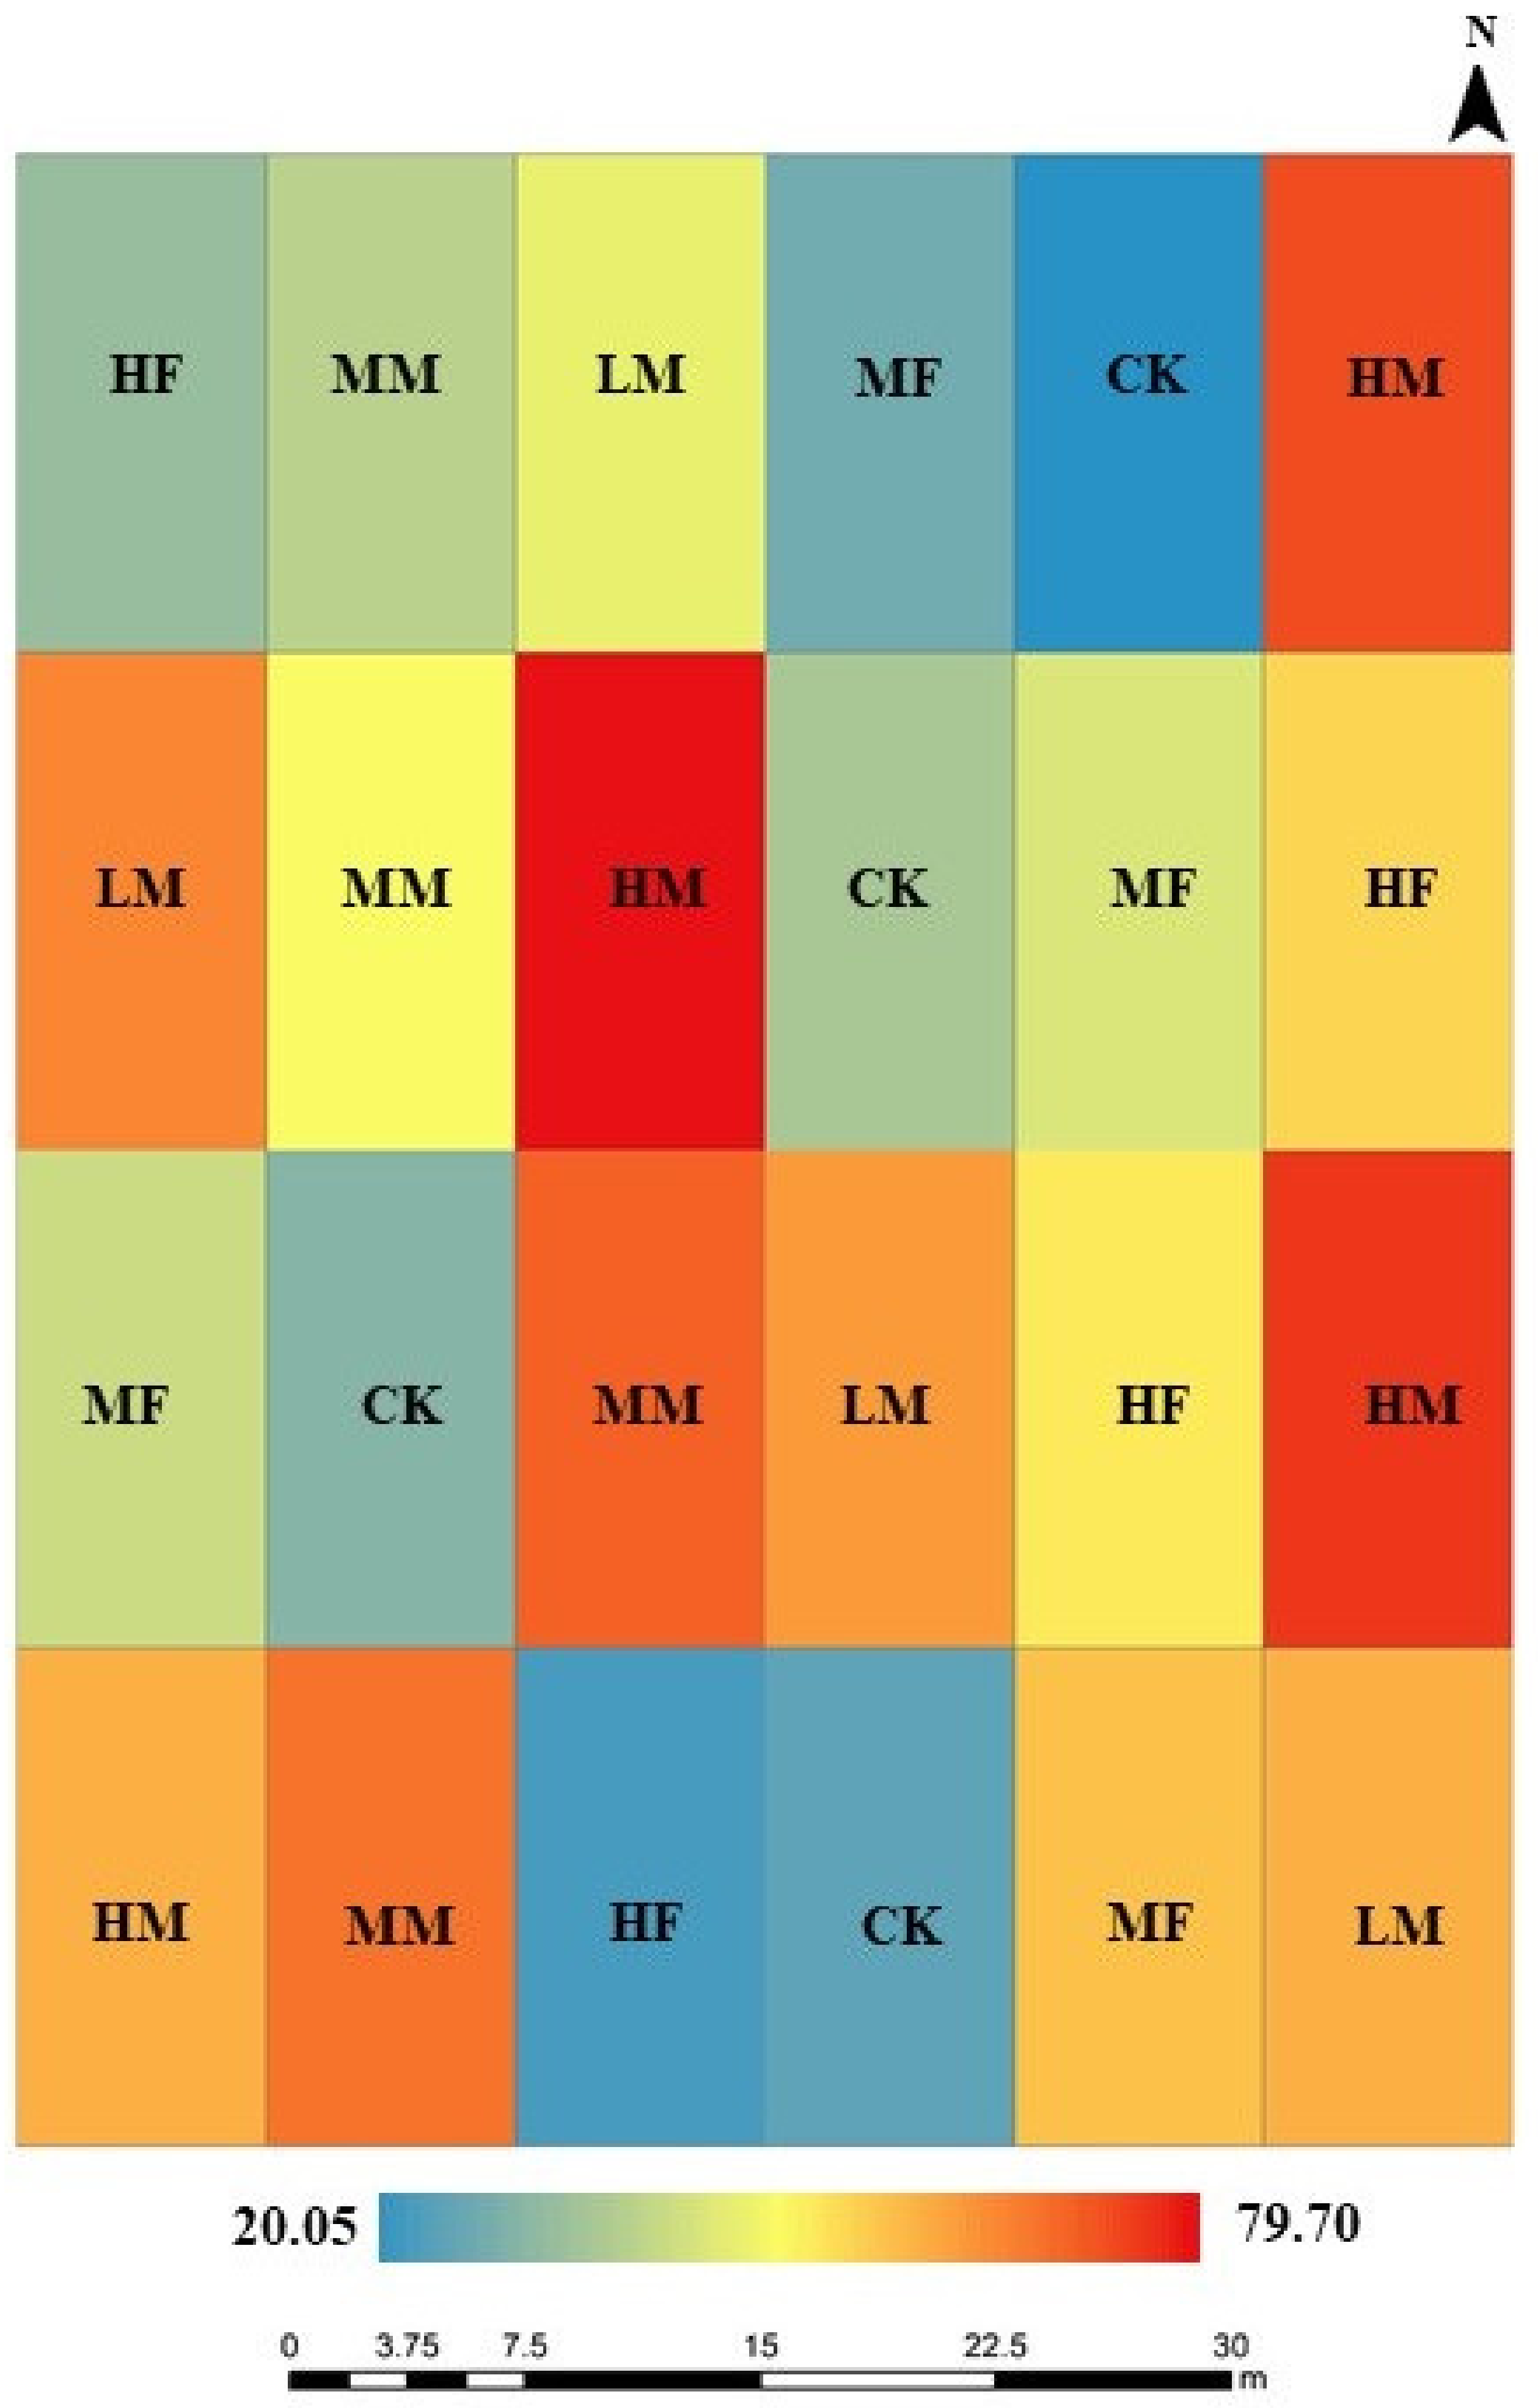
2.5. Spatial Evaluation and Mapping

Soil quality index of each of these 24 grids (Figure 2) was performed and mapped in the complete study area in a raster format through ArcGIS 10.5 software (ESRI) to show a visualization of their spatial variation within and among control, long-term manure and inorganic fertilizer treatments.
Ordinary kriging interpolation methods are a linear technique, which is used to predict unsampled locations based on sampled observations in its neighborhood [32]. Ordinary kriging interpolation methods were used to predict the spatial distributions of SQI through ArcGIS 10.5 (ESRI, USA). Root mean square error (RMSE; Equation (5)) was calculated to assess and indicate interpolation model performance for the most accurate kriging interpolation models among ordinary, simple and universal kriging interpolation methods. Thus, ordinary kriging interpolation was determined as the most accurate interpolation model based on the lowest RMSE compared to simple and universal kriging interpolation methods. To measure the prediction performance of the final map of SQI we used a cross-validation procedure and, consequently, we computed an RMSE value (Equation (5))
R M S E = Z i Z 2 n
Zi, Z and n are the indicated predicted value, observed value and a number of observations, respectively.

3. Results

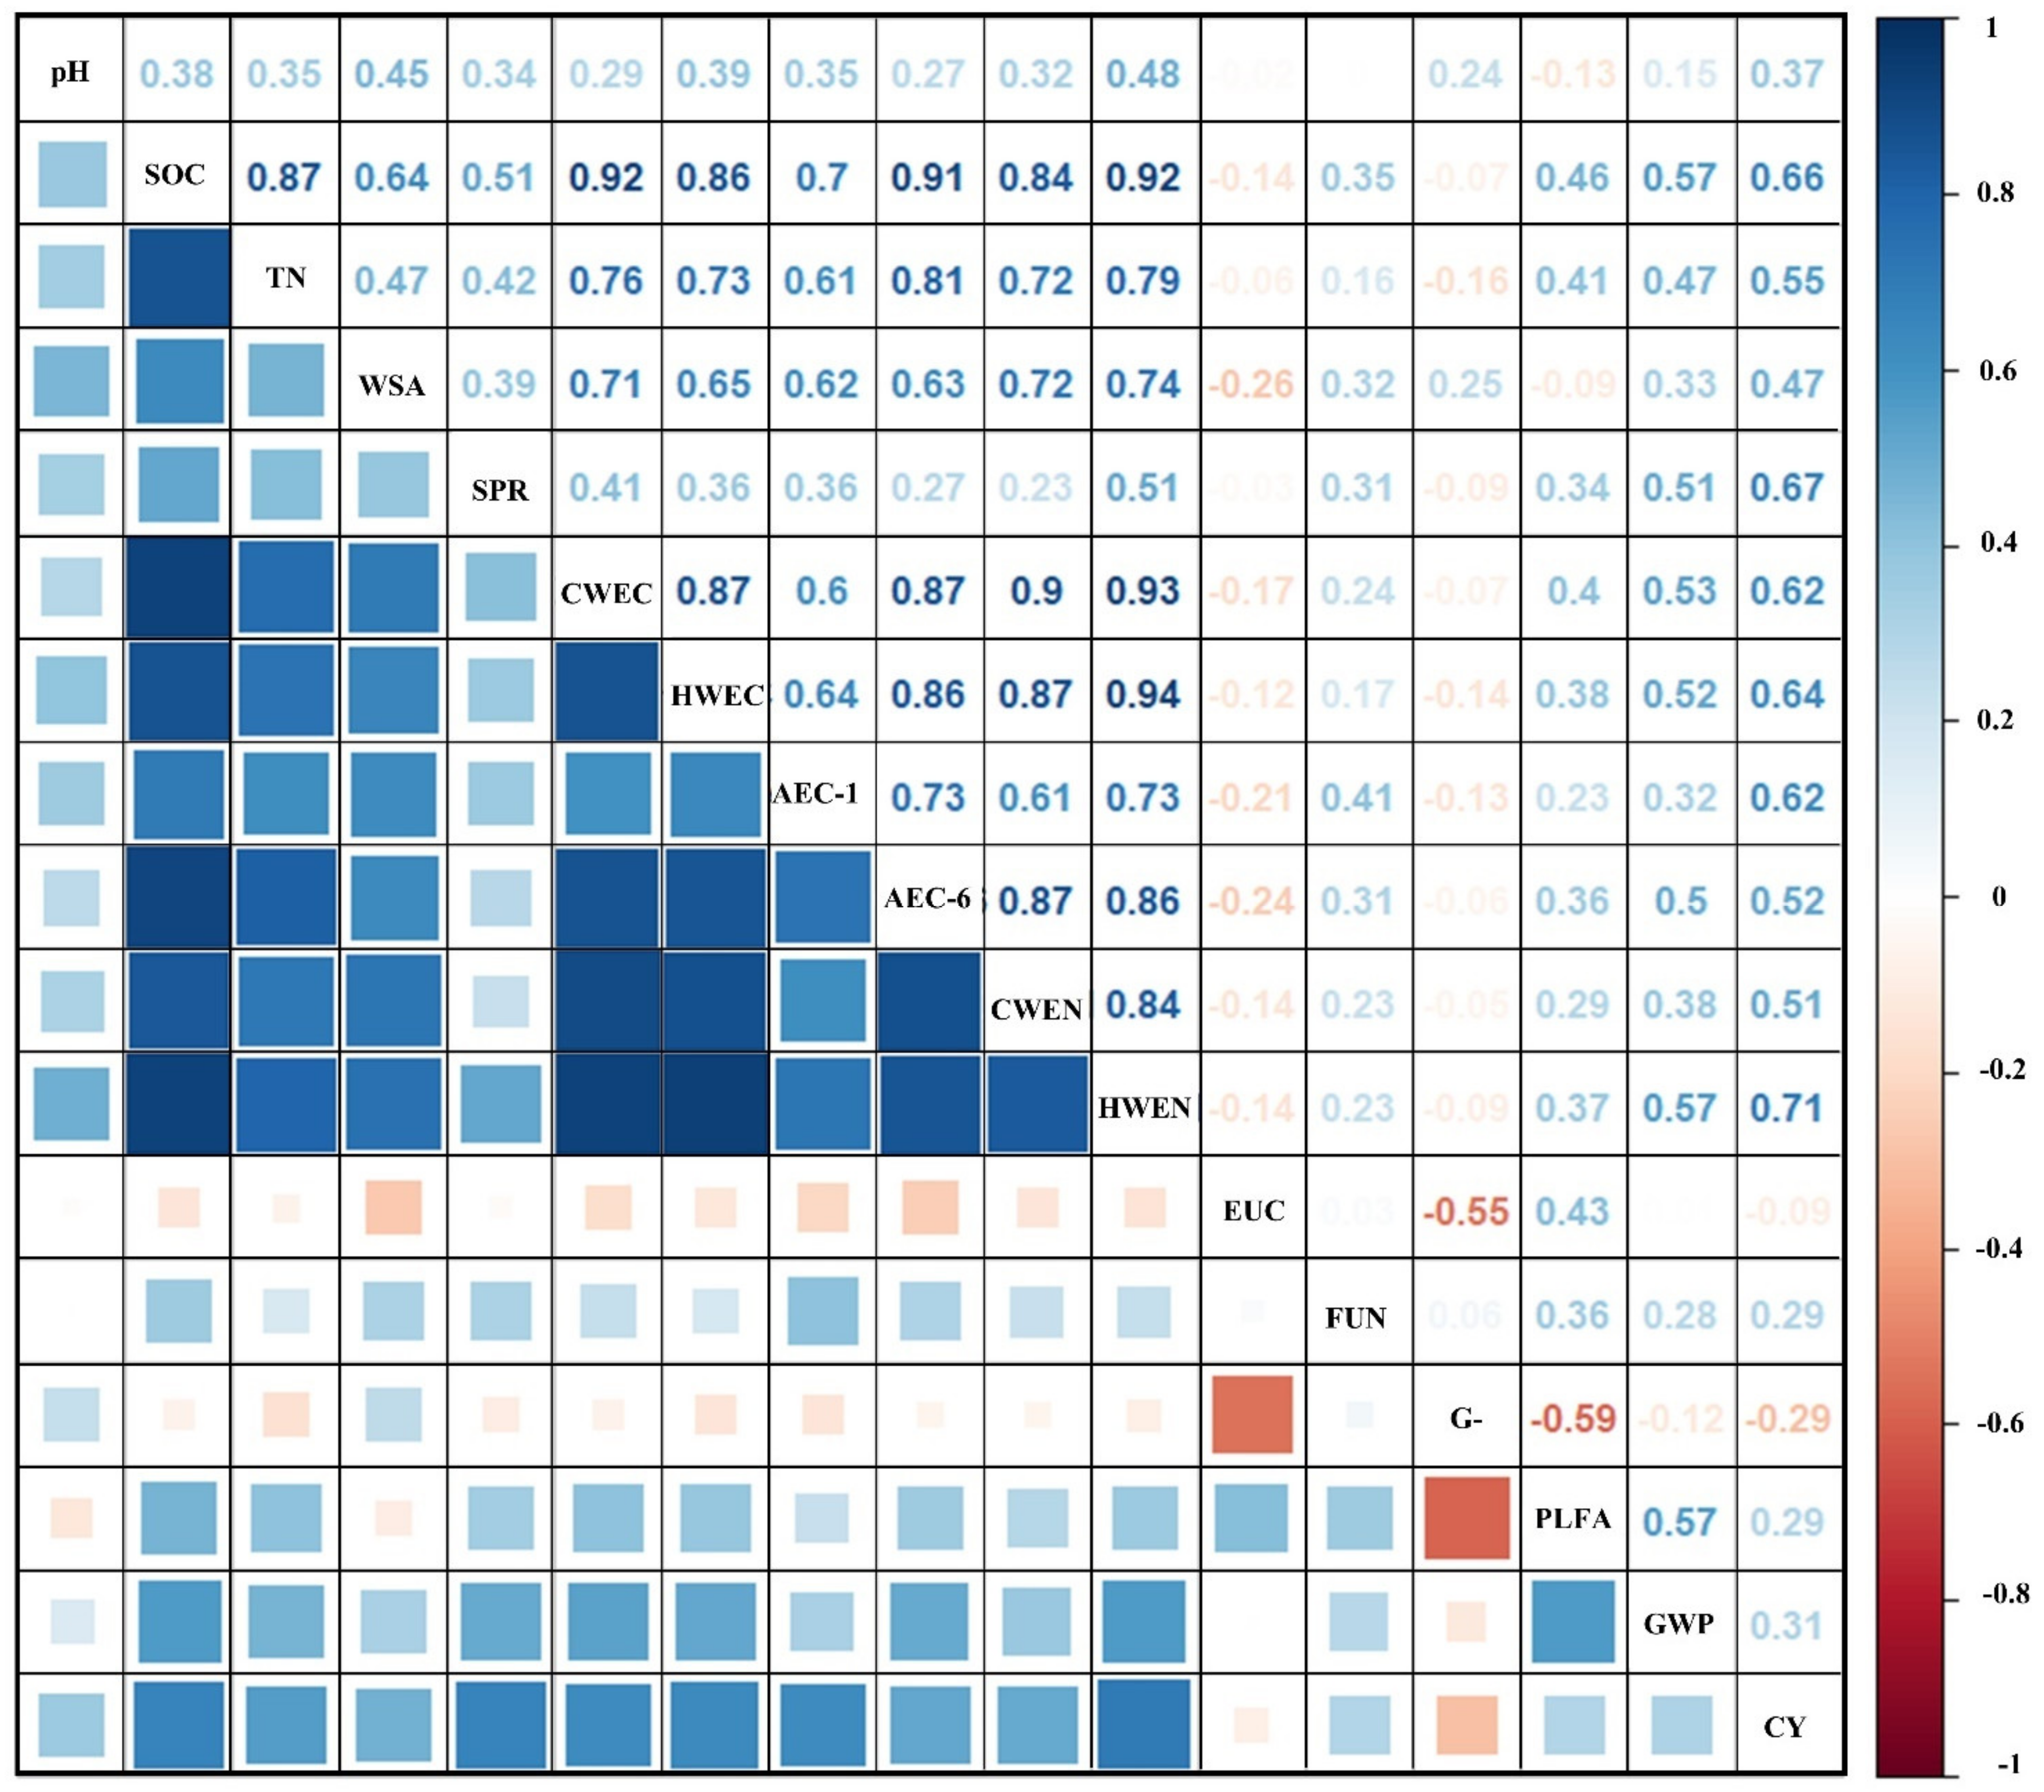
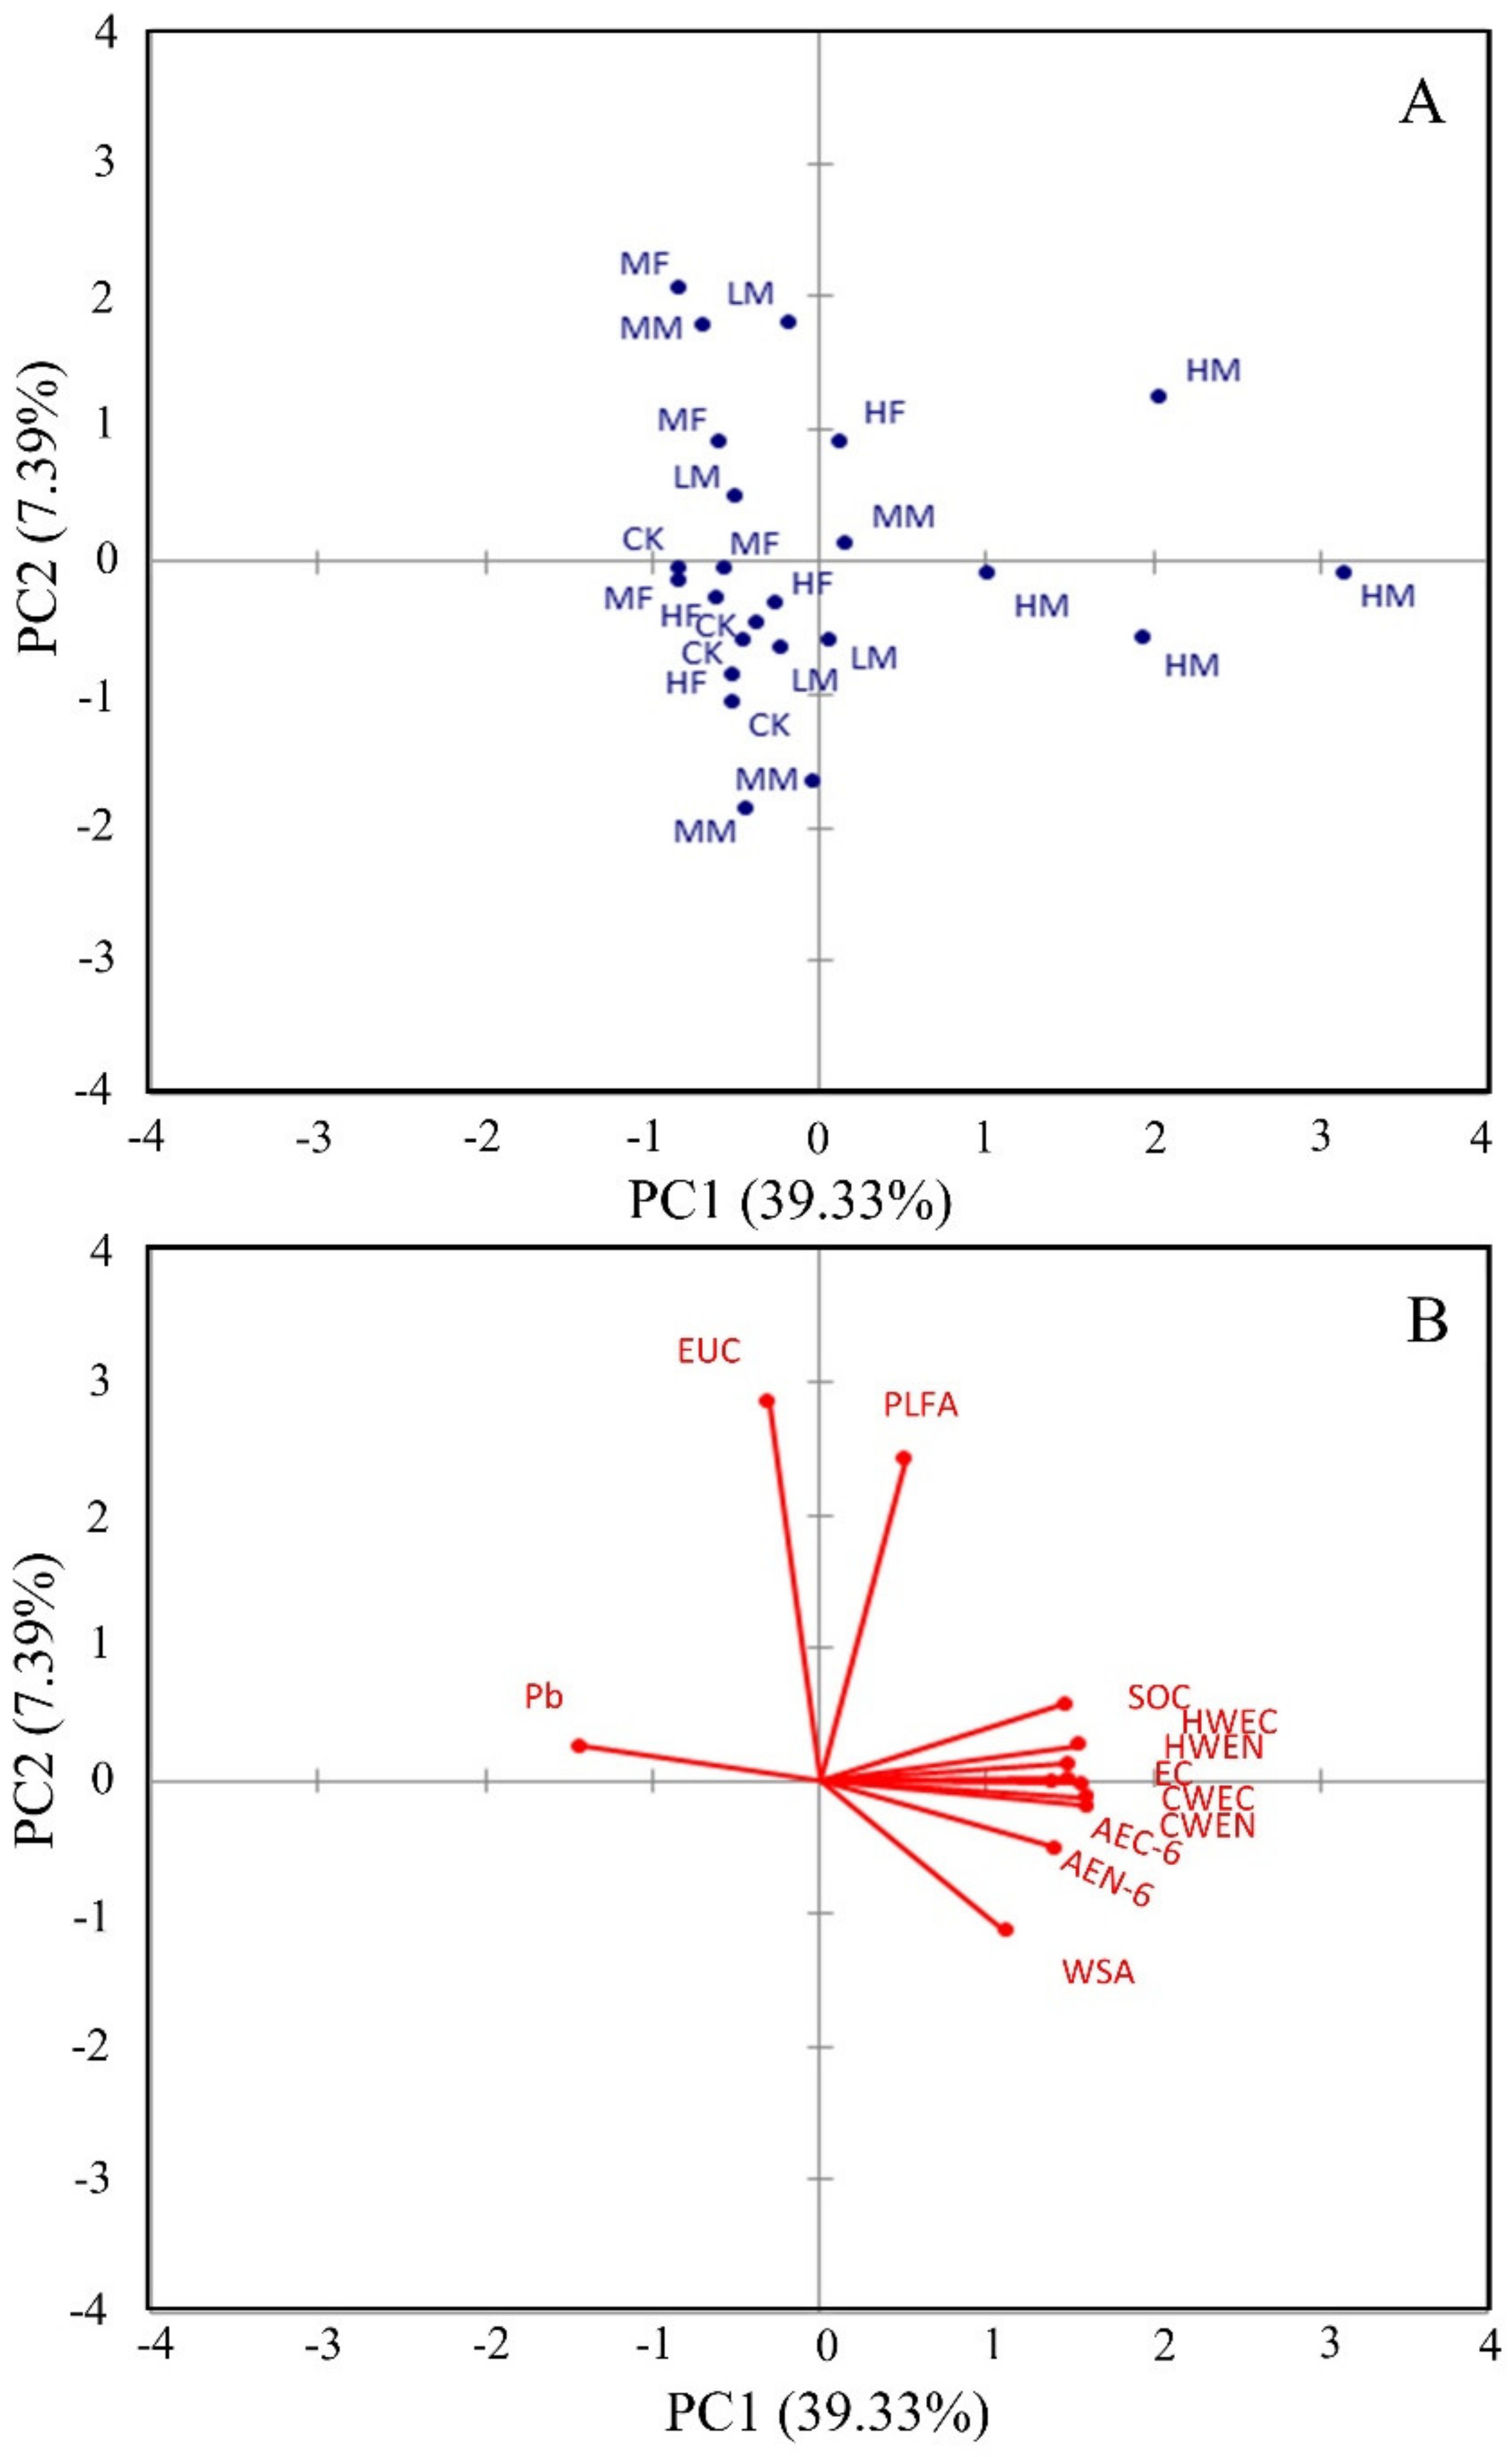
3.1. Soil Properties and Pearson’s Correlation Analysis

Overall soil pH, EC, SOC, N, WSA, water content under −30 kPa and SPR were higher under dairy manure applications compared to those under inorganic fertilizer applications (Table 1). In addition, increasing manure application rates also increased these properties, whereas increasing inorganic fertilizer rates decreased them. However, Pb and water-filled pore space decreased by both the addition of manure in general and increasing the rates of manure compared to those under inorganic fertilizer and control.
Moreover, manure application in general significantly increased C and N fractions compared to inorganic fertilizer and control. Increasing rates of manure application also increased C and N fractions, except those of hot water extractable carbon and 1 molar acid extractable carbon. Hot-water extractable carbon was higher under HM compared to that of LM, MM, HF, MF and CK by 52%, 63%, 78%, 87% and 119%, respectively. Furthermore, 1 molar acid extractable carbon was higher under MM compared to those under HM, LM, HF, CK and MF by 0.4%, 8.8%, 28.5%, 30.0% and 30.0%, respectively.
Moreover, manure application increased soil microbial community compositions (eucaryote, AM-fungi, fungi, G+ bacteria and total PLFA), enzyme activities (urease and beta-glucosidase activities) and global warming potential compared to inorganic fertilizer and CK except those of G- bacteria and actinomycetes.
Soil G- bacteria was decreased by both manure and inorganic fertilizer applications compared to CK, where inorganic fertilizer decreased G- bacteria more than those decreased by manure applications. In addition, actinomycetes were higher under MF than those under HF, LM, MM, CK and HM by 1.2%, 19.4%, 20.3%, 29.3% and 30.3%, respectively.
Results of person’s correlation analysis showed that SOC, total N, SPR and C and N fractions were positively correlated with PLFA (Figure 3). In addition, SOC was also positively correlated with total fungi. Moreover, SOC, total N and C and N fractions were positively correlated with global warming potential and crop yield.

3.2. Soil Quality Index Assessment and Spatial Distribution

The PCA results showed that 84.8% of the variance in the total data set was explained by the first six PCs with eigenvalues >1 (Table 2). The PC1 explained the highest variance (39.3%) in the data set. The indicators selected from PC1 were SOC, TN, CWEC, HWEC, AEC-6, CWEN and HWEN, which correlated significantly with each other (Figure 2). Since AEC-6 has the highest factor loading, it was the indicator included in the MDS from PC1. PC2 and PC4 accounted for 7.4% and 7.5% of the variance, respectively. The EUC from PC2 and FUN from PC4 were selected for the MDS. PC3 and PC5 explained 12.3% and 7.3% of the variation in the data set, respectively. While indicators selected in PC3 were SPR and UA, soil pH and WFPS were selected in PC5. SPR and UA from PC3 and pH and WFPS from PC5 were retained in the MDS due to not being correlated with each other. In PC6, G- and G+ were two indicators within 10% of the highest factor loading, which explained 10.93% of the variation. The relationship between G- and G+ was significantly important in the correlation matrix. Therefore G+, having the highest factor loading, was retained in the MDS from PC6. As a result of PCA, AEC-6, EUC, SPR, UA, FUN, pH, WFPS and G+ were selected for the MDS. The contributions of these indicators in the MDS to the variability within their PCs were also found to be statistically significant. These results indicate that AEC-6, EUC, SPR, UA, FUN, pH, WFPS and G+ are important indicators to reflect fertilizer-induced changes in soil quality (Table 3).
Biplot illustrates those soil indicators with the greatest effect on differentiating treatment combinations [27]. The PC1 and PC2 were selected for display in the biplot (Figure 3). The HM treatment was clearly differentiated compared to other treatments. Most of the indicators, except for EUC and Pb, were effective in the differentiation of this treatment. In particular, the HWEN, EC, CWEC, CWEN, AEC-6, AEN-6 and WSA indicators were effective indicators for HM treatment. Indicators with a positive effect for HM showed a negative relationship for MF. The PLFA, TN, SOC, HWEC, EC, HWEN and CWEC indicators generally showed a negative relationship with CK and HF located in the lower-left quadrant of the biplot with similar vector loading. This indicated less difference in soil indicators between CK and HF. MF, LM and MM treatments, on the other hand, were distributed on a larger scale, apart from CK and HF treatments.
The SSF equations were used to normalize indicators in the MDS. The positive SSF was used for AEC-6, EUC, UA, FUN and G+; the negative SSF was used for SPR. For pH and WFPS indicators, the optimum range and point were needed to normalize soil pH and WFPS, respectively. The most desirable pH limits for plant growth in determining soil quality are between 6.0 and 7.0 [33]. Therefore, pH values in the optimum range scored 1.0. The positive SSF was used for pH values below the optimum range, while the negative function was used for pH values above the optimum range. In scoring WFPS, 60% value considered in the studies of Linn and Doran [34] and Torbert and Wood [35] was taken into consideration as the criterion. The negative SSF was used for WFPS values above this value and positive SSF for WFPS values below.
The MDS indicators were weighted using the variability of each PC (Table 3). Finally, indicators were combined in an overall SQI by assigning their weights. Long-term organic and inorganic fertilizer treatments on SQI are presented in Table 4. Organic treatments obtained higher SQI than inorganic treatments. The highest SQI was obtained in HM with 69.56%. This was followed by MM with a decrease of 20% and LM with a decrease of 21%, respectively. However, the lowest SQIs were obtained in CK (36.28%), HF (44.89%) and MF (47.34%), respectively. HM treatment had 92%, 55% and 47% higher SQI compared to CK, HF and MF, respectively.
Nine different interpolation methods were performed to predict the distribution of soil quality index using the minimum data set based on the results of PCA analysis. A Gaussian model of simple kriging was obtained as the best suitable estimation model based on the lowest RMSE value. The distribution of the soil quality grid size visualization (Grid size of 8 × 16 m) and map were presented in Figure 4. The SQI value of the study area, in particular the center, southwest and southeast, increased with manure applications (Figure 4 and Figure 5), respectively.

3.3. Crop Yield and Global Warming Potential

The crop yield was higher under HM (3.65 Mg ha−1) compared to that of MM (3.53 Mg ha−1), HF (3.40 Mg ha−1), LM (3.34 Mg ha−1), MF (3.33 Mg ha−1) and CK (3.06 Mg ha−1) by 3.4%, 7.4%, 9.3%, 9.6% and 19.3%, respectively. On the other hand, global warming potential was greater under HM compared to those under MM, HF, LM, CK and MF by 57.5%, 160%, 871%, 2115% and 3264%, respectively.

4. Discussion

4.1. The Interactions among Individual Soil Properties

Long-term fertilization helps to manage soil nutrient availability and soil quality indicators [1,2], and manure application with/without inorganic fertilizer has positive impacts on the overall SOC [2] and soil structure [10]. In this study, SOC, total nitrogen (TN) and WSA represent soil structure, and these were higher not only due to the impacts of the overall manure application, compared to inorganic fertilizer applications and control, but also due to the increasing rates of manure additions. Like SOC, CWEC, HWEC, AEC-1, AEC-6, CWEN, HWEN, AEN-1 and AEN-6 were increased by overall manure addition. This showed that manure applications not only increase overall SOC and nitrogen (N) content, but also their chemical fractions. However, the positive impacts of inorganic fertilizer applications on these properties were not found. In previous studies, similar results were reported that showed manure applications enhance SOC, WSA and C and N fractions [11], and hence, improved soil structure [10].
The development of better soil structure owing to impacts from manure applications was also matched with soil hydraulic status, in which Pb was decreased and the soil water content at −30 kPa and SPR were increased by manure application and increasing its rates. Previous studies reported similar results showing that manure decreases Pb and increases soil hydraulic properties [36,37]. Moreover, SOC and N contents were positively correlated with SPR. However, increases in soil pH may also have effects on all SOC, its fractions and soil hydraulic characteristics. It was found that SOC, TN, SPR and C and N fractions were positively correlated with soil pH where manure application increased soil pH. The liming effects of manure application on soil pH are well documented [38,39] whereas due to its natural pH content, the addition of inorganic fertilizers decreases soil pH [40].
Altering the soil structure and SOC hence had a greater influence on microbial communities and their activities. The improvements in soil physical properties were documented to be due to greater SOC [41] and higher microbial activity at the topsoil [42], while the impacts of manure found to increase microbial community composition, their activities [11] and SOC [10]. In this study, the SOC, TN, SPR and C and N fractions were positively correlated with phospholipid fatty acids. Manure applications particularly increased eucaryote, AM-fungi, fungi, G+ bacteria, total PLFA and enzyme activities such as urease and beta-glucosidase activities compared to inorganic fertilizer and CK. However, G- bacteria and actinomycetes had the opposite response to manure additions. Providing more organic additions like manure, and improving soil aggregation by using reduced tillage, may help microbial buildup. The greater fungal abundance was attributed to lower tillage operations due to its influences on soil architecture, particularly the hyphal network [42] and the lower mixture of topsoil with lower horizons [43]. In this study, we found a positive correlation between SOC and total fungi, which indicates that greater SOC and better soil structure come with a greater fungi population and microbial activities. The highest influence on soil quality in this experimental study was induced by increasing rates of dairy manure application across all measured soil physical, chemical and biological properties. However, inorganic fertilizer application resulted in lower positive effects or negative impacts on soil quality, especially due to changes in soil aggregation and C content.

4.2. Soil Quality Assessment under Manure and Inorganic Fertilizer Applications

The MDS used to determine fertilizer-induced changes in SQI was composed of SPR, pH, AEC-6, FUN, G-, UAC, EUC and PLFA indicators. The MDS indicators have been evaluated by numerous studies to determine the soil quality [44,45]. In this study, especially higher AEC-6, UAC, PLFA and FUN under manure applied plots contributed to better soil quality compared to inorganic fertilizer and control plots. This might be the result of SOC content, which is the energy source of microbial activity [46]. The long-term addition of C-rich manure to the soil increased SOC. These findings overlap with the results of previous studies [47,48,49] where increased SQI under manure applications was reported compared to those under inorganic fertilizer and control.
The AEC-6 indicator was one of the most important indicators for manure treatments since increasing manure application rates corresponded by the highest weight within PCA. In addition, it was seen that the contribution of other indicators to soil quality in manure treatments was quite significant. On the other hand, the SPR indicator had higher scores by taking lower values in inorganic fertilizer, which came into prominence. However, this situation showed that the SPR indicator alone would not be sufficient for the improvement of soil quality under inorganic fertilizer applications. Since soil quality is a product of physical, chemical and biological indicators [50], it is necessary to contribute to chemical and biological indicators for the improvement of soil quality in inorganic fertilizer plots. Although there was no significant difference, the SQIs under inorganic fertilizer applications were lower than those under control, with no manure or fertilizer applied. This small difference in the long-term experiments is an important sign of sustainable agriculture. Since the SQI assessment is an important strategy for defining management practices [51], the negative effects of long-term inorganic fertilizer applications on soil quality is an issue that should be considered regarding long-term sustainability.
Mapping is exclusively important to detect the spatial variation in SQI and to manage low SQI and high SQI for sustainable agriculture due to the exact locations where special management practices are needed. Therefore, digital soil mapping techniques have been used to detect and define SQI of a large area or field-scale with minimal soil sampling effort [9]. Ordinary kriging interpolation methods, which is one of the digital soil mapping techniques, have been successfully applied by many studies to predict the distribution of SQI [28,52]. The manure applications obtained higher SQI compared to inorganic treatments. According to Figure 4 and Figure 5, the SQI map illustrated that the study area has moderate SQI under long-term manure and inorganic fertilizer applications. In particular, the highest SQI was obtained in HM, whereas the lowest SQI was obtained in MF. The low-quality SQI that have HF and MF applications can be related. Therefore, the center, southwest and southeast have high SQI with increasingly applied manure applications, while other areas have low SQI with decreasingly applied manure applications. In particular, these areas have low SQI, mostly located at the north and south part of the study area.

4.3. Soil Quality, Crop Yield and Global Warming Potential

In general, soils with a greater quality index had a higher crop yield and global warming potential. Similarly, increasing rates of manure applications had higher SQI, crop yield and global warming potential. Our results are consistent with those of Lee et al. [53] and Liu et al. [48]. Lee et al. [53] reported that manure compost improved soil quality, and hence crop yield, compared to control. Liu et al. [48] found that adding manure to inorganic fertilizer increased soil quality and crop yield. However, even though soils under the highest manure application rate, HM, had significantly greater SQI and global warming potential compared to the highest inorganic fertilizer application, HF, differences for crop yield were not significant.

5. Conclusions

This study investigated the effects of different rates of manure and inorganic fertilizer applications on field scale distribution of soil quality indices, crop yield and global warming potential.
Results showed that long-term dairy manure applications had positive impacts on soil quality index parameters including SOC, N, WSA, water content under −30 kPa, SPR, soil microbial community compositions, enzyme activities, C and N fractions. The manure applications also produced higher SQI values than that of the inorganic fertilizer applications, where the most measured soil quality index parameters showed significant differences (p < 0.05). Moreover, overall SQI scores were higher under high manure (HM) compared to lower manure rates and inorganic fertilizer rates. This shows that not only manure application, but also increasing its application rates, further enhances soil quality. However, increasing the rate of inorganic fertilizer only increased global warming potential. Like SQI values, CY and GWP were also increased by manure applications compared to those of inorganic fertilizers. It can be concluded that field scale evaluations of manure applications indicate that long-term dairy manure can be an option to increase SQI values and providing higher CY but may lead greater GWP. Hence, the findings of this study draw attention to the mapping of spatial distribution patterns of SQI, which is exclusively important for site-specific management inputs for providing higher crop yields and global warming potential.

Author Contributions

Conceptualization, E.O.; methodology, E.O., G.G. and M.A.; software, E.O., G.G. and M.A.; validation, E.O., G.G., E.B., S.B. and M.A.; formal analysis, E.O.; investigation, E.O.; resources, E.O.; data curation, E.O., G.G. and M.A.; writing—original draft preparation, E.O., G.G., E.B., S.B. and M.A.; writing—review and editing, E.O., G.G., E.B., S.B. and M.A.; visualization, E.O., G.G. and M.A.; supervision, E.O.; project administration, E.O.; funding acquisition, E.O. All authors have read and agreed to the published version of the manuscript.

Funding

This research received no external funding.

Acknowledgments

The authors want to thank Sandeep Kumar and to support from the Agricultural Experiment Station (AES) of South Dakota State University (SDSU) and the Nutrient Research Educational Council (NREC).

Conflicts of Interest

The authors declare no conflict of interest. The funders had no role in the design of the study; in the collection, analyses, or interpretation of data; in the writing of the manuscript, or in the decision to publish the results.

References

  1. Shahid, M.; Shukla, A.K.; Bhattacharyya, P.; Tripathi, R.; Mohanty, S.; Kumar, A.; Lal, B.; Gautam, P.; Raja, R.; Panda, B.B.; et al. Micronutrients (Fe, Mn, Zn and Cu) balance under long-term application of fertilizer and manure in a tropical rice-rice system. J. Soils Sediments 2015, 16, 737–747. [Google Scholar] [CrossRef]
  2. Ghosh, B.N.; Meena, V.S.; Singh, R.J.; Alam, N.; Patra, S.; Bhattacharyya, R.; Sharma, N.; Dadhwal, K.; Mishra, P. Effects of fertilization on soil aggregation, carbon distribution and carbon management index of maize-wheat rotation in the north-western Indian Himalayas. Ecol. Indic. 2019, 105, 415–424. [Google Scholar] [CrossRef]
  3. Paz-Kagan, T.; Zaady, E.; Salbach, C.; Schmidt, A.; Lausch, A.; Zacharias, S.; Notesco, G.; Ben-Dor, E.; Karnieli, A. Mapping the Spectral Soil Quality Index (SSQI) Using Airborne Imaging Spectroscopy. Remote Sens. 2015, 7, 15748–15781. [Google Scholar] [CrossRef] [Green Version]
  4. Andrews, S.S.; Karlen, D.L.; Mitchell, J.P. A comparison of soil quality indexing methods for vegetable production systems in Northern California. Agric. Ecosyst. Environ. 2002, 90, 25–45. [Google Scholar] [CrossRef]
  5. Li, G.; Chen, J.; Sun, Z.; Tan, M. Establishing a minimum dataset for soil quality assessment based on soil properties and land-use changes. Acta Ecol. Sin. 2007, 27, 2715–2724. [Google Scholar] [CrossRef]
  6. De Laurentiis, V.; Secchi, M.; Bos, U.; Horn, R.; Laurent, A.; Sala, S. Soil quality index: Exploring options for a comprehensive assessment of land use impacts in LCA. J. Clean. Prod. 2018, 215, 63–74. [Google Scholar] [CrossRef]
  7. Favrot, J.-C.; Lagacherie, P. La cartographie automatisee des sols: Une aide a la gestion ecologique des paysages ruraux. C. R. Acad. Agric. Fr. 1993, 79, 61–76. [Google Scholar]
  8. McBratney, A.B.; Odeh, I.O.A.; Bishop, T.F.A.; Dunbar, M.S.; Shatar, T.M. An Overview of Pedometric Techniques for Use in Soil Survey. Geoderma 2000, 97, 293–327. [Google Scholar] [CrossRef]
  9. McBratney, A.B.; Mendonça Santos, M.L.; Minasny, B. On digital soil mapping. Geoderma 2003, 117, 3–52. [Google Scholar] [CrossRef]
  10. Ozlu, E. Long-Term Impacts of Annual Cattle Manure and Fertilizer on Soil Quality under Corn-Soybean Rotation in Eastern South Dakota; South Dakota State University: Brookings, SD, USA, 2016. [Google Scholar]
  11. Ozlu, E.; Sandhu, S.S.; Kumar, S.; Arriaga, F.J. Soil health indicators impacted by long-term cattle manure and inorganic fertilizer application in a corn-soybean rotation of South Dakota. Sci. Rep. 2019, 9, 11776. [Google Scholar] [CrossRef] [Green Version]
  12. Mulder, V.; De Bruin, S.; Schaepman, M.; Mayr, T. The use of remote sensing in soil and terrain mapping—A review. Geoderma 2011, 162, 1–19. [Google Scholar] [CrossRef]
  13. Ozlu, E.; Kumar, S. Response of soil organic carbon, pH, electrical conductivity, and water stable aggregates to long-term annual manure and inorganic fertilizer. Soil Sci. Soc. Am. J. 2018, 82, 1243–1251. [Google Scholar] [CrossRef]
  14. Ozlu, E.; Kumar, S.; Arriaga, F.J. Responses of Long-Term Cattle Manure on Soil Physical and Hydraulic Properties under a Corn-Soybean Rotation at Two Locations in Eastern South Dakota. Soil Sci. Soc. Am. J. 2019, 83, 1459–1467. [Google Scholar] [CrossRef]
  15. Ozlu, E.; Kumar, S. Response of surface GHG fluxes to long-term manure and inorganic fertilizer application in corn and soybean rotation. Sci. Total Environ. 2018, 626, 817–825. [Google Scholar] [CrossRef] [PubMed]
  16. Grossman, R.; Reinsch, T. 2.1 Bulk density and linear extensibility. Methods Soil Anal. Part 4 Phys. Methods 2002, 5, 201–228. [Google Scholar]
  17. Kemper, W.; Rosenau, R. Aggregate stability and size distribution. Methods Soil Anal. Part 1 Phys. Mineral. Methods 1986, 5, 425–442. [Google Scholar]
  18. Klute, A.; Dirksen, C. Hydraulic conductivity and diffusivity: Laboratory methods. Methods Soil Anal. Part 1 Phys. Mineral. Methods 1986, 5, 687–734. [Google Scholar]
  19. Stetson, S.J.; Osborne, S.L.; Schumacher, T.E.; Eynard, A.; Chilom, G.; Rice, J.; Nichols, K.A.; Pikul, J.L., Jr. Corn residue removal impact on topsoil organic carbon in a corn–soybean rotation. Soil Sci. Soc. Am. J. 2012, 76, 1399–1406. [Google Scholar] [CrossRef]
  20. Silveira, M.; Comerford, N.; Reddy, K.; Cooper, W.; El-Rifai, H. Characterization of soil organic carbon pools by acid hydrolysis. Geoderma 2008, 144, 405–414. [Google Scholar] [CrossRef]
  21. Frostegård, A.; Tunlid, A.; Bååth, E. Phospholipid Fatty Acid Composition, Biomass, and Activity of Microbial Communities from Two Soil Types Experimentally Exposed to Different Heavy Metals. Appl. Environ. Microbiol. 1993, 59, 3605–3617. [Google Scholar] [CrossRef] [Green Version]
  22. Dick, R.P. Methods of Soil Enzymology; Soil Science Society of America: Madison, WI, USA, 2011. [Google Scholar]
  23. Armenise, E.; Redmile-Gordon, M.; Stellacci, A.M.; Ciccarese, A.; Rubino, P. Developing a soil quality index to compare soil fitness for agricultural use under different managements in the Mediterranean environment. Soil Tillage Res. 2013, 130, 91–98. [Google Scholar] [CrossRef]
  24. Brejda, J.J.; Moorman, T.B.; Karlen, D.L.; Dao, T.H. Identification of Regional Soil Quality Factors and Indicators I. Central and Southern High Plains. Soil Sci. Soc. Am. J. 2000, 64, 2115–2124. [Google Scholar] [CrossRef]
  25. Wander, M.M.; Bollero, G.A. Soil Quality Assessment of Tillage Impacts in Illinois. Soil Sci. Soc. Am. J. 1999, 63, 961–971. [Google Scholar] [CrossRef]
  26. Waswa, B.S.; Vlek, P.L.; Tamene, L.D.; Okoth, P.; Mbakaya, D.; Zingore, S. Evaluating indicators of land degradation in smallholder farming systems of western Kenya. Geoderma 2013, 195, 192–200. [Google Scholar] [CrossRef]
  27. Raiesi, F.; Kabiri, V. Identification of soil quality indicators for assessing the effect of different tillage practices through a soil quality index in a semi-arid environment. Ecol. Indic. 2016, 71, 198–207. [Google Scholar] [CrossRef]
  28. Nabiollahi, K.; Golmohamadi, F.; Taghizadeh, R.; Kerry, R.; Davari, M. Assessing the effects of slope gradient and land use change on soil quality degradation through digital mapping of soil quality indices and soil loss rate. Geoderma 2018, 318, 16–28. [Google Scholar] [CrossRef]
  29. Vasu, D.; Singh, S.K.; Ray, S.K.; Duraisami, V.P.; Tiwary, P.; Chandran, P.; Nimkar, A.M.; Anantwar, S.G. Soil quality index (SQI) as a tool to evaluate crop productivity in semi-arid Deccan plateau, India. Geoderma 2016, 282, 70–79. [Google Scholar] [CrossRef]
  30. Andrews, S.S.; Carroll, C.R. Designing a soil quality assessment tool for sustainable agroecosystem management. Ecol. Appl. 2001, 11, 1573–1585. [Google Scholar] [CrossRef]
  31. Karlen, D.; Wollenhaupt, N.; Erbach, D.; Berry, E.; Swan, J.; Eash, N.; Jordahl, J. Crop residue effects on soil quality following 10-years of no-till corn. Soil Tillage Res. 1994, 31, 149–167. [Google Scholar] [CrossRef]
  32. Goovaerts, P. Geostatistics for Natural Resources Evaluation; Oxford University Press: New York, NY, USA, 1997; pp. 47–56. [Google Scholar]
  33. Marschner, H. Marschner’s Mineral Nutrition of Higher Plants, 3rd ed.; Academic Press: Cambridge, MA, USA, 2011; pp. 135–150. [Google Scholar]
  34. Linn, D.M.; Doran, J.W. Effect of Water-Filled Pore Space on Carbon Dioxide and Nitrous Oxide Production in Tilled and Nontilled Soils. Soil Sci. Soc. Am. J. 1984, 48, 1267–1272. [Google Scholar] [CrossRef] [Green Version]
  35. Torbert, H.; Wood, C. Effects of soil compaction and water-filled pore space on soil microbial activity and N losses. Commun. Soil Sci. Plant Anal. 1992, 23, 1321–1331. [Google Scholar] [CrossRef]
  36. Du, Y.; Cui, B.; Zhang, Q.; Wang, Z.; Sun, J.; Niu, W. Effects of manure fertilizer on crop yield and soil properties in China: A meta-analysis. CATENA 2020, 193, 104617. [Google Scholar] [CrossRef]
  37. Jehan, S.; Iqbal, M.; Zahir, Z.A.; Farooq, M. Role of dairy manure in improving wheat yield under deficit irrigation. Pak. J. Bot. 2020, 52, 639–644. [Google Scholar] [CrossRef]
  38. Eghball, B. Liming effects of beef cattle feedlot manure or compost. Commun. Soil Sci. Plant Anal. 1999, 30, 2563–2570. [Google Scholar] [CrossRef]
  39. Yagi, R.; Ferreira, M.E.; Cruz, M.C.P.D.; Barbosa, J.C. Organic matter fractions and soil fertility under the influence of liming, vermicompost and cattle manure. Sci. Agric. 2003, 60, 549–557. [Google Scholar] [CrossRef]
  40. Ning, Q.; Chen, L.; Jia, Z.; Zhang, C.; Ma, D.; Li, F.; Zhang, J.; Li, D.; Han, X.; Cai, Z. Multiple long-term observations reveal a strategy for soil pH-dependent fertilization and fungal communities in support of agricultural production. Agric. Ecosyst. Environ. 2020, 293, 106837. [Google Scholar] [CrossRef]
  41. Ozlu, E.; Arriaga, F.J. The role of carbon stabilization and minerals on soil aggregation in different ecosystems. CATENA 2021, 202, 105303. [Google Scholar] [CrossRef]
  42. Jansa, J.; Mozafar, A.; Kuhn, G.; Anken, T.; Ruh, R.; Sanders, I.; Frossard, E. Soil tillage affects the community structure of mycorrhizal fungi in maize roots. Ecol. Appl. 2003, 13, 1164–1176. [Google Scholar] [CrossRef] [Green Version]
  43. Krauss, M.; Berner, A.; Perrochet, F.; Frei, R.; Niggli, U.; Mäder, P. Enhanced soil quality with reduced tillage and solid manures in organic farming—A synthesis of 15 years. Sci. Rep. 2020, 10, 4403. [Google Scholar] [CrossRef] [Green Version]
  44. Liu, Z.; Zhou, W.; Shen, J.; Li, S.; Ai, C. Soil quality assessment of yellow clayey paddy soils with different productivity. Biol. Fertil. Soils 2013, 50, 537–548. [Google Scholar] [CrossRef]
  45. Tripathi, R.; Shukla, A.; Shahid, M.; Nayak, D.; Puree, C.; Mohanty, S.; Raja, R.; Lal, B.; Gautam, P.; Bhattacharyya, P.; et al. Soil quality in mangrove ecosystem deteriorates due to rice cultivation. Ecol. Eng. 2016, 90, 163–169. [Google Scholar] [CrossRef]
  46. Zhang, Q.-C.; Shamsi, I.H.; Xu, D.-T.; Wang, G.-H.; Lin, X.-Y.; Jilani, G.; Hussain, N.; Chaudhry, A.N. Chemical fertilizer and organic manure inputs in soil exhibit a vice versa pattern of microbial community structure. Appl. Soil Ecol. 2012, 57, 1–8. [Google Scholar] [CrossRef]
  47. DAS, B.; Chakraborty, D.; Singh, V.K.; Ahmed, M.; Singh, A.K.; Barman, A. Evaluating Fertilization Effects on Soil Physical Properties Using a Soil Quality Index in an Intensive Rice-Wheat Cropping System. Pedosphere 2016, 26, 887–894. [Google Scholar] [CrossRef]
  48. Liu, Z.; Rong, Q.; Zhou, W.; Liang, G. Effects of inorganic and organic amendment on soil chemical properties, enzyme activities, microbial community and soil quality in yellow clayey soil. PLoS ONE 2017, 12, e0172767. [Google Scholar] [CrossRef] [PubMed]
  49. Zhou, M.; Xiao, Y.; Li, Y.; Zhang, X.; Wang, G.; Jin, J.; Ding, G.; Liu, X. Soil quality index evaluation model in responses to six-year fertilization practices in Mollisols. Arch. Agron. Soil Sci. 2020, 68, 180–194. [Google Scholar] [CrossRef]
  50. Karlen, D.L.; Mausbach, M.J.; Doran, J.W.; Cline, R.G.; Harris, R.F.; Schuman, G.E. Soil Quality: A Concept, Definition, and Framework for Evaluation (A Guest Editorial). Soil Sci. Soc. Am. J. 1997, 61, 4–10. [Google Scholar] [CrossRef] [Green Version]
  51. Cherubin, M.R.; Eitelwein, M.T.; Fabbris, C.; Weirich, S.W.; Da Silva, R.F.; Da Silva, V.R.; Basso, C.J. Physical, chemical, and biological quality in an Oxisol under different tillage and fertilizer sources. Rev. Bras. Ciênc. Solo 2015, 39, 615–625. [Google Scholar] [CrossRef] [Green Version]
  52. Şenol, H.; Alaboz, P.; Demir, S.; Dengiz, O. Computational intelligence applied to soil quality index using GIS and geostatistical approaches in semiarid ecosystem. Arab. J. Geosci. 2020, 13, 1235. [Google Scholar] [CrossRef]
  53. Lee, C.-H.; Wu, M.-Y.; Asio, V.B.; Chen, Z.-S. Using a soil quality index to assess the effects of applying swine manure compost on soil quality under a crop rotation system in Taiwan. Soil Sci. 2006, 171, 210–222. [Google Scholar] [CrossRef] [Green Version]
Figure 1. Study location and experimental design in eastern, South Dakota, USA. (A): South Dakota State; (red circle is study location) (B): Treatments Design. LM, low manure rate based on recommended phosphorus rate; MM, medium manure rate based on recommended nitrogen rate; HM, high manure rate based on double of the recommended nitrogen rate; MF, recommended fertilizer; HF, high fertilize; and CK, control with no manure application.
Sustainability 14 07593 g001
Figure 2. Person’s correlation matrix for the highly weighted soil variables under the first six facts: pH, soil acidity; SOC, soil organic carbon; TN, total nitrogen; WSA, water stable aggregates; SPR, soil penetration resistance; CWEC, cold water extractable carbon; HWEC, hot water extractable carbon; AEC-6, six molar acid (HCL) extractable carbon; CWEN, cold water extractable nitrogen; HWEN, hot water extractable nitrogen; EUC, eucaryote; FUN, fungi; G-, gram negative bacteria; PLFA, Phospholipid fatty acid; GWP, global warming potential; CY, crop yield.
Sustainability 14 07593 g002
Figure 3. Plot of PC1 and PC2 separating fertilizer treatments (A) and plot showing how individual soil indicators contributed to the separation of treatments (B). LM, low manure rate based on recommended phosphorus rate; MM, medium manure rate based on recommended nitrogen rate; HM, high manure rate based on double of the recommended nitrogen rate; MF, recommended fertilizer; HF, high fertilizer; and CK, control with no manure application.
Sustainability 14 07593 g003
Figure 4. The soil quality index in the study area. Grid size of 8 × 16 m. LM, low manure rate based on recommended phosphorus rate; MM, medium manure rate based on recommended nitrogen rate; HM, high manure rate based on double of the recommended nitrogen rate; MF, recommended fertilizer; HF, high fertilizer; and CK, control with no manure application.
Sustainability 14 07593 g004
Figure 5. Spatial distribution maps of soil quality index under manure and inorganic fertilizer applications.
Sustainability 14 07593 g005
Table 1. Soil properties under different rates of manure and inorganic fertilizer applications.
PropertyMeanp-Value
LM MMHMHFMFCK
pH6.91 6.907.056.386.666.86<0.01
EC1.151.512.010.660.750.72<0.01
SOC27.630.938.325.824.023.3<0.01
TN2.522.803.452.642.302.24<0.01
WSA91.993.598.687.489.290.10.01
Pb1.131.070.871.231.221.20<0.01
SPR3113653353123022850.1
WC3000.500.530.510.420.430.45<0.01
CWEC0.140.150.310.120.090.08<0.01
HWEC0.750.701.140.640.610.52<0.01
AEC-19.129.929.887.727.627.630.01
AEC-68.568.9311.008.197.687.690.01
CWEN0.040.040.090.030.030.03<0.01
HWEN0.120.120.190.090.080.07<0.01
AEN-11.731.891.941.471.501.450.02
AEN-61.791.942.381.781.731.660.01
EUC9.176.867.286.7910.946.490.01
AMF3.284.504.933.703.402.650.04
FUN4.745.905.173.824.914.100.05
G-46.747.948.545.043.758.20.5
G+18.818.018.321.017.212.70.06
ACT14.414.313.217.017.213.3<0.01
PLFA83.591.2106.384.073.442.30.4
UA23.924.424.920.520.419.7<0.01
βA24.325.025.623.722.220.3<0.01
WFPS51.852.847.148.554.753.40.01
CK, control with no manure application; HF, high fertilizer; HM, nitrogen-based double of recommended manure application rate; LM, phosphorus-based recommended manure; MF, recommended fertilizer; MM, nitrogen-based recommended manure. Means followed by different letters between each treatment within each depth represent significant differences due to manure and inorganic fertilizer application at p < 0.05.
Table 2. Results of principal component analysis.
PropertyFactor Loading Contribution of Variables (%) #
PC1PC2PC3PC4PC5PC6PC1PC2PC3PC4PC5PC6
pH0.34−0.030.32−0.120.76−0.221.130.043.180.7430.51.63
EC0.810.010.410.140.26−0.076.420.005.280.973.480.18
SOC0.910.080.310.170.030.068.040.342.971.560.040.12
TN0.850.170.20−0.01−0.010.077.131.551.300.010.000.19
WSA0.65−0.340.320.190.23−0.154.105.893.251.902.660.82
Pb−0.890.08−0.29−0.310.020.196.710.302.694.820.021.24
SPR0.200.110.850.090.030.020.400.6722.50.380.050.01
WC3000.32−0.190.490.450.540.041.001.837.4010.315.20.05
CWEC0.92−0.010.240.07−0.050.078.210.001.780.280.150.18
HWEC0.870.040.29−0.030.080.137.370.082.530.040.310.60
AEC-10.61−0.230.310.390.160.313.662.642.927.801.273.43
AEC-60.93−0.060.080.17−0.030.118.460.160.181.420.030.45
CWEN0.93−0.040.040.070.030.078.440.070.050.240.040.16
HWEN0.870.010.430.030.110.087.360.005.750.050.580.22
AEN-10.62−0.150.170.370.230.503.711.120.927.062.718.88
AEN-60.82−0.15−0.070.210.070.286.631.190.142.230.252.79
EUC−0.180.84−0.04−0.030.150.130.3137.00.050.031.160.59
AMF0.51−0.240.200.160.010.562.503.001.251.350.0010.8
FUN0.150.120.190.90−0.09−0.120.230.791.1441.40.430.47
G-−0.01−0.48−0.070.090.13−0.840.0011.90.130.370.9224.7
G+0.120.26−0.03−0.16−0.010.860.143.380.031.340.0126.2
ACT−0.35−0.030.05−0.45−0.480.441.230.040.0710.312.06.77
PLFA0.300.720.190.28−0.220.320.8826.91.153.982.613.67
UA0.31−0.020.800.150.070.030.950.0219.91.130.280.03
βA0.54−0.070.630.06−0.040.372.840.2212.20.160.104.72
WFPS−0.470.12−0.20−0.060.690.172.140.791.270.1725.21.06
Eig12.83.331.921.491.341.21
Var39.37.3912.37.57.3310.9
Cum39.346.759.066.573.984.8
Bold values under each PC were highly weighted and underlined bold values were selected to MDS. # Bold values represent the importance of the principal component for a given variable.
Table 3. MDS indicators and weights.
IndicatorWeightIndicatorWeight
AEC-60.464FUN0.088
EUC0.087pH0.086
SPR0.073WFPS0.086
UA0.073G+0.129
AEC-6, six molar HCL extractable carbon; EUC, eukaryote; SPR, soil penetration resistance; UA, urease activity.
Table 4. Effects of long-term manure and fertilizer treatments on SQI.
TreatmentSQI
(%)
Crop Yield
(Mg ha−1)
GWP
(kg CO2-eq ha−1 yr−1)
LM54.8 b3.34 b258 b
MM55.8 b3.53 ab1028 b
HM69.6 a3.65 a1565 a
MF47.3 bc3.33 b93 b
HF44.9 bc3.40 ab568 b
CK36.3 †c&3.06 c91 b
ANOVA<0.01<0.010.01
: standard error of the mean, &: Different letters in a column indicate significant differences (p < 0.05) among treatments. LM, low manure rate based on recommended phosphorus rate; MM, medium manure rate based on recommended nitrogen rate; HM, high manure rate based on double of the recommended nitrogen rate; MF, recommended fertilizer; HF, high fertilizer; and CK, control with no manure application.
Publisher’s Note: MDPI stays neutral with regard to jurisdictional claims in published maps and institutional affiliations.

