Article

Wheat Production in Drought-Prone Agro-Ecologies in Ethiopia: Diagnostic Assessment of Farmers’ Practices and Sustainable Coping Mechanisms and the Role of Improved Cultivars

1
African Centre for Crop Improvement, University of KwaZulu-Natal, Private Bag X01, Pietermaritzburg 3209, South Africa
2
Ethiopian Institute of Agricultural Research, Addis Ababa P.O. Box 2003, Ethiopia
*
Author to whom correspondence should be addressed.
Sustainability 2022, 14(13), 7579; https://doi.org/10.3390/su14137579
Submission received: 26 April 2022 / Revised: 26 May 2022 / Accepted: 27 May 2022 / Published: 22 June 2022
(This article belongs to the Topic Climate Change and Environmental Sustainability)

Abstract

:
Wheat (Triticum aestivum L.) is traditionally cultivated under drought-affected and low-input agro-ecologies in sub-Saharan Africa, including Ethiopia. Wheat productivity in these agro-systems is considerably low (<2.4 t/ha) due to climate change-induced drought and heat stress, a lack of modern production technologies, including climate-smart varieties, and an array of biotic and abiotic factors. The objective of this study was to determine the potential of wheat production in drought-prone agro-ecologies and to assess farmers’ practices and sustainable coping mechanisms and the role of improved cultivars in Ethiopia. A participatory rural appraisal (PRA) study was conducted involving 170 randomly selected wheat farmers in the drier areas of Arsi Zone of the Oromia Regional State. Results showed that wheat and tef (Eragrostis tef Zucc.) and barley (Hordeum vulgare L.) were the most widely grown cereal crops in the study areas as the primary food source and cash income. Yield losses varying from 63.1 to 73.8% were reported by farmers due to drought stress occurring mainly during grain filling stage. The majority of the respondent farmers (>50%) planted wheat in early July using the broadcasting method. Their land was of medium fertility, and the application of inorganic fertilizer was suboptimal. Due to crop failures by intense drought conditions in the study areas, above 50% of the respondent farmers had not expressed coping strategies against drought stress except resorting to government food aid. However, about 22% of the respondent farmers reported improved agronomic practices, such as the cultivation of early maturing wheat varieties and soil and water conservation methods as sustainable solutions to mitigate against drought. Therefore, current and future wheat breeding in Ethiopia should target drought and heat stress tolerance and adaptive crop traits as ideal coping strategies under low input agriculture systems for sustainable wheat production and productivity.

1. Introduction

Bread wheat (Tiriticum aestivum L., 2n = 6 x = 42) is an important commodity crop for local, regional and global food security. In Ethiopia, wheat ranks second after maize (Zea mays L.) in total production and third after tef and maize in the cultivated area [1]. Wheat provides about 15% of the national caloric intake [2]. Ethiopia is ranked first in wheat production in sub-Saharan Africa (SSA) followed by South Africa [3]. However, its average productivity of 2.4 t ha−1 is lower than 6.7, 3.5, and 3.0 t ha−1 reported in Egypt, South Africa, and Kenya, respectively [2]. Ethiopia still imports wheat to meet the growing local demand due to population growth, the emergence of agro-processors, urbanization, and increased household income [4,5].
A number of biotic, abiotic, and socio-economic factors cause low wheat production and productivity in SSA, including Ethiopia. The challenges vary from one environment to another due to variable climatic factors spanning from low lying areas at sea level to uplands around 4570 m above sea level [6]. In Ethiopia, the major wheat-producing areas are concentrated mainly at high potential environments ranging from mid-altitude (1900 to 2300 m above sea level) to high altitude (2300 to 2700 m above sea level), which have high and reliable rainfall. Because of climate change induced by global warming, drought stress is becoming a recurrent threat, including high potential production regions. The major wheat producing areas in Ethiopia include Bale and Arsi (situated in Oromia Region), Hadiya and Kenbata (Southern Nations and Nationalities and Peoples Region) and East Gojam and North Shoa (Amhara Region) [5].
Developing improved wheat varieties that are adapted to drought stress conditions will improve wheat production under smallholder farming systems in dryland agriculture. Dryland areas are characterized by low input production systems and complex and highly heterogeneous environments, making research and development interventions challenging. Participatory rural appraisal (PRA) is a multi-disciplinary research tool that involves several stakeholders in a value chain [7], and thus allow for analysis and interpretation of their production constraints and the formulation of possible intervention strategies. The PRA will help actors in the value chain, including researchers, to understand better the challenges faced by the farmers and their technology selection criteria and develop projects accordingly [8]. Engaging farmers through a PRA to identify their challenges and needs will assist in developing technologies, including improved cultivars that meet farmers’ expectations and are adapted to their production environments [8,9,10]. Developing improved production technologies relevant to the farmers will improve adoption rates [7,11,12,13,14], thereby increasing household income and improving the food security of smallholder farmers [4,15]. Hence, the objective of this study was to determine the potential of wheat production in drought-prone agro-ecologies and assess farmers’ practices and sustainable coping mechanisms and the role of improved cultivars in Ethiopia.

2. Materials and Methods

2.1. Description of the Study Areas

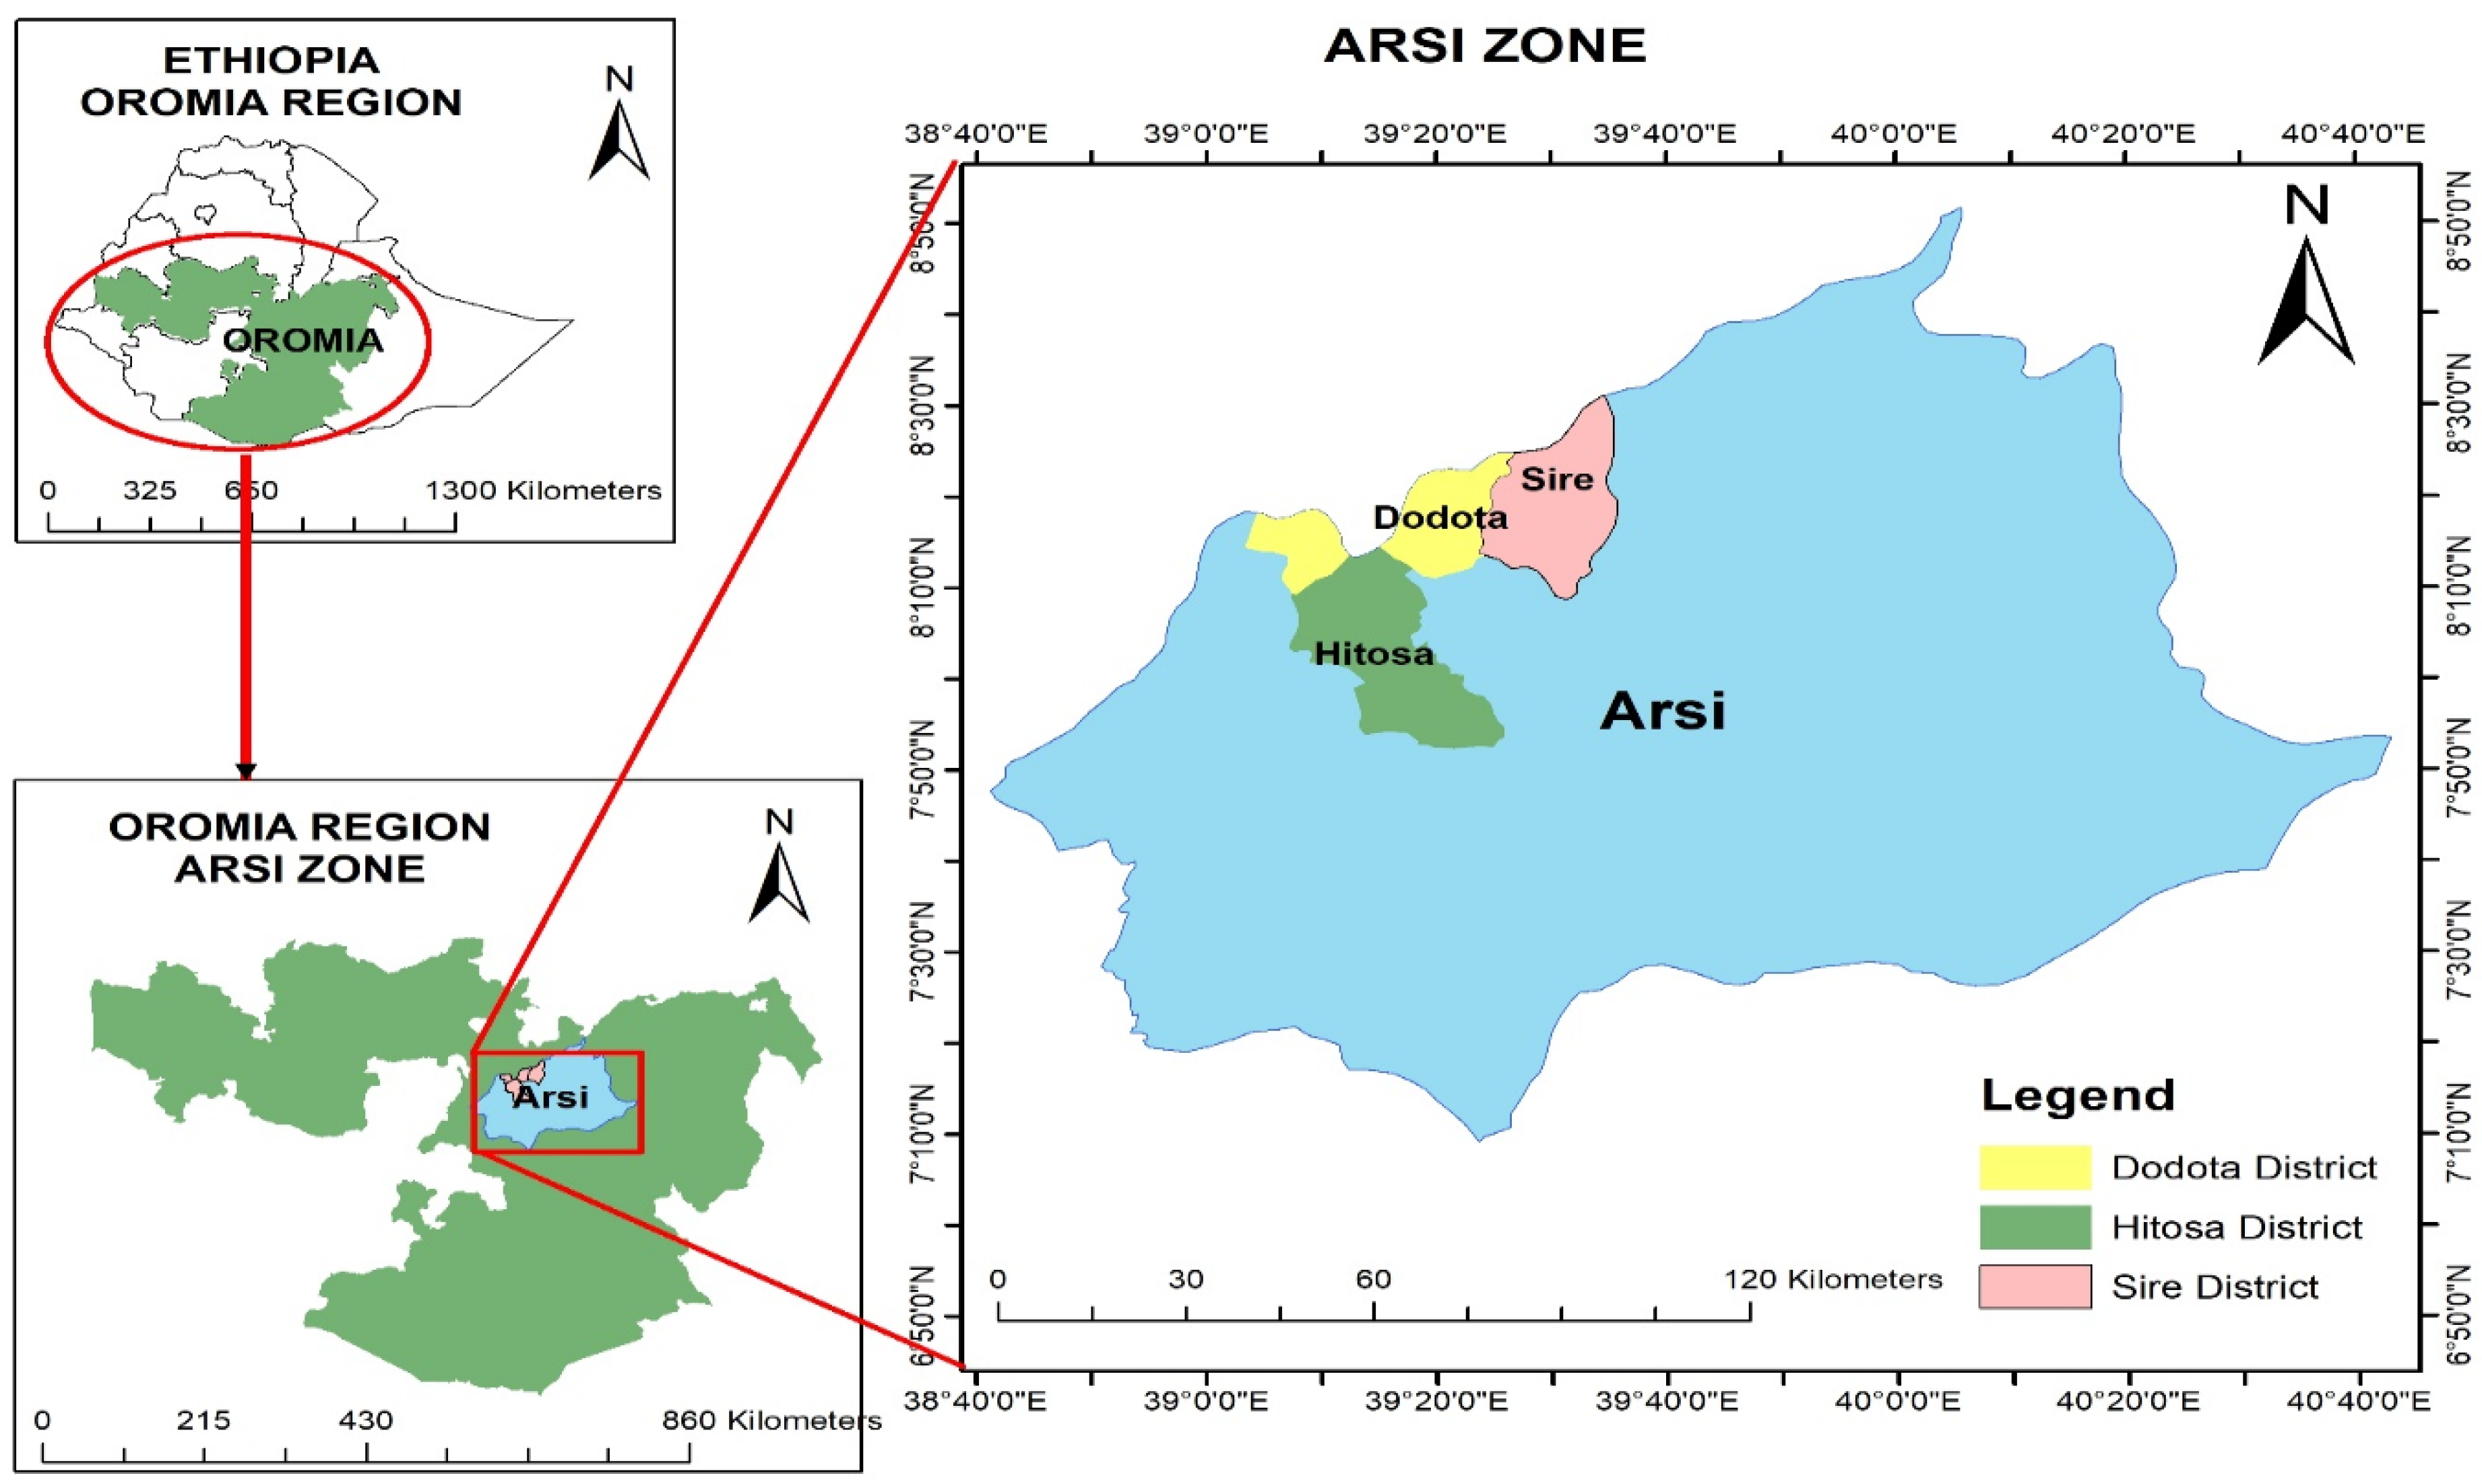
The study was conducted in the Arsi zone in Ethiopia’s Oromia regional state during the 2018 cropping season. The region is known as one of the major wheat-producing areas in the country. Three districts (Sire, Dodota, and Hetosa) were purposively selected for this study (Figure 1 and Table 1). The two districts, Sire and Hetosa, were among the top wheat-producing areas [16]. Dodota and Sire districts (previously known as Dodota Sire district) were among the most drought-affected districts, where up to 95% of farmers harvest was lost due to prolonged drought conditions [17], whereas Hetosa district is among the highest potential areas of wheat production where agriculture is relatively well-mechanized, and infrastructure for input access relatively exists. However, this district is also partially characterized by moisture stressed areas, according to the Bureau of Agriculture and Natural Resources (BOANR) staff of the district and personal observations.

2.2. Sampling and Data Collection Procedure

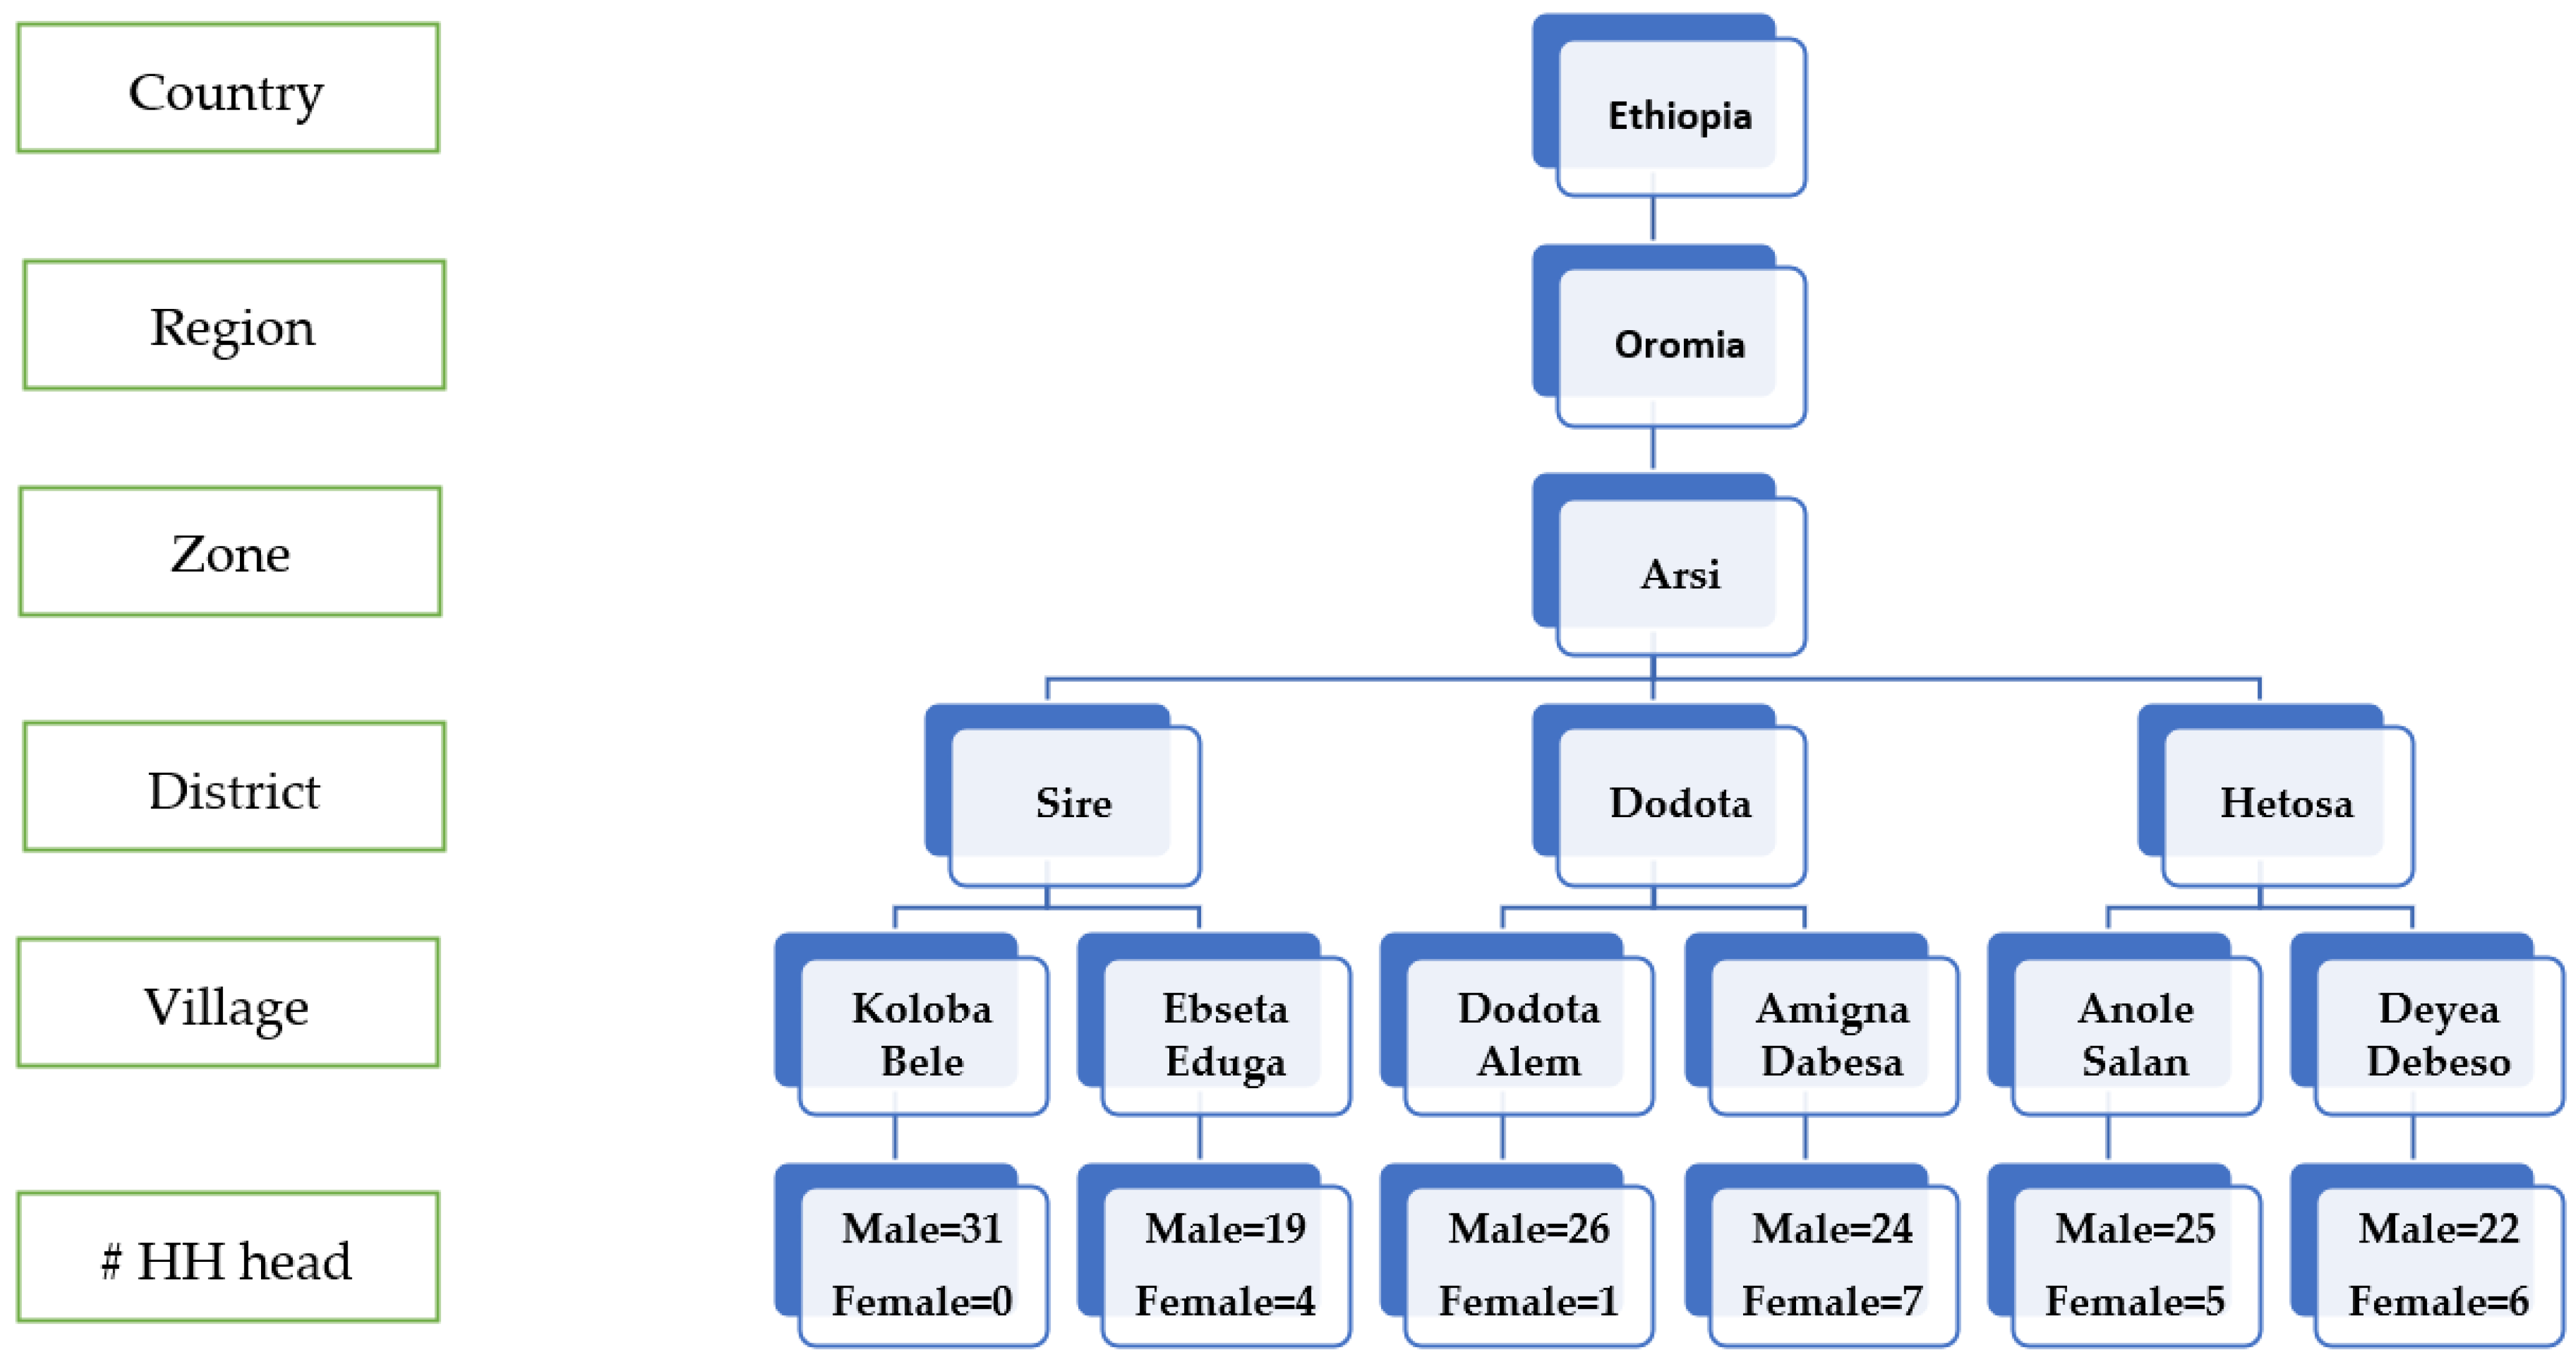
The study used a multistage random sampling method (Figure 2). At the first stage of sampling, the major wheat producing region, zone, and three districts from this zone were selected based on primary data collected from the Ethiopian Central Statistical Agency and using secondary data as described in the Section 2.1. Secondly, two villages (locally referred to as “Kebeles”) from each district were selected, making a total of six villages for the study. Villages accessible to the main roads and that produce wheat under dryland system were selected. At the third stage of sampling, 23–31 households from each village were randomly selected, resulting in a total of 170 household respondents out of which 13.5% were female-headed households (Figure 2).
A semi-structured questionnaire was used to collect primary data from respondent farmers based on their previous season’s wheat production experience. Enumerators were researchers, technicians, and agriculture extension staff, and they are all well aware of the questionnaire. The primary data were collected on wheat production and other sectors of livelihood/economic activity, and the relative importance of wheat production was compared with other major crops production, farmers’ major production practice of wheat and related crops, and the impact of drought stress and farmers’ coping strategies. The questionnaire was amended based on the pre-tested sample of five respondent farmers. Local languages (Oromiffa and Amharic) were used during the interview with the help of local people and agricultural extension staff stationed in the respective areas. Designed checklist and key informants such as district agricultural office leaders, agricultural extension officers, village agricultural extension officers, and village leaders were involved in collecting secondary data on the cropping system, cropping calendar, and impact of drought in the farming community. In addition, a transect walk across the village was made to visualize and appreciate the cropping system and weather conditions of the areas. The respective districts’ BOANR offices also provided the quantitative data that further described the study areas regarding altitude, geographic position, rainfall pattern, annual rainfall, and temperature.

2.3. Data Analysis

Statistical analyses such as frequency, percentages, chi-square, and Kruskal–Wallis H tests were employed using the Statistical Package for Social Sciences (SPSS) version 24 [19]. Relationships among variables were examined through frequency, percentages, chi-square, and Kruskal–Wallis H test values within and between districts to make the necessary contracts and discern conclusions.

3. Results

3.1. Wheat Production and Other Sectors of Economic Activity in the Study Areas

The wealth status of smallholder farmers can be a determining factor in adopting improved agricultural technologies, including improved cultivars. The Chi-square analysis showed that sources of income significantly differed (X2 = 28.185; p = 0.013) between the studied districts (Table 2). Trading of the produce of field crops was the major source of income for all the respondents in the study areas, with bread wheat being the predominant field crop and a major income earner. The respondent farmers explained that the income generated from trading wheat is used for various purposes such as paying children’s school fees, purchasing fertilizers, and buying other foodstuffs, among others (data not shown). The sale of vegetable produce was also an important source of income, although practiced on a relatively small scale compared to field crops, explaining its lower contribution to household income. The farmers in the study areas also practiced animal husbandry, rearing smaller livestock such as goats, sheep, and chickens to complement their income derived from field crops. Larger livestock such as cattle and donkeys were reared for other purposes such as a source of draught power and means of transport of goods and water. The majority of the farmers cited the prevalence of diseases as a major constraint to cattle rearing in the areas. During drought years and crop failure, the farmers are usually forced to sell off the larger livestock, even the oxen that provide the key draught power, to survive (data not presented). This implies that the livelihood of the farmers in the areas primarily depends on rainfed crop production. Small shops that sell day-to-day wares, water fetching, and labor hire were the other sources of income for the farmers in the study areas.

3.2. The Relative Importance of Wheat and Other Major Crops Production

All the farmers in Sire and 96.6% of the Dodota and Hetosa districts considered wheat production their most crucial income source (Table 3). In the Sire and Hetosa districts, the adaptability of wheat was the next important characteristic according to more than 91% of the respondents, whereas 96.6% of the respondents in the Dodota District considered the quality of straw for animal feed to be more important than adaptability. Adaptation and high yield were considered to be more important than disease tolerance, early maturity, and waterlogging tolerance in all the districts. The most important crop in all the study areas was wheat, followed by tef, barley, maize, garlic, onion, and haricot bean (Table 4). Wheat production was the lowest in Sire District compared to the Hetosa and Dodota districts, with the average area under cultivation of 0.5, 1.1, and 1.5 ha, respectively. Tef was cultivated more extensively in Sire District, with a mean of 1.2 ha compared to 0.5 ha for wheat. Wheat productivity in all the districts was relatively the same, with an average of 2.4 t ha−1 (Table 4).

3.3. Farmers’ Major Production Practice of Wheat and Related Crops

The time of planting was mostly in the month of July in all the districts, although there were some significant differences among farmers across different districts (X2 = 25.099; p = 0.005) (Table 5). The majority of respondent farmers in Sire (72.2%) and Hetosa (56.9%) planted wheat at the beginning of July. In Dodota, a similar proportion of farmers planted in early July (46.6%) or late June to early July (43.1%). The farmers across districts exhibited significant differences in planting (X2 = 34.658; p = 0.000) and weeding (X2 = 25.326; p = 0.000) methods they followed. The majority (>80%) of farmers in Dodota and Hetosa districts planted their wheat using the broadcast method, while both broadcasting (46.3%) and row planting (37%) were used extensively in the Sire District. The majority (more than 70%) of farmers in each of the districts described their soil fertility status as medium and that they applied mostly inorganic fertilizers. About 40% of farmers in the Dodota District used both inorganic and organic fertilizers compared to 34.5 and 24.1% in Hetosa and Sire districts, respectively. Almost all of the respondents (more than 95%) followed a wheat/tef or barley rotation system. A combination of chemical and manual weeding was practiced widely by more than 77% in each district.

3.4. The Impact of Drought Stress and Farmers’ Coping Strategies

The respondents indicated that moisture stress occurred mostly during seedling emergence and crop grain-filling stages of the wheat (Table 6). The occurrence of drought stress at the seedling emergence stage commonly coincided with the late onset of rain in the areas, as indicated by respondents. Moisture stress reduced yields ranging between 63.1 and 73.8% within the studied regions. Compared to optimum conditions, the yield was the lowest in Dodota with a mean of 0.8 t ha−1, followed by Sire (0.9 t ha−1) and Hetosa (1.2 t ha−1) under drought-stressed conditions (Table 7).
The chi-square analysis showed that respondents among districts used significantly different (X2 = 25.3; p = 0.000) coping mechanisms against moisture stress (Table 8). The lack of options and dependence on government food aid during drought years were significantly high in Sire and Dodota, with 51.9 and 58.6% of the respondents confirming that they lacked coping strategies to reduce the impact of drought stress. Early maturing varieties were the most widely used coping strategy by 35.2, 32.8, and 29.3% of respondents in Sire, Hetosa, and Dodota districts, respectively. The dependence on government food aid was significantly lower in Hetosa, with only 25.9% of the respondents confirming receipt of the aid. The farmers in Hetosa also used other methods such as soil and water conservation and replacing wheat with other relatively drought-tolerant crops.

4. Discussion

In Ethiopia, wheat breeding for drought-stressed environments should target incorporating farmers’ preferred traits and drought tolerance under low input agriculture systems. This will ensure sustainable wheat production and productivity in the country. The present study enables agronomists and breeders to gain insight into farmers’ bread wheat production practices and the challenges pertinent to their production systems, especially under drought-stress environments where research and development effort is relatively low. Crop production was the most important source of income among the surveyed districts. Farmers in the study areas owned farm size ranged between 0.0 and 6.0 hectares with a mean value of 1.9. Wheat, tef, and barley were found to be the main crops cultivated in the study areas. The majority of the farmers planted wheat in early July using the broadcasting method. However, differences in farming practices between high and low potential environments are common due to differences in production risk, and the adoption of the most appropriate planting method [20]. Most of the farmers (75.3%) mentioned that their land was of medium fertility and depended on inorganic fertilizer applications, although the application rates were sub-optimal (data not presented). Gebreselassie et al. [5] and Kebede et al. [21] also found that inorganic fertilizers were used sparingly by smallholder farmers, implying that the provision of fertilizers in addition to improved varieties could boost the production and productivity of wheat in the study areas.
Wheat production was influenced by its relative importance in income generation, food and feed production, and adaptability to the environment. While the importance of wheat as a food source for humans is well documented [2], the respondents also mentioned the use of wheat straw as feed for livestock from the crop residue, agreeing with Bekele et al. [22]. Respondent farmers ranked drought (moisture-stress) as the most important production constraint, followed by disease (rust), the high cost of fertilizer, and heat-stress. As most respondent farmers indicated, drought stress at the grain filling stage was the most commonly occurring, followed by seedling emergency and heading stages. The drought stress impacts on wheat yield production in the study areas could be explained by about 63–74% yield reduction. Severe moisture stress occurred at the grain filling stage in tef, and yield reduction was estimated at 36.7–60.3 per cent [23].
The majority of the respondent farmers had no coping strategies against drought except government food aid, implying an urgent need to develop holistic and multi-faceted approaches to mitigate against drought. This includes developing and adopting improved varieties and agricultural practices and alternative crops and cropping systems for income generation. Among the improved agronomic practices, the growing of early maturing varieties, and soil and water conservation activities are being practiced by some of the farmers in the study areas.

5. Conclusions

This study proved the hypothesis that there were different farmers’ practices and drought coping mechanisms of bread wheat production in drought-prone areas. Drought-stress accounted for up to 74% yield losses in all the study areas. Drought occurs mainly at grain filling stage of the crop. Therefore, developing drought-tolerant wheat cultivars and farmers’ preferred traits can be a sustainable strategy in dryland farming systems.

Author Contributions

We designed the study and wrote the manuscript; Y.B. collected and analyzed the data and drafted the manuscript; H.S. reviewed and edited the manuscript; M.L. edited the manuscript. All authors have read and agreed to the published version of the manuscript.

Funding

The study was funded by Alliance for a Green Revolution in Africa (AGRA) through African Centre for Crop Improvement (ACCI).

Institutional Review Board Statement

Not applicable.

Informed Consent Statement

Not applicable.

Data Availability Statement

Not applicable.

Acknowledgments

We are grateful to farmers of the study zone who made this participatory rural appraisal study possible. The bureau of agriculture staff at district level, development agents, and Holetta research centre are also gratefully acknowledged. Due thanks goes also to the Alliance for a Green Revolution in Africa for funding this research through the African Centre for Crop Improvement.

Conflicts of Interest

The authors declare that they have no conflict of interest.

References

  1. CSA. Area and Production of Crops in the Main Season; Statistical Bulletin; Central Statistical Agency (CSA): Addis Ababa, Ethiopia, 2020. [Google Scholar]
  2. Minot, N.; Warner, J.; Lemma, S.; Kassa, L.; Gashaw, A.; Rashid, S. The Wheat Supply Chain in Ethiopia: Patterns, Trends, and Policy Options; International Food Policy Research Institute (IFPRI): Washington, DC, USA, 2015. [Google Scholar]
  3. Tadesse, W.; Bishaw, Z.; Assefa, S. Wheat production and breeding in Sub-Saharan Africa: Challenges and opportunities in the face of climate change. Int. J. Clim. Chang. Strateg. Manag. 2019, 11, 696–715. [Google Scholar] [CrossRef] [Green Version]
  4. Shiferaw, B.; Kassie, M.; Jaleta, M.; Yirga, C. Adoption of improved wheat and impacts on household food security in Ethiopia. Food Policy 2014, 44, 272–284. [Google Scholar] [CrossRef]
  5. Gebreselassie, S.; Mekbib, G.H.; Matthias, K. The Wheat Sector in Ethiopia: Current Status and Key Challenges for Future Value Chain Development; ZEF Working Paper No. 160. 2017. Available online: https://papers.ssrn.com (accessed on 21 June 2019).
  6. Tadesse, W.; Solh, M.; Braun, H.J.; Oweis, T.; Baum, M. Approaches and Strategies for Sustainable Wheat Production; International Centre for Agricultural Research in the Dry Areas (ICARDA): Beirut, Lebanon, 2016. [Google Scholar]
  7. Tongoona, P.; Danqah, A.; Danqah, E.Y. Understanding clients’ needs. In The Business of Plant Breeding: Market-Led Approaches to New Variety Design in Africa; Persley, G.J., Anthony, M.V., Eds.; CABI: London, UK, 2017; pp. 63–84. [Google Scholar]
  8. Halewood, M.; Deupmann, P.; Sthapit, B.; Vernooy, R.; Ceccarelli, S. Participatory Plant Breeding to Promote Farmers’ Rights; Bioversity International: Rome, Italy, 2007. [Google Scholar]
  9. Ceccarelli, S.; Grando, S.; Baum, M. Participatory plant breeding in water-limited environments. Exp. Agric. 2007, 43, 411–435. [Google Scholar] [CrossRef]
  10. Li, J.; Edith, T.; Buerenc, L.; Huang, K.; Qin, L.; Song, Y. The potential of participatory hybrid breeding. Int. J. Agric. Sustain. 2013, 11, 234–251. [Google Scholar] [CrossRef]
  11. Vernooy, R.; Stanley, B. Breeding better barley-together: A New Way to Work with Farmers in Dry Areas: Seeds That Give; Participatory Plant Breeding Case Study Series; International Development Research Centre, IDRC: Ottawa, ON, Canada, 2003. [Google Scholar]
  12. Witcombe, J.R.; Joshi, K.D.; Gyawali, S.A.; Musa, M.; Johansen, C.; Virk, D.S.; Sthapit, B.R. Participatory plant breeding is better described as highly client-oriented plant breeding. I. Four indicators of client-orientation in plant breeding. Exp. Agric. 2005, 41, 299–319. [Google Scholar] [CrossRef] [Green Version]
  13. Joshi, K.D.; Musa, A.M.; Johansen, C.; Gyawali, S.; Harris, D.; Witcombe, J.R. Highly client oriented breeding, using local preferences and selection, produces widely adapted rice varieties. Field Crops Res. 2006, 100, 107–116. [Google Scholar] [CrossRef]
  14. Ceccarelli, S.; Guimarães, E.P.; Weltzien, E. Plant Breeding and Farmer Participation; Food and Agriculture Organization of the United Nations: Rome, Italy, 2009. [Google Scholar]
  15. Asfaw, S.; Shiferaw, B.; Simtowe, F.; Lipper, L. Impact of modern agricultural technologies on smallholder welfare: Evidence from Tanzania and Ethiopia. Food Policy 2012, 37, 283–295. [Google Scholar] [CrossRef] [Green Version]
  16. Warner, J.; Tim, S.; Leulsegged, K. Woreda-Level Crop Production Rankings in Ethiopia: A Pooled Data Approach; International Food Policy Research Institute (IFPRI): Addis Ababa, Ethiopia, 2015. [Google Scholar]
  17. Piguet, F. Assessment Field Trip to Arsi Zone (Oromiya Region); Field Assessment Mission, 7–10 April and 15–17 April; UN-EUE: Addis Ababa, Ethiopia, 2003. [Google Scholar]
  18. Semahegn, Y.; Shimelis, H.; Laing, M.; Mathew, I. Farmers’ preferred traits and perceived production constraints of bread wheat under drought-prone agro-ecologies of Ethiopia. Agric. Food Secur. 2021, 10, 18. [Google Scholar] [CrossRef]
  19. Statistical Product and Service Solutions (SPSS). SPSS for Windows Release 24.0, SPSS Inc. 1989–2016; IBM Company: Armonk, NY, USA, 2016. [Google Scholar]
  20. Abate, G.T.; de Brauw, A.; Minot, N.; Bernard, T. The Impact of the Use of New Technologies on Farmers Wheat Yields in Ethiopia: Evidence from a Randomized Controlled Trial; International Food Policy Research Institute: Washington, DC, USA, 2014. [Google Scholar]
  21. Kebede, D.; Ketema, M.; Dechassa, N.; Hundessa, F. Determinants of adoption of wheat production technology package by smallholder farmers: Evidences from Eastern Ethiopia. Turk. J. Agric. For. 2017, 5, 267–274. [Google Scholar] [CrossRef] [Green Version]
  22. Bekele, A.; Nigussie, D.; Judith, F.; Assefa, K.; Geleti, D. Farmer Innovation: An Approach for Narrowing a Gap between Research, Extension and Farmers in Ethiopia; Crop Science Society of Ethiopia (CSSE): Addis Ababa, Ethiopia, 2015. [Google Scholar]
  23. Abraha, M.T. Breeding tef [Eragrostis tef (Zucc.) Trotter] for Drought Tolerance in Northern Ethiopia. Ph.D. Thesis, University of KwaZulu-Natal, Pietermaritzburg, South Africa, 2016. [Google Scholar]
Figure 1. Map of the study areas in Ethiopia [18].
Sustainability 14 07579 g001
Figure 2. Stages of sampling showing the selected region, zone, districts, villages, and number of households (HH).
Sustainability 14 07579 g002
Table 1. Climatic and geographic descriptions of the study areas.
DistrictVillageAltitude (masl)Geographic CoordinatesRainfall (mm)Temperatute (°C)
MinMax
SireKoloba Bele1000–25007°20′0″ N5001530
Ebseta Eduga39°26′0″ E
DodotaDodota Alem1400–25008°14′60″ N10002025
Amigna Dabesa39°19′60″ E
HetosaAnole Salan1500–41708°04′60″ N10001427
Deyea Debeso39°14′60″ E
masl, meter above sea level; mm, millimeter; min, minimum; max, maximum.
Table 2. Sources of income of the households in the study areas.
DescriptionsDistrictsDegrees of FreedomX2-Valuep-Value
SireDodotaHetosa
Sources of income
Field crops54 (100)58 (100)58 (100)1428.10.013
Vegetables19 (35.2)58 (100)-
Fruits3 (5.6)--
Livestock39 (72.2)56 (96.6)23 (39.7)
Mini-shop2 (3.7)-2 (3.4)
Water fetching-5 (8.6)2 (3.4)
Labour hire-1 (1.7)4 (6.9)
Others3 (5.6)2 (3.4)6 (10.3)
(-) indicates no response. Values outside and inside the bracket indicate the frequency and proportion of respondent farmers in percentage, respectively; the proportion of respondent farmers in each district could be more than 100% due to having more than one source of income.
Table 3. The relative importance of bread wheat in the study areas.
ImportanceDistrictsKruskal-Wallis Test
SireDodotaHetosa
High (%)Medium (%)Low (%)High (%)Medium (%)Low (%)High (%)Medium (%)Low (%)
Food90.79.3-75.920.73.489.78.61.70.042 *
Feed90.79.3-96.63.4-84.510.35.20.019 *
Income generation100--96.63.4-96.63.4-0.388 ns
Water logging-tolerance5020.429.632.83.463.824.13.472.40.000 **
Pest-tolerance55.625.918.527.615.556.936.217.246.60.000 **
Disease-tolerance57.424.118.532.815.551.75015.534.50.003 **
Early maturity68.514.816.753.417.229.358.620.720.70.217 ns
Yield68.525.95.656.929.313.874.117.28.60.128 ns
Adaptation (drought and heat-stresses)92.67.4-84.515.5-91.48.6-0.318 ns
Crop rotation6337-62.137.9-75.922.41.70.249 ns
*, p < 0.05; **, p < 0.01; ns, non-significant; (-), no response.
Table 4. Major crops grown and their productivity in studied regions.
CropsCultivated Area (ha)DFF-ValueProductivity (t ha−1)DFF-Value
DistrictsDistricts
SireDodotaHetosaSireDodotaHetosa
Wheat
Mean0.4461.4481.112222.423 **2.5762.3232.41720.689 ns
SD0.311.0820.7521.4591.030.892
SE0.0420.1420.0990.20.1350.117
Tef
Mean1.2430.4870.278212.294 **1.4430.8570.918217.921 **
SD0.9470.8260.3240.5980.5120.423
SE0.1290.1080.0430.0810.080.07
Maize
Mean0.120.2310.08327.641 **3.9243.0681.72923.907 *
SD0.1490.2650.1132.9673.4681.237
SE0.020.0350.0150.5420.5630.253
Barley
Mean0.0640.5190.36427.991 **2.92.3342.30421.525 ns
SD0.1610.3720.2682.1650.9021.011
SE0.0220.0490.0350.5790.1260.146
Garlic and onion
Mean0.0390.1250.04121.196 ns27.46710.458.209212.475 **
SD0.0930.2320.08919.0257.0214.159
SE0.0130.030.0125.4921.3511.254
Haricot bean
Mean0.0490.0520.03320.245 ns2.4541.0671.86822.449 ns
SD0.1040.1020.0792.3250.7511.649
SE0.0140.0130.010.6450.1940.497
DF, degree of freedom; SD, standard deviation; SE, standard error; *, p < 0.01; **, p < 0.05, ns, non-significant.
Table 5. Crop management practices followed by the respondent farmers in the study areas.
DescriptionsDistrictsDegrees of FreedomX2-Valuep-Value
SireDodotaHetosa
Planting time
Mid-June1 (1.9)-1 (1.7)1025.0990.005
Late June-6 (10.3)9 (15.5)
Early July39 (72.2)27 (46.6)33 (56.9)
Late June to early July10 (18.5)25 (43.1)14 (24.1)
Late June to mid-July2 (3.7)--
Early July to mid-July2 (3.7)-1 (1.7)
Planting Method
Row planting9 (16.7)-1 (1.7)434.6580.000
Hand broadcasting25 (46.3)47 (81.0)52 (89.7)
Both row and hand broadcasting 20 (37.0)11 (19.0)5 (8.6)
Fertility status of the land
High6 (11.1)5 (8.6)3 (5.2)43.0510.549
Medium42 (77.8)41 (70.7)45 (77.6)
Low6 (11.1)12 (20.7)10 (17.2)
Fertiliser type used
Inorganic41 (75.9)34 (58.6)37 (63.8)45.7820.216
Organic--1 (1.7)
Both inorganic and organic13 (24.1)24 (41.4)20 (34.5)
Crop rotation
Yes54 (100)57 (98.3)56 (96.6)21.9190.383
No-1 (1.7)2 (3.4)
Weeding
Hand weeding8 (14.8)1 (1.7)-425.3260.000
Chemical1 (1.9)12 (20.7)4 (6.9)
Both hand and chemical weeding45 (83.3)45 (77.6)54 (93.1)
(-) indicates no response. Values outside and inside the bracket indicate the frequency and proportion of respondent farmers in percentage, respectively.
Table 6. Moisture-stress prevailing at different growing stages indicated by respondent farmers in the study areas.
DescriptionDistrictsDegrees of FreedomX2 Valuep-Value
SireDodotaHetosa
Stages
Emergence17 (31.5)26 (44.8)21 (36.2)89.0440.339
Tillering2 (3.7)2 (3.4)1 (1.7)
Heading10 (18.5)6 (10.3)5 (8.6)
Grain filling23 (42.6)21 (36.2)23 (39.7)
Any stage2 (3.7)3 (5.2)8 (13.8)
Values outside and inside the bracket indicate the frequency and proportion of respondent farmers in percentage, respectively.
Table 7. Impact of drought on yield (t ha−1) of bread wheat in the study areas.
ConditionDistrictsDegrees of FreedomF-Value
SireDodotaHetosa
Optimum
Mean2.8893.1723.35922.627 ns
SD1.0291.2310.988
SE0.140.1620.13
Drought-stress
Mean0.8480.8261.241210.678 **
SD0.4680.5230.619
SE0.0640.0690.081
SD, standard deviation; SE, standard error; **, p < 0.01; ns, non-significant.
Table 8. Farmers’ coping mechanisms against drought-stress.
DescriptionDistrictsDegrees of FreedomX2-Valuep-Value
SireDodotaHetosa
Coping mechanism
Growing early maturing bread wheat varieties19 (35.2)17 (29.3)19 (32.8)625.30.0
Replacing wheat with other drought-tolerant crops6 (11.1)2 (3.4)11 (19)
Soil and water conservation1 (1.9)5 (8.6)13 (22.4)
No option except government food aid28 (51.9)34 (58.6)15 (25.9)
Values outside and inside the bracket indicate the frequency and proportion in percentage, respectively.
Publisher’s Note: MDPI stays neutral with regard to jurisdictional claims in published maps and institutional affiliations.

