Article

The Impact of Climate Change as Well as Land-Use and Land-Cover Changes on Water Yield Services in Haraz Basin

1
Department of Environmental Science, Faculty of Natural Resources, University of Tehran, Tehran 14179-35840, Iran
2
Department of Environmental Science, Gorgan University of Agricultural Sciences and Natural Resources, Gorgan 49189-43464, Iran
3
Institute for Environment and Development (LESTARI), Universiti Kebangsaan Malaysia, Bangi 43600, Selangor, Malaysia
*
Authors to whom correspondence should be addressed.
Sustainability 2022, 14(13), 7578; https://doi.org/10.3390/su14137578
Submission received: 6 April 2022 / Revised: 27 May 2022 / Accepted: 29 May 2022 / Published: 21 June 2022

Abstract

:
Water-yield assessment is crucial to effectively achieve water supply management at the basin scale. It is affected by climate change, and Land Use/Land Cover Change (LULCC). This paper quantifies the combined impact of LULCC and climate change on water yield over short and long-term periods in the Haraz basin, Iran. This basin has experienced severe forest degradation, agricultural expansion, and urbanization. Most agricultural lands are within the plains and coastal areas, and 25% of the basin is covered by forest, which includes part of the Hyrcanian conservation forests. Four scenarios to distinguish the relative portion of Land Use/Land Cover (LULC) and climate for water supply variations are considered, including real conditions at the beginning of the period (Sn1), real conditions without changes in LULC (Sn2), real conditions without climate change (Sn3), and real conditions at the end of the period (Sn4). Four study periods include 1992–2007, 2007–2016, 2016–2026 as a short term, and 1992–2026 as a long-term period. The spatial patterns of annual precipitation showed decreasing amounts in the three studied years from the northwest to the south. Water yield also reduced during the study period 1992–2007 and 2007–2016, and climate change plays an essential role in this reduction. Forecasts show that rainfall will recover in 2026 and water yield will increase in the northern sub-basins. In the long run, from 1992 to 2026, the contribution of LULCC and climate change factors to water yield are equal. The results can provide references for land use management to enhance water yield considering global climate change.

1. Introduction

Regional water resource availability can be well described by water yield, which is one of the most important ecosystem services offered by basins and has a key role in the ecohydrological cycle [1,2]. Water yield not only determines the quantity of available water that ecosystems can provide humans but also refers to the conservation of water [3,4]. Water-yield service is known for its essential role in the ecohydrological cycle [5,6]. It is explained as the difference between actual evapotranspiration (ET) and precipitation (P), which is a function of many indicators such as LULC, and climate [7,8].
Based on the Intergovernmental Panel on Climate Change (IPCC) and other studies, hydrological changes that occur due to climate change and LULCC are expected to be different in time and location. LULCC alters basin hydrological functions by influencing soil infiltration, evapotranspiration, and surface runoff [9,10,11,12,13]. In contrast, climate change is inclined to affect that by changing the temperature, precipitation, distribution abundance, runoff, and production [14,15]. Perceiving the effects of LULCC and climate change on water resources has been essential for managing water resources [14,15,16,17,18]. Therefore, it is critical to assess and predict emerging trends in water supplies using sophisticated methods over the long run to effectively manage water supply at the basin scale [19,20,21,22].
Rahman et al. [23] showed that Bangladesh experiences frequent and severe flooding due to LULCC and that climate change may worsen the situation. LULCC affected the water yield via the position and volume of yield, while climate dictated its depth [24,25]. Chanapathi et al. [26] discovered that climate change increased water yield and streamflow. However, LULCC may affect offsetting the water yield by 20–30% at the sub-basins level in the years 2025, 2055, and 2085. Furthermore, Yan et al. [27] deducted that change in LULC has less impact on the balance of water than climate change, and that runoff and water yield have steadily declined while ET has improved on an annual basis. Zhang et al. [28] concluded that human activities have fewer contributions than climate change to declining water yield. Despite the severe grassland degradation, Zhang et al. [29] illustrated that the amount of runoff decreased due to climate change. Nyatuame et al. [30] found that LULCC has a considerable effect on the hydrology of the Tordzie basin; in addition, water yield will fall by 6.50% in 2050 under climate change and LULCC.
Various studies have been conducted in the northern basins in Iran [31,32,33,34,35]. For instance, Ahmadi-Sani et al. [36] depicted that 37.6% of the basin had undergone a LULCC that increased the volume of annual runoff by 9%. In addition, after growing agricultural lands, grassland, and residential area, the volume of flow and water yield grew [35,36,37,38,39]. In contrast, other studies assessed the effect of climate change on water yield. Pirnia et al. [40] presented that climate has changed flow by 57.5% and 22.87% for wet and dry seasons, respectively. Pirnia et al. [41] and Silakhori et al. [42] demonstrated that the maximum and minimum temperatures are likely to increase each month in the near future. Results revealed that the projected climate change might lead to a decrease in the average flow [43].
The major factors responsible for recent water shortages in Iran are the uneven geographical and temporal distribution of water, climate change, and LULCC [44]. The transformation of forests and grasslands into residential areas and agricultural lands is becoming more common in the Haraz basin and can lead to ecological and social tensions [35,37]. So, it is essential to analyze the effect of climate change and LULCC on water yield to clarify the drivers of water-yield change to ensure sustainable water management in the Haraz Basin. No previous studies have analyzed the impact of climate change and LULCC on water yield in the Haraz Basin simultaneously. The main purpose of this study is to investigate the contribution of climate change and LULCC on water yield to evaluate future water-yield changes in the Haraz basin. For assessing future scenarios, the prediction of LULC is performed by the Cellular Automata Markov chain (CA-Markov). Moreover, climate prediction is carried out by R and ARIMA models.

2. Materials and Methods
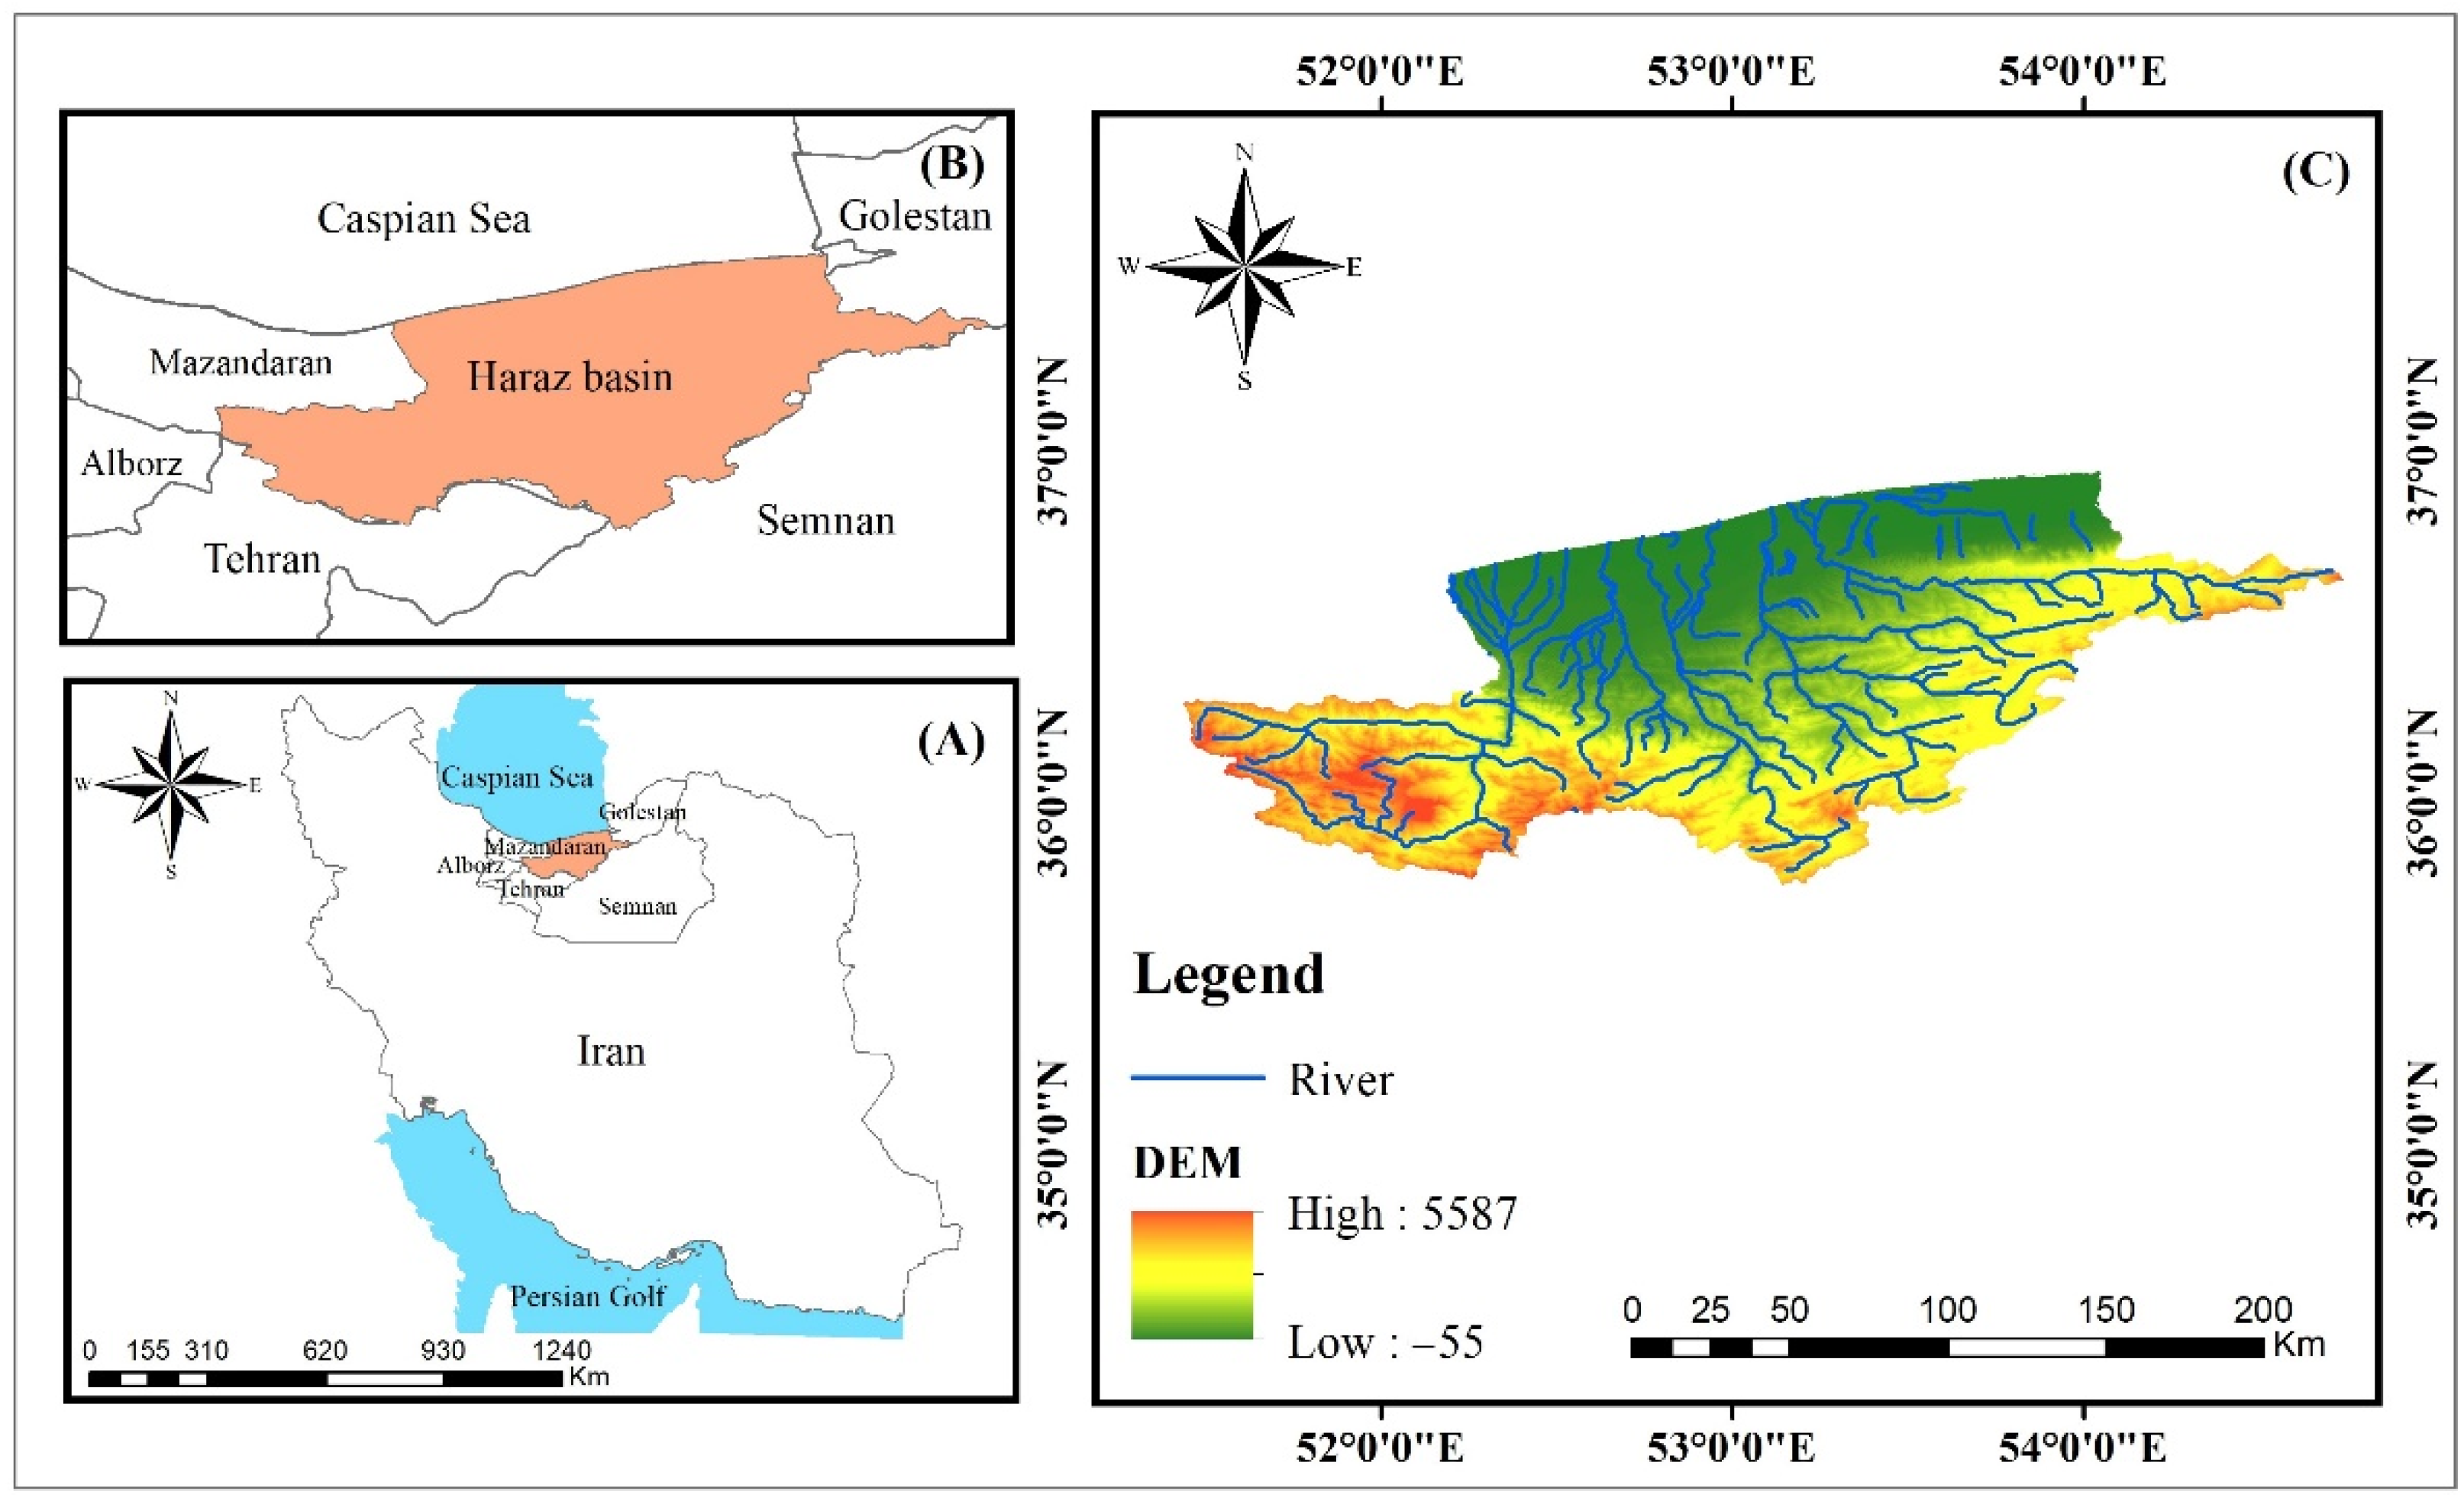
2.1. Case Study

Basins are an important scale factor in land use planning and hydrological studies due to including various LULCs such as grasslands, agricultural lands, settlement areas, and forests. Haraz basin is located in Iran and contains 23 sub-basins. The combination of the humid, mild, and moderate cold climate of the Caspian shoreline and mountainous regions constitutes the climate of Haraz. The annual average rainfall is approximately 700 mm [45]. Rainfall is about three times more than the annual average of Iran, an arid region located in the Eastern Hemisphere’s dry belt. The coastal and northern regions of the Haraz basin ( 51 ° 26 10 to 54 ° 44 23 east longitude and 35 ° 44 18 to 36 ° 55 5 north latitude) are located in the Caspian Sea’s southern part. In addition, the Caspian Sea is the largest water inland body globally. The area of this region is equal to 18,179 km2. A total of 25% of the basin is forest covered, including a part of the Hyrcanian conservation forests where 44% of known vascular plants in Iran are found [46].
In recent years, the area used for rice cultivation globally has expanded from 145 × 10 6 to 167.2 × 10 6 hectares [47]. Iran, with 2 × 10 6 tons of production of white rice and 571.6 × 10 3 hectares of paddy fields, accounts for 0.4% of the total production of rice and cultivation area worldwide, where most of these fields (about 82%) are located in the Haraz basin [48,49]. Specifically, 35% of this region is under rainfed rice cultivation. The height of the basin in plain and coastal areas is −55 m, while the mountainous parts reach 5587 m. Figure 1 shows the location of the studied area.

2.2. Methodology Description

In this study, the model of CA-Markov was used to predict and investigate LULCC. The model of CA-Markov for both spatial and temporal changes was used and is one of the most frequently utilized techniques for LULC prediction. In order to forecast LULC transition patterns and trends over time, the model of CA-Markov blends the chain of Markov and the cellular automata. Furthermore, the model of CA-Markov is one of the preparation tools for evaluating LULC spatial distribution and temporal changes. This model is also commonly utilized to characterize LULC dynamics, basin management modeling, urban sprawl, plant growth, and forest cover [50].
InVEST software (version 3.7.0) was used to simulate changes in water yield. The InVEST model estimates water production in different areas and describes how water production levels change due to different utilizations. The model that is mentioned is based on the Curve of Budyko [51]. Water production is the volume of water that flows out of the basin outlet and is obtained by subtracting the precipitation from evapotranspiration and surface infiltration. Y X indicates annual water yield for each grid unit on the landscape x and its formula is depicted as follows:
Y x = 1 A E T x P x × P x
where A E T x and P x indicate the annual actual evapotranspiration for pixel x and the annual precipitation on pixel x, respectively. Please refer to the User Guide of InVEST for a detailed description of the model of water yield [52]. Finally, the residual approach (RESTREND) was utilized for climate change and LULCC assessment in the water yield [53,54].

2.2.1. Input Data for CA-Markov Model

The input data for the CA-Markov model are LULC representing different years. LULC spatial–temporal analysis for the Haraz basin was performed by images from 1992 to 2016, with nine different classes of LULC, as shown in Table 1: agriculture, forest, shrubland, sparse vegetation, grassland, wetland, urban, water, and bare land (including bare land, saline-alkali land, and sand). The images were downloaded from a website, which is mentioned in Table 2, with 89–96% accuracy values. Moreover, field visits were conducted at 66 random points, and after conforming to the LULC map, the general accuracy and the coefficient of kappa were 81% and 0.61, respectively.
Given the rainfall changes and LULCC in the Haraz basin, three different annual periods were selected for the analysis. The annual rainfall data (Figure 2) from 1992 to 2016 indicate that the dry and wet years are equal to the data’s long-term average. However, 2007 was the driest year in terms of rainfall. On the other hand, the urban population rose significantly from 38% in 1987 to 50% in 1992, and the number of cities grew considerably from 84 points in 2002 to 125 points in 2007 [55]. Hence, these three periods were considered for this study.

2.2.2. Input Data for the Simulation of Water Yield

Data preparation was undertaken before developing the model. The resampling of the data was at 250 m spatial resolution. Moreover, the data were projected utilizing World Geodetic System 84 (WGS84). For computing the water yield, primary data were utilized. Table 2 summarizes data sources.
-
Precipitation and Reference Evapotranspiration (ET0): The Hargreaves equation was used to measure the annual ET0, and proved to produce better results than the Penman–Monteith method, notably when the latter is not able to be parameterized entirely [56]. Hargreaves et al. [57] used the temperature range of monthly mean (TD), the temperature of the monthly mean (Tmean), and radiation of extraterrestrial (RA, the radiation that exists on the atmosphere top) to measure ET0, as follows:
E T 0 = 0.0023 × R A × T m e a n + 17 / 8 × T D 0 / 5   ( mm / d )
Autoregressive Integrated Moving Average (ARIMA) models include an explicit statistical model for the irregular component of a time series, which allows for non-zero autocorrelations in the irregular component. In addition, the libraries that will be used in R for this model are time series and forecast. To predict precipitation and temperature by 2026, the R and ARIMA models were utilized and mapped using the interpolations method in ArcGIS.
-
Land use/Land cover: LULC maps are explained in Section 2.2.1.
-
Plant Available Water Content (PAWC) and the depth of soil: The soil depth gridding map (mm) and the texture of the soil were created based on the database of the Second Soil Survey, which was obtained from the soil grids (Table 2). PAWC was calculated using SPAW software and soil texture information. The difference between the capacity of the field and the point of wilting indicates PAWC.
-
Biophysical Table: Biophysical table provides information about vegetation such as the Kc coefficient of plant evapotranspiration and maximum root depth (mm), which was obtained by determining the dominant vegetation in each class of LULC. (Table 3) [58,59,60].

2.2.3. The climate and Land Use/Land Cover Contributions to the Water-Yield Mean

RESTREND analysis, which is one of the most widely used techniques for differentiating between natural variability and degradation processes in ecosystems, was performed to assess the relative contributions of climate change and LULCC to water yield in the Haraz basin [53,54]. In order to identify the role of LULCC and climate change in evaluating water yield, four scenarios were considered: real conditions at the beginning of the period (Sn1), LULC stayed the same, but climate changed (Sn2), climate stayed the same, but LULC changed (Sn3), and real conditions at the end of the period (Sn4). The water yield under four scenarios was modeled by fixing the input of climate and LULC in Sn2 and Sn3, respectively, in the InVEST model in Four study periods, including 1992–2007, 2007–2016, 2016–2026 as a short term, and 1992–2026 (Table 4) as a long-term period.
Eventually, the contribution of LULC and climate change was disentangled from water supply variations. The following equations demonstrate the processes in detail [61]:
W T = W R W B
W L = W R W R C
W C = W R W R L
n L = W L W T × 100
n C = W C W T × 100
where W T shows the variation in the general supply of water in a particular period; W R indicates the supply of actual water at the period’s end; W B demonstrates the supply of baseline water at the period’s beginning; W L is the LULCC impact on water supply; W R C represents the supply of water relating to the scenarios that climate only changes; W C shows the climate change impact on water supply; W R L indicates the water supply relating to the scenario that only LULC changes. Finally, n C and n L represent the climate change and LULCC contribution to water supply, respectively.

3. Results

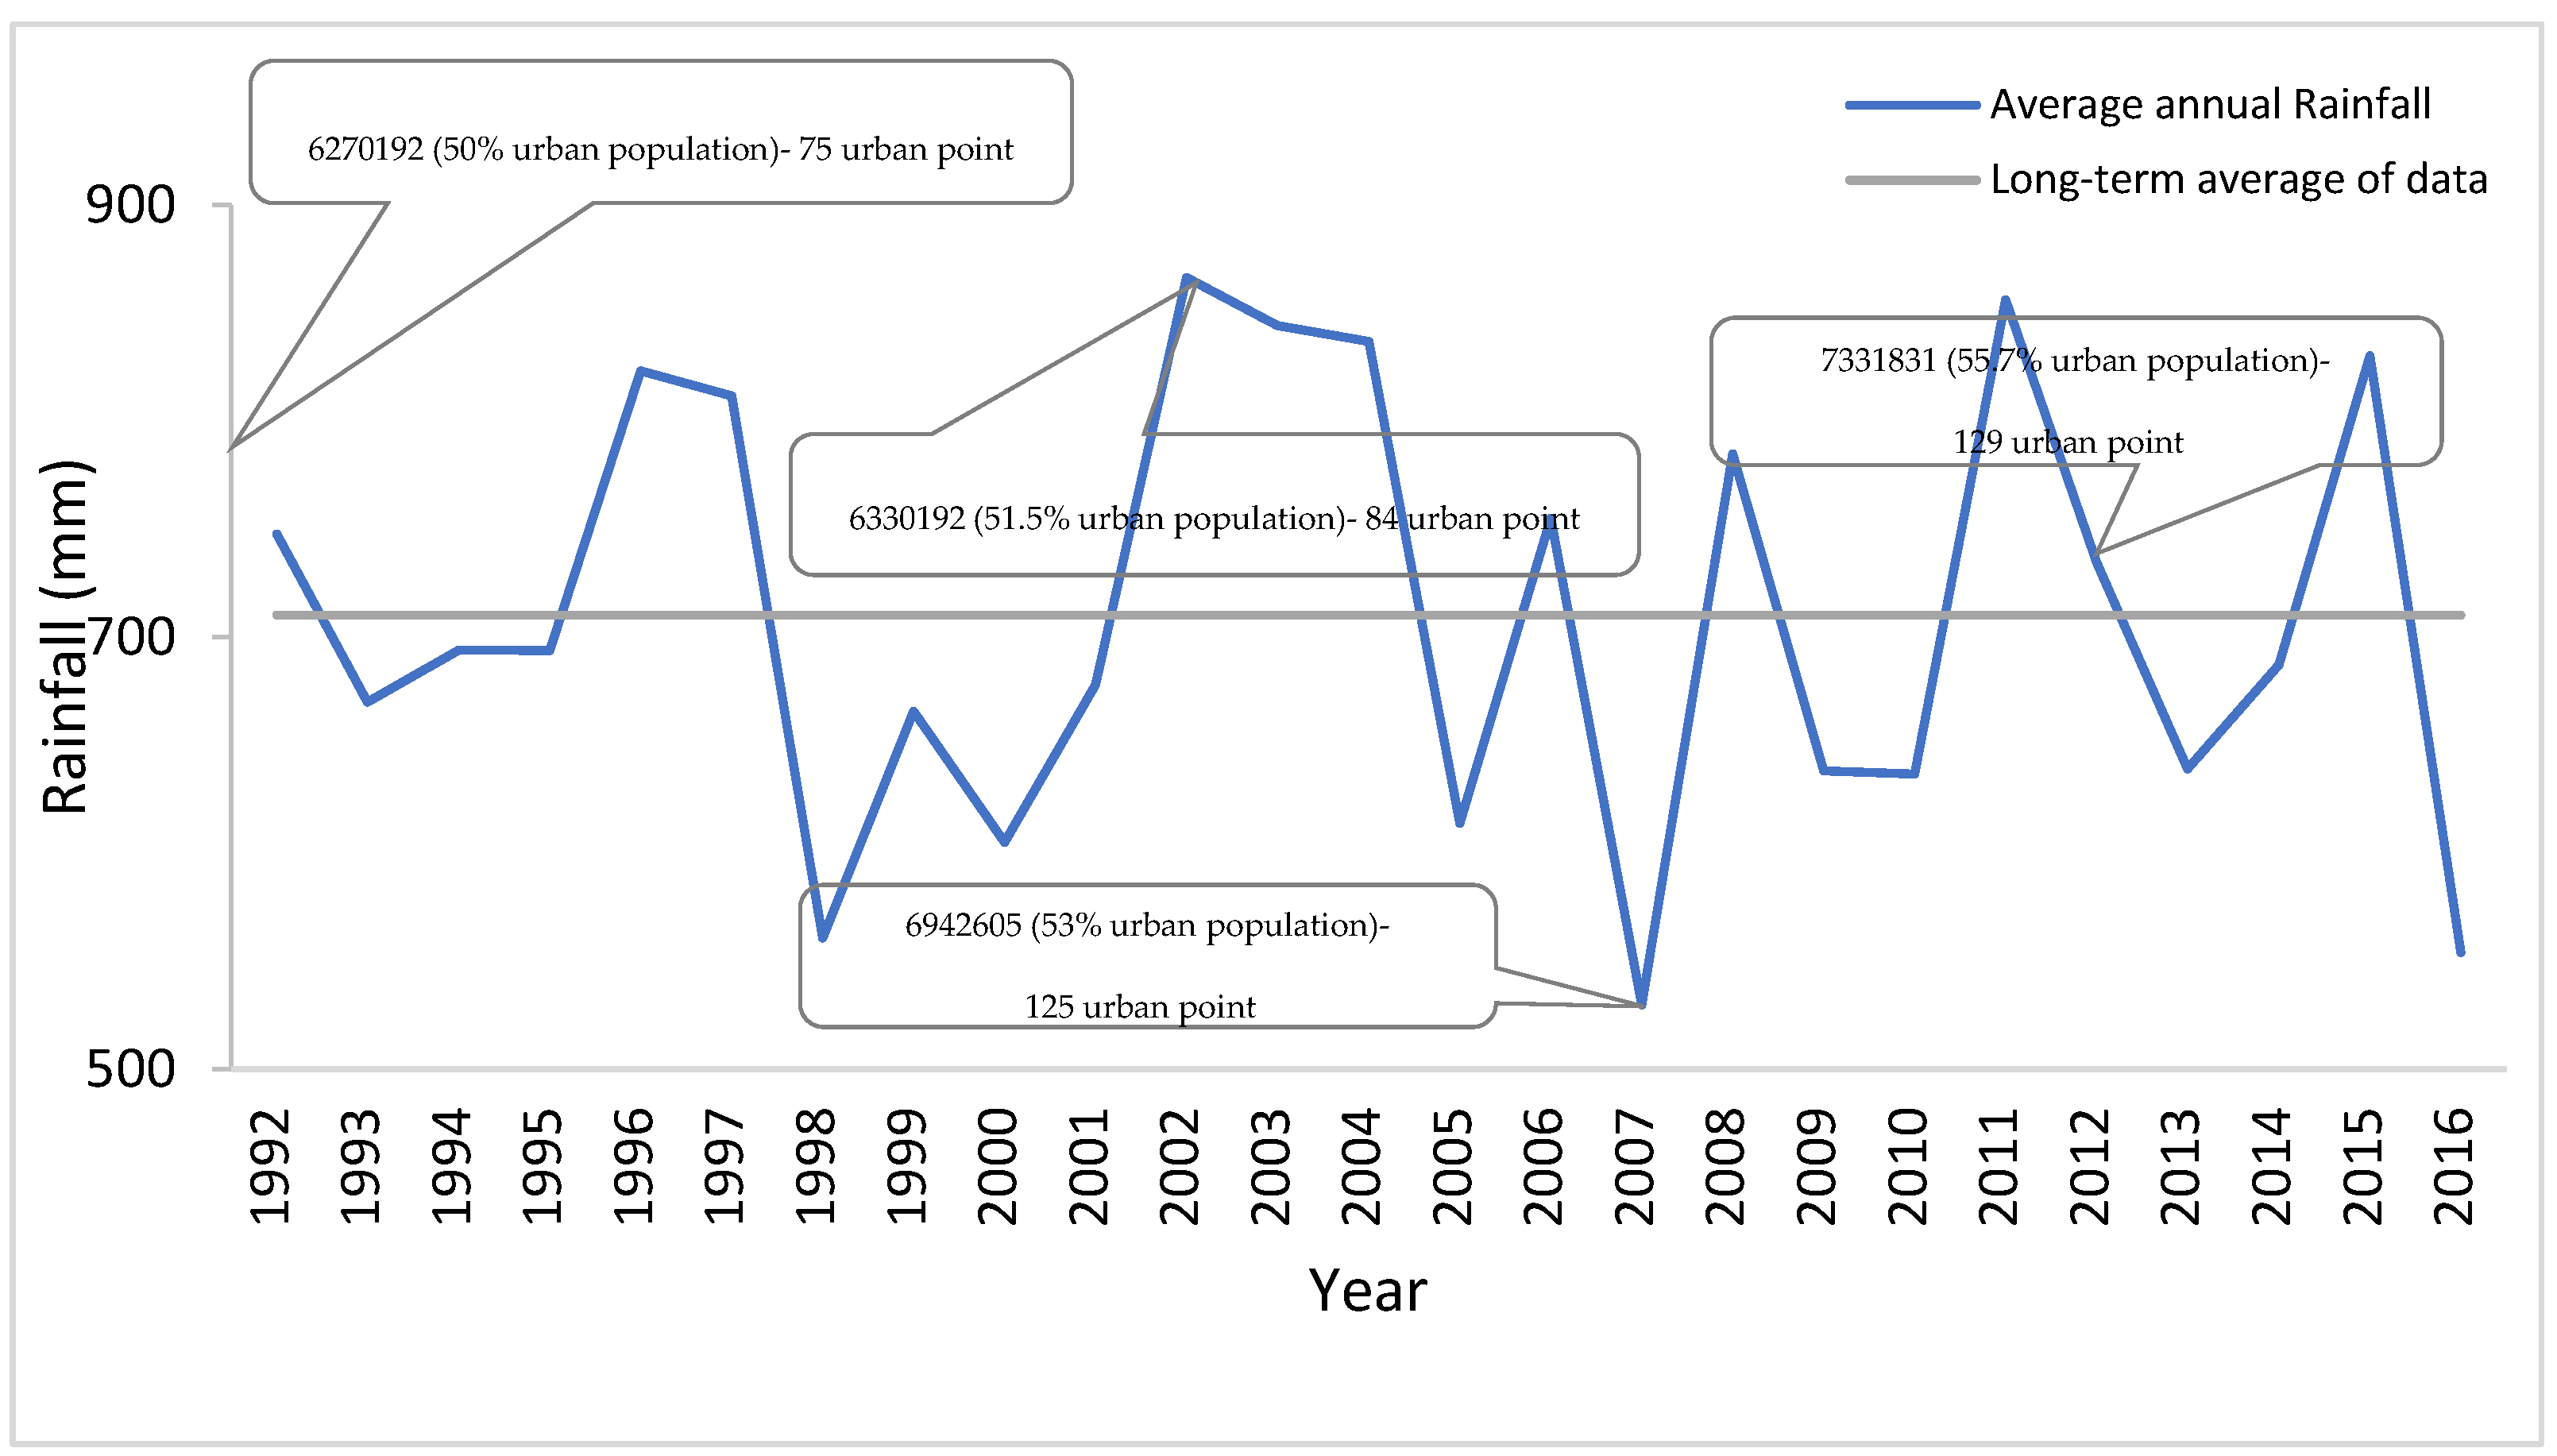
3.1. Climate Change and Land Use/Land Cover Spatio-Temporal Patterns

According to Figure 3, the main part of the Haraz basin consists of cultivated lands and green lands, including forests, grasslands, and sparse vegetation. Most of the agricultural lands are in the plains and coastal areas (low altitude), and the main area of green lands is located in the mountains and at high altitudes. In addition, spatial annual precipitation patterns have decreased from the northwest to the south over the three years. Annual rainfall is highly diverse in each geomorphological unit. The most rainfall occurs in the coastal part, and the least rainfall occurs at the southern heights of the basin. From 2007 to 2016, average rainfall decreased by 147 mm. In 2026, the minimum rainfall in the southern highlands will increase compared to more recent years.
Forests and water bodies have consistently diminished during the studied period, whereas agricultural lands, settlements, and wetlands have flourished. Based on Figure 4, over 34 years, significant changes will take place in agriculture, settlement, and forestry classes. Forest will decrease by −1133.65 km2 (6.05%), while agricultural lands and settlement areas will increase by 615.30 km2 (3.28%) and 467.15 km2 (2.49%), respectively.
Figure 5 presents the LULC change matrix for the 1992–2026 period. Most of the forests will convert into agricultural lands (1226 km2), and most agricultural lands will transform into urban developments (348.43 km2). The conversion of natural landscapes such as forests to settlement areas and farms significantly impacts the quantity and availability of water resources [62,63,64,65].
Figure 6 shows the changes occurring in different periods (1992–2007, 2007–2016, 2016–2026, and 1992–2026). During the 1992–2007 period, the forests were severely reduced to agricultural lands and settlements, whereas in 2007, deforestation was reduced due to the forest protection implementation policies.
Considering that forests and agricultural lands account for a major part of the studied basin (Figure 4), and conversion to settlement is progressing rapidly (Figure 6), it is necessary to study the changes in agriculture, genus, and settlement classes within the sub-basins. Furthermore, as defined by natural hydrology, the most logical way to manage water resources is achieved by managing basins. Thus, the basins are the main point of focus. It encourages planners to gain a deeper understanding of the general conditions of an area and identify the stressors that influence these conditions [66]. Hence, changes in factors in sub-basins should be examined extensively.
According to Figure 7, Sub-basin 1 and eastern sub-basins displayed the most changes in the agricultural sector, and sub-basin 4 showed the highest forest cover decline in the 1992–2007 period. The most significant changes in the agricultural lands and forestry sector occurred in sub-basins 2, 7, and 8 in the 2007–2016 period. According to the forecasts made in sub-basins 3, 4, and 12, the most significant changes occurred in the 2016–2026 period. Significant changes occurred in the northern sub-basins.

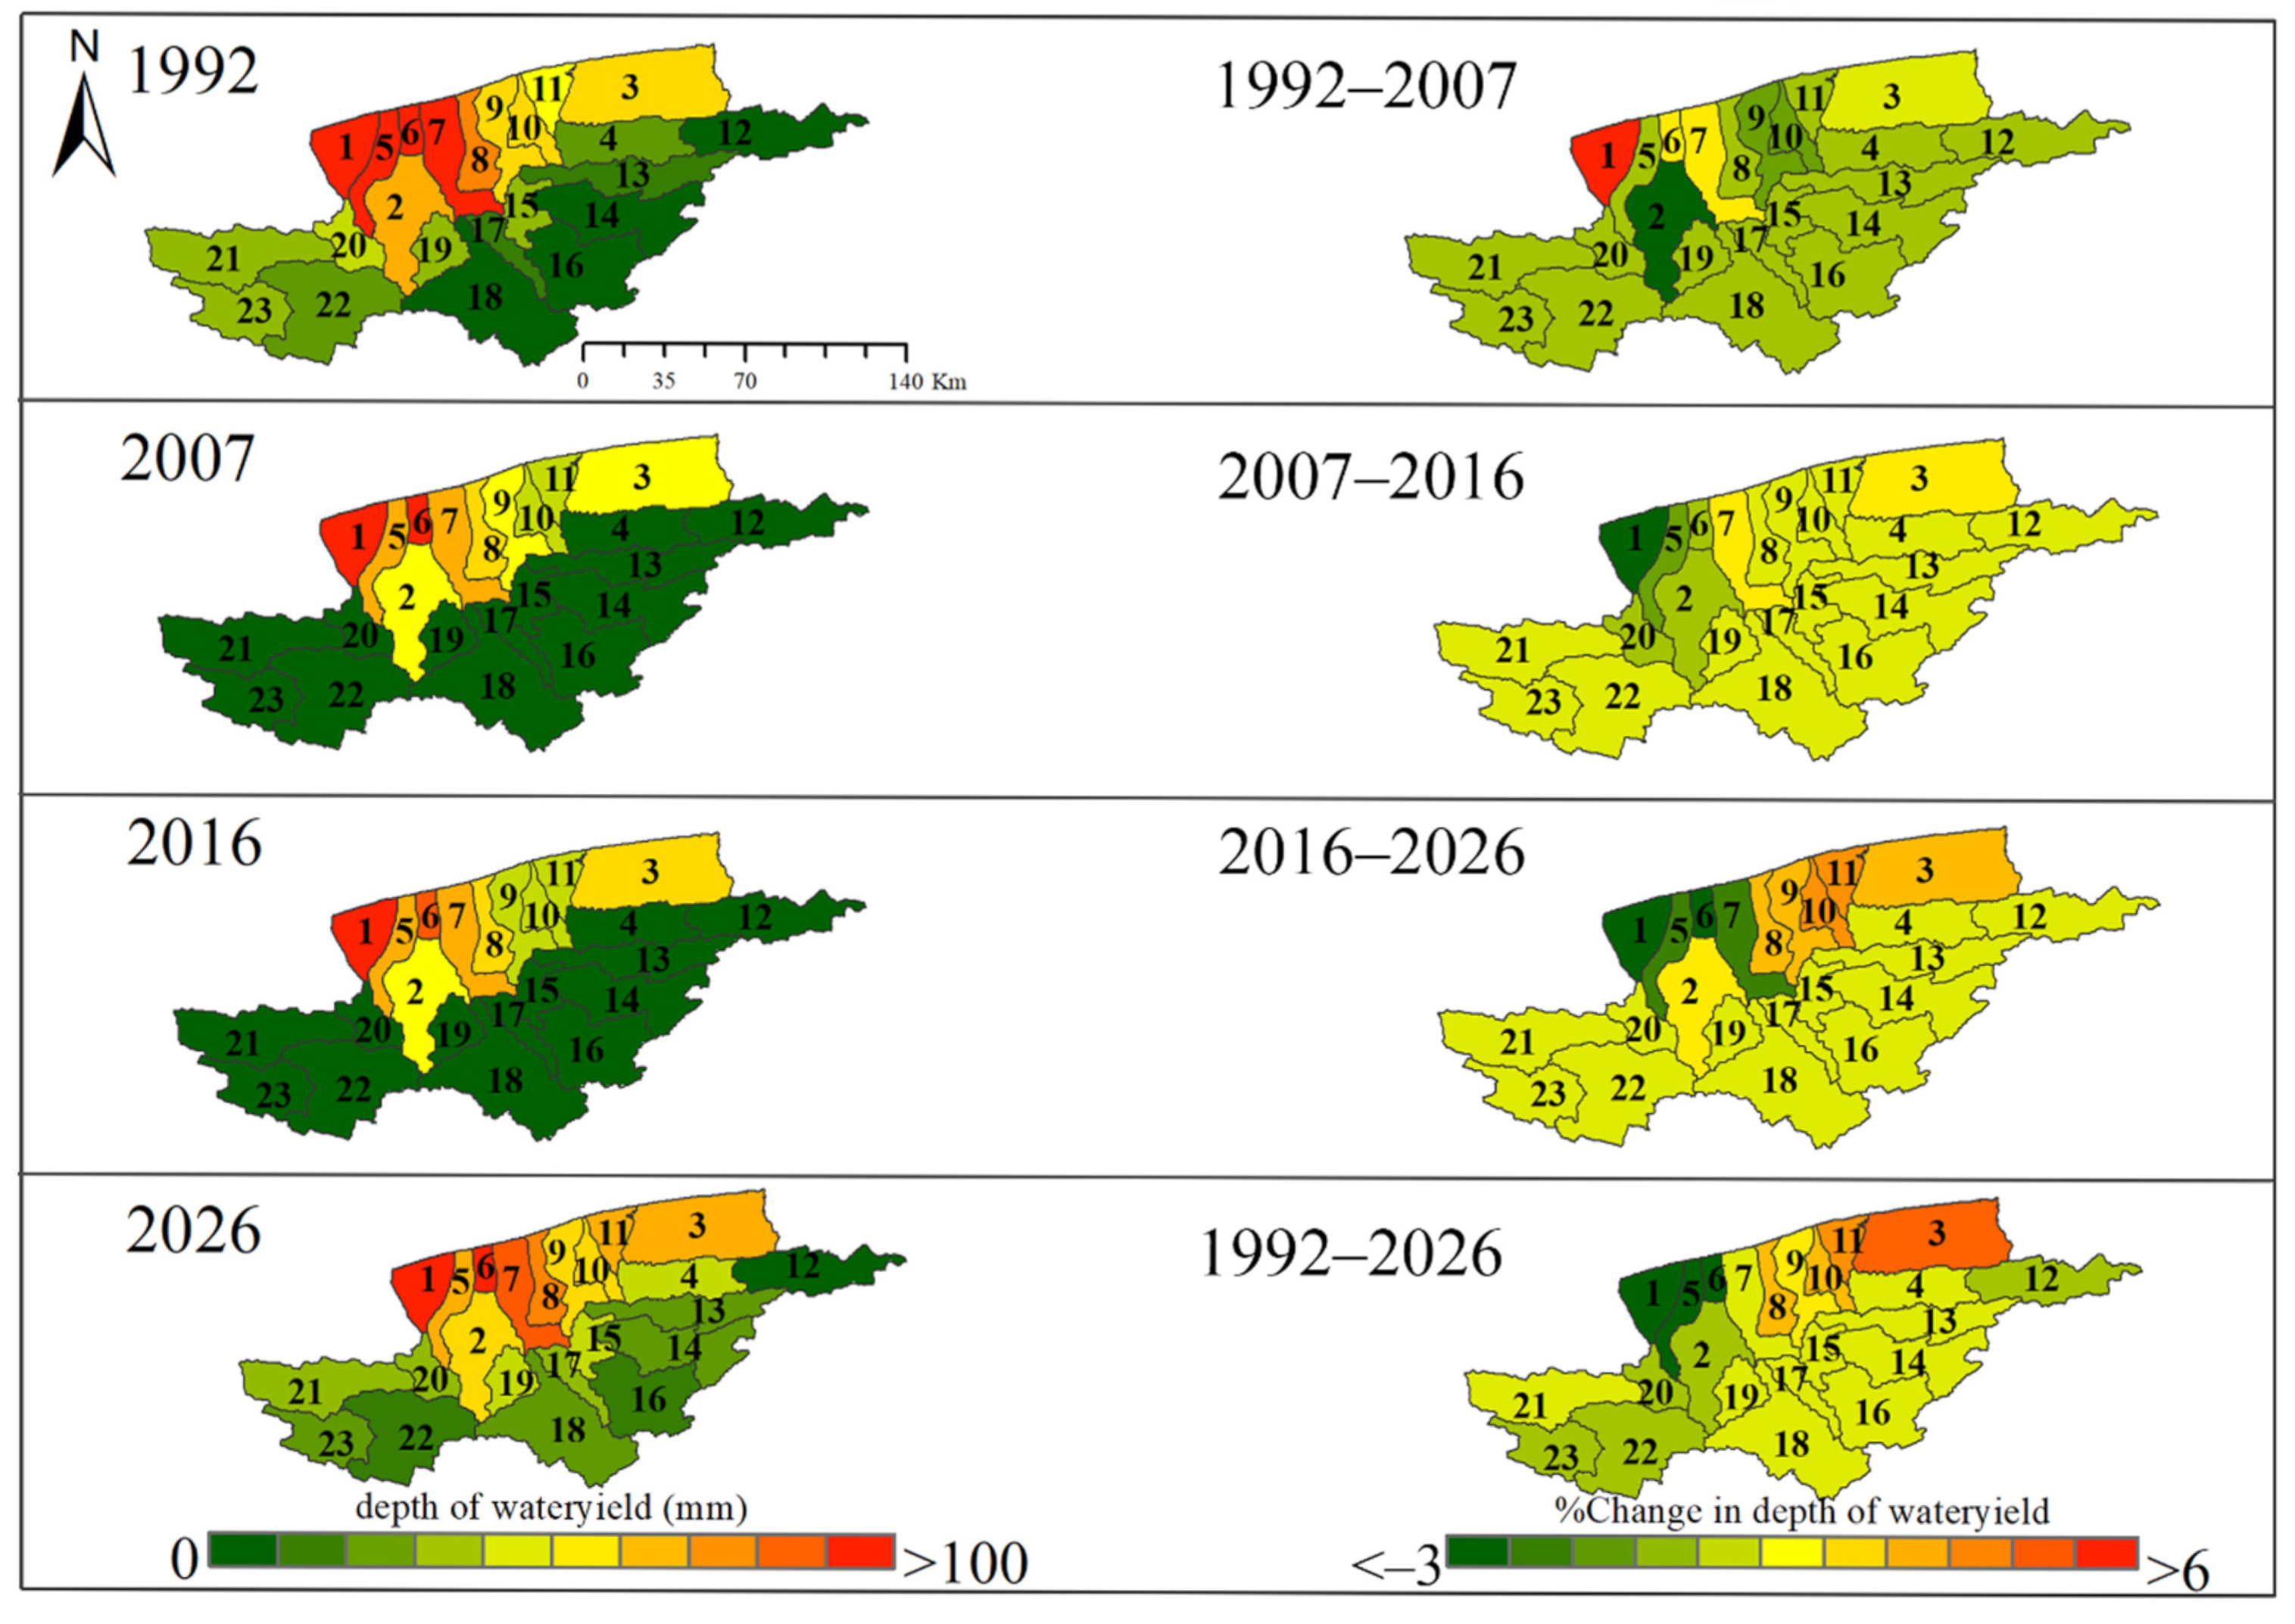
3.2. Spatio-Temporal Patterns of Water Yield

According to Figure 8, the coastal and northern parts of the Haraz basin had the highest water production due to agricultural covers and settlement areas. The southern parts had the lowest runoff production due to forest covers having numerous hydrological functions such as water regulation, water quality enhancement, flood mitigation, and water conservation [67].
As shown in Table 5, the water yield’s total amount in all sub-basins reduced in 1992, 2007, and 2016. In contrast, based on the prediction for 2026, the water-yield amount in the northwestern sub-basins will increase compared to 2007 and 2016. Moreover, the eastern and northeastern sub-basins will increase compared to 1992.

3.3. Water Yield under LULC and Climate Change Scenarios

RESTREND analysis was conducted to assess the relative contribution of LULC and climate changes to water supplies in four sub-basins with greater LULCC. The water supplies were calculated for four different scenarios. Overall, the positive climate change share in water yield was more significant in the four considered periods. Climate change was a major factor in determining water yield in the 1992–2007 period. Totals of 46% and 75% of LULCC and climate changes were effective in water yield in the northeastern sub-basins (1, 2, 3, 9, 10, 11, 13, and 15) in the 2007–2016 period. Moreover, in sub-basins (2, 7, 8, and 19), climate change positively affected water yield by around 250%. Forecasts (Figure 9) illustrated that LULCC positively influenced water yield in the northern sub-basins in 2016–2026, and the most significant effect of climate change was related to sub-basins (1 and 5). Moreover, during 34 years (1992–2026), the effectiveness of climate change in the northwestern sub-basin was more than 100%. In addition, the effectiveness of land-use change in the northeastern sub-basin was more than 50%.

4. Discussion

In recent decades, in several developing countries such as Iran, the LULCC has been rapid, significantly influencing the regimes of water flow [68]. Two essential factors in LULCC are human activities and climate change [69]. However, the pressure of human activities on LULC has increased in the Haraz basin during the last 25 years. These changes are evident in the three classes of agriculture, forest, and settlement areas. The situation will continue due to the basin being a prime coastal location with a favorable Mediterranean climate that is appealing for living in most basins in northern Iran. Forest cover (−882.26 Km2) decreased, and agricultural lands (+653.62 Km2) and settlement areas (+184.37 Km2) increased significantly from 1992 to 2016.
The results indicate that forest cover decreased considerably in favor of increasing settlement areas and agricultural lands [70]. Due to deforestation, agriculture development, and settlement of areas in Iran’s northern basins, these results are critical, leading to severe consequences, such as devastating floods and droughts [71,72]. Additionally, considering the agricultural value of the Haraz region for the economy and food security of the country, changes in the hydrological regime can cause major environmental and social issues [73]. Forests are also an essential water source, especially the distinctive forests of Hyrcanian (Caspian) in the northern area of Iran, which provide critical ecological services to global and local populations [74,75,76]. From 1992 to 2007, forest covers (−734.98 km2) decreased, and agricultural lands (+550.1 km2) and settlement areas (+49.77 km2) increased significantly. From 2007 to 2016, forest covers (−147.28 km2) declined, and agricultural lands and residential areas grew (+103.52 km2 and +134.6 km2). In 2002, the Iranian government implemented a law to protect the forest to reduce deforestation. It is the crucial reason for the reduction in the amount of arable land and land reclamation in 2007. However, other reasons also contributed to the decline in arable land through the urban sprawl and the onset of climate drought in 2007 in the Haraz basin.
Haraz basin is a large area, and its various sub-basins have unique climatic conditions and geomorphological features. Rainfall varies in different geomorphic units in the Haraz basin. The northern and coastal areas of the basin have the highest rainfall, while the southern areas of the basin have the lowest rainfall. Although the Haraz basin has experienced a significant reduction in rainfall and flow [76]. Generally, in the northern part of the Haraz basin, due to urban areas, agricultural cover, and more rainfall, water yield is higher than in the central part of the basin, which has forest cover and less rainfall. Nonetheless, in the short-term study periods of 1992 to 2007, 2007 to 2016, and 2016 to 2026, climate change has been an important factor in determining water yield, and LULCC has had a positive contribution in determining the water yield of the northern basins. However, in the long-term period (34 years) from 1992 to 2026, a study of climate change and LULCC shows that both factors have a high contribution in determining water yield.

5. Conclusions

In the present study, the InVEST model is selected to assess the effect of LULCC and climate changes on water-yield service through the short-run periods 1992–2007, 2007–2016, 2016 to 2026, and 1992 2026 in the Haraz basin. The results show that climate change during the periods of 1992–2007 and 2007–2016 had the most negligible effect on the annual average water yield in the Haraz basin. However, spatial variations had a significant impact on the severe fluctuation of water yield in some specific locations. Our study suggests that due to the current trend of LULCC in the Haraz basin and population growth, significant LULC changes in the Haraz basin over 34 years, changes from forest cover to agriculture (1226 km2), and changes from agriculture to urban areas (348 km2) occur mainly in the northern and coastal sub-basins.
Amplification in predicted precipitation and temperature in 2026 increases the total water yield and surface runoff. In addition, deforestation results in growing annual flow [32,33,34,35,36,37,38,39,40,41,42,43,44,45,46,47,48,49,50,51,52,53,54,55,56,57,58,59,60,61,62,63,64,65,66,67,68,69,70,71,72,73,74,75,76,77] and surface runoff increases, because of the highly intensive agriculture and urbanization [37,38,39,40,41,42,43,44,45,46,47,48,49,50,51,52,53,54,55,56,57,58,59,60,61,62,63,64,65,66,67,68,69,70,71,72,73,74,75,76,77,78]. Therefore, we recommend focusing on executing the policies of development and laws offered by studies of land-use planning, which include “forest protection projects” and “rehabilitation of degraded grassland”. Moreover, green infrastructures, such as forest patches and wetlands, can improve flood regulation and water storage [71]. Moreover, migration control is also a basic issue that can decrease land degradation and natural landscape loss.
In addition, we have only focused on the future LULCC in this paper, but the effects of these changes on the region’s climate have not been considered. Future studies should take into account the effects of LULCC on regional climate. Future studies could help ascertain potential methods to aid policy formulation and adaptation planning and help to reduce the impacts of LULCC on the water yield in the northern sub-basins. Finally, the outcomes of this study present some valuable information that can guide policymakers and planners in deciding on sustainable land use.

Author Contributions

Conceptualization, writing—original draft preparation and formal analysis, Z.E. and S.P.; writing—review and editing, S.P. and K.E.L.; visualization, H.H.; supervision, S.P. All authors have read and agreed to the published version of the manuscript.

Funding

This research was funded by the University of Tehran and the University Kebangsaan Malaysia through TAP-K020155.

Institutional Review Board Statement

Not applicable.

Informed Consent Statement

Not applicable.

Data Availability Statement

The data presented in this study are available on request from the corresponding author.

Acknowledgments

We acknowledge the University of Tehran and University Kebangsaan Malaysia for their provision of resources and collaborative efforts.

Conflicts of Interest

The authors declare no conflict of interest.

References

  1. Bai, Y.; Ochuodho, T.O.; Yang, J. Impact of land use and climate change on water-related ecosystem services in Kentucky. USA Ecol. Indic. 2019, 102, 51–64. [Google Scholar] [CrossRef]
  2. Wang, L.; Wang, W.J.; Du, H.B.; Wu, Z.F.; Shen, X.J.; Ma, S. Decreasing precipitation occurs in daily extreme precipitation intervals across China in observations and model simulations. Clim. Dyn. 2020, 54, 2597–2612. [Google Scholar] [CrossRef]
  3. Declaration, B. The Brisbane Declaration: Environmental flows are essential for freshwater ecosystem health and human well-being. In Proceedings of the 10th International River Symposium, Brisbane, Australia, 3–6 September 2007. [Google Scholar] [CrossRef]
  4. Fang, D.; Hao, L.; Cao, Z.; Huang, X.; Qin, M.; Hu, J.; Sun, G. Combined effects of urbanization and climate change on watershed evapotranspiration at multiple spatial scales. J. Hydrol. 2020, 587, 124869. [Google Scholar] [CrossRef]
  5. Chang, X.; Zhao, W.; Liu, B.; Liu, H.; He, Z.; Du, J. Can forest water yields be increased with increased precipitation in a Qinghai spruce forest in arid northwestern China? Agric. For. Meteorol. 2017, 247, 139–150. [Google Scholar] [CrossRef]
  6. Costanza, R.; De Groot, R.; Sutton, P.; Van der Ploeg, S.; Anderson, S.J.; Kubiszewski, I.; Turner, R.K. Changes in the global value of ecosystem services. Glob. Environ. Chang. 2014, 26, 152–158. [Google Scholar] [CrossRef]
  7. Sun, G.; McNulty, S.G.; Lu, J.; Amatya, D.M.; Liang, Y.; Kolka, R.K. Regional annual water yield from forest lands and its response to potential deforestation across the southeastern United States. Hydrology 2005, 308, 258–268. [Google Scholar] [CrossRef]
  8. Sun, G.; Zhou, G.; Zhang, Z.; Wei, X.; McNulty, S.G.; Vose, J.M. Potential water yield reduction due to forestation across China. Hydrology 2006, 328, 548–558. [Google Scholar] [CrossRef]
  9. Dwarakish, G.S.; Ganasri, B.P. Impact of land use change on hydrological systems: A review of current modeling approaches. Cogent Geosci. 2015, 1, 1115691. [Google Scholar] [CrossRef]
  10. Parry, M.L.; Canziani, O.; Palutikof, J.; Van der Linden, P.; Hanson, C. (Eds.) Climate Change 2007-Impacts, Adaptation and Vulnerability: Working Group II Contribution to the Fourth Assessment Report of the IPCC; Cambridge University Press: Cambridge, UK, 2007; Volume 4. [Google Scholar]
  11. Dang, H.; Gillett, N.P.; Weaver, A.J.; Zwiers, F.W. Climate change detection over different land surface vegetation classes. Int. J. Climatol. 2007, 27, 211–220. [Google Scholar] [CrossRef] [Green Version]
  12. Lu, N.; Wilske, B.; Ni, J.; John, R.; Chen, J. Climate change in Inner Mongolia from 1955 to 2005—Trends at regional, biome and local scales. Environ. Res. Lett. 2009, 4, 045006. [Google Scholar] [CrossRef] [Green Version]
  13. Tahiru, A.A.; Doke, D.A.; Baatuuwie, B.N. Effect of land use and land cover changes on water quality in the Nawuni Catchment of the White Volta Basin, Northern Region, Ghana. Appl. Water Sci. 2020, 10, 198. [Google Scholar] [CrossRef]
  14. Torabi Haghighi, A.; Darabi, H.; Shahedi, K.; Solaimani, K.; Kløve, B. A scenario-based approach for assessing the hydrological impacts of land use and climate change in the Marboreh Watershed, Iran. Environ. Modeling Assess. 2020, 25, 41–57. [Google Scholar] [CrossRef] [Green Version]
  15. Afzal, M.; Ragab, R. Impact of the future climate and land use changes on the hydrology and water resources in South East England, UK. Am. J. Water Resour. 2020, 20, 218–231. [Google Scholar] [CrossRef]
  16. Asl-Rousta, B.; Mousavi, S.J.; Ehtiat, M.; Ahmadi, M. SWAT-based hydrological modelling using model selection criteria. Water Resour. Manag. 2018, 32, 2181–2197. [Google Scholar] [CrossRef]
  17. Dosdogru, F.; Kalin, L.; Wang, R.; Yen, H. Potential impacts of land use/cover and climate changes on ecologically relevant flows. J. Hydrol. 2020, 584, 124654. [Google Scholar] [CrossRef]
  18. Gomes, L.C.; Bianchi, F.J.J.A.; Cardoso, I.M.; Schulte, R.P.O.; Fernandes, R.B.A.; Fernandes-Filho, E.I. Disentangling the historic and future impacts of land use changes and climate variability on the hydrology of a mountain region in Brazil. J. Hydrol. 2020, 594, 125650. [Google Scholar] [CrossRef]
  19. Feng, X.Y.; Luo, G.P.; Li, C.F.; Dai, L.; Lu, L. Dynamics of ecosystem service value caused by land use changes in Manas River of Xinjiang, China. Int. J. Environ. Res. 2012, 6, 499–508. [Google Scholar] [CrossRef]
  20. Ellis, E.C.; Ramankutty, N. Putting people in the map: Anthropogenic biomes of the world. Front. Ecol. Environ. 2008, 6, 439–447. [Google Scholar] [CrossRef] [Green Version]
  21. Samie, A.; Abbas, A.; Azeem, M.M.; Hamid, S.; Iqbal, M.A.; Hasan, S.S.; Deng, X. Examining the impacts of future land use/land cover changes on climate in Punjab province, Pakistan: Implications for environmental sustainability and economic growth. Environ. Sci. Pollut. Res. 2020, 27, 25415–25433. [Google Scholar] [CrossRef]
  22. Ghoraba, S. Hydrological modeling of the Simly Dam watershed (Pakistan) using GIS and SWAT model. Alex. Eng. J. 2015, 54, 583–594. [Google Scholar] [CrossRef] [Green Version]
  23. Rahman, M.; Ningsheng, C.; Mahmud, G.I.; Islam, M.M.; Pourghasemi, H.R.; Ahmad, H.; Habumugisha, J.M.; Washakh, R.M.A.; Alam, M.; Liu, E.; et al. Flooding and its relationship with land cover change, population growth, and road density. Geosci. Front. 2021, 12, 101224. [Google Scholar] [CrossRef]
  24. Belihu, M.; Tekleab, S.; Abate, B.; Bewket, W. Hydrologic response to land use land cover change in the Upper Gidabo Watershed, Rift Valley Lakes Basin, Ethiopia. Hydrol. Res. 2020, 3, 85–94. [Google Scholar] [CrossRef]
  25. Bessah, E.; Raji, A.O.; Taiwo, O.J.; Agodzo, S.K.; Ololade, O.O.; Strapasson, A. Hydrological responses to climate and land use changes: The paradox of regional and local climate effect in the Pra River Basin of Ghana. J. Hydrol. Reg. Stud. 2020, 27, 100654. [Google Scholar] [CrossRef]
  26. Chanapathi, T.; Thatikonda, S. Investigating the impact of climate and land-use land cover changes on hydrological predictions over the Krishna river basin under present and future scenarios. Sci. Total Environ. 2020, 721, 137736. [Google Scholar] [CrossRef] [PubMed]
  27. Yan, R.; Cai, Y.; Li, C.; Wang, X.; Liu, Q. Hydrological responses to climate and land use changes in a watershed of the Loess Plateau, China. Sustainability 2019, 11, 1443. [Google Scholar] [CrossRef] [Green Version]
  28. Zhang, L.; Cheng, L.; Chiew, F.; Fu, B.J. Understanding the impacts of climate and land use change on water yield. Curr. Opin. Environ. Sustain. 2018, 33, 167–174. [Google Scholar] [CrossRef]
  29. Zhang, Y.; Guan, D.; Jin, C.; Wang, A.; Wu, J.; Yuan, F. Analysis of impacts of climate variability and human activity on streamflow for a river basin in northeast China. J. Hydrol. 2011, 410, 239–247. [Google Scholar] [CrossRef]
  30. Nyatuame, M.; Amekudzi, L.K.; Agodzo, S.K. Assessing the land use/land cover and climate change impact on water balance on Tordzie watershed. Remote Sens. Appl. Soc. Environ. 2020, 20, 100381. [Google Scholar] [CrossRef]
  31. Modaresi, F.; Araghinejad, S.; Ebrahimi, K.; Kholghi, M. Assessment of climate change effects on the annual water yield of rivers: A case study of Gorganroud river, Iran. Water Soil 2012, 25, 1365–1377. [Google Scholar]
  32. Gholami, A.; Shahedi, K.; Habibnejad Rooshan, M.; Vafakhah, M.; Soleimani, K. Assessment About Efficiency of SWAT Semi-Distribution Model for Simulation of Streamflow (Case Study in Talar Watershed, Mazandaran Province). Iran. J. Soil Water Res. 2017, 48, 463–476. [Google Scholar] [CrossRef]
  33. Gholami, A.; Habibnejad Roshan, M.; Shahedi, K.; Vafakhah, M.; Solaymani, K. Hydrological stream flow modeling in the Talar catchment (central section of the Alborz Mountains, north of Iran): Parameterization and uncertainty analysis using SWAT-CUP. J. Water Land Dev. 2016, 39, 57–69. [Google Scholar] [CrossRef] [Green Version]
  34. Kavianpoor, A.; Barani, H.; Sepehri, A.; Bahremand, A. Evaluating the impacts of climate change on pastoralists activities (Case study: Rangelands of Haraz river basin). Rangeland 2019, 13, 26–38. [Google Scholar]
  35. Sharifi, F.; Samadi, S.Z.; Wilson, C.A. Causes and consequences of recent floods in the Golestan catchments and Caspian Sea regions of Iran. Nat. Hazards 2012, 61, 533–550. [Google Scholar] [CrossRef]
  36. Ahmadi-Sani, N.; Razaghnia, L.; Pukkala, T. Effect of Land-Use Change on Runoff in Hyrcania. Land 2022, 11, 220. [Google Scholar] [CrossRef]
  37. Mohammadi, M.; Khaledi Darvishan, A.K.; Spalevic, V.; Dudic, B.; Billi, P. Analysis of the impact of land use changes on soil erosion intensity and sediment yield using the intErO model in the talar watershed of Iran. Water 2021, 13, 881. [Google Scholar] [CrossRef]
  38. Moradi, A.; Nakafinejad, A.; Ownagh, M.; Komaki, C.B.; Foladi Mansouri, M. Landuse changes detection and evaluation of their effects on simulated discharge and sediment yield using SWAT model (Case Study: Galikesh Watershed, Golestan Province). J. Range Watershed Manag. 2018, 71, 489–504. [Google Scholar] [CrossRef]
  39. Kavian, A.; Mohammadi, M.; Gholami, L.; Rodrigo-Comino, J. Assessment of the spatiotemporal effects of land use changes on runoff and nitrate loads in the Talar River. Water 2018, 10, 445. [Google Scholar] [CrossRef] [Green Version]
  40. Pirnia, A.; Darabi, H.; Choubin, B.; Omidvar, E.; Onyutha, C.; Haghighi, A.T. Contribution of climatic variability and human activities to stream flow changes in the Haraz River basin, northern Iran. J. Hydrol. Environ. Res. 2019, 25, 12–24. [Google Scholar] [CrossRef]
  41. Pirnia, A.; Solaimani, K.; Habibnejad Roshan, M.; Besalatpour, A.A. Investigating the contribution of climate variability and land use change in water quality changes of Haraz River (Mazandaran Province). Iran. J. Ecohydrol. 2017, 4, 1151–1163. [Google Scholar] [CrossRef]
  42. Silakhori, E.; Dahmardeh Ghaleno, M.R.; Meshram, S.G.; Alvandi, E. To assess the impacts of climate change on runoff in Golestan Province, Iran. Nat. Hazards 2022, 112, 281–300. [Google Scholar] [CrossRef]
  43. Joorabian Shooshtari, S.; Shayesteh, K.; Gholamalifard, M.; Azari, M.; Serrano-Notivoli, R.; López-Moreno, J.I. Impacts of future land cover and climate change on the water balance in northern Iran. Hydrol. Sci. J. 2017, 62, 2655–2673. [Google Scholar] [CrossRef]
  44. Panahi, D.M.; Kalantari, Z.; Ghajarnia, N.; Seifollahi-Aghmiuni, S.; Destouni, G. Variability and change in the hydro-climate and water resources of Iran over a recent 30-year period. Sci. Rep. 2020, 10, 7450. [Google Scholar] [CrossRef] [PubMed]
  45. Ebrahimi, A.N.; Rahimian, F.P.; Loron, M.S. Impacts of Climate on Genesis of Vernacular Architecture of Different Parts of Iran: Case Study of Cold and Dry Azerbaijan–Iran. ALAM CIPTA Int. J. Sustain. Trop. Des. Res. Pract. 2013, 6, 69–82. [Google Scholar]
  46. Siadati, S.; Moradi, H.; Attar, F.; Etemad, V.; Hamzeh’ee, B.; Naqinezhad, A. Botanical diversity of Hyrcanian forests; a case study of a transect in the Kheyrud protected lowland mountain forests in northern Iran. Phytotaxa 2010, 7, 1–18. [Google Scholar] [CrossRef]
  47. FAO. FAO Rice Market Monitor (RMM). 2019. Available online: https://www.fao.org/markets-and-trade/commodities/rice/rmm/en/ (accessed on 1 April 2019).
  48. Kazemi, H.; Kamkar, B.; Lakzaei, S.; Badsar, M.; Shahbyki, M. Energy flow analysis for rice production in different geographical regions of Iran. Energy 2015, 84, 390–396. [Google Scholar] [CrossRef]
  49. Yousefian, M.; Soltani, A.; Dastan, S.; Ajamnoroozi, H. Documenting production process and the ranking factors causing yield gap in rice fields in Sari, Iran. Iran Agric. Res. 2019, 38, 101–109. [Google Scholar] [CrossRef]
  50. Regmi, R.; Saha, S.; Balla, M. Geospatial analysis of land use land cover change predictive modeling at Phewa Lake Watershed of Nepal. Int. J. Curr. Eng. Technol. 2014, 4, 2617–2627. [Google Scholar]
  51. Budyko, M.I. The heat balance of the earth’s surface. Sov. Geogr. 1961, 2, 3–13. [Google Scholar] [CrossRef]
  52. Sharp, R.; Douglass, J.; Wolny, S.; Arkema, K.; Bernhardt, J.; Bierbower, W.; Chaumont, N.; Denu, D.; Fisher, D.; Glowinski, K.; et al. InVEST 3.9.0. User’s Guide; The Natural Capital Project, Stanford University, University of Minnesota, The Nature Conservancy, and World Wildlife Fund: Stanford, CA, USA, 2020. [Google Scholar]
  53. Evans, J.; Geerken, R. Discrimination between climate and human-induced dryland degradation. J. Arid Environ. 2004, 57, 535–554. [Google Scholar] [CrossRef]
  54. Wessels, K.J.; Prince, S.D.; Malherbe, J.; Small, J.; Frost, P.E.; VanZyl, D. Can human-induced land degradation be distinguished from the effects of rainfall variability? A case study in South Africa. J. Arid Environ. 2007, 68, 271–297. [Google Scholar] [CrossRef]
  55. Nikpour, A.; Malekshahi, G.; Mehralitabar, A.; Hasanalizadeh, M. Changes in the urban system in Mazandaran province with emphasis on small towns. Geogr. Hum. Relatsh. 2018, 1, 151–166. [Google Scholar]
  56. Hargreaves, G.H.; Allen, R.G. History and evaluation of Hargreaves evapotranspiration equation. J. Irrig. Drain. Eng. 2003, 129, 53–63. [Google Scholar] [CrossRef]
  57. Hargreaves, G.H. Defining and using reference evapotranspiration. J. Irrig. Drain. Eng. 1994, 120, 1132–1139. [Google Scholar] [CrossRef]
  58. Allen, R.G.; Pereira, L.S.; Raes, D.; Smith, M. Crop Evapotranspiration-Guidelines for Computing Crop Water Requirements-FAO Irrigation and Drainage Paper; FAO: Rome, Italy, 1998; Volume 300. [Google Scholar]
  59. Murphy, S.R. Tropical Perennial Grasses–Root Depths, Growth and Water Use Efficiency; NSW Department Primary Industries Primefacts: New South Wales, Australia, 2010; Volume 1027. [Google Scholar]
  60. Nippert, J.B.; Holdo, R.M. Challenging the maximum rooting depth paradigm in grasslands and savannas. Funct. Ecol. 2015, 29, 739–745. [Google Scholar] [CrossRef]
  61. Pan, T.; Wu, S.; Liu, Y. Relative contributions of land use and climate change to water supply variations over yellow river source area in Tibetan plateau during the past three decades. PLoS ONE 2015, 10, e0123793. [Google Scholar] [CrossRef]
  62. Battaglin, W.A.; Smalling, K.L.; Anderson, C.; Calhoun, D.; Chestnut, T.; Muths, E. Potential interactions among disease, pesticides, water quality and adjacent land cover in amphibian habitats in the United States. Sci. Total Environ. 2016, 566, 320–332. [Google Scholar] [CrossRef]
  63. Jiang, C.; Li, D.; Wang, D.; Zhang, L. Quantification and assessment of changes in ecosystem service in the Three-River Headwaters Region, China as a result of climate variability and land cover change. Ecol. Indic. 2016, 66, 199–211. [Google Scholar] [CrossRef]
  64. Rajib, M.A.; Ahiablame, L.; Paul, M. Modeling the effects of future land use change on water quality under multiple scenarios: A case study of low-input agriculture with hay/pasture production. Sustain. Water Qual. Ecol. 2016, 8, 50–66. [Google Scholar] [CrossRef] [Green Version]
  65. Sample, J.E.; Baber, I.; Badger, R. A spatially distributed risk screening tool to assess climate and land use change impacts on water-related ecosystem services. Environ. Model. Softw. 2016, 83, 12–26. [Google Scholar] [CrossRef]
  66. Scaroni, A.E.; Wallover, C.G. Watershed-Based Planning to Protect and Improve Surface Water Quality. Clemson Extension: Clemson, SC, USA. 2020. Available online: http://lgpress.clemson.edu/publication/watershed-based-planning-to-protect-and-improve-surface-water-quality/ (accessed on 8 October 2020).
  67. Zhao, G.; Gao, H.; Naz, B.S.; Kao, S.C.; Voisin, N. Integrating a reservoir regulation scheme into a spatially distributed hydrological model. Adv. Water Resour. 2016, 98, 16–31. [Google Scholar] [CrossRef] [Green Version]
  68. Hosseini, M.; Ashraf, M.A. Application of the SWAT Model for Water Components Separation in Iran; Springer: Tokyo, Japan, 2015; pp. 63–77. [Google Scholar] [CrossRef]
  69. Wohlfart, C.; Mack, B.; Liu, G.; Kuenzer, C. Multi-faceted land cover and land use change analyses in the Yellow River Basin based on dense Landsat time series: Exemplary analysis in mining, agriculture, forest, and urban areas. Appl. Geogr. 2017, 85, 73–88. [Google Scholar] [CrossRef]
  70. Zabihi, M.; Moradi, H.R.; Gholamalifard, M.; Khaledi Darvishan, A. Effects of Land Use/Land Cover Change Scenarios on Landscape Metrics on the Talar Watershed. Watershed Manag. Res. J. 2019, 32, 84–99. [Google Scholar] [CrossRef]
  71. Ghanghermeh, A.; Roshan, G. Application of TOPSIS Index in Monitoring of Droughts and Wet for Golestan providence. J. Earth Space Phys. 2015, 41, 547–563. [Google Scholar] [CrossRef]
  72. Arab Ameri, A.; Pourghasemi, H.R.; Shirani, K. Flood susceptibility zonation using new ensemble Bayesian-AHP methods (Case study: Neka Watershed, Mazandaran Province). Iran. J. Ecohydrol. 2017, 4, 447–462. [Google Scholar] [CrossRef]
  73. Alibakhshi, H.; Dourandish, A.; Sabuhi Sabuni, M. Investigating the Effects of Climate Change on the Agricultural Market. Agric. Econ. 2020, 13, 55–86. [Google Scholar] [CrossRef]
  74. Brown, P.M.; Wienk, C.L.; Symstad, A.J. Fire and forest history at Mount Rushmore. Ecol. Appl. 2008, 18, 1984–1999. [Google Scholar] [CrossRef]
  75. Jones, B.T.B.; Mosimane, A. Promoting Integrated Community-Based Natural Resource Management as a Means to Combat Desertification: The ‘Living in a Finite Environment’ (LIFE) Project and the Khoadi; Hoas Nyae Nyae Conservancy Namibia, International Resources Group (IRG): Washington, DC, USA, 2007. [Google Scholar]
  76. Khoshravesh, M.; Abedi-Koupai, J.; Nikzad-Tehrani, E. Detection of trends in hydro-climatological variables using parametric and non-parametric tests in Neka basin. J. Water Soil Sci. 2016, 19, 1–14. [Google Scholar] [CrossRef] [Green Version]
  77. Zarandian, A.; Baral, H.; Yavari, A.R.; Jafari, H.R.; Stork, N.E.; Ling, M.A.; Amirnejad, H. Anthropogenic decline of ecosystem services threatens the integrity of the unique Hyrcanian (Caspian) forests in Northern Iran. Forests 2016, 7, 51. [Google Scholar] [CrossRef]
  78. Aghsaei, H.; Dinan, N.M.; Moridi, A.; Asadolahi, Z.; Delavar, M.; Fohrer, N.; Wagner, P.D. Effects of dynamic land use/land cover change on water resources and sediment yield in the Anzali wetland catchment, Gilan, Iran. Sci. Total Environ. 2020, 712, 136449. [Google Scholar] [CrossRef]
Figure 1. The Haraz basin in the Mazandaran province (B) of Iran (A) is depicted with rivers, and Digital Elevation Model (DEM) (C).
Sustainability 14 07578 g001
Figure 2. Investigation of precipitation data between 1992 and 2016.
Sustainability 14 07578 g002
Figure 3. The participation of Land use/Land cover, precipitation, and ET0 Spatio-temporal pattern.
Sustainability 14 07578 g003
Figure 4. Land use/Land cover change 1992–2026.
Sustainability 14 07578 g004
Figure 5. The matrix of Land use/Land cover change (km2) for 1992–2016.
Sustainability 14 07578 g005
Figure 6. Percentage changes in Land use/Land cover within each class (1992–2007, 2008–2016,2016–2026, and 1992–2026).
Sustainability 14 07578 g006
Figure 7. Percentage of changes in the three classes of agricultural land use/land cover, forest, and settlement.
Sustainability 14 07578 g007
Figure 8. Spatial pattern of the water-yield depth in the Haraz basin in 1992, 2007, 2016, and 2026—changes in the spatiotemporal in water yield from 1992 to 2007, 2007 to 2016, 2016 to 2026, and 1992 to 2026, respectively.
Sustainability 14 07578 g008
Figure 9. The rates of land use/land cover contribution and climate change in water yield during four periods (Brown, orange, green, light blue, and dark blue indicate extremely low, low, medium, high, and extremely high contribution rates, respectively).
Sustainability 14 07578 g009
Table 1. Land cover/Land use classes description.
ClassesDescription
AgricultureRainfed cropland, Irrigated cropland, Mosaic cropland/Land used for farming, cropland
ForestTree cover, broadleaved, evergreen, needle-leaved, deciduous
Sparse vegetationtree, shrub, herbaceous cover, Lichens, and mosses
ShrublandShrubland
Bare areasBare areas/Sand, landfill sites, rocks, active excavation area, and Bare soil,
WaterNatural water bodies, lakes, reservoirs, and oceans
GrasslandMosaic herbaceous cover, Grassland
Wetlandflooded, fresh-saline, or brackish water
SettlementUrban
Table 2. The model inputs statistics and sources of the dataset for water yield.
DataData DescriptionData SourceSpatial Resolution
Climate dataMonthly precipitation data
Monthly mean temperature
Monthly maximum temperature
Monthly minimum temperature
www.worldclim.org (accessed on 15 May 2017)500 m
Soil dataSoil depthhttps://www.isric.org/explore/soilgrids (accessed on 10 May 2020)250 m
Land use/Land coverLand use/cover in 1992–2016http://maps.elie.ucl.ac.be/CCI/viewer/ (accessed on 13 March 2014)300 m
PAWCSoil texture (%sand, %clay, %organic carbon, %silt)http://www.fao.org (accessed on 5 March 2012)500 m
Table 3. The Biophysical Table.
LULCLULC_VegRoot_DepthKc
Agriculture115000.65
Forest135001
Shrubland125000.39
Sparse Vegetation127000.55
Grassland18000.65
Wetland011.2
Bareland010.5
Urban010.3
Water011.05
Table 4. Designed scenario for exploring the water-yield change.
Scenario GroupScenarioLULCClimate
SnG1Sn1
Sn2
Sn3
Sn4
SnG2Sn1
Sn2
Sn3
Sn4
SnG3Sn1
Sn2
Sn3
Sn4
SnG4Sn1
Sn2
Sn3
Sn4
SnG1, SnG2, SnG3, and SnG4 represent the scenario group of 1992–2007, 2007–2016, 2016–2026, and 1992–2026 respectively; □ indicates the input variable for the beginning year of the scenario group, and ■ indicates the input variable for the end year of the scenario group.
Table 5. Annual Water Yield in 1992, 2007, 2016, and 2026.
Sub-BasinTotal Water Yield (106 m3)
1992200720162026
1150.4492.4970.1393.87
243.6814.7411.5622.48
339.0526.7435.0838.94
41.760.230.330.44
550.3324.7618.0725.16
636.8020.7817.4323.99
774.7543.1339.9146.79
827.3212.5412.2315.6
919.786.086.016.63
108.182.212.372.61
116.832.232.812.75
120.690.0050.040.03
131.240.130.190.27
141.180.080.120.19
151.400.210.240.42
160.910.040.070.12
170.550.050.060.12
181.670.080.120.19
191.650.240.220.38
201.920.330.260.41
214.670.040.160.22
223.530.030.120.17
232.940.010.080.11
Publisher’s Note: MDPI stays neutral with regard to jurisdictional claims in published maps and institutional affiliations.

