Article

Assessment of the Relations for Determining the Profitability of Dairy Farms, A Premise of Their Economic Sustainability

1
Research Institute for Agriculture Economy and Rural Development, 011464 Bucharest, Romania
2
National Research and Development Institute for Animal Biology and Nutrition, 077015 Balotesti, Romania
3
Faculty of Management and Rural Development, University of Agronomic Sciences and Veterinary Medicine, 011464 Bucharest, Romania
4
Department of Agrifood and Environmental Economics, Bucharest University of Economic Studies, 010374 Bucharest, Romania
*
Authors to whom correspondence should be addressed.
Sustainability 2022, 14(12), 7466; https://doi.org/10.3390/su14127466
Submission received: 18 May 2022 / Revised: 6 June 2022 / Accepted: 13 June 2022 / Published: 18 June 2022
(This article belongs to the Special Issue Sustainable Food System in the European Union)

Abstract

:
The profitability of dairy farms is a broadly addressed issue in research, for different farming systems and even more so now, when it comes to the issue of sustainability in different agricultural fields. The present study presents an evaluation of the relations used for the determination of profitability of various categories of dairy farms, in terms of size, geographical area, and total milk production. In order to analyze the associated influence exerted on the level of profitability by the selected technical and economic indicators, regression functions were applied. The TableCurve program was used to determine the ideal equation that describes the data entered in a two- or three-dimensional representation. The research results showed that the size of farms and the level and value of milk production are directly correlated with profitability, and the unit cost is inversely correlated with it.

1. Introduction

Economic efficiency is one of the key prerequisites for ensuring the competitiveness of any business regardless of the economic sector of production or position in the value chain [1]. Kingwell R. (2011) [2] showed that profitable farming systems are often large, complex, highly technologized, and involve time-consuming activities even for high-skilled managers. The farm productivity derived from production technology properly adapted to given conditions determines the financial results, and these influence strategic decisions regarding further development or, in some cases, to cease operations [3].
Previous studies [4] have demonstrated that higher intensification of agricultural activities significantly increases production efficiency. Profitability of the farm can be achieved by improving the input–output ratio and also by increasing income based on expanding production capacity, thus aiming to achieve competitive agricultural systems [5].
The modern farmer must be a skilled manager, selecting different investment opportunities so as to obtain as high a profit as possible, while fully developing human capital and observing environmental protection rules, all at the same time [6]. The available resources and the existing capacities of a given farm determine its development plans [7]. In order to be competitive, farmers need to be constantly aware of changing circumstances and have the ability to adapt to changes in the economic environment [8]. Proper management strategies can only be implemented based on detailed analysis of farm indicators.
The economic sustainability of milk production, as in other economic activities, is measured using the net profit indicator [9,10]. A good understanding of the influence of each cow’s contribution to farm profitability can lead to improved dairy farm management [11]. There are a variety of interconnected factors that affect the efficiency of dairy farms, including management decisions, genetic factors, feed self-sufficiency, and animal welfare [12].
The profitability of dairy farms also depends on the efficiency of feeding, associated with the milk production obtained [13]. Farm profitability is influenced by fluctuations in prices for various inputs, especially feedstock, which have the highest share on expenditure, as well as the volatility of finished-product prices [14]. Low-performing farms have low milk production, unbalanced feed ratios, and low forage area. Large farms have higher turnovers and are more productive because they use better technology; at the same time, they are more specialized in production activity [15].
Economies of scale are one of the factors influencing the economic efficiency of milk production and economic sustainability [16]. Small farmers have limited bargaining power, so in order to become more competitive in the market a change of scale and the development of innovative capacity are needed [17].
Economic sustainability can also be achieved by limiting the number of dairy cows to those that can be fed mainly with forages from the farmer’s own farm [18]. Another important factor influencing the economic performance is the labor force and its productivity [19].
The aim of this study was to evaluate the relations for determining the profitability of dairy farms of various sizes, with different levels of milk production, with different allocations of expenditure categories, and located in different areas.

2. Materials and Methods

Data from 54 farms from 20 counties located in all 8 development regions of Romania were used. Most of the farms (23) were located in the South-Muntenia Region of Romania.
The total sample of dairy cows from the 54 farms was 3966 heads, calculated as the average number of milking cows for the end of the years 2018, 2019, and 2020, without taking into account other age and production categories of cattle, which were not the subject of the study. A share of 51.41% were located in the South-Muntenia Region, included in the largest plain area in Romania. The rest of the livestock composition was as follows: South-West Oltenia Region—4.56% West Region—1.52%, North-West Region—4.83%, Central Region—7.72%, North-East Region—18.01 %, South-East Region—1.24%, and Bucharest–Ilfov Region—10.70%. The average farm size calculated for the period 2018–2020 was 73.44 heads, with a minimum of 5.0 cows and a maximum of 568.3 cows.
Total milk production from the 54 farms (calculated as an average of 2018, 2019, and 2020) was 264,465 hectoliters, distributed by development regions as follows: in the North-East Region 59,080.9 hL (22.34%), in the North-West Region 7261.6 hL (2.75%), in the West Region 3753.8 hL (1.42%), in the South-West Oltenia Region 6248.7 hL (2.36%), in the South-West Region Muntenia 143,477.8 hL (54.26%), in the Central Region 17,416.1 hL (6.59%), in the South-East Region 1925.7 hL (0.73%), and in the Bucharest–Ilfov Region 25,280.4 hL (9.56%) (Figure 1). The average milk production on the farm in the period 2018–2020 was 4554.94 L/cow, with a minimum of 2600 L/cow and a maximum of 9633.3 L/cow.
Data collection from farms encountered some difficulties, primarily due to the fact that it took place during the COVID-19 pandemic with restrictions on mobility and social distancing, so that the originally planned interviews could not be conducted directly on farms, but were conducted mostly by phone. Another challenge was related to the availability of farmers to provide information on different categories of expenditure or delivery prices of products, even though their identity was anonymized. The questions in the questionnaire referred to the landform of the area where the farm was located, the livestock number for the 3 years, milk production, maintenance system, farm equipment, feed rations, different categories of expenses, sale of production, etc.
For each of the 54 farms, the annual estimates of expenditures and the annual budgets of revenues and expenditures of the farms were calculated. The average estimate and the average budget for the 3-year period were calculated.
The structure of the estimated variable expenses included the following elements: feedstock, biological material (heifer value), energy and fuel, medicines and medical supplies, other material expenses, supply quota, and insurance. In addition, the fixed costs included labor costs, general costs, interest on loans, and depreciation.
Based on the elements of the estimate and the data provided by the farms on the capitalization of the main production (milk) and secondary production (calf, manure, and animal slaughtering), the revenue and expenditure budget was prepared.
The technical–economic indicators calculated were: value of production, value of main production, total costs, costs for main production, variable costs, fixed costs, unit cost, profit or loss per unit of product, taxable income rate, threshold in value units, threshold in physical units, and exploitation risk rate, using the following relationships:
Value of production VQ = VQm + VQs, in which: VQm—value of main production, VQs—value of secondary production.
Total costs TC = VC + FC, in which: VC—variable costs, FC—fixed costs.
Costs for main production MC = TCVQs
Variable costs VC = FoC + EnC + MedC + OC + SupC, in which: FoC—forages costs, EnC—energy and fuel costs, MedC—medicines costs, OC—other material costs, SupC—supply costs.
Fixed costs FC = LabC + GC, in which: LabC—labor costs, GC—general costs.
UC = MC/MP, in which: MP—main production
Total profit TPr = VQTC
Profit or loss per unit of product Pr/l = TPr/MP, in which: TPr—total profit.
Net profitability rate NPrR = (TPr/MC) × 100
Margin on variable costs MgVC = VQVC
Margin on variable costs MgVC% = MgVC/VQ × 100
Profitability threshold in value units PrThv = (FC/MgVC%) × 100
Profitability threshold in physical units PrTrph = PrThv/UP, in which: UP—unit price.
Exploitation risk rate ERR = PrThv/VQm
In order to analyze the associated influence of different technical and economic indicators of dairy farms on the results regarding profitability, the TableCurve program was used, which can determine the ideal equation, and, respectively, the representative regression, which describes the data entered. Thus, the relationships between two calculated indicators were illustrated by the resulting curves, and the relationship that includes three indicators was integrated into a spatial model.

3. Findings and Discussions

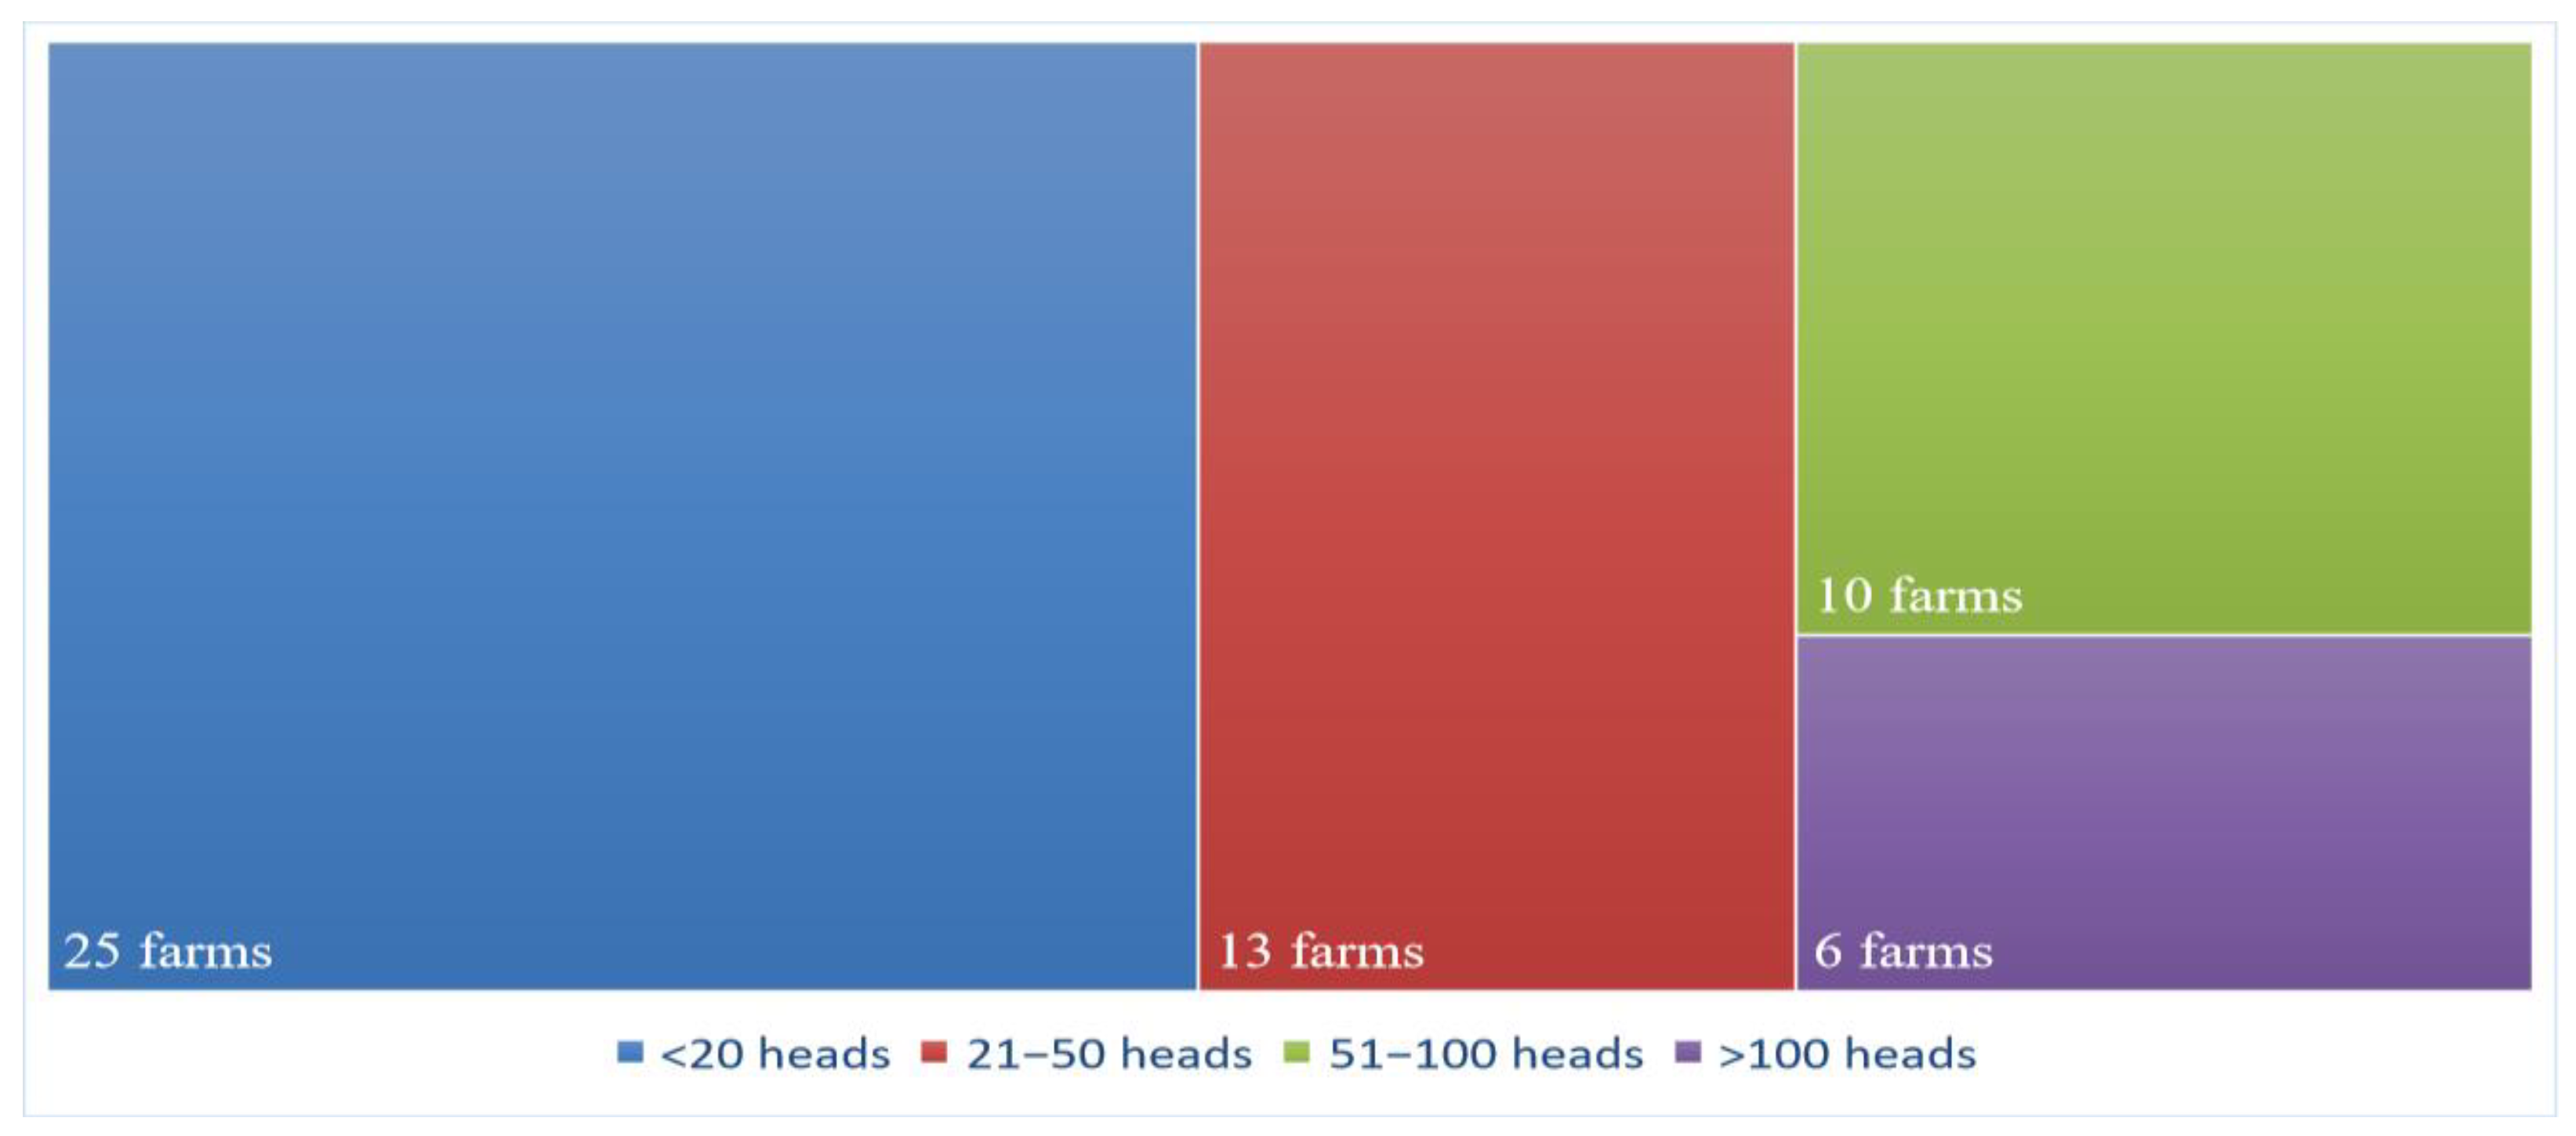
3.1. Distribution of Farms in Case Studies

In order to study the dairy farm size distribution, to compare them with the normal distribution (Gaussian curve) and to highlight the strength of dairy farm size, a graphical representation of the sample was performed, as well as statistical analysis of data.
As can be seen from Figure 2, the physical size of dairy farms in the sample analyzed in the case studies showed a different distribution than normal, with most farms measuring herds between 5 and 100 heads.
Figure 3 shows the clustering of farm size in the sample.
By farm size segments, the average milk production was as follows: in the category below 20 heads, in which 25 farms were included, the average milk production was 3910.67 L/cow, at 21–50 heads (13 farms) was 4471.79 L/cow, at 51–100 heads (10 farms) it was 4328.33 L/cow, and in the category over 100 heads (6 farms), it was 7797.22 L/cow. The smallest size segments, below 100 heads, with yields below 4000 L, generally had the lowest values of profitability indicators, high operating risk rates, and negative safety indices. They also had among the highest unit costs and the lowest labor productivity.
Data related to the size of the farm were analyzed and interpreted with descriptive statistical indicators. Thus, were determined in Table 1 these indicators related to the data string, and, respectively, physical size of the farms.
Regarding the average of the farm segment taken into analysis, it was of 73.4 heads per farm, with a standard error of 17.7. However, the median was 24.5 heads. Regarding the homogeneity of the data, they were not homogeneous, with a standard deviation of ± 130 heads, which caused very large variation. However, the study aimed to cover as many classes of farm size as possible.
The indicators that study the data distribution, the vaulting (Kurtosis) and the asymmetry (Skewness), were aligned, and at the same time confirmed the graphical distribution in Figure 4. The vaulting coefficient showed a positive value, well above the zero value of 6.98, which describes a leptokurtic distribution. Similarly, the symmetry coefficient confirmed the graphical representation, reaching a value of 2.81, which causes asymmetry to the left.

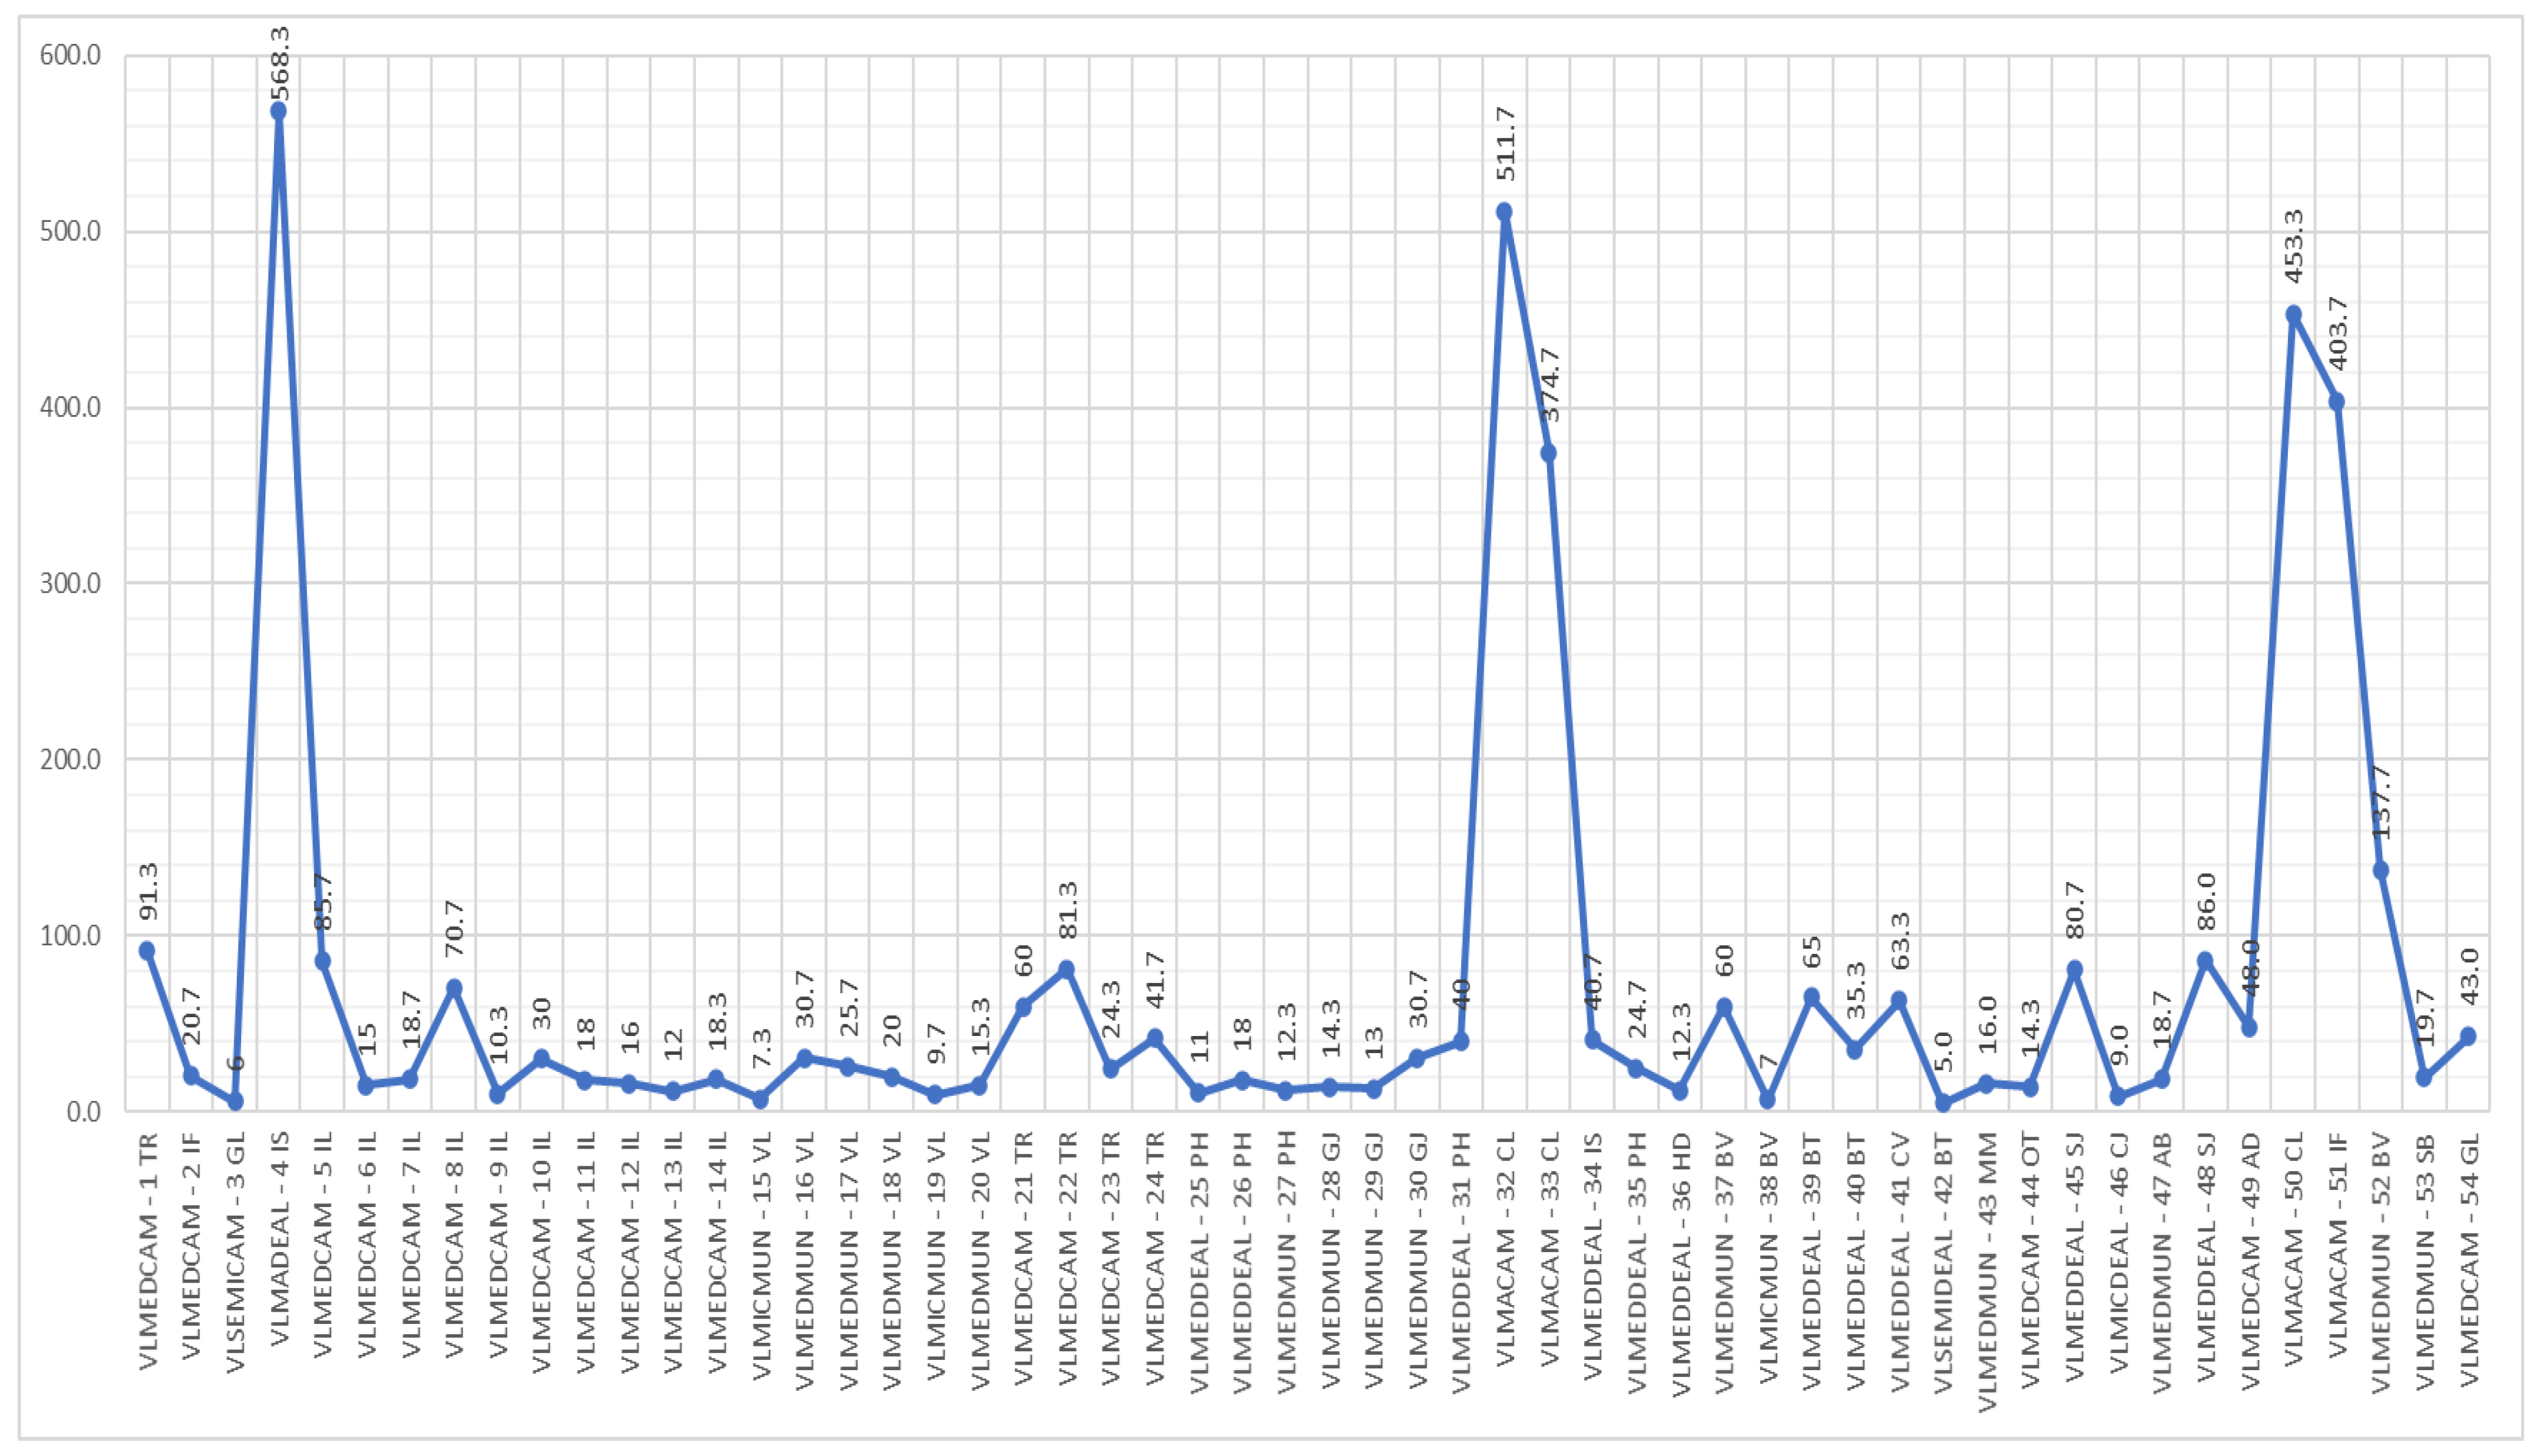
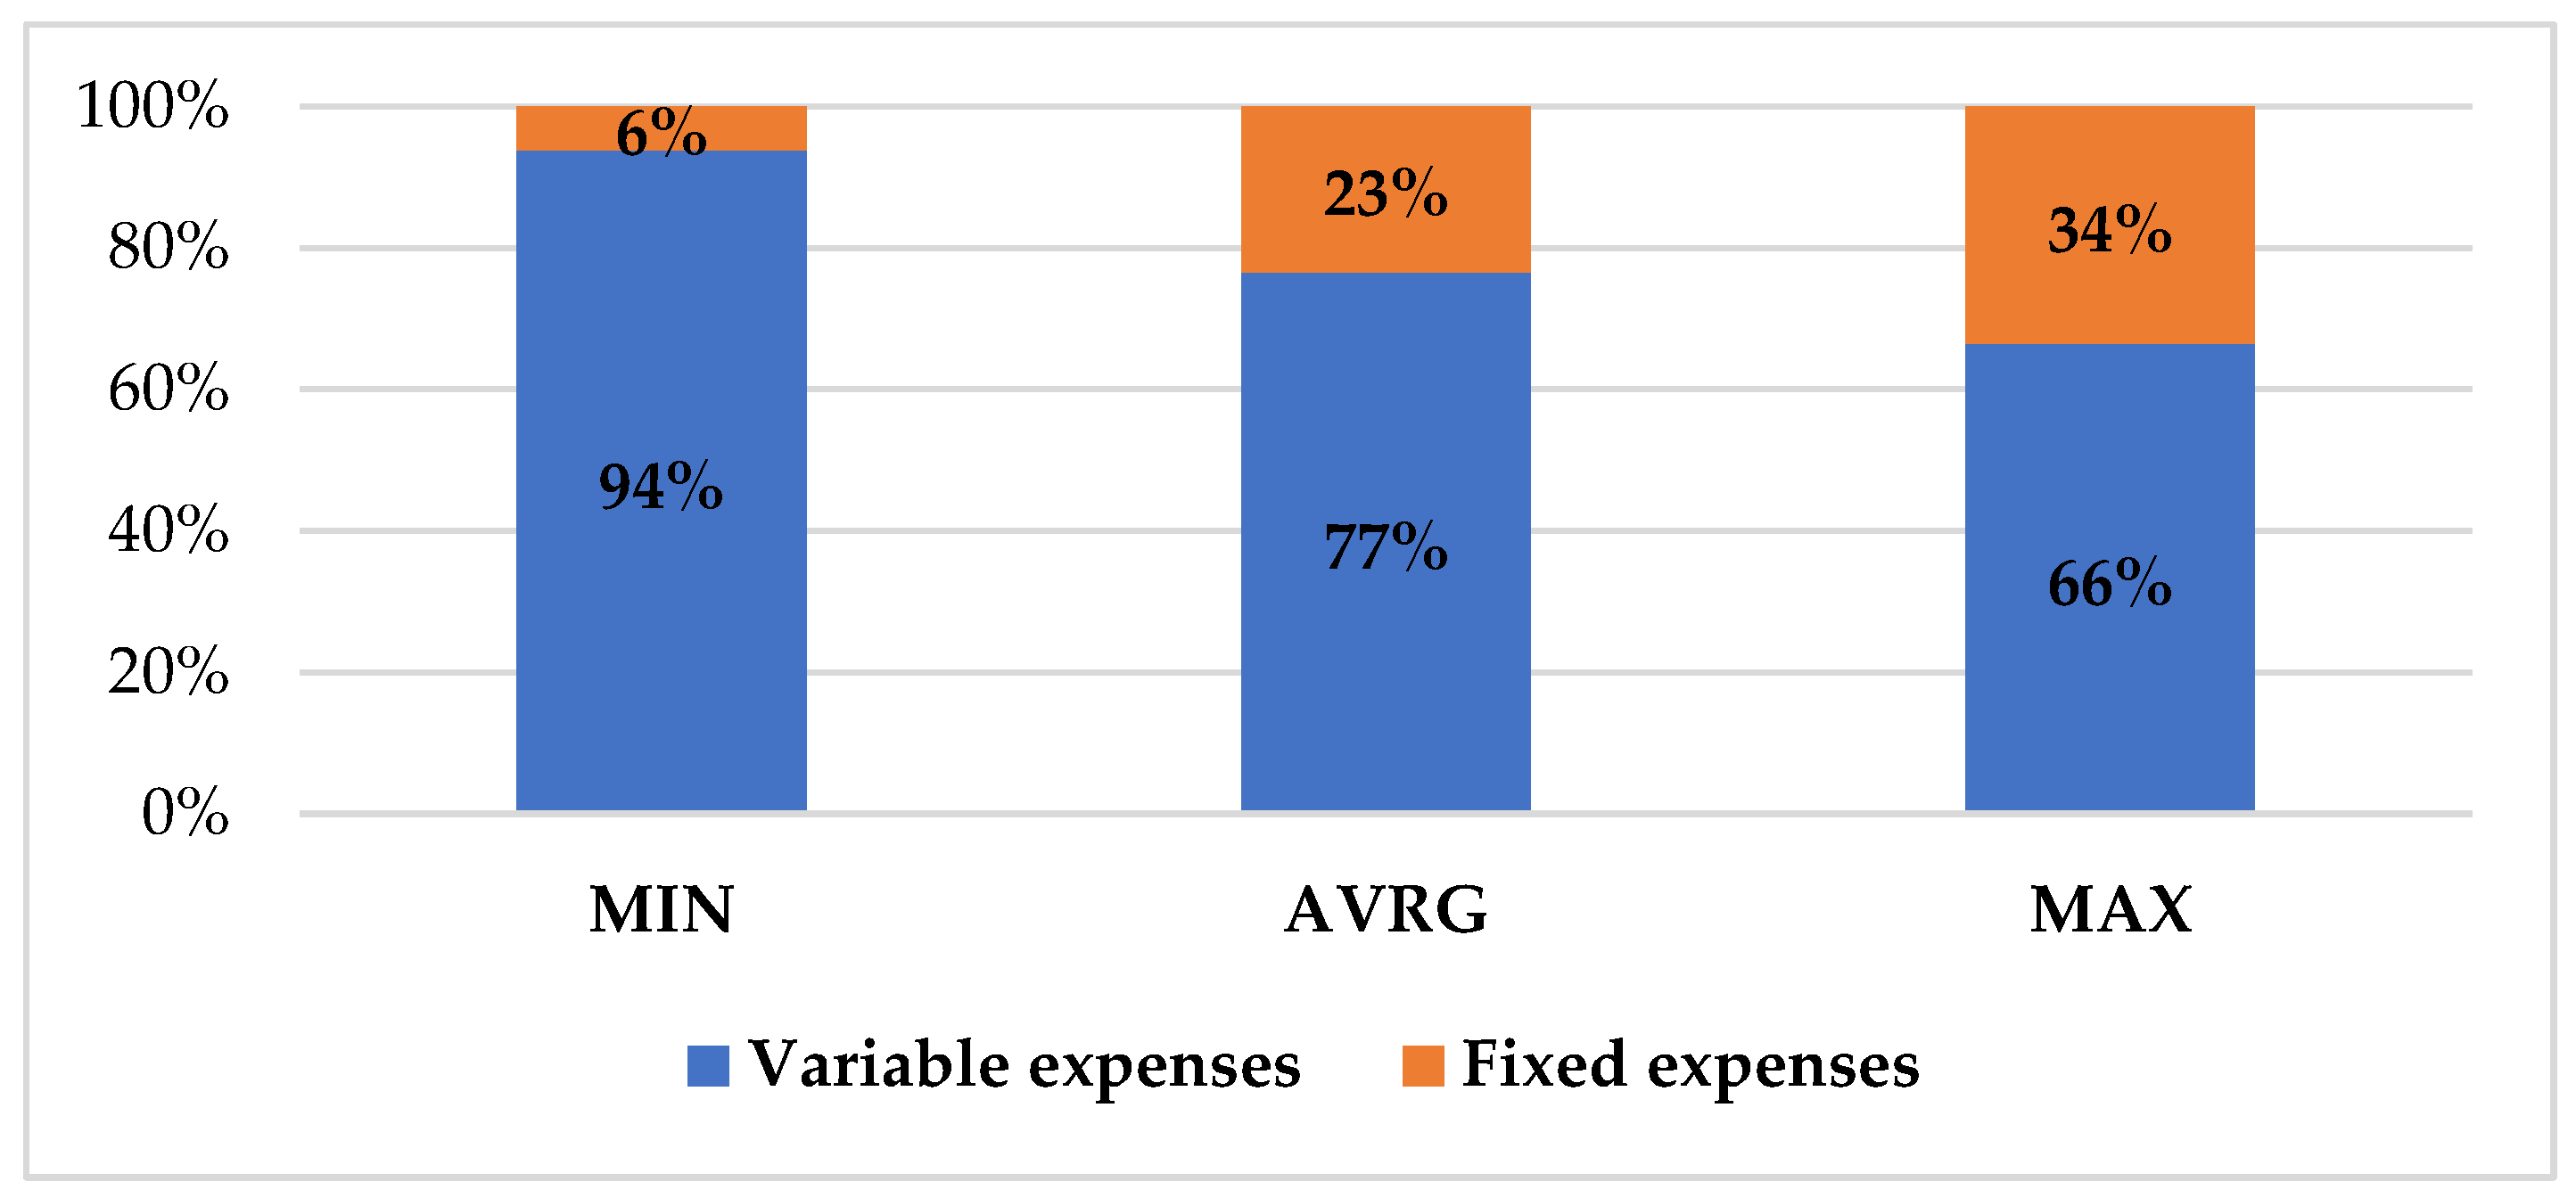
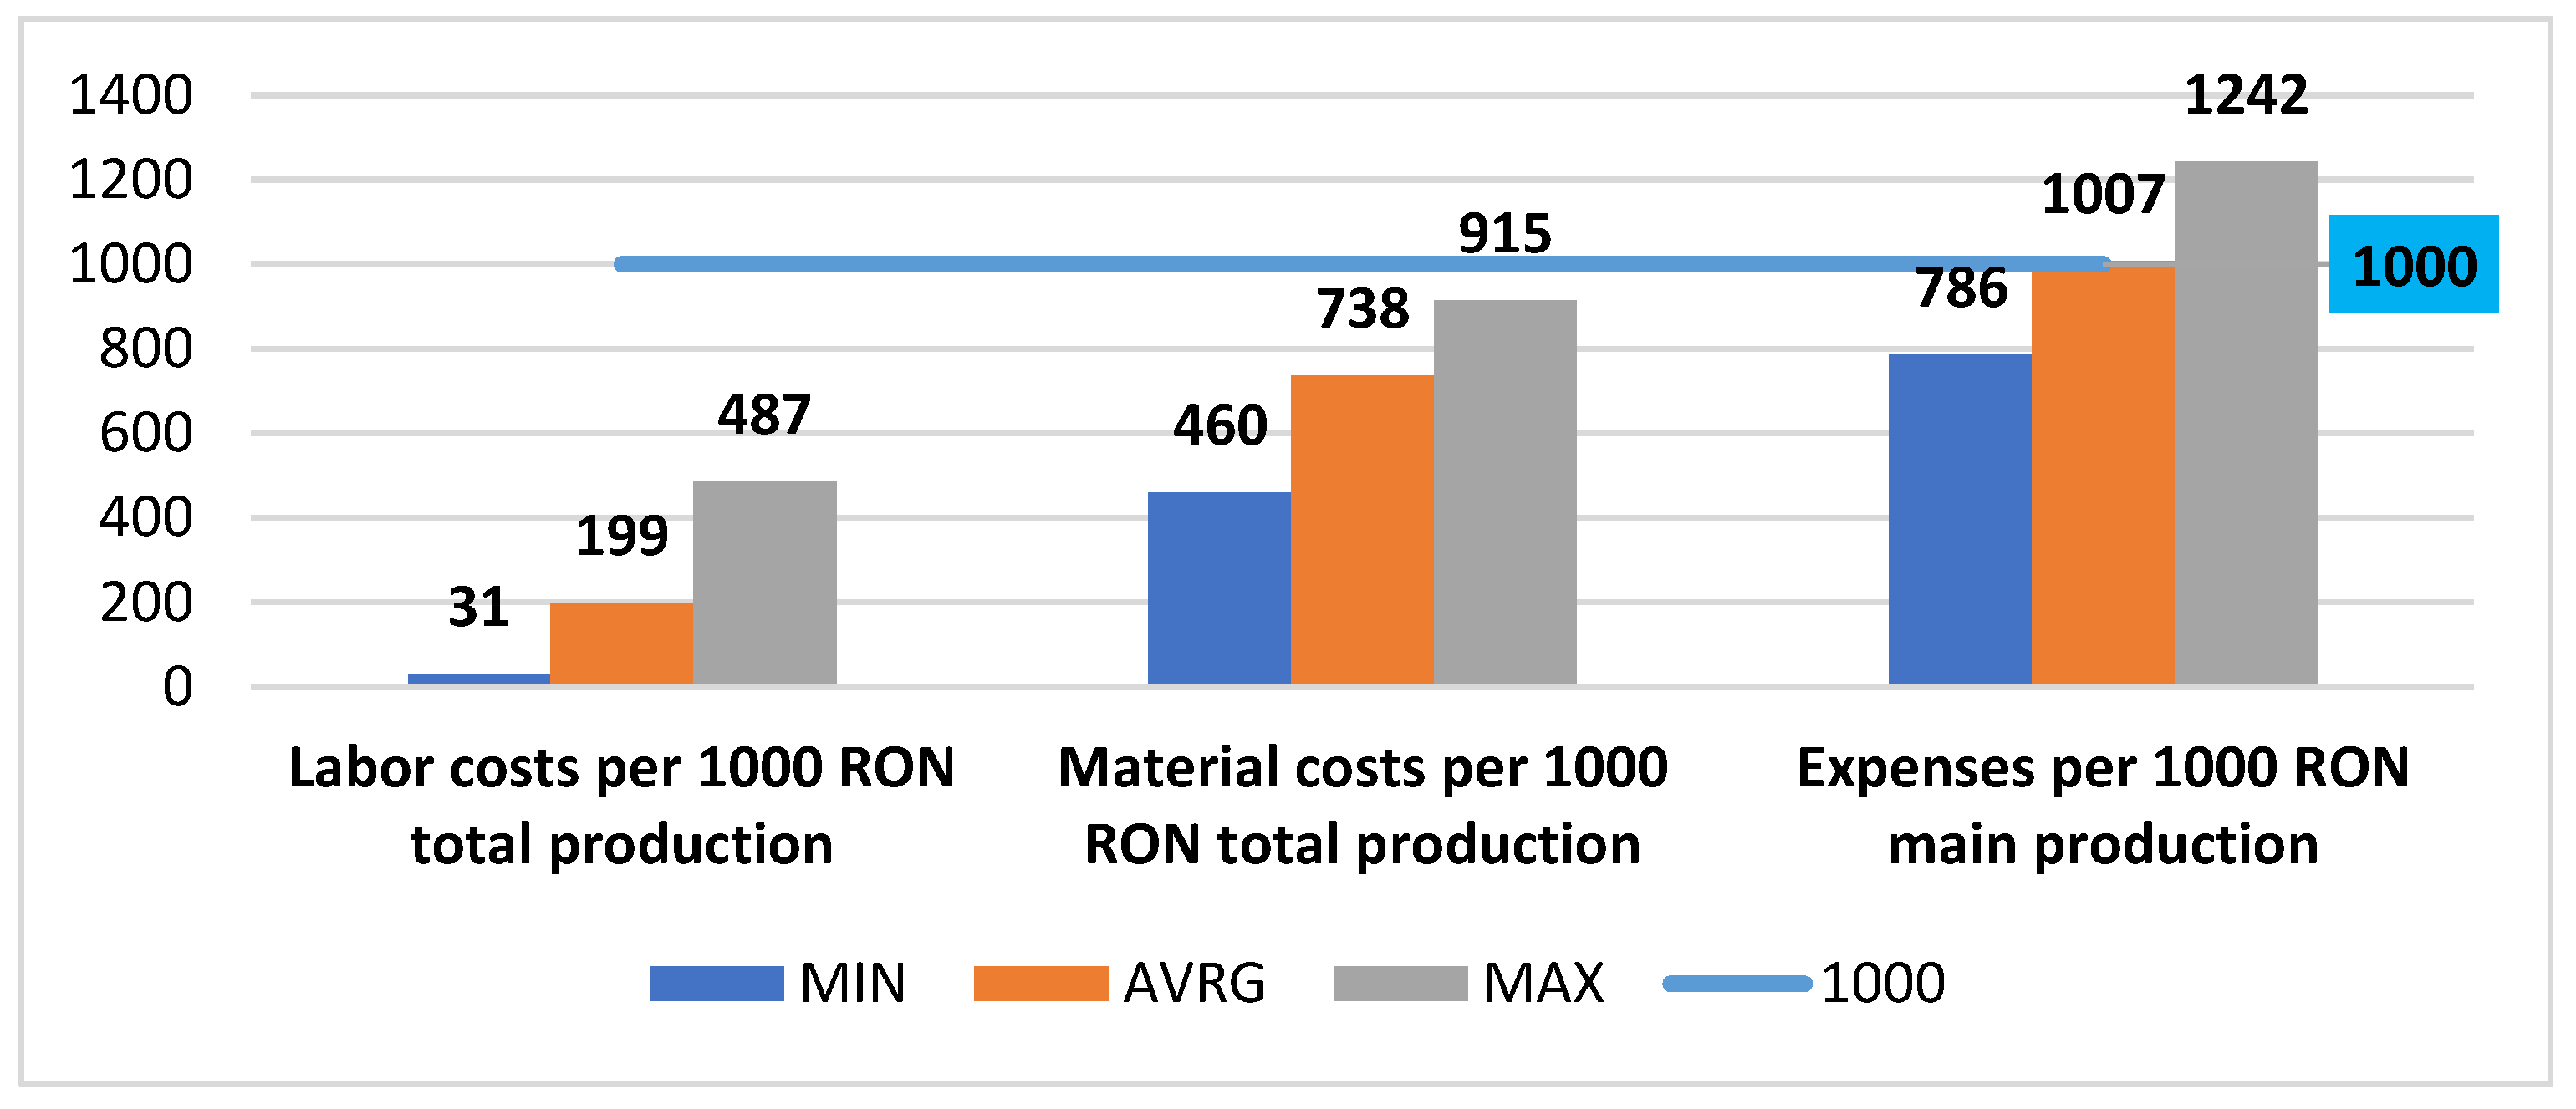
3.2. Centralized Data Analysis

Following the analysis of the 54 dairy farms, it was possible to centralize the technical and economic indicators with the help of the simple arithmetic mean, as well as the standard deviation (Table 2).
The size of the farms in the analyzed segment varied between 5.0 heads per farm and 568.3 heads per farm, registering an average of 73.44 heads per farm, with a variation of 130.2 heads (Figure 4).
In terms of per capita yield, there was an average milk production of a minimum 2600 L of cow’s milk per head and 9633.3 L of cow’s milk per head, with an average of all the farms in the study of 4554.94 L/cow, and a standard deviation from this average of 1809.3 L.
Differences in the prices obtained from the sale of milk relate both to milk sold to the dairy processing industry [20] and to milk marketed directly on the market, as drinking milk, as cheese, or through milk dispensers. The value of milk production, determined per unit of product, ranged between 0.27 USD (1.10 RON)/L and 0.88 USD (3.67 RON)/L, with an average value of 0.37 USD (1.56 RON)/L, and a standard deviation of 0.12 USD (0.5 RON)/L.
Analyzing the expenses, there was a variation between 0.27 USD (1.13 RON)/L and 0.71 USD (2.94 RON)/L. On average, the level of expenses was 0.37 USD (1.55 RON)/L, with a deviation of 0.09 USD (0.4 RON). Thus, it was possible to identify an increase in the lower limit of expenditures compared to the value of production, exceeding the latter. Farms with the lowest production values run the risk of not being economically sustainable. Comparing the standard deviation for the value of production (indicator related to price) and the standard deviation for the expenses related to a liter of milk (indicator related to cost), it was found that there were no significant differences, with the deviation for the value of production being ±0.12 USD/L, and in the case of expenses being ±0.09 USD/L. Thus, even if the price varied quite a bit (±32%), unfortunately the costs also varied similarly by ±25.8%, which indicated that the production technologies were influenced fairly high by both external factors and by the cost elements, and the cost was also influenced by the level of production, being in an almost linear relationship with it [21]. Nutrition strategies and good breeding practices can also contribute to increasing the efficiency of animal production [22].
The structure by elements of expenditures, depending on the farm size—small-, large-, and medium-sized farms—is illustrated in Figure 5.
When analyzing the structure of costs, it could be observed that, for the smallest farm in the sample (five dairy cows), the share of variable costs represented 94% of total costs. On the other hand, for the largest farm in the sample (568 dairy cows), the share of variable expenditures was 66% of total expenditures. Management costs for large farms were much higher than for small farms. On average, which was 73 dairy cows, the share of variable expenditures per farm and per unit of product was around 77% of total expenditures and the share of fixed expenditure was 23%.
As viability and economic sustainability indicate the ability of the farm to operate longer and to grow, labor productivity indicators in relation to output are also important [23]. Directing funds to investments that improve labor productivity encourages sustainable practices on dairy farms [24]. Labor productivity in dairy farms is determined by a number of factors, including, for example, the volume of manual labor and the degree of mechanization. Large-scale dairy farms have higher labor productivity than other farms [25]. The indicator can be expressed in physical units of product, or in value units. The productivity of work in physical expression ranged between 0.01 man-hours per liter and 0.17 man-hours per liter, with an average working time to obtain a liter of milk of 0.06 man-hours. The productivity of labor in value terms ranged between 8.27 RON/man-hours and 208.37 RON/man-hours, but, on average, in one hour of work a worker produced milk in value of 43.56 RON. The size of the farms in the analyzed segment varied between 5.0 heads per holding and 568.3 heads per holding, registering an average of 73.44 heads per farm, with a variation from the average of 130.2 heads (Figure 4).
In order to ensure economic sustainability in conditions of market competition, a proper decision making plays a key role [26]. Economic sustainability can also be determined on the basis of the costs related to the value of the main production. In this situation, there are three indicators, shown in Figure 6.
Expenses per 1000 RON main production characterizes more strongly the degree of economic sustainability. This indicator shows the share of expenditure in the value of production, the rest representing the share of profit. Labor costs ranged from 3.07% to 48.66%, with an average of 19.9%. The high shares of this indicator were affected by the extreme data from certain case studies in the sample, in which the average production was only 2600–2700 L/cow, with farm sizes below 12 heads.
Cheng, S., Zheng, Z., and Henneberry, S. (2019) [27] showed that, compared to large farms, smaller farms consume more labor force, and for higher yields, more labor efforts, inputs, and precision technology are necessary. Productivity changes are more important for smaller farms and require further modernization of technology, with a certain balance between own and borrowed capital [28].
Analyzing the expenses with materials, they oscillated, with weights between 46% and 91.5%. A key indicator associated with maximizing farm-level profitability is the proportion of forages purchased [29], as the forages accounts for the largest share of material costs. An increase in feed prices increases the cost of milk [30], and thus profitability will be negatively affected.
Finally, analyzing the total expenses related to 1000 RON main production, it was observed that the most efficient farm registered a level of expenses of 786 RON to obtain a value of milk production of 1000 RON, which can be concluded as having an added value of 21.4%. On the other hand, the most economically inefficient farm was the one that had to make a financial effort of 1242 RON to produce milk worth 1000 RON, which obviously led to a loss for that farm. In general, on average, it was observed that the level of expenses incurred to obtain a milk production of 1000 RON was higher than this threshold by 7 RON, which suggested that, on average, the farms studied do not make a profit per unit of product, being at a slight loss, mainly due to low levels of milk production.

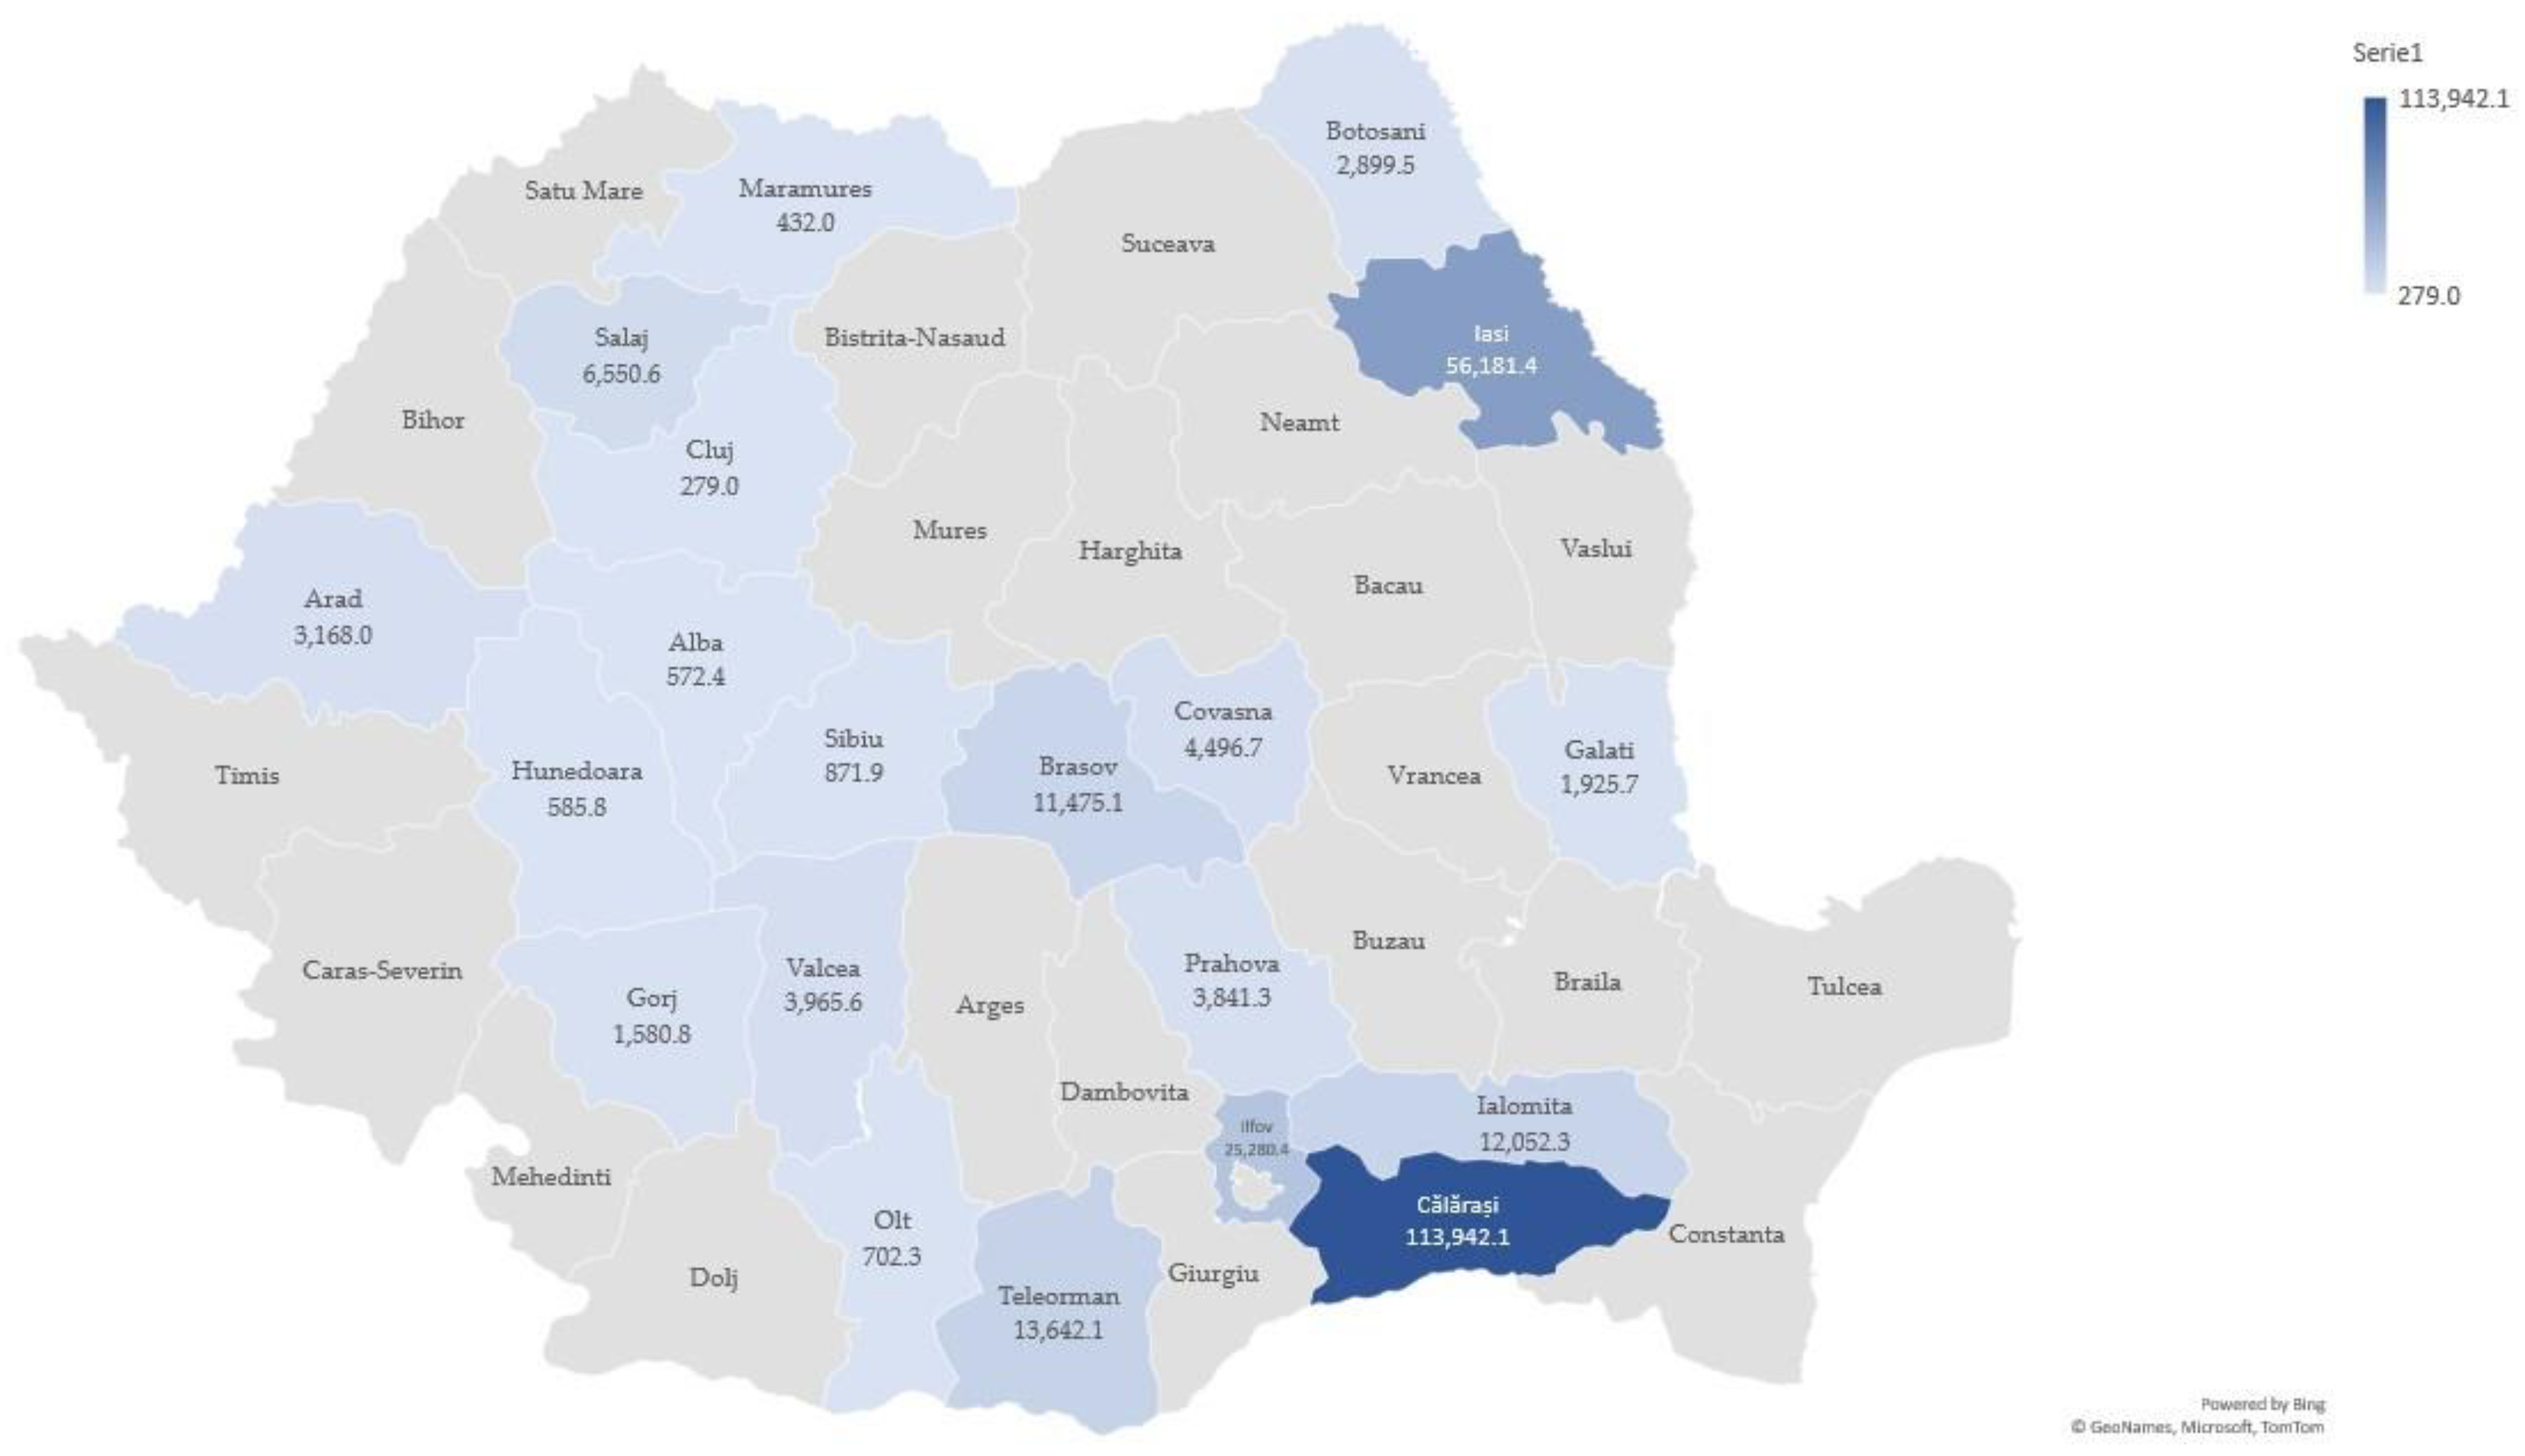
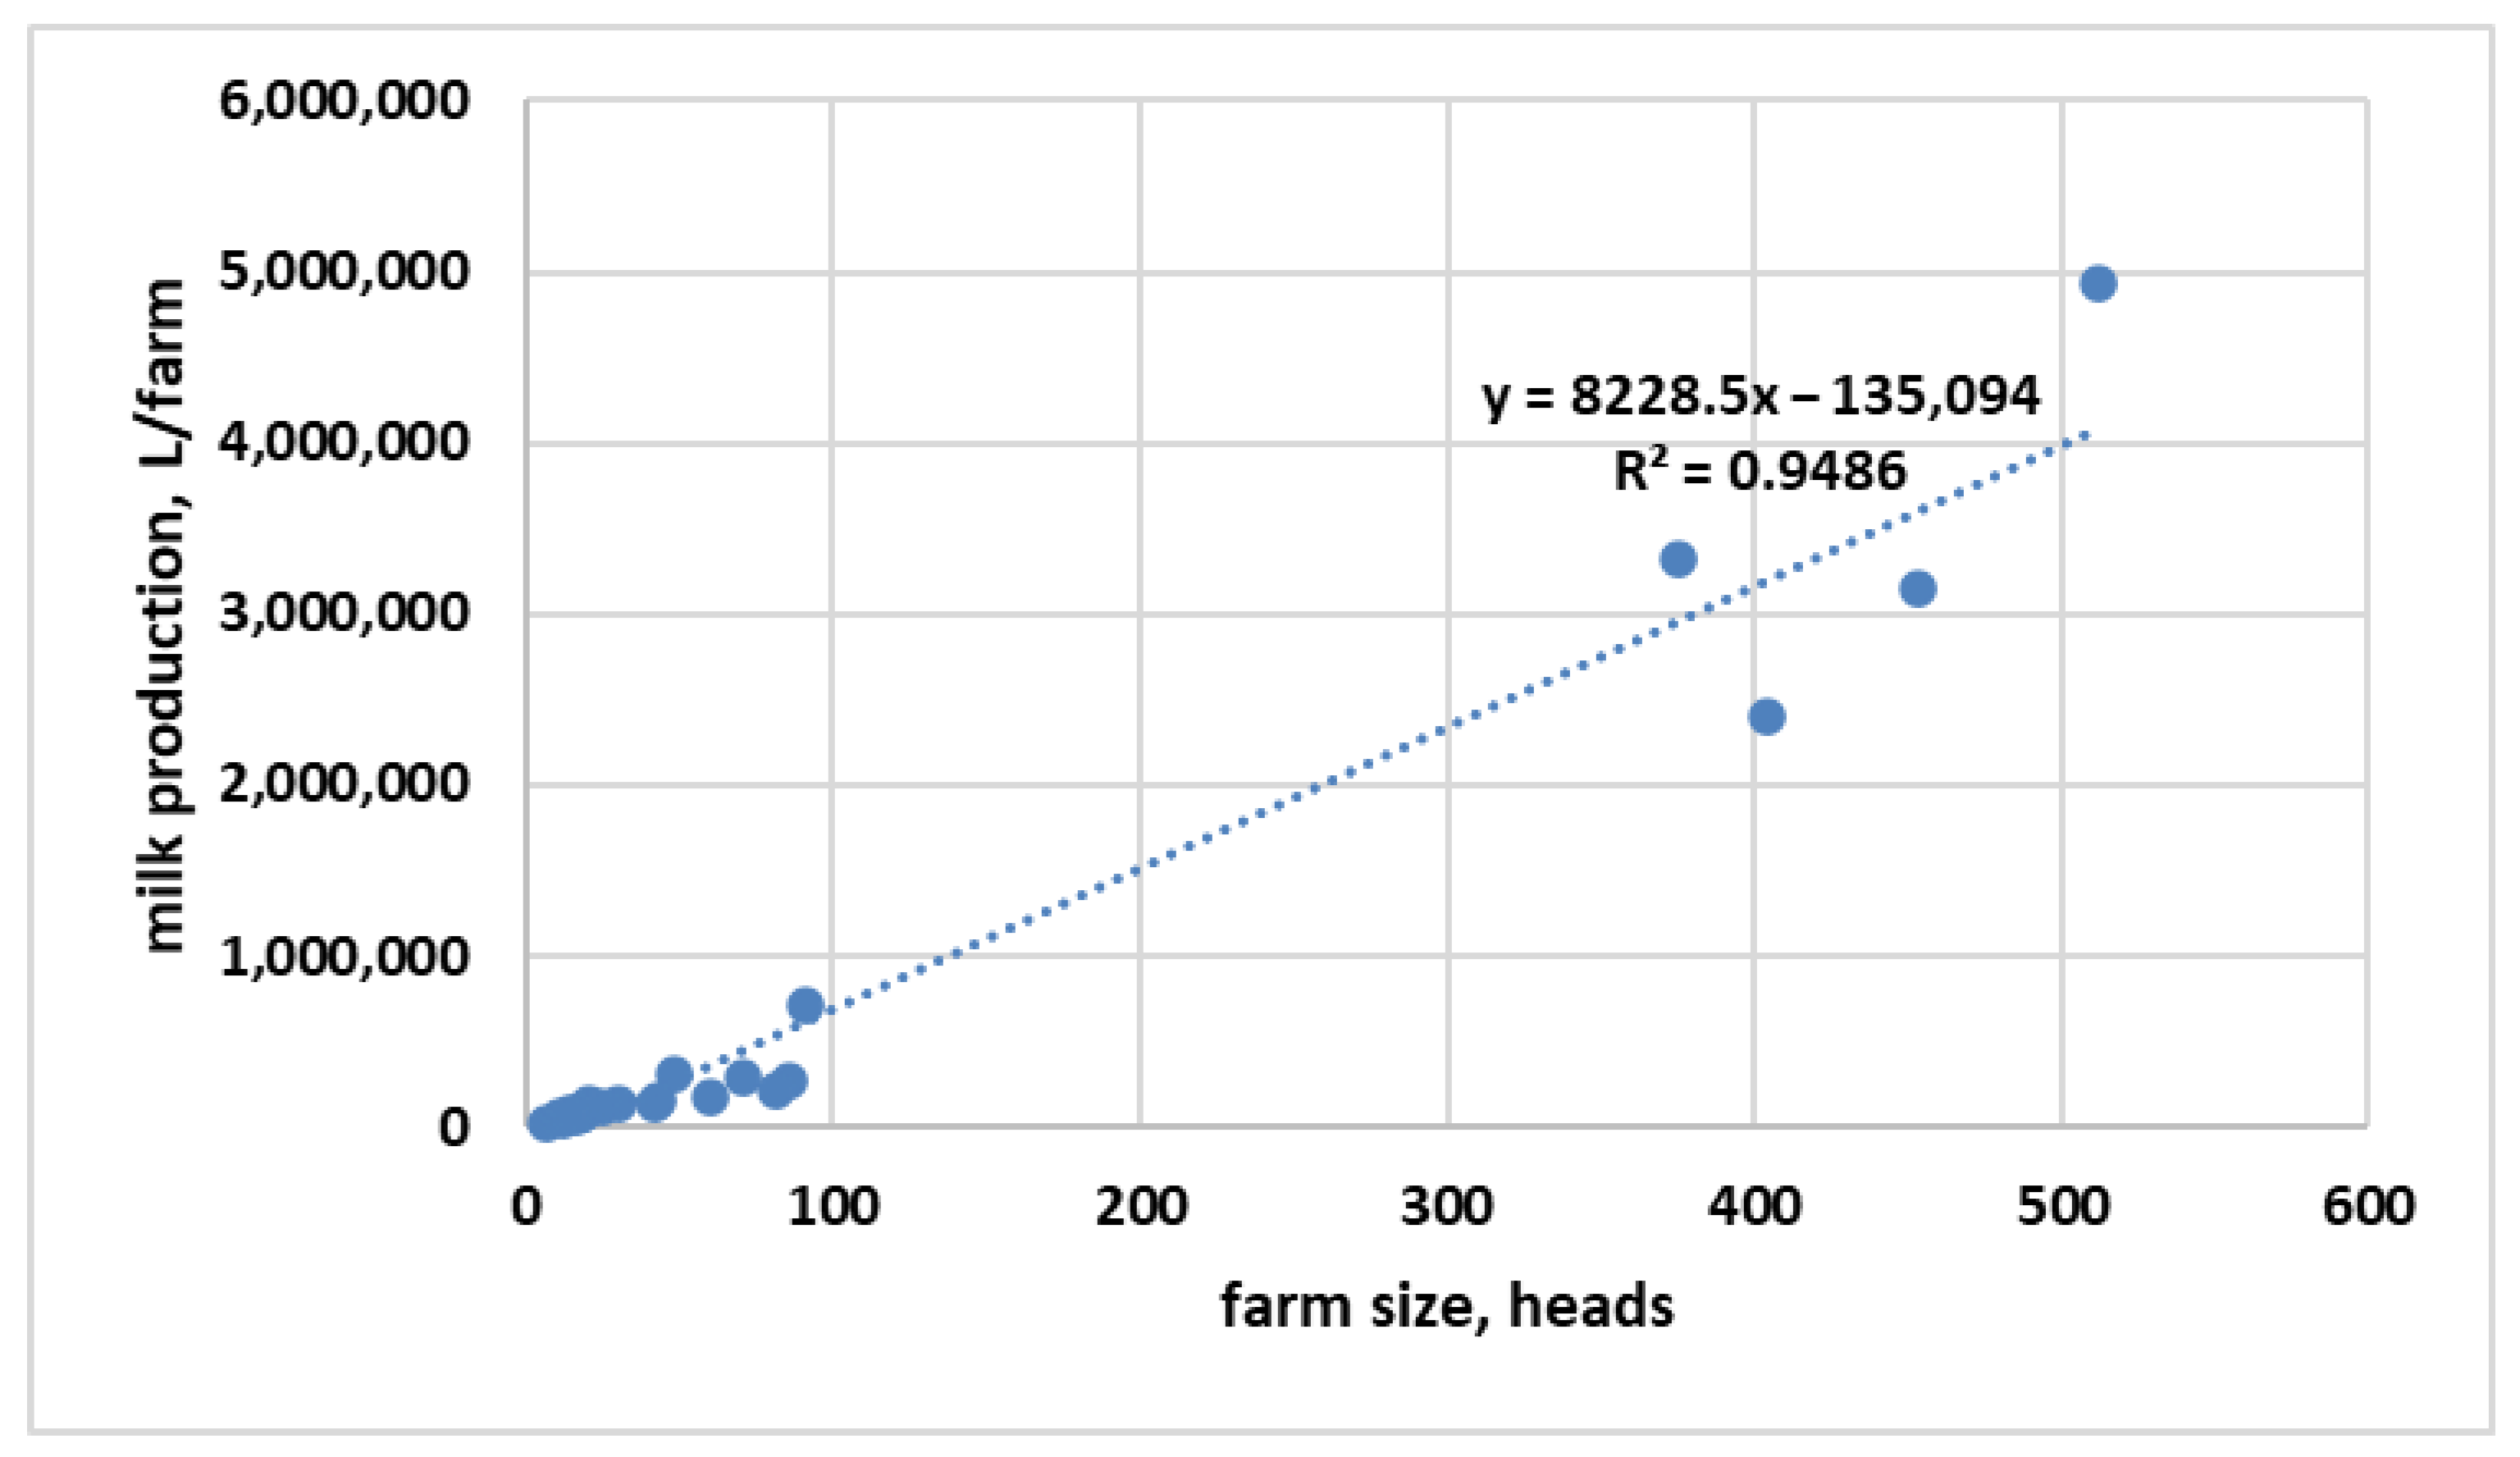
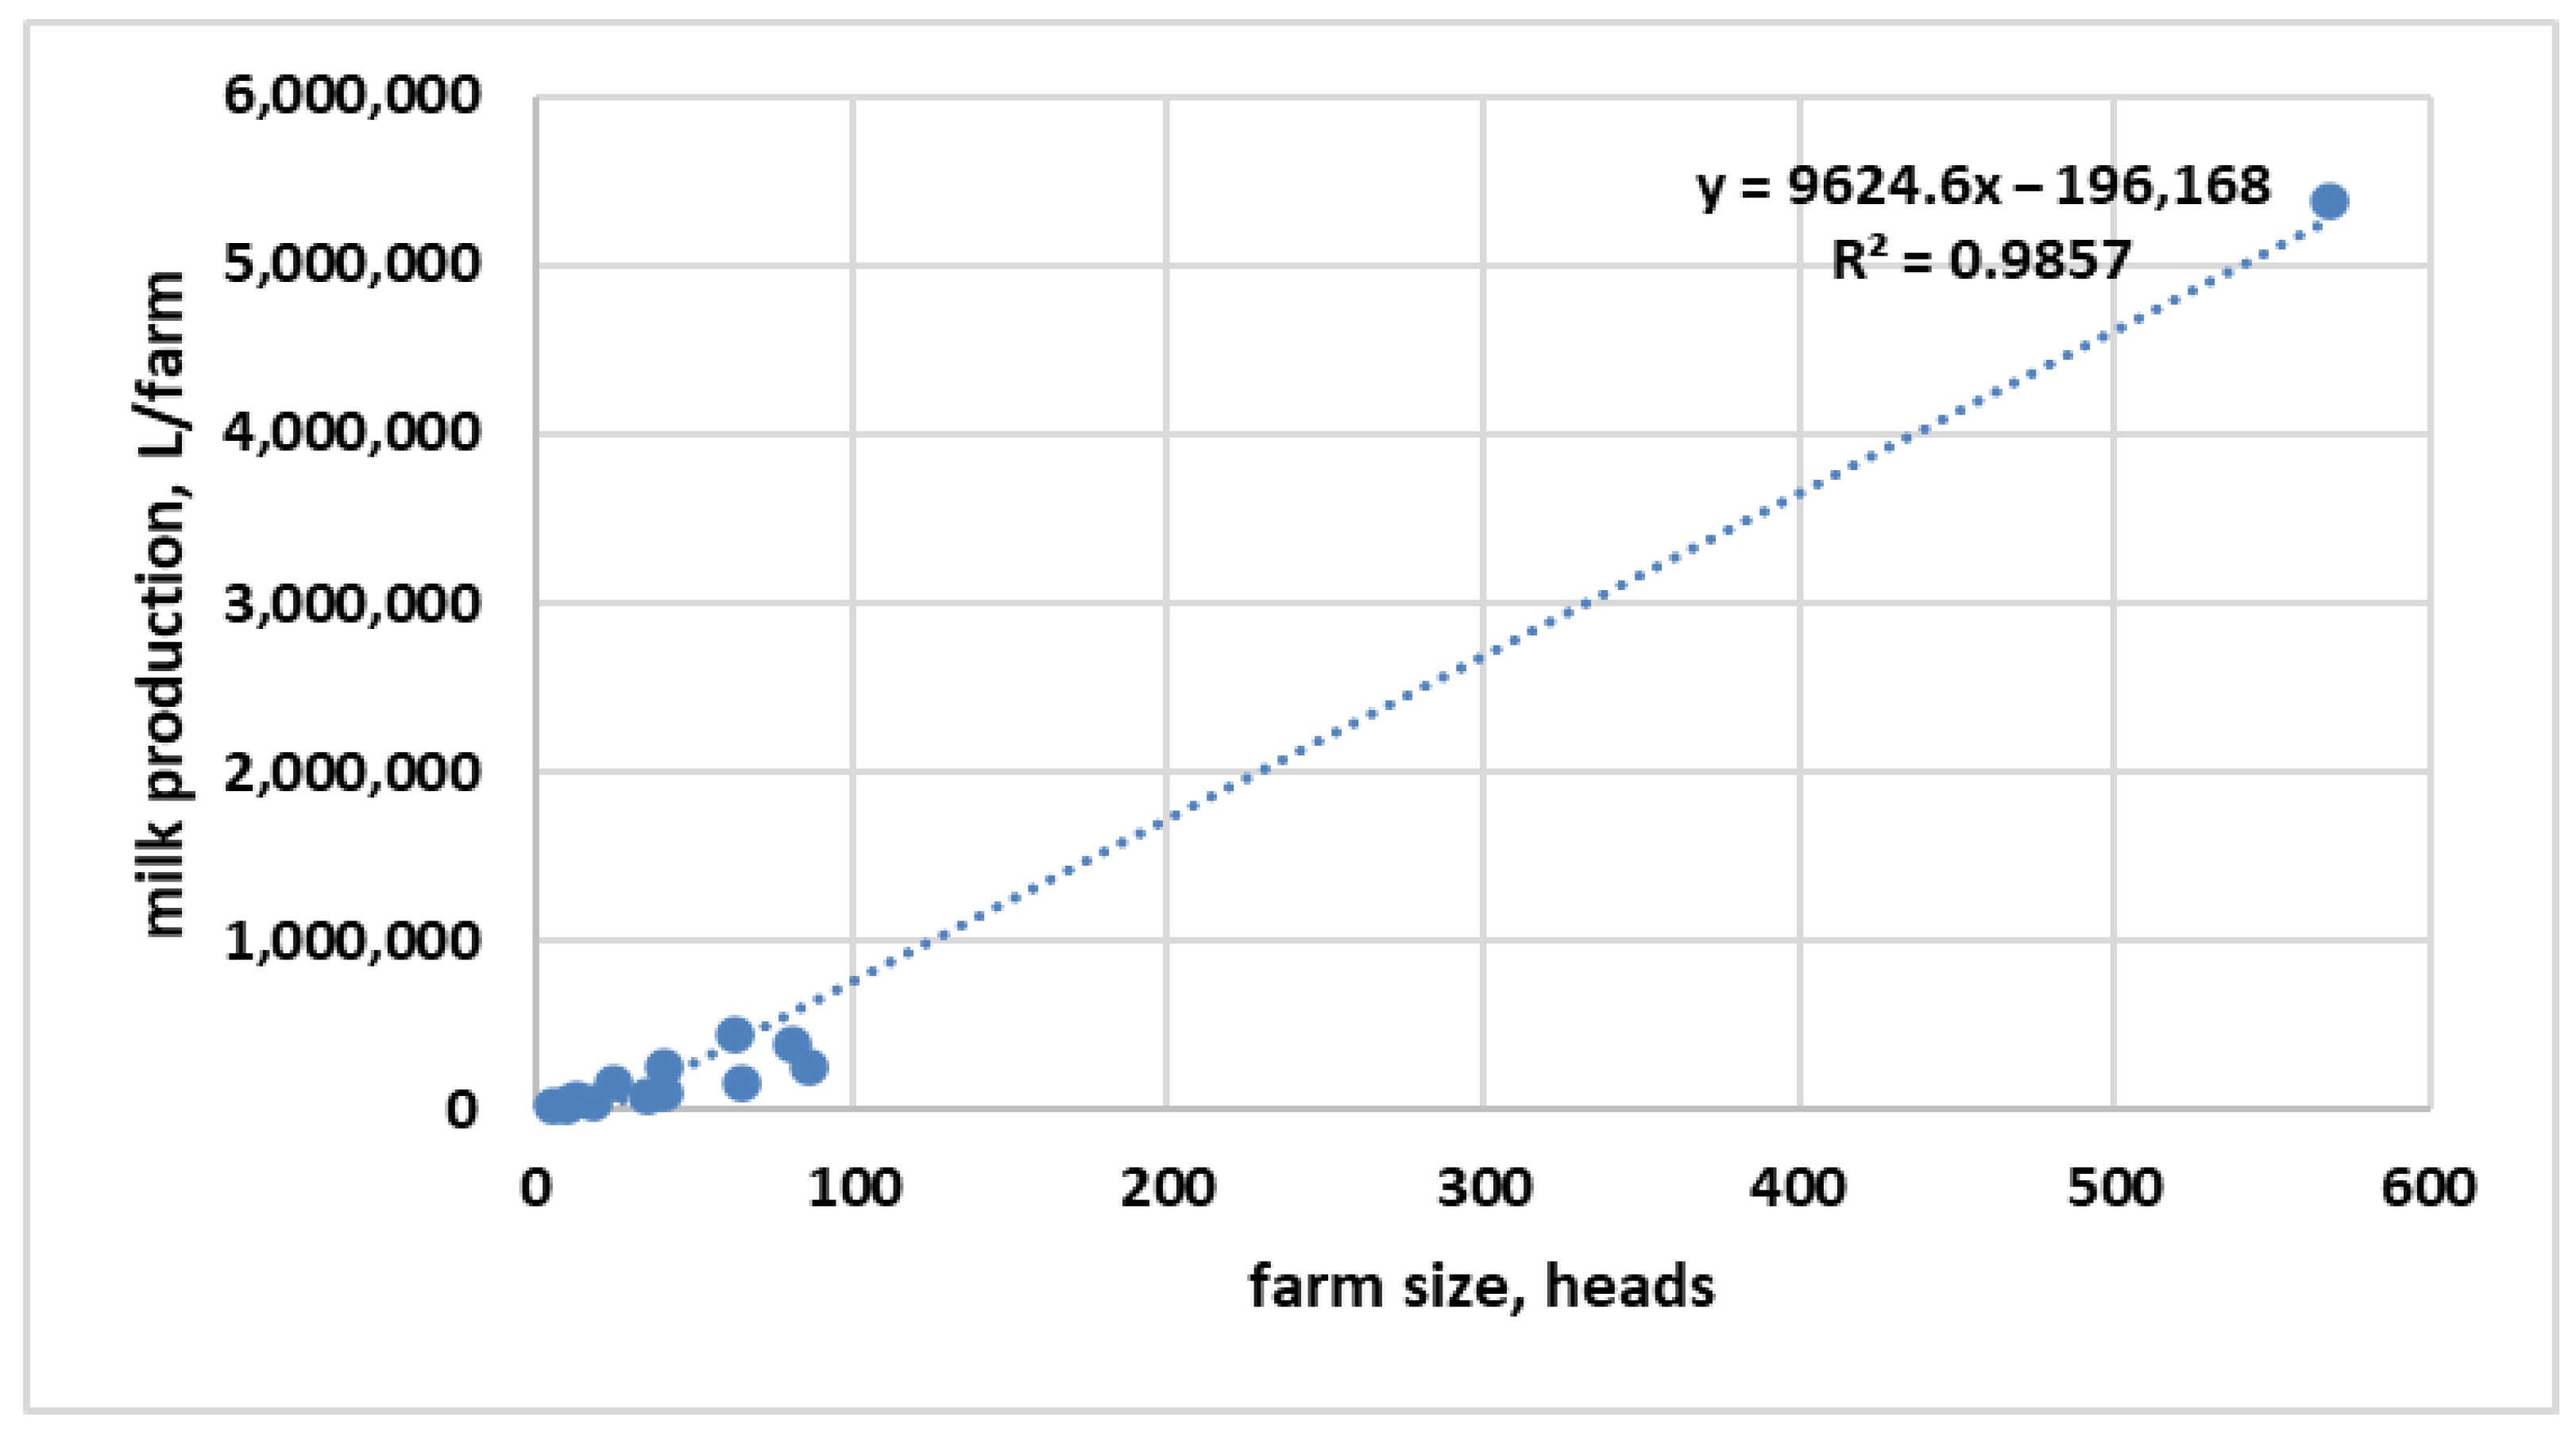
3.3. Correlation of Farm Size with Production, by Landforms

In order to determine the influence that dairy farm size may have on total production, a regression equation can be applied between these two variables, with the farm size being the independent variable and total production as the dependent variable. Thus, following the graphical representation of data and the point cloud, the regression line and the corresponding equation can be identified. This correlation was made for each geographical area included in the case study farms (plain, hill, mountain).
Regarding the influence that the farm size can have on the milk production for the 24 farms located in the plain area, it was observed that the Pearson correlation coefficient between variables was very high, being 0.97, and the coefficient of determination was 0.949 as can be seen from Figure 7. This suggested that the dependent variable (milk production) is explained in a proportion of 94.8% by the independent variable (farm size in the plain area).
Analyzing the regression equation, it can be observed that the value of the independent variable coefficient is 8228.5 units. Thus, it was estimated that at an increase of one unit in the independent variable, the dependent variable will increase by 8228.5 units. In other words, for farms located in the plain area, an increase in the size of the farm by one cow results in an increase in total production by 8228.5 L of milk.
Regarding the influence that the size of the farm can have on the milk production for the 14 farms located in the hill area, it was observed that Pearson correlation coefficient between variables was very high, being 0.99, and the coefficient of determination was 0.986, as can be seen in Figure 8. This suggested that the dependent variable is explained in a proportion of 98.5% by the independent variable.
In the regression equation, the value of the independent variable coefficient was 9624.6 units. It can be estimated that at an increase of one unit in the independent variable, the dependent variable will increase by 9624.6 units. In other words, for the farms in the hilly areas, an increase in the farm size by one cow results in an increase in total production by 9624.6 L of milk.
Regarding the influence that the farm size can have on the milk production for the 16 farms located in the mountain area, it was observed that, between the variables, the Pearson correlation coefficient was very high, 0.99, and the coefficient of determination was 0.987, as can be seen from Figure 9, suggesting that the dependent variable is 98.7% explained by the independent variable.
The regression equation in this situation presented the value of the coefficient of the independent variable of 6137.7 units. This means that at an increase of one unit in the independent variable, the dependent variable will increase by 6137.7 units for this model.
The influence of the main production value on the farm profit level was illustrated using the applications in the TableCurve program, in which a nonlinear regression was used (Figure 10), described by the ideal equation:
y = a + b x + c x 2 l n x + d x l n x + e x 0.5
with 95% confidence limits. The value of the coefficient of determination (r2) was very high, given the objective of the program, namely, to identify the function that passes through most points, so this coefficient was 0.94, and r2 adjusted of 0.93 assumes, in this case, that the dependent variable (profit) is explained by the independent variable (the value of the main production) in a proportion of at least 93%. Such a high coefficient of determination determines a very strong correlation coefficient (r) of 0.969, indicating a strong relation between variables (Figure 10). The value of the statistical parameter Fstat is approximately 194.9, being much higher than the value of the parameter Fcritical, in this case F0.05; 1; 53 being 4.023. Therefore, the null hypothesis of equal means between variables is rejected, the quadratic mean inter-group being higher than the quadratic mean intra-group, and it can be concluded that there is a statistically significant difference between the means of the sample.
The resulting curve illustrated that as the value of the main production increases, so does the size of the farm’s profit. In any agricultural activity, farmers pursue the efficient use of factors of production in order to maximize profits [31,32]. Furthermore, the welfare conditions of cows, associated with a higher level of milk production, are reflected in higher economic margins for the farm [33]. However, technical conditions are not the most important determinant of the level of profitability and price fluctuations also influence farm profits [34]. Prices are the main contributor to income risk, along with the level of milk production [35].
As the net income of the farm is also influenced by its size, the comparison of farms of different sizes can be problematic if this aspect is not taken into account [36]. The influence of farm size on the level of financial results, namely, profit or loss, was described by the ideal equation:
y = a + b x 0.5 + c x + d x 1.5 + e x 2 + f x 2.5 + g x 2.5 + h x 3.5
with 95% confidence limits. The value of the coefficient of determination (r2) was very high, given the objective of the program to identify the function that passes through most points, so this coefficient was 0.867 and r2 adjusted of 0.84, which means, in this case, that the dependent variable (profit) is explained by the independent variable (farm size) in a proportion of at least 84%. Such a high coefficient of determination results in a very strong correlation coefficient (r) of 0.931, which indicates a strong link between the variables.
Yan, J., Chen, C., and Hu, B. (2019) [37] found that the relation between farm size and profit efficiency in agricultural production is illustrated by a U-shaped curve. In the present study, the curve of this equation indicates that the profit of the farm is in a directly proportional relationship to the size of the farm (Figure 11). In fact, large dairy farms have higher economic sustainability. Therefore, they are more likely to operate for medium and long periods of time [38]. However, in the case studies, there were also smaller cow farms which obtained comparable profits to larger farms [39], which indicates that the farm size is not the sole factor in determining the level of profitability.
Ferrazza, R.A., Lopes, M.A., Prado, D.G.O., Lima, R.R., and Bruhn, F.R.P. (2020) [40] concluded that the intensification of activities is the main determinant of economic results, milk production per cow being the most positive indicator correlated with profitability. In addition, the above-mentioned authors pointed out that the profitability of milk production depends in particular on the price of milk, so that it is particularly important to allocate inputs efficiently, thus contributing to the economic sustainability of dairy farms.
Illustrating the correlation between the total milk production of the farm and its profit, the curve of the regression equation alternates two convex segments with two concave segments, but on an ascending path, according to the relation:
y = a + b x 0.5 + c x + d x 1.5 + e x 2 + f x 2.5 + g x + h x 3.5 + i x 4  
with a probability of 95% (Figure 12). The value of the coefficient of determination (r2) was very high, given the objective of the program, namely, to identify the function that passes through most points, so that this coefficient was 0.907 with an r2 adjusted of 0.88, which means, in this case, that the dependent variable is explained by the independent variable in a proportion of at least 88%. Such a high coefficient of determination results in a very close correlation coefficient (r) of 0.952, which indicates a strong link between the variables.
Hadrich, J.C. and Olson, F. (2011) [41] demonstrated that a single indicator may not capture the aspects of farm size and performance and that several indicators should be used. Therefore, studying the concomitant influence of two variables, namely, farm size and total milk production, on the farm profit level, a three-dimensional illustration of the regression equation is obtained as:
z = a + b x + c l n x + d x 2 + e ( l n y ) 2 + f x l n y + g x 3 + h ( l n y ) 3 + i x ( l n y ) 2 + j x 2 l n y
with r2 calculated of 0.92, r2 adjusted of 0.90, and 95% probability, indicating that farm profit increases in direct proportion to farm size and total milk production (Figure 13). The value of the statistical parameter Fstat is approximately 57.86, being much higher than the value of the parameter Fcritical, in this case F0.05; 2; 52 being 3.18. Therefore, the null hypothesis of equal means is rejected and it can be concluded that there is a statistically significant difference between the means of the sample.
The judicious use of production management factors, such as farm size and milk production, has a positive impact on farm profitability [42].
The application of the TableCurve program to highlight the correlation between farm size, unit cost, and profit level produces a three-dimensional illustration of the regression equation:
z = a + b c + c y + d x 2 + e y 2 + f x y + g x 3 + h y 3 + i x y 2 + j x 2 y
with r2 calculated of 0.94, r2 adjusted of 0.93, and 95% probability, indicating that farm profit increases in direct proportion to farm size and is inversely related to unit cost (suggested by the concavity of the graphical representation) (Figure 14). The value of the statistical parameter Fstat is about 80, being much higher than the value of the parameter Fcritical, in this case F0.05; 2; 52 being 3.18. Therefore, the null hypothesis of equal means between variables is rejected, the quadratic mean inter-group being higher than the quadratic mean intra-group. Thus, we conclude that there is a statistically significant difference between the means of the sample.
Lukas Kiefer, Friederike Menzel, and Enno Bahrs (2014) [43] have shown that efficiently managed milk production creates the potential to optimize farm income. The calculation of efficiency in milk production should account for unit costs [44] and their minimizing. Dairy farms need to find ways to ensure that their production cost is lower than the market price of milk, and that the strategy to increase the farm size allows reduction in production costs [45]. It is necessary for farmers to periodically analyze milk production, production costs, and profit in order to identify those favorable factors that may contribute to increasing the profitability of their activities [46]. The exact knowledge of the cost of production by the farmer is a management tool [47]. In terms of unit cost of production, large farms have much lower costs, on average, than smaller farms [48].
The difference in production technology and inputs could be an explanation for the difference in productivity between large and small farms, given the same prices relative to inputs [49]. Studies by Yu Sheng, Alistair Davidson, Keith Fuglie, and Dandan Zhang (2016) [50] show that farmers who respond to changing technologies and prices by replacing different inputs thus gain “income effects”. In order to ensure economic sustainability, managerial effort and technological investment is needed to increase the daily average of milk production without increasing the average variable cost [51]

4. Conclusions

Analyzing from the perspective of profitability, there are rates of return between about −20% and +10%, and in the sample analyzed, thus, it can be concluded that several dairy farms were not profitable in the analyzed period.
The increase in the physical size of the farm, no matter the geographical area, positively influenced the milk production. However, in the mountain area the increase in production was slower than for plain and hill areas.
A graphical representation of the profitability of dairy farms was elaborated. The farms with a low value of main production had a small increase in profit, while when the value of main production increased, the profit growth became slower. Further, as the value of production increases, the curve indicates an exponential evolution of the profit.
In determining the farm’s profit equation based on the farm size, it was found that in the case of small farms, the increase in livestock leads to a relatively small increase in farm profit, and subsequently, once the size of 400–450 cows is exceeded, the increase in numbers will lead to an exponential increase in farm profits.
The statistical analysis that describes the farm profit equation according to the total milk production led to an almost sinusoidal graph, actually formed of several connected Gaussian curves. Therefore, the profit of the farms increased with the increase in production, up to the moment when the increase in production involved a high level of costs to support it, so that the profit turned into a loss when the level of expenses exceeded that of income. Subsequently, the situation replicated, at a higher level of total production and profit, and so on.
The graphical representation of the multiple regression of farm profit indicated that the highest profit values were recorded when the farm size and milk production were as high as possible. This situation is usual for large and very large farms, but it must be pointed out that most farms in this study owned between 5 and 100 cows. Furthermore, most of the small farms had a fairly high unit cost, being in a situation of economic inefficiency, but the highest profit was recorded in terms of a low unit cost and a high physical size of the holding (ideal case, encountered in the case of large and very large holdings). At the same time, there are quite high profits in the case of medium-sized farms with the lowest possible unit costs.

Author Contributions

Conceptualization, R.C. and I.L.P.; methodology, R.C., I.L.P., A.E.C. and E.C.; software, I.L.P. and R.C.; validation, E.C., A.E.C., S.R. and V.D.; formal analysis, I.L.P., R.C., S.R., A.M. and P.A.T.-R.; investigation, S.R., A.M., V.D. and P.A.T.-R.; resources, R.C. and A.M.; data curation, E.C. and A.E.C.; writing—original draft preparation, R.C., I.L.P. and V.D.; writing—review and editing, R.C., I.L.P. and S.R.; visualization, R.C., I.L.P. and S.R.; project administration, R.C. All authors have read and agreed to the published version of the manuscript.

Funding

This research was funded by ADER 24.1.2. project: “Research on the economic efficiency of raising sheep, goats, dairy cows, cattle and buffalos”.

Institutional Review Board Statement

This study did not require ethical approval.

Informed Consent Statement

Not applicable.

Data Availability Statement

The data presented in this study are available on request from the corresponding author. The data are not publicly available due to privacy.

Conflicts of Interest

The authors declare no conflict of interest.

References

  1. Spicka, J.; Smutka, L. The Technical Efficiency of Specialised Milk Farms: A Regional View. Sci. World J. 2014, 2014, 985149. [Google Scholar] [CrossRef] [PubMed] [Green Version]
  2. Kingwell, R. Managing complexity in modern farming. Aust. J. Agric. Resour. Econ. 2011, 55, 12–34. [Google Scholar] [CrossRef]
  3. Bragg, L.; Dalton, T. Factors Affecting the Decision to Exit Dairy Farming: A Two-Stage Regression Analysis. J. Dairy Sci. 2004, 87, 3092–3098. [Google Scholar] [CrossRef]
  4. Xie, H.; Huang, Y.; Chen, Q.; Zhang, Y.; Wu, Q. Prospects for Agricultural Sustainable Intensification: A Review of Research. Land 2019, 8, 157. [Google Scholar] [CrossRef] [Green Version]
  5. Tey, Y.S.; Brindal, M. Factors Influencing Farm Profitability. In Sustainable Agriculture Reviews; Lichtfouse, E., Ed.; Springer: Cham, Switzerland, 2015; Volume 15. [Google Scholar] [CrossRef]
  6. Bewley, J. Precision Dairy Farming: Advanced Analysis Solutions for Future Profitability. The First North American Conference on Precision Dairy Management. 2010. Available online: https://www.researchgate.net/profile/Jeffrey-Bewley/publication/267711814_Precision_Dairy_Farming_Advanced_Analysis_Solutions_for_Future_Profitability/links/582f650f08ae138f1c0356cd/Precision-Dairy-Farming-Advanced-Analysis-Solutions-for-Future-Profitability.pdf (accessed on 18 April 2022).
  7. Hansson, H.; Ferguson, R. Factors influencing the strategic decision to further develop dairy production—A study of farmers in central Sweden. Livest. Sci. 2011, 135, 110–123. [Google Scholar] [CrossRef]
  8. Ramsbottom, G.; Horan, B.; Berry, D.; Roche, J. Factors associated with the financial performance of spring-calving, pasture-based dairy farms. J. Dairy Sci. 2015, 98, 3526–3540. [Google Scholar] [CrossRef] [Green Version]
  9. Bozoglu, M.; Saglam, O.; Topuz, B.K. Economic sustainability of family dairy farming within the scope of technical efficiency: A case study of Bafra District, Turkey. Custos E Agronegocio 2017, 13, 295–316. [Google Scholar]
  10. Bijl, R.; Kooistra, S.R.; Hogeveen, H. The Profitability of Automatic Milking on Dutch Dairy Farms. J. Dairy Sci. 2007, 90, 239–248. [Google Scholar] [CrossRef]
  11. Stott, A.; DeLorenzo, M. Factors Influencing Profitability of Jersey and Holstein Lactations1. J. Dairy Sci. 1988, 71, 2753–2766. [Google Scholar] [CrossRef]
  12. Battaglini, L.; Bovolenta, S.; Gusmeroli, F.; Salvador, S.; Sturaro, E. Environmental Sustainability of Alpine Livestock Farms. Ital. J. Anim. Sci. 2014, 13, 3155. [Google Scholar] [CrossRef]
  13. Macdonald, K.; Beca, D.; Penno, J.; Lancaster, J.; Roche, J. Short communication: Effect of stocking rate on the economics of pasture-based dairy farms. J. Dairy Sci. 2011, 94, 2581–2586. [Google Scholar] [CrossRef] [PubMed]
  14. Gál, T. Efficiency analysis of dairy farms in the Northern Great Plain region using deterministic and stochastic DEA models. Appl. Stud. Agribus. Commer. 2012, 6, 113–122. [Google Scholar] [CrossRef]
  15. Kryszak, Ł.; Guth, M.; Czyżewski, B. Determinants of farm profitability in the EU regions. Does farm size matter? Agric. Econ.–Czech 2021, 67, 90–100. [Google Scholar] [CrossRef]
  16. Lovarelli, D.; Bava, L.; Zucali, M.; D’Imporzano, G.; Adani, F.; Tamburini, A.; Sandrucci, A. Improvements to dairy farms for environmental sustainability in Grana Padano and Parmigiano Reggiano production systems. Ital. J. Anim. Sci. 2019, 18, 1035–1048. [Google Scholar] [CrossRef] [Green Version]
  17. Dervillé, M.; Allaire, G. Change of competition regime and regional innovative capacities: Evidence from dairy restructuring in France. Food Policy 2014, 49, 347–360. [Google Scholar] [CrossRef]
  18. Fadul-Pacheco, L.; Wattiaux, M.A.; Espinoza-Ortega, A.; Sánchez-Vera, E.; Arriaga-Jordán, C.M. Arriaga-Jordán, Evaluation of Sustainability of Smallholder Dairy Production Systems in the Highlands of Mexico During the Rainy Season. Agroecol. Sustain. Food Syst. 2013, 37, 882–901. [Google Scholar] [CrossRef]
  19. Atzori, A.; Tedeschi, L.; Cannas, A. A multivariate and stochastic approach to identify key variables to rank dairy farms on profitability. J. Dairy Sci. 2013, 96, 3378–3387. [Google Scholar] [CrossRef]
  20. Gandini, G.; Maltecca, C.; Pizzi, F.; Bagnato, A.; Rizzi, R.M. Comparing Local and Commercial Breeds on Functional Traits and Profitability: The Case of Reggiana Dairy Cattle. J. Dairy Sci. 2007, 90, 2004–2011. [Google Scholar] [CrossRef]
  21. Erba, E.; Aplin, R. Factors Affecting Labor Productivity and Cost per Gallon in Fluid Milk Plants. J. Dairy Sci. 1996, 79, 1304–1312. [Google Scholar] [CrossRef]
  22. Salter, A. Improving the sustainability of global meat and milk production. Proc. Nutr. Soc. 2017, 76, 22–27. [Google Scholar] [CrossRef] [Green Version]
  23. Spicka, J.; Hlavsa, T.; Soukupova, K.; Stolbova, M. Approaches to estimation the farm-level economic viability and sustainability in agriculture: A literature review. Agric. Econ. 2019, 65, 289–297. [Google Scholar] [CrossRef] [Green Version]
  24. Griffith, K.; Zepeda, L. Farm level trade-offs of intensifying tropical milk production. Ecol. Econ. 1994, 9, 121–133. [Google Scholar] [CrossRef]
  25. van der Meulen, H.A.B.; Dolman, M.A.; Jager, J.H.; Venema, G.S. The impact of farm size on sustainability of dutch dairy farms. Int. J. Agric. Manag. 2014, 3, 119–123. [Google Scholar] [CrossRef]
  26. Phochanikorn, P.; Tan, C. A New Extension to a Multi-Criteria Decision-Making Model for Sustainable Supplier Selection under an Intuitionistic Fuzzy Environment. Sustainability 2019, 11, 5413. [Google Scholar] [CrossRef] [Green Version]
  27. Cheng, S.; Zheng, Z.; Henneberry, S. Farm size and use of inputs: Explanations for the inverse productivity relationship. China Agric. Econ. Rev. 2019, 11, 336–354. [Google Scholar] [CrossRef]
  28. Baležentis, T.; Galnaitytė, A.; Kriščiukaitienė, I.; Namiotko, V.; Novickytė, L.; Streimikiene, D.; Melnikiene, R. Decomposing Dynamics in the Farm Profitability: An Application of Index Decomposition Analysis to Lithuanian FADN Sample. Sustainability 2019, 11, 2861. [Google Scholar] [CrossRef] [Green Version]
  29. Hanrahan, L.; McHugh, N.; Hennessy, T.; Moran, B.; Kearney, R.; Wallace, M.; Shalloo, L. Factors associated with profitability in pasture-based systems of milk production. J. Dairy Sci. 2018, 101, 5474–5485. [Google Scholar] [CrossRef] [PubMed] [Green Version]
  30. Tapki, N. The comparison of dairy farms in different scales regarding milk production cost and profitability in Turkey: A case study from Hatay province. Custos E@ Gronegócio Line 2019, 15, 48–62. Available online: https://www.custoseagronegocioonline.com.br/numero2v15/OK%203%20cost.pdf (accessed on 19 April 2022).
  31. Diakité, Z.; Corson, M.; Brunschwig, G.; Baumont, R.; Mosnier, C. Profit stability of mixed dairy and beef production systems of the mountain area of southern Auvergne (France) in the face of price variations: Bioeconomic simulation. Agric. Syst. 2019, 171, 126–134. [Google Scholar] [CrossRef]
  32. Lawson, L.; Bruun, J.; Coelli, T.; Agger, J.; Lund, M. Relationships of Efficiency to Reproductive Disorders in Danish Milk Production: A Stochastic Frontier Analysis. J. Dairy Sci. 2004, 87, 212–224. [Google Scholar] [CrossRef]
  33. Villettaz, R.M.; Rushen, J.; De Passillé, A.M.; Vasseur, E.; Orsel, K.; Pellerin, D. Associations between on-farm animal welfare indicators and productivity and profitability on Canadian dairies: I. On freestall farms. J. Dairy Sci. 2019, 102, 4341–4351. [Google Scholar] [CrossRef] [PubMed]
  34. Zakova Kroupova, Z. Profitability development of Czech dairy farms. Agric. Econ. 2016, 62, 269–279. [Google Scholar] [CrossRef] [Green Version]
  35. El Benni, N.; Finger, R. Gross revenue risk in Swiss dairy farming. J. Dairy Sci. 2013, 96, 936–948. [Google Scholar] [CrossRef] [PubMed]
  36. Gloy, B.; Tauer, L.; Knoblauch, W. Profitability of Grazing Versus Mechanical Forage Harvesting on New York Dairy Farms. J. Dairy Sci. 2002, 85, 2215–2222. [Google Scholar] [CrossRef]
  37. Yan, J.; Chen, C.; Hu, B. Farm size and production efficiency in Chinese agriculture: Output and profit. China Agric. Econ. Rev. 2019, 11, 20–38. [Google Scholar] [CrossRef]
  38. Bánkuti, F.I.; Prizon, R.C.; Damasceno, J.C.; De Brito, M.M.; Pozza, M.S.S.; Lima, P.G.L. Farmers’ actions toward sustainability: A typology of dairy farms according to sustainability indicators. Animal 2020, 14, s417–s423. [Google Scholar] [CrossRef]
  39. Hanson, G.D.; Cunningham, L.C.; Morehart, M.J.; Parsons, R.L. Profitability of Moderate Intensive Grazing of Dairy Cows in the Northeast. J. Dairy Sci. 1998, 81, 821–829. [Google Scholar] [CrossRef]
  40. Ferrazza, R.D.A.; Lopes, M.A.; Prado, D.G.D.O.; De Lima, R.R.; Bruhn, F.R.P. Association between technical and economic performance indexes and dairy farm profitability. Rev. Bras. Zootec. 2020, 49, e20180116. [Google Scholar] [CrossRef] [Green Version]
  41. Hadrich, J.C.; Olson, F. Joint measurement of farm size and farm performance: A confirmatory factor analysis. Agric. Financ. Rev. 2011, 71, 295–309. [Google Scholar] [CrossRef]
  42. Gloy, B.; Hyde, J.; LaDue, E. Dairy Farm Management and Long-Term Farm Financial Performance. Agric. Resour. Econ. Rev. 2002, 31, 233–247. [Google Scholar] [CrossRef] [Green Version]
  43. Kiefer, L.; Menzel, F.; Bahrs, E. The effect of feed demand on greenhouse gas emissions and farm profitability for organic and conventional dairy farms. J. Dairy Sci. 2014, 97, 7564–7574. [Google Scholar] [CrossRef] [PubMed] [Green Version]
  44. Michaličková, M.; Krupová, Z.; Polák, P.; Hetényi, L.; Krupa, E. Development of competitiveness and its determinants in Slovak dairy farms. Agric. Econ.–Czech 2014, 60, 82–88. [Google Scholar] [CrossRef] [Green Version]
  45. Hemme, T.; Uddin, M.M.; Ndambi, O.A. Benchmarking cost of milk production in 46 countries. J. Rev. Glob. Econ. 2014, 3, 254–270. [Google Scholar]
  46. Popescu, A. Research on profit variation depending on marketed milk and production cost in dairy farming. Sci. Pap. Ser. Manag. Econ. Eng. Agric. Rural Dev. 2014, 14, 223–230. [Google Scholar]
  47. Camilo Neto, M.; Campos, J.M.D.S.; Oliveira, A.S.D.; Gomes, S.T. Identification and quantification of benchmarks of milk production systems in Minas Gerais. Rev. Bras. Zootec. 2012, 41, 2279–2288. [Google Scholar] [CrossRef] [Green Version]
  48. MacDonald, J.M.; McBride, W.D.; O’Donoghue, E.; Nehring, R.F.; Sandretto, C.; Mosheim, R. Profits, Costs, and the Changing Structure of Dairy Farming. USDA-ERS Econ. Res. Rep. 2007, 47, 3. Available online: https://ssrn.com/abstract=1084458 (accessed on 20 April 2022). [CrossRef] [Green Version]
  49. Sheng, Y.; Zhao, S.; Nossal, K.; Zhang, D. Productivity and farm size in Australian agriculture: Reinvestigating the returns to scale. Aust. J. Agric. Resour. Econ. 2014, 59, 16–38. [Google Scholar] [CrossRef]
  50. Sheng, Y.; Davidson, A.; Fuglie, K.; Zhang, D. Input Substitution, Productivity Performanceand Farm Size. Aust. J. Agric. Resour. Econ. 2016, 60, 327–347. [Google Scholar] [CrossRef] [Green Version]
  51. Pelegrini, D.F.; Lopes, M.A.; Demeu, F.A.; Rocha, Á.G.F.; Bruhn, F.R.P.; Casas, P.S. Effect of socioeconomic factors on the yields of family-operated milk production systems. Semin. Ciências Agrárias 2019, 40, 1199–1214. [Google Scholar] [CrossRef] [Green Version]
Figure 1. Milk production from case studies, by counties. Source: authors’ illustration, using map chart on geographical regions in Excel.
Sustainability 14 07466 g001
Figure 2. Distribution of the physical size of dairy farms. Source: authors’ own elaboration.
Sustainability 14 07466 g002
Figure 3. Clustering the size of farms in the sample.
Sustainability 14 07466 g003
Figure 4. Farm size in the case studies. Source: authors’ own elaboration.
Sustainability 14 07466 g004
Figure 5. Expenditure structure according to the minimum, maximum, and average size of the farm. Source: authors’ own elaboration.
Sustainability 14 07466 g005
Figure 6. Determining the economic sustainability of farms based on costs and the value of production. Source: authors’ own elaboration.
Sustainability 14 07466 g006
Figure 7. The correlation between farm size and total production for the 24 farms located in the plain area Source: authors’ own elaboration.
Sustainability 14 07466 g007
Figure 8. The correlation between farm size and total production for the 14 farms located in the hill area. Source: authors’ own elaboration.
Sustainability 14 07466 g008
Figure 9. The correlation between farm size and total production for 16 farms located in the mountain area. Source: authors’ own elaboration.
Sustainability 14 07466 g009
Figure 10. The equation of the value of main production influence on the level of farm profit. Source: authors’ own elaboration.
Sustainability 14 07466 g010
Figure 11. The equation of the influence of farm size on the level of profit. Source: authors’ own elaboration.
Sustainability 14 07466 g011
Figure 12. The equation of the influence of total milk production on the level of profit. Source: authors’ own elaboration.
Sustainability 14 07466 g012
Figure 13. The equation of the influence of farm size and total milk production on the level of profit. Source: authors’ own elaboration.
Sustainability 14 07466 g013
Figure 14. The equation of the influence of farm size and unit cost on the level of profit. Source: authors’ own elaboration.
Sustainability 14 07466 g014
Table 1. Determination of descriptive statistical indicators for farm size.
Farm Size
Mean73.44444
Standard Error17.71771
Median24.5
Mode18.66667
Standard Deviation130.1981
Sample Variance16,951.53
Kurtosis6.98522
Skewness2.81767
Range563.3333
Minimum5
Maximum568.3333
Sum3966
Count54
Source: authors’ own elaboration.
Table 2. Determining the averages of technical–economic indicators.
SpecificationUnitAvrgStandard
Deviation
Farm sizecows73.44130.2
Average productionL/cow4554.941809.3
Value of main productionUSD/L0.380.12
Costs for the main productionUSD/L0.370.10
Variable costsUSD/L0.320.05
Material costsUSD/L0.300.05
Fixed costsUSD/L0.100.05
Labor costsUSD/L0.080.05
Labor productivity in physical expressionMan-hours/L0.060.0
Labor productivity in value expressionUSD/man-hours10.5210.96
Labor costs at 1000 RON total productionUSD48.0821.35
Material costs at 1000 RON total productionUSD178.1223.37
Expenses per 1000 RON main productionUSD243.2824.20
Profit or loss per unit of productUSD0.000.05
Taxable income rate%0.210.0
Net income rate%−0.19.4
Profitability threshold in value unitsUSD1937.84761.98
Profitability threshold in physical unitsL55063048.7
Exploitation risk rate%146.6132.7
Security index −0.51.3
Source: authors’ own elaboration. Note: AVRG—average, L—liter.
Publisher’s Note: MDPI stays neutral with regard to jurisdictional claims in published maps and institutional affiliations.

