Abstract
With the development of animal husbandry, environmental pollution caused by livestock and poultry breeding (LPB) has become a major problem faced by environmental protection departments. In response to this problem, this study established a spatial suitability evaluation system for LPB. According to the particularity of the indicators, there is a nonlinear relationship after quantification and not all elements in the matrix presented by the indexes and evaluation units have an ‘order’ relationship. Therefore, this study selects a method of combining a self-organising map network. The Hasse diagram technique and geographic information system were used to evaluate the suitability of LPB. Practical application research was conducted in Wangkui County. Most regions of Wangkui County are unsuitable for LPB, accounting for 81.23% of the total area of the county. A small part of a suitable region (434.76 km2) was determined to be a potential site for LPB. According to the results of suitable breeding regions, 17 existing large-scale livestock and poultry farms (LPFs) with unreasonable distribution were optimised for space, which are located in an urban construction area. Spatial optimisation was performed using GIS buffer and overlay analyses, providing the best relocation plot for these 17 LPFs. The results provide a scientific basis for the utilisation of livestock manure and spatial layout planning for LPB.
1. Introduction
With the increase in the population and the improvement of living standards, consumption structure has also changed and the consumption of livestock and poultry products has continued to increase [1,2,3]. Improving the efficiency of agricultural production without harming the environment and adapting to these changes is a universal requirement for all nations to be able to achieve sustainable agricultural development [4]. To fulfil the growing demand for livestock and poultry products, the number of livestock and poultry farms (LPFs) has increased rapidly [2,5]. Most LPFs do not have an efficient manure disposal system, which inevitably leads to environmental problems [6,7]. Affected by water sources and transport costs, many LPFs are distributed on the banks of rivers and in rural and urban residential areas, causing water pollution and deterioration of residents’ environment [8]. In the livestock and poultry breeding (LPB) industry, a reasonable spatial distribution of LPFs is essential for government management and risk response [9]. Since 2017, with the implementation of the livestock and poultry prohibition zone policy, the areas that are suitable for raising livestock and poultry and to the manner of choosing a new site for demolition and relocation of unreasonable LPFs have been unclear due to insufficient information from the relevant management departments. Therefore, evaluating spatial suitability of the LPB and optimising LPFs with an unreasonable spatial distribution is necessary. LPB should be well-coordinated with individuals’ living environment to develop the LPB industry and simultaneously and integrally maximise social, ecological, and economic benefits [6].
Assessment indexes for the suitability of LPB should be comprehensively measured in three aspects: social, economic, and environmental [5]. Because the volume of livestock manure is much larger than that of chemical fertilisers under the same nitrogen content, transport difficulties occur [10,11]. Even long-distance transport costs can outweigh the value of manure; thus, using livestock manure as fertiliser on nearby farmlands is often recommended [12]. Therefore, traffic accessibility and the degree of manure demand of farmland are the influencing factors that restrict the matching of the best area for each LPF to ensure the economical utilisation of livestock and poultry manure [6,13]. The use of manure on farmland is an effective means for reducing the risk of livestock manure contaminating the environment [14,15]. If the amount of nitrogen applied to livestock manure exceeds the carrying capacity of the farmland, the excess nitrogen in livestock manure pollutes the environment [6,16]. Thus, the ability to scientifically and effectively estimate the regional carrying capacity for the LPF is vital [17]. Yang et al. proposed the nitrogen loading method for livestock and poultry manure in farmland as the main reference environmental indicators for suitability assessment [6,14,16,18,19]. Other environmental indicators in other studies are, for example, the distance from residential areas, protected areas, and water bodies. Land type is considered as the main influence on this social aspect [5,6,12,19]. In the literature, multi-indicator suitability evaluation has mostly been secondary to using the Delphi method, analytic hierarchy process (AHP), and the multi-criteria evaluation method combined with GIS to conduct spatial analysis of the study area according to administrative regions, plots, or multiple grids [6,13,19,20].
Notably, in analysing the nitrogen load index of livestock and poultry polluted manure, when LPFs are concentrated in a certain area, the best matched farmland may overlap, and the average distribution method may underestimate the risk of livestock and poultry manure nitrogen load. In addition, the supply of manure (Sj) may be greater than the nutrient demand (Qj) of farmland within the effective supply range. When Sj/Qj > 1, this part of the area participates in the evaluation according to a quantitative value greater than 1, and it may overestimate the unsuitability grade in this area and its surrounding area. Many indices are related to the distance in the evaluation index system. In the literature, the study area was divided into evaluation units according to administrative regions, plots, or grids. The evaluation units were affected by different shapes and sizes or large differences in the distance from the centre point to the side length, which may lead to large evaluation errors and reduced accuracy. As a result, small-area plots suitable for the LPB were ignored.
To overcome the aforementioned problems, this research established a suitability evaluation index system that considers livestock and poultry carrying capacity, livestock and poultry density, distance factors, land type, and natural conditions. In the analysis of livestock and poultry carrying capacity, a set of allocation principles and methods were established to reduce the error of risk underestimation caused by the overlap of the best matched farmland. The maximum value of the soil nutrient demand degree (Sj/Qj) within the effective supply range was set to one and the part exceeding one only proposed control suggestions for the breeding scale and did not affect the suitability of areas outside the effective supply range. Because the index system contains multiple distance-related indexes, the study area was divided into several hexagonal evaluation units with a side length of 200 m to decrease the distance error and improve the evaluation accuracy. Due to the particularity of the indicators, there is a nonlinear relationship after quantification and not all elements in the matrix presented by the indexes and evaluation units have an ‘order’ relationship. Therefore, this study’s method combined the self-organising mapping network (SOM; a nonlinear mapping technique), the Hasse diagram technique (HDT; based on partially ordered sets), and the geographic information system (GIS; spatial analysis technology) to evaluate the suitability of LPB.
2. Materials and Methods
2.1. Study Area
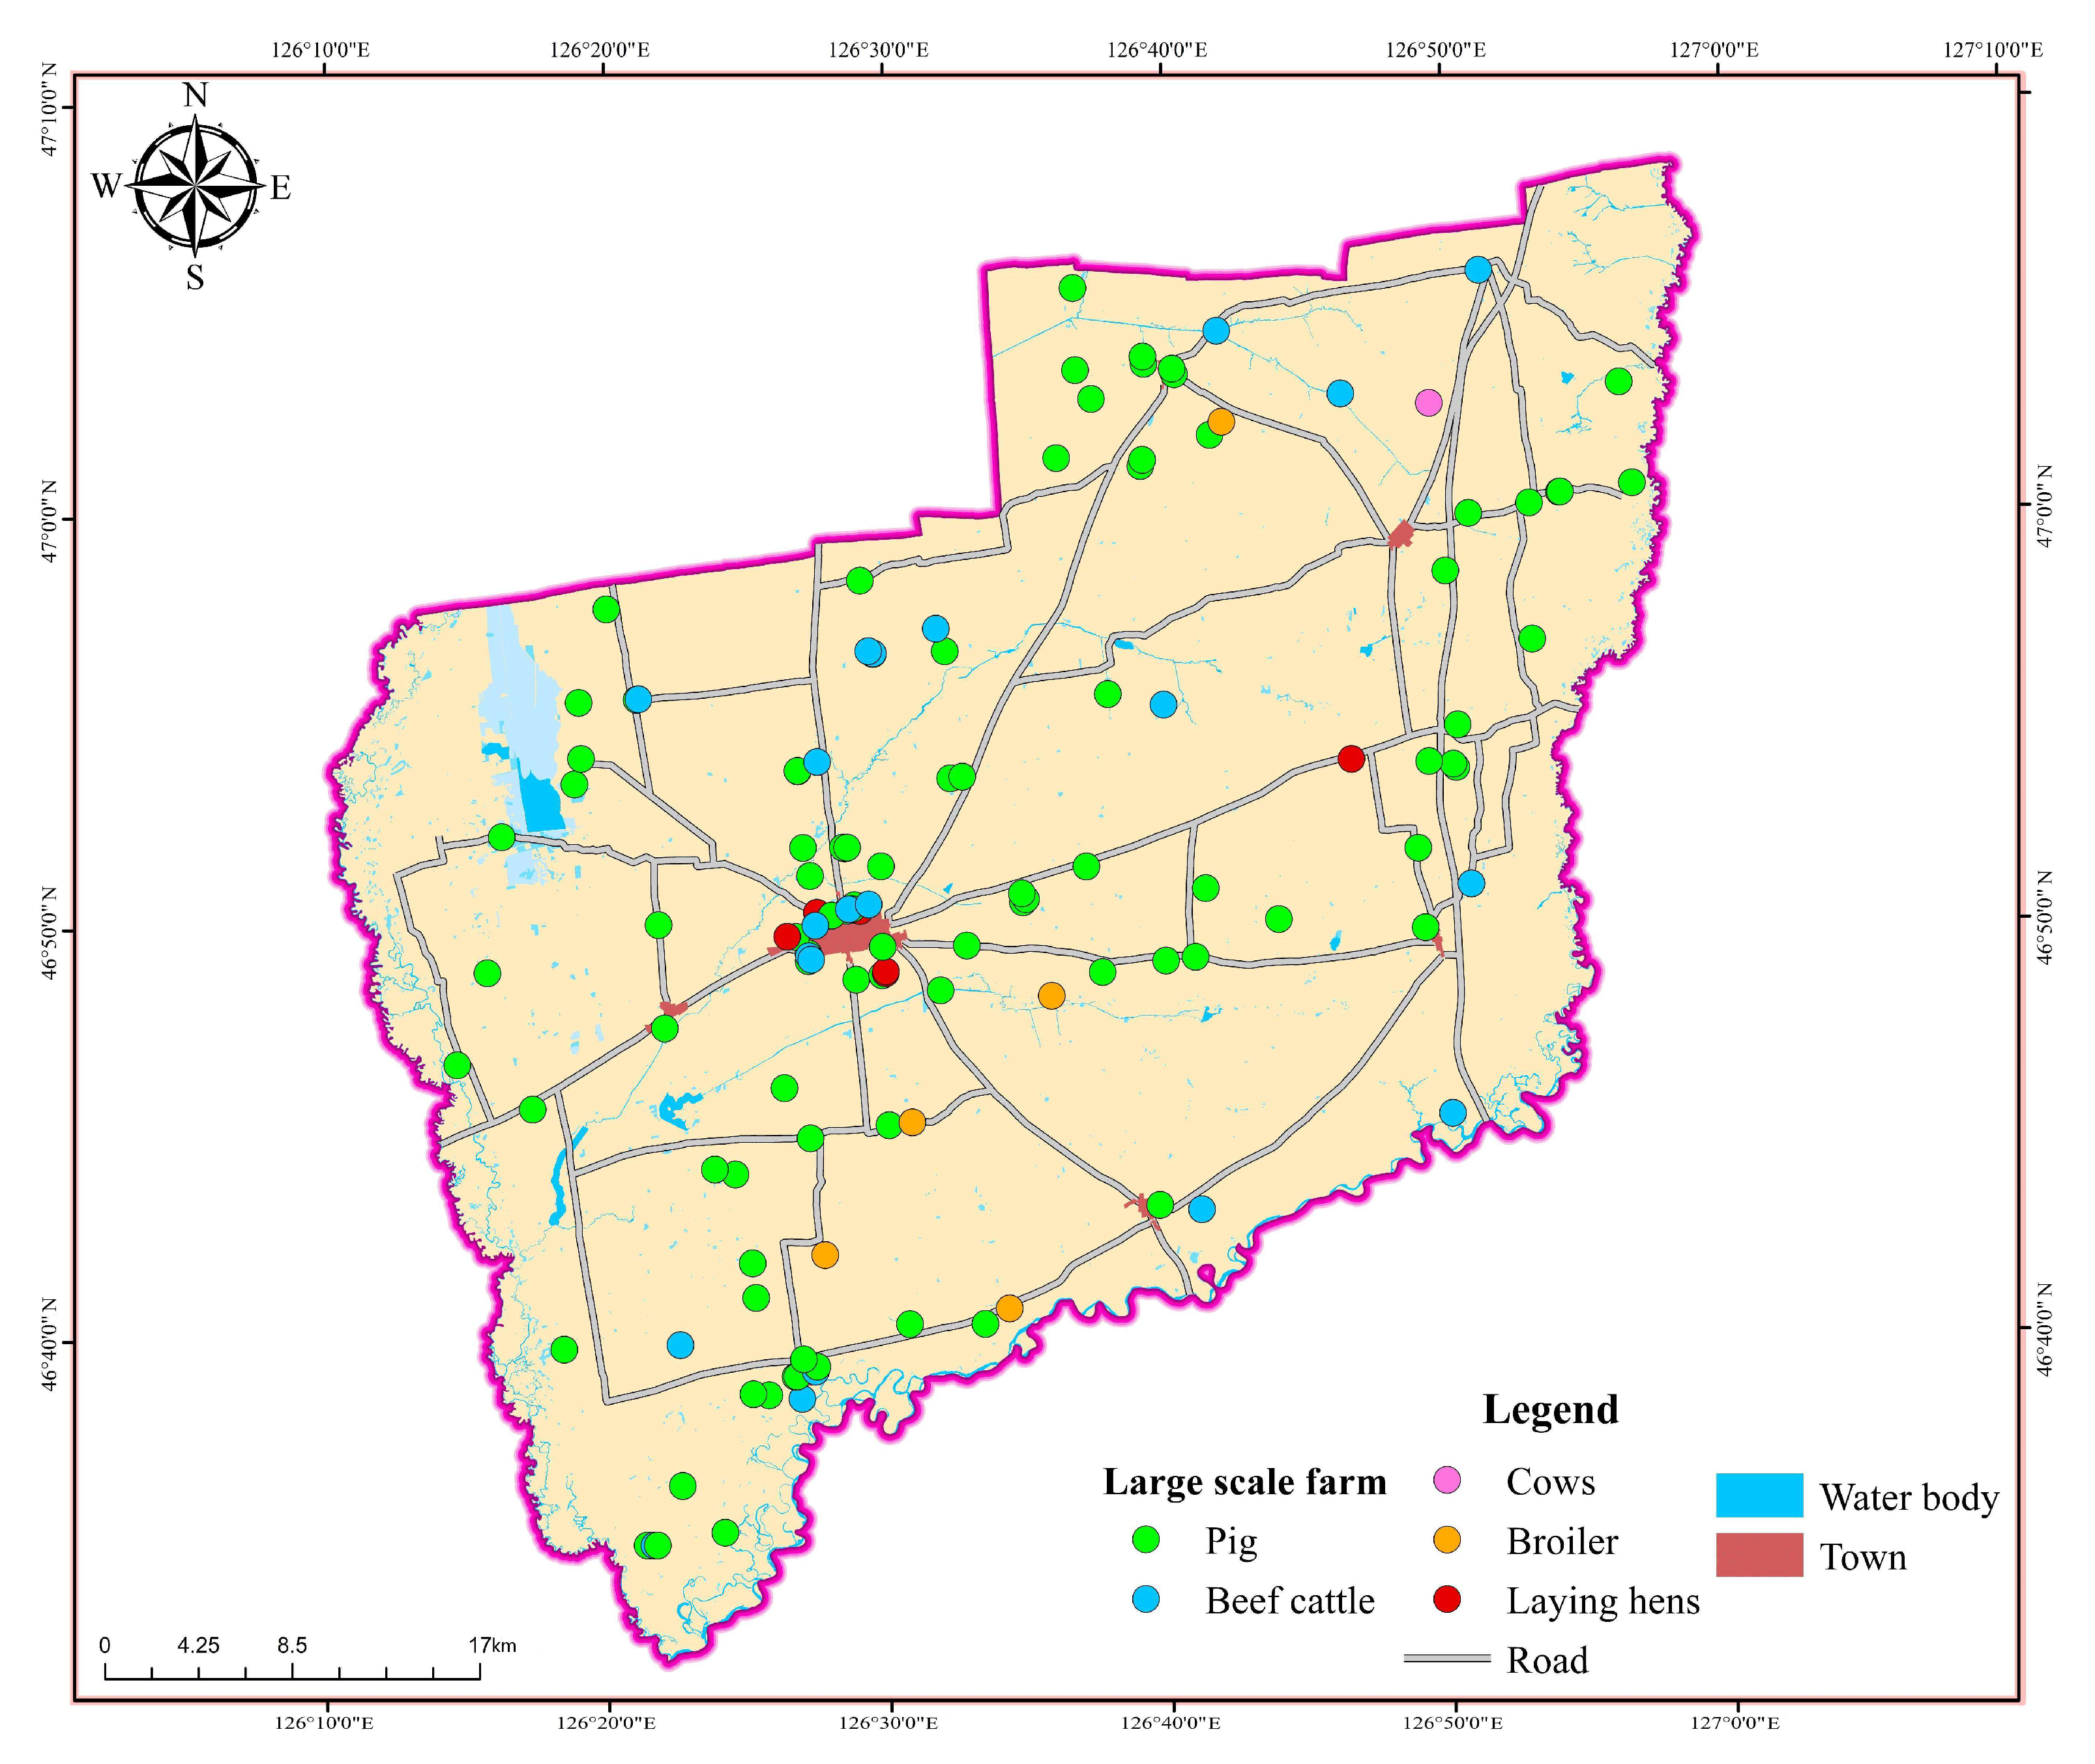
Wangkui County is located in the central part of Heilongjiang Province, in the western part of Suihua City, in the transition zone between the Songnen Plain, and at the southwestern edge of the Xiaoxing’an Mountains. The geographical location of Wangkui County is shown in Figure 1. The county comprises 10 towns, 3 townships, and 2 ethnic townships, covering an area of 2316 km2, with a resident population of 286,848. Wangkui County is in a continental semi-humid monsoon climate zone in the northern temperate zone. The main rivers in the territory are the Hulan, Tongken, and Keyin Rivers. The reservoirs are, for example, Weixing, Hongqi, Xianfeng, and Shantoulu. Wangkui County has fertile arable land. It is a national commodity grain production base county and a large grain-producing county in China. It is rich in corn, soybeans, rice, and other grains. The livestock industry is well-developed and this county is known as the hometown of lean pigs in China. The principal types of livestock and poultry farming are pigs, beef cattle, broilers, and laying hens. One hundred and thirty large-scale LPFs exist in the county. The spatial distribution of the LPFs is presented in Figure 2. With the rapid development of the LPB industry, the contradictions between livestock and poultry pollution, human settlements, and ecological protection have become increasingly prominent.
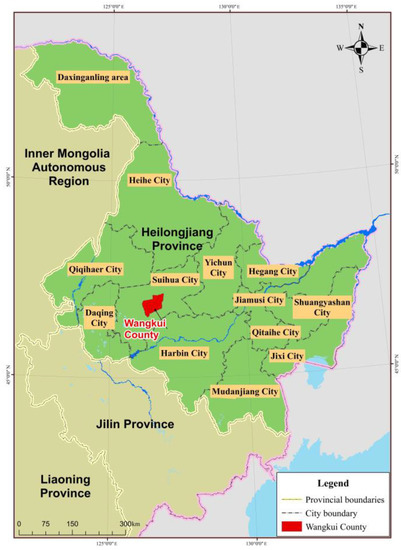
Figure 1.
Geographical location of Wangkui County in Heilongjiang Province, China.
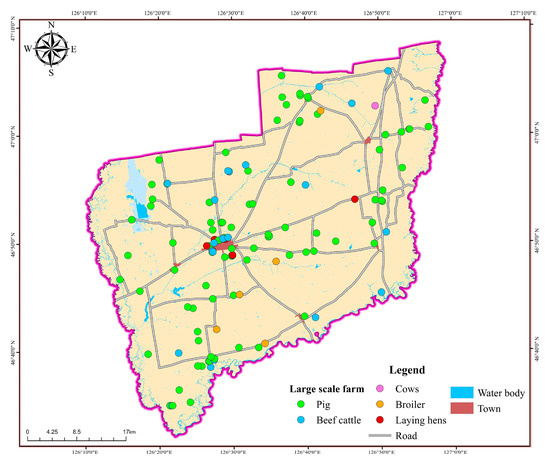
Figure 2.
Spatial distribution of large-scale LPFs.
2.2. Data Source and Collection
The basic geographic information data, such as the digital elevation model (DEM), land use, roads, rivers, towns, markets, and administrative divisions, used throughout this article are from the geographic information sharing data platform; the data for large-scale LPFs, nature reserves, and water sources were obtained from local authorities and soil texture data were obtained from the World Soil Database.
2.3. Spatial Suitability Evaluation Modelling
2.3.1. Evaluation Unit Division
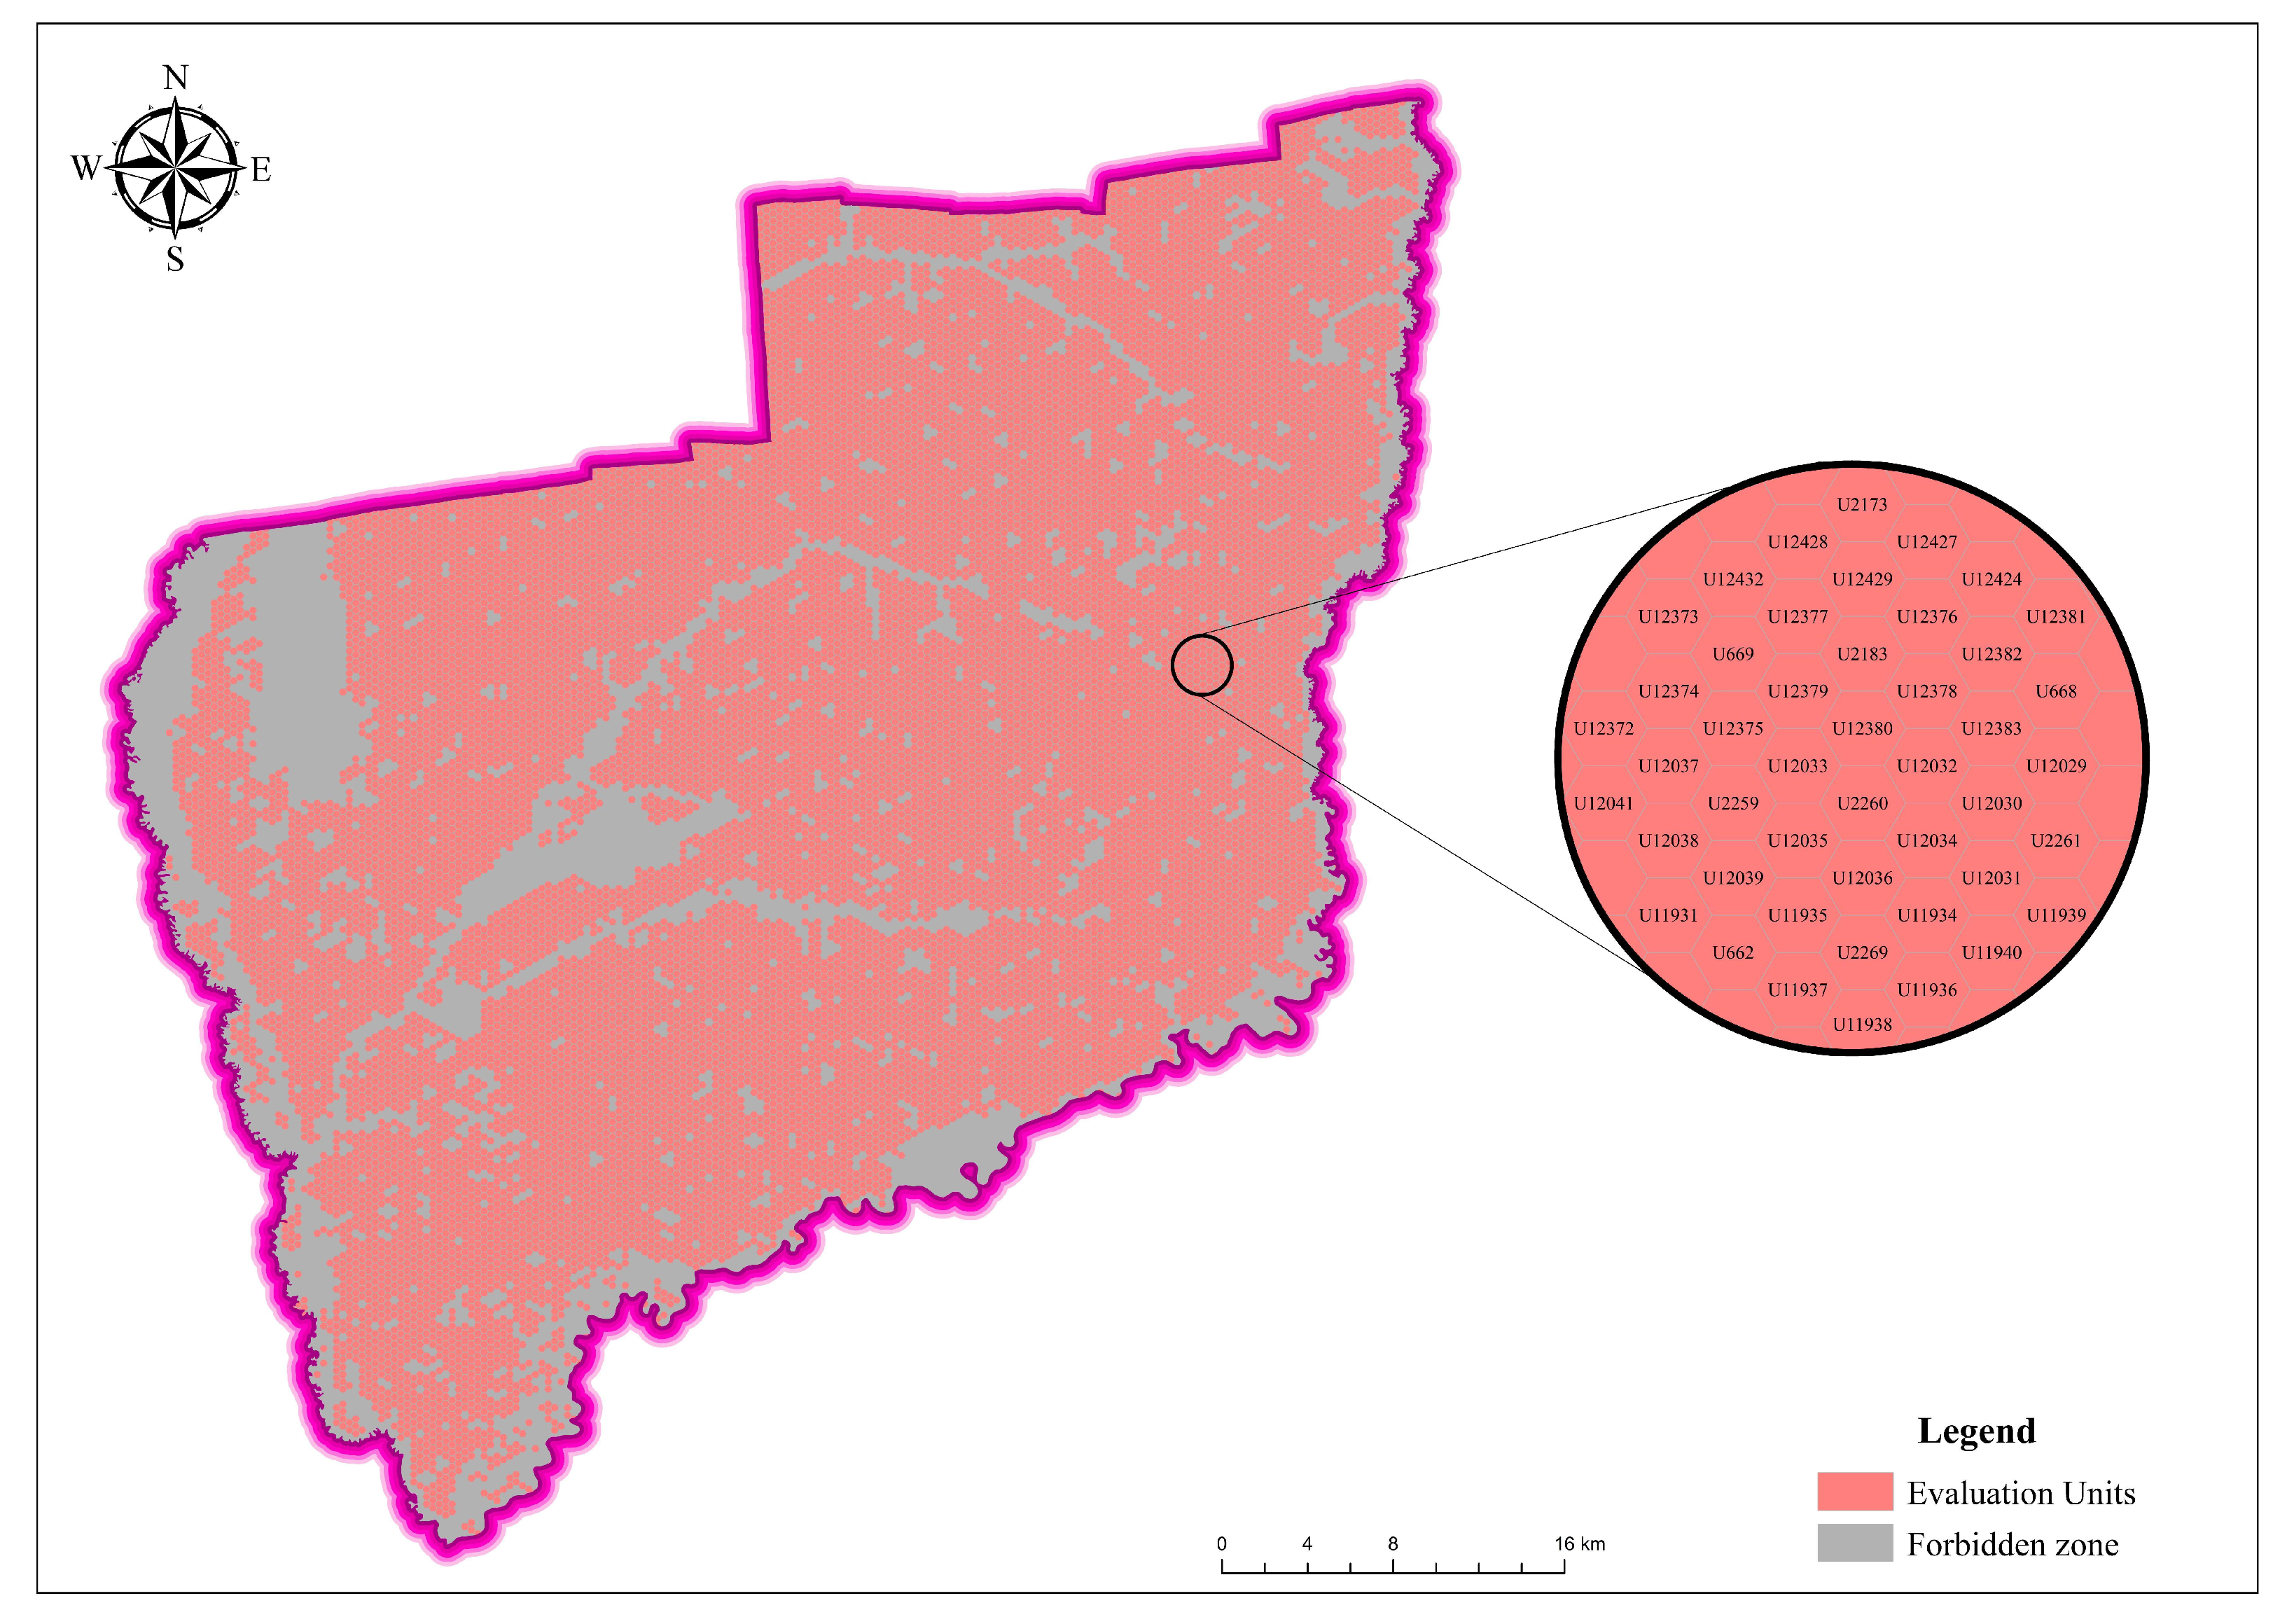
This study used grid management to divide the evaluation units of the research area. The evaluation unit adopts a regular hexagonal grid, which not only ensures that there is no overlap and gap area between the evaluation units but also achieves the maximum closeness between the centre point and the edge. The evaluation unit participated in the evaluation as the smallest object. The size of the hexagon was established according to the scale of the study area, the homogeneity and continuity of the area attributes, and the management ability. This study divided the evaluation unit of Wangkui County into a regular hexagon with a side length of 200 m and each evaluation unit was under a unique code.
The forbidden breeding zones stipulated by the state included the water source protection areas; urban residential areas; cultural, educational, and scientific research areas, nature reserves; scenic spots; national parks; and rivers. Dividing and deducting forbidden zones by using the aforementioned methods demonstrated that Wangkui County had 17,795 evaluation units. The distribution of the evaluation units in Wangkui County is shown in Figure 3.
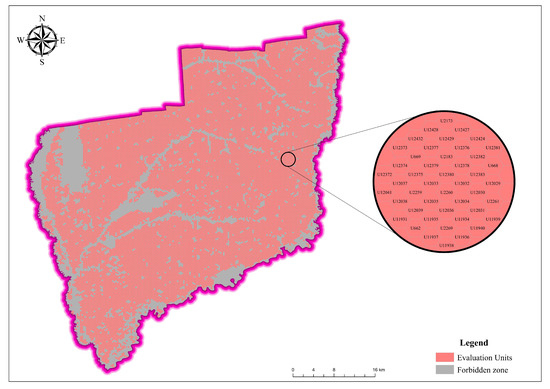
Figure 3.
Distribution map of evaluation units in Wangkui County.
2.3.2. Evaluation Index System Construction
A suitability evaluation index system is used to reflect the mathematical characteristics of the evaluation object for a certain time and space scale, using a set of interrelated index sets. This study constructed a suitability evaluation index system that adopted a combination of stratification and classification. The evaluation objectives were structured in the target, function, and index layers. Based on the literature [5,6,12,13,18], the environmental characteristics of the study area, and the research methods in this paper, an evaluation index system for the suitability of LPB was constructed. Table 1 provides further details.

Table 1.
Evaluation index system for the suitability of LPB.
2.3.3. Index Analysis and Calculation
- (1)
- Ec1 analysis method
LFs are a set of multiple LPFs. EUs are a set of multiple evaluation units.
- a.
- Manure nutrient supply of LPFs
The formula of the manure nutrient supply of each LPF is expressed as follows [6,7,12]:
where is the manure nutrient supply of ; is the number of pig units in , converted by inventory: 100 pigs are equivalent to 15 dairy cows, 30 beef cattle, 250 sheep, and 2500 poultry; is the N excretion per pig unit, where the nitrogen excretion of 1 pig unit is 11 kg; and is the rate of N retention of manure after collection, treatment, and storage processes. If solid manure and sewage are mainly treated by biogas engineering, the recommended value of the nitrogen retention rate during manure collection and treatment is 65%. Solid manure composting, sewage oxidation pond storage, or farmland utilisation after anaerobic fermentation is mainly used for manure collection and treatment, with a recommended nitrogen retention rate of 62%. Livestock and poultry manure in Wangkui County are mainly composed of solid manure, with a nitrogen retention rate of 62%.
- b.
- Manure nutrient requirements of evaluation units
The manure nutrient requirement of each evaluation unit is expressed as in [12]:
where is the manure nutrient requirement of is the total crop yield in , and is the nutrient requirement per unit output. Different crops are required to absorb different amounts of nitrogen. The main crops in Wangkui County are corn and rice. The recommended value of nitrogen absorption per 1 kg of corn yield is 0.023 kg, and the recommended value of nitrogen absorption per 1 kg of rice yield is 0.022 kg; is the ratio of N supplied by fertilisation. The total nitrogen content of dry soil in Wangkui County is greater than 1 g/kg, and the total nitrogen content of paddy soil is greater than 1.2 g/kg. The soil nutrient classification belongs to level I. Therefore, the recommended value of the fertiliser supply is 35%. is the ratio of livestock manure nitrogen nutrient in the total fertiliser; is the N utilisation efficiency. The recommended value is 30%.
- c.
- Manure nutrient allocation methods for LPF
The allocation of manure nutrients to the evaluation unit of each LPF was determined according to the following method:
The distance between the and evaluation units was the main basis for the allocation of manure nutrients. The distance was classified according to the following method:
Suppose the coordinates are ), and the centre point coordinates are (). The coordinate of the centre point of the that included is (), k ∈ j. The distance between the centre point of and is expressed as in [5]:
where represents the distance between the centre point of and represents the distance level between and , represents the regular hexagon of the evaluation unit side length, and is an integer multiple, a = 1,2, …, p.
The manure nutrient allocation of is sorted by and the priority is evaluation units with the lowest values of values.
The maximum value of the manure nutrient allocation from to is the manure nutrient requirement of . The relationship among , , and is shown in Equations (7) and (8).
When the remaining manure nutrient supply of is less than the sum of the values of the evaluation units with the same , considering the transport cost, the evaluation units are sorted according to the values; the remaining manure nutrient priority is evaluation units with a high value.
- d.
- Manure nutrient acceptance method for an evaluation unit
The manure nutrient acceptance of each evaluation unit was determined according to the following method:
- The accepts the of LPFs based on distance; the priority is to accept the of the nearest LPFs.
- The maximum radius of manure nutrient distribution is 2 km [12] and transport costs beyond 2 km exceed the manure price.
- When the has two or more LPFs with the same , the priority is to accept the of the LPFs that can saturate the of the .
- When the has two or more LPFs with the same and there are two or more LPFs such that the satisfies the demand of the , the priority is to accept the of the LPF with the highest .
- When the has two or more LPFs with the same and the remaining of all LPFs is lower than the of the , the priority is to accept the of the LPF with the highest remaining
- The maximum value of the sum of the is the of the . When the sum of the is less than the of the , it will continue to accept the of other LPFs in accordance with the first four principles. When the sum of the equals the of the , the of other LPFs will not be accepted.
- e.
- Soil fertility demand degree
The soil fertility demand degree of is expressed as in [6,12]:
The aforementioned method was realised by using ArcGIS and the Python programming language.
- (2)
- Calculation methods of other indexes
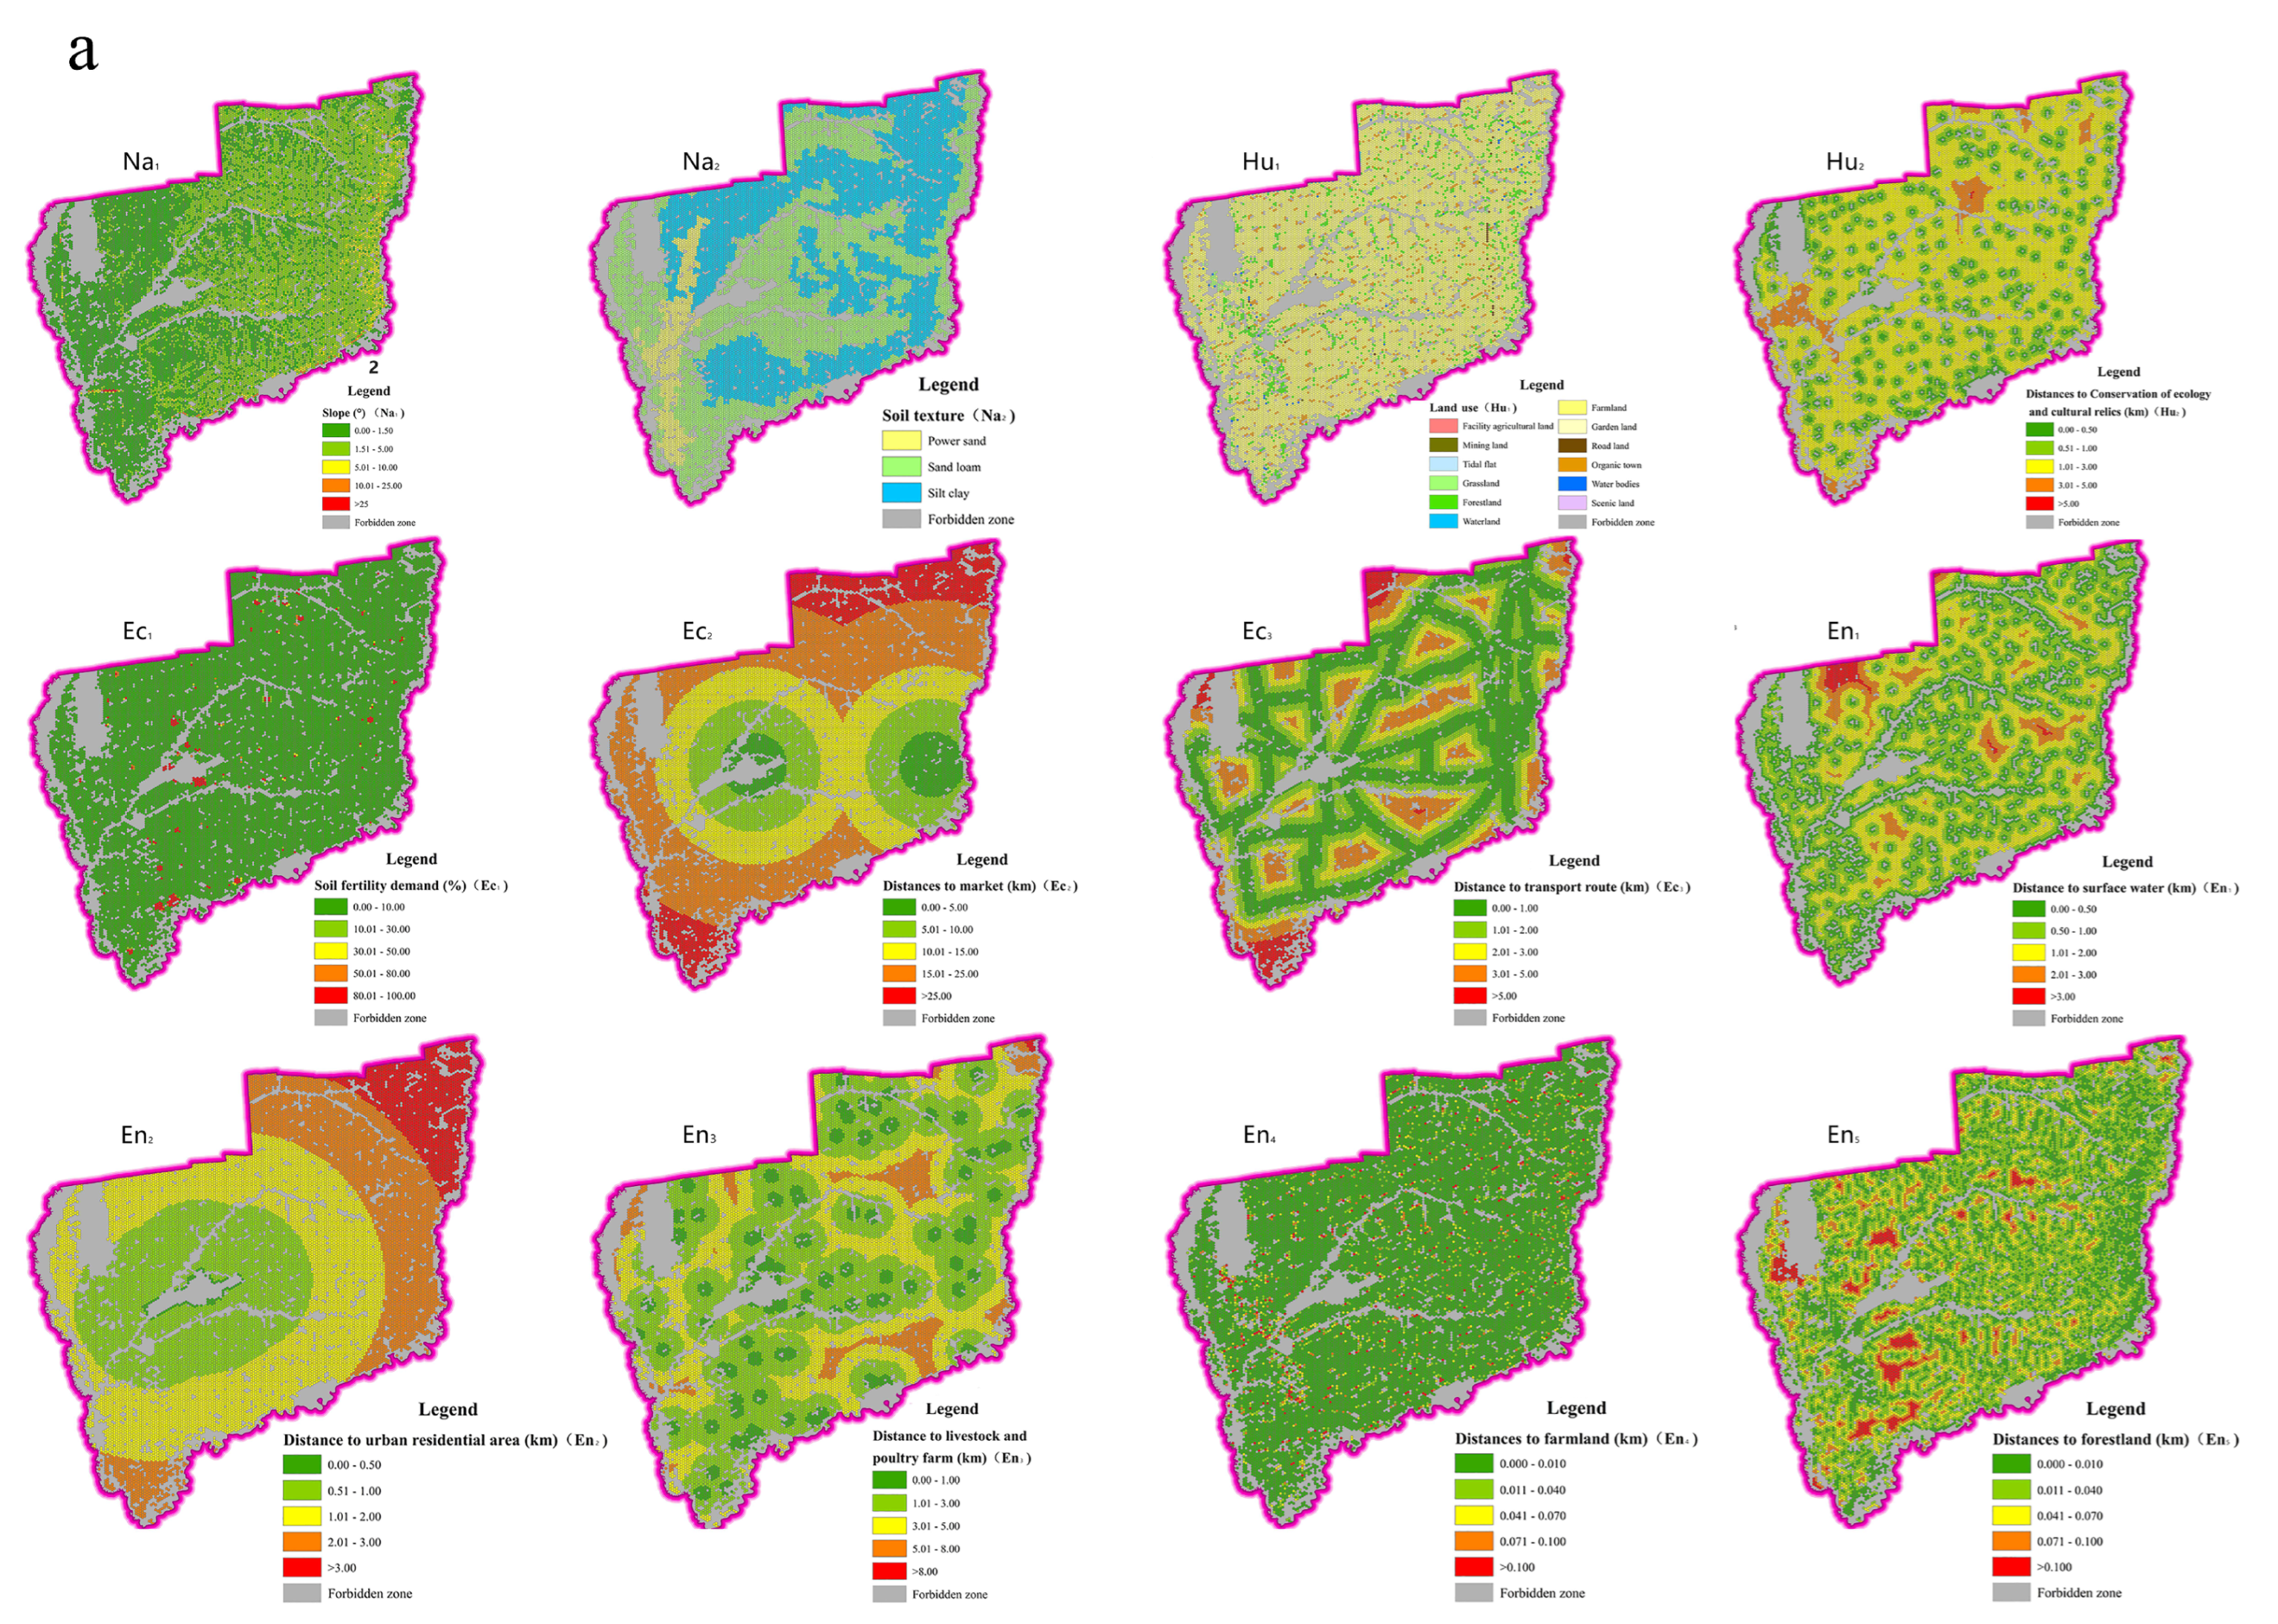
Na1 was obtained by extracting slope values from the DEM data; Na2 was obtained from the sand, silt, and clay values downloaded from the World Soil Database; soil texture type was obtained according to the Chinese soil texture classification standard [21]; Hu1 was obtained from land use data; Hu2 was obtained by calculating the distance between the evaluation unit and natural reserves, scenic spots, water sources, and scientific, educational, and cultural land; and Ec2, Ec3, and En1-En5 were obtained by calculating the distance between the evaluation unit and the target object.
2.3.4. Index Standardisation Method
After the analysis and calculation of the indexes, the original values of the indexes were standardised because of the different measurement units of the indexes. Standardisation not only needs to avoid the incomparable disadvantages between indexes caused by different measurement units, but also highlights the importance of indexes. Therefore, the standardisation model focuses on the construction of these two aspects. The problem of different measurement units is solved by a nondimensional transformation method and the importance of indexes is expressed by weight.
- (1)
- Dimensionless transformation method
The indexes Na1, Na2, and Hu1 are assigned dimensionless transformation values based on expert scores [5,6,13] and the assignment methods are listed in Table 2.
Table 2.
Expert score for indexes Na1, Na2, and Hu1.
For the remaining indexes, positive indexes (Hu2, En3) execute Equation (10) [13], and reverse indexes (Na1, Ec1, En4, En5) execute Equation (11). The partial reverse indexes (Ec2, Ec3, En1, En2) undergo dimensionless transformation according to the following method: When the value is less than or equal to 0.5 (km) [22], the dimensionless transformation value is 0, and when the value is greater than 0.5 (km), it is a reverse index, so Equation (11) is executed and = 0.5 (km).
where represents the value of index i after dimensionless transformation, represents the original value of index i, represents the minimum value among the original values of index i, and represents the maximum value among the original values of index i.
- (2)
- Weight calculation method
The AHP method was used to determine the index weight [6], and the calculation results of the index weight are listed in Table 3.
Table 3.
Index weight assignment table.
- (3)
- Standardised calculation method
The construction of the index standardisation model is shown in the following formula:
where represents the value of index i after standardised calculation and represents the weight value of index i.
2.3.5. Cluster Analysis of Evaluation Units
Based on the index analysis results, the SOM method was used to cluster the evaluation units. The principle and method of SOM operation are described in the studies by Kohonen et al. [23,24,25,26]. All input evaluation units and indexes are formed into 12 index component plans and one U-matrix by using the SOM programme. The component plane diagram of each index uses colour scales to represent the distribution of its index values; that is, obvious colour scales distinguish between high and low values. The distance between neurones in the U-matrix plane graph shows the similarity between specific evaluation units, and the closer the neuron, the higher the similarity [27].
The grouping of the components reveals the relationship between the indexes through the correlation of the component plan and can group and select the indexes; that is, the visual component plan is grouped according to the colour level and the position of the colour level. The similarity between the indexes and the grouping status of the indexes is easily observed through the SOM component plane grouping diagram; that is, the colour levels at the same position in the plane diagram of indexes are similar, and thus, those indexes are determined as a group [28].
According to the analysed index correlation and the distance between the output objects, the evaluation units are clustered using the Davies–Bouldin index method of SOM. Using clustering, n columns and m rows of neuron cells are obtained, a class is distinguished by colour, and the evaluation units and numbers included in each class are known [29]. Therefore, SOM is a powerful tool for uncovering and identifying clusters of objects hidden in different patterns, as well as for quantifying groupings using metrics [28].
2.3.6. Suitability Ranking Analysis
This study calculated the mean values of the of indexes in each cluster (calculated using Equations (10) and (11)). Each cluster was ranked using the HDT based on the mean and weight values of the indexes for each cluster. The arrangement order relationship in the Hasse matrix can be visualised using the Hasse diagram [30,31]. The closer the object is to the top of the Hasse diagram, the greater the degree of influence according to the ranking principle [32]. For details on the calculation method and principle of the Hasse diagram, please see the studies by Brüggemann et al. [32,33,34,35]. The HDT is a process of evaluating and making decisions on critical elements based on the partially ordered set method [36,37]. The ranking result is the classification result of the suitability evaluation for the evaluation units. In this study, DART software was used to complete the calculation of the Hasse diagram ranking.
2.3.7. Extraction of Suitable Breeding Zones
Depending on the ranking results of the suitability of the evaluation units, the land use types in the evaluation units whose suitability grades were higher than the relatively suitable grade were extracted. Deductions were made for land types not suitable for the LPF. The types of land not suitable for LPB comprise basic farmland, water bodies, roads, homesteads, and hydraulic construction land. Finally, the spatial distribution consequences of high-, medium-, and low-suitability zones were established.
2.3.8. Space Optimisation of LPFs
According to the results of suitable breeding regions, existing LPFs with unreasonable distribution were optimised for space, and the best area for relocation to new sites was proposed. Spatial optimisation was performed using GIS buffer and overlay analyses. First, two-level buffer zones were analysed for the unreasonably distributed LPFs: the primary buffer zone was 2 km and the secondary buffer zone was 5 km. Due to the restriction of administrative jurisdiction on the relocation of LPFs, a superimposed analysis of two-level buffer zones and the administrative division was conducted. A suitable breeding region within the primary buffer zone in the township was the best choice for relocation to a new site. Land plots with high-suitability zones were preferentially selected. A suitable breeding region within the secondary buffer zone within the township was the candidate range. When the priority range could not fulfil the requirements, the candidate range could be chosen.
3. Results
3.1. Original Value Results of Indexes
Using the index analysis and calculation method, the original values of the 12 indexes were obtained (Supplementary Table S1). As seen in Figure 4a, Wangkui County has the following characteristics:

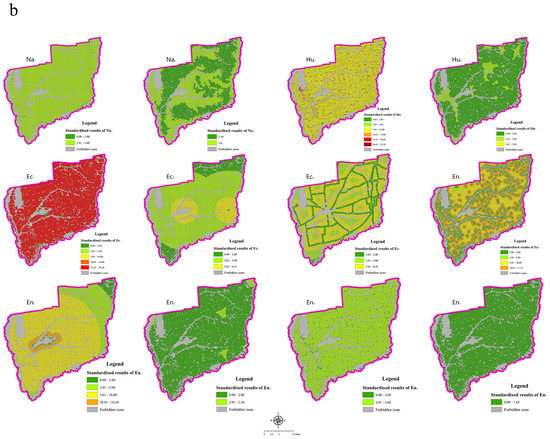
Figure 4.
(a) Original value result distribution map of indexes. (b) Standardised result distribution map of index.
- Wangkui County has flat terrain, good soil texture, a relatively uniform distribution of water systems, and relatively developed roads. No large area of forest land exists in the county, and small areas of forest land are scattered.
- The proportion of cultivated land is large and the demand for soil fertility is high. The distance between the evaluation unit and the cultivated land is relatively short, which is suitable for returning livestock and poultry manure compost to the nearby field.
- Ecological and cultural land, such as protected areas and water sources, are scattered, and the distance between the evaluation unit and the ecological and cultural land is mostly within 5 km.
- There is one main urban area, which is located in the west of the county. Few and unevenly distributed farmers’ markets were observed.
- LPFs were relatively densely distributed in the main urban area.
3.2. Standardised Results of Indexes
Using the index standardisation method, the original values of the indexes were standardised and calculated (Supplementary Table S1). The larger the index value, the more suitable the LPB (Figure 4b). The standardised value range of each index demonstrated that the impact of each index on LPB is the image degree, and the higher the value, the greater the degree of influence. The degree of influence of each index was as follows: Ec1 was the highest; Hu1, En1, and En2 were relatively high; Ec2 and Ec3 were medium; Na1, Na2, Hu2, En3, and En4 were relatively low; and En5 was the lowest.
3.3. Evaluation Unit Clustering Results
The SOM method was performed on the evaluation units after the standardisation of the indexes, and the component plan (Figure 5a) and grouping diagram (Figure 5b) of the indexes were obtained. The SOM component plan and grouping diagram demonstrate that, except for a few cells with the lowest values, En4 and Hu1 have a negative correlation, which shows that as the amount of farmland increases, the distance between the evaluation unit and the farmland decreases, and the standardised value of its suitability evaluation increases. However, to ensure food security, farmland is less suitable for LPB. The similarity of the other indexes is not high, indicating that the indexes have a certain representative significance and reflect the suitability of LPB well. Therefore, similarity index screening is no longer performed and all 12 indexes participated in the cluster analysis of the evaluation units.
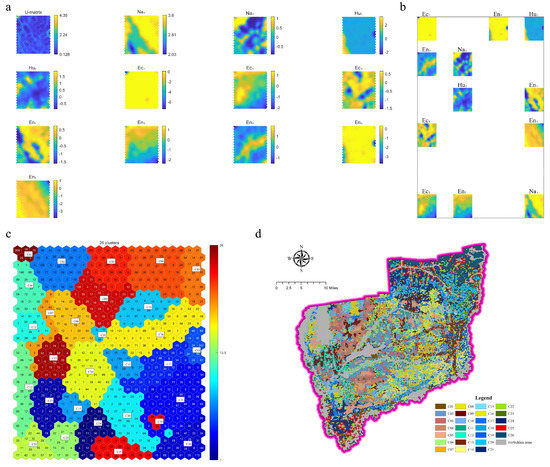
Figure 5.
Evaluation unit clustering results. (a) SOM component plan of indexes. (b) SOM grouping diagram of indexes. (c) SOM cluster diagram of evaluation units. (d) Evaluation unit clustering spatial distribution map.
Based on Davies–Bouldin cluster analysis of SOM, the evaluation units were divided into 26 categories, and the classification results are shown in Figure 5c. This study encoded clusters in the order C1–C26. The number and code of the evaluation units in each cluster have a one-to-one correspondence. Each colour represents a category and the number marked with each neurone represents the number of evaluation units included. According to the correlation of 12 indexes, the evaluation unit with higher similarity is included in one neurone, and the neurone with the closer distance has higher similarity. The position of each neurone corresponds to the distribution positions of the high and low values of the 12 indexes of the component plan, so that it can be seen in the main indexes that each category is different from other categories. For example, C01 contains 532 evaluation units. This can be seen from the 12 index values corresponding to its location. The characteristics of this category are that the indexes Ec1 and En3 have low values, which means that this type of evaluation unit is close to LPFs and has soil nutrient requirements close to saturation; C18 contains 600 evaluation units, and the category is characterised by low values of indexes Hu1 and En4. The land use type of the evaluation unit representing this category is not suitable for LPB and the distance from cultivated land is not conducive to the return of livestock and poultry manure to the field. Next, the cluster code was assigned to the evaluation units of the spatial feature layer and the evaluation unit clustering spatial distribution map was obtained (Figure 5d).
3.4. Suitability Ranking Results
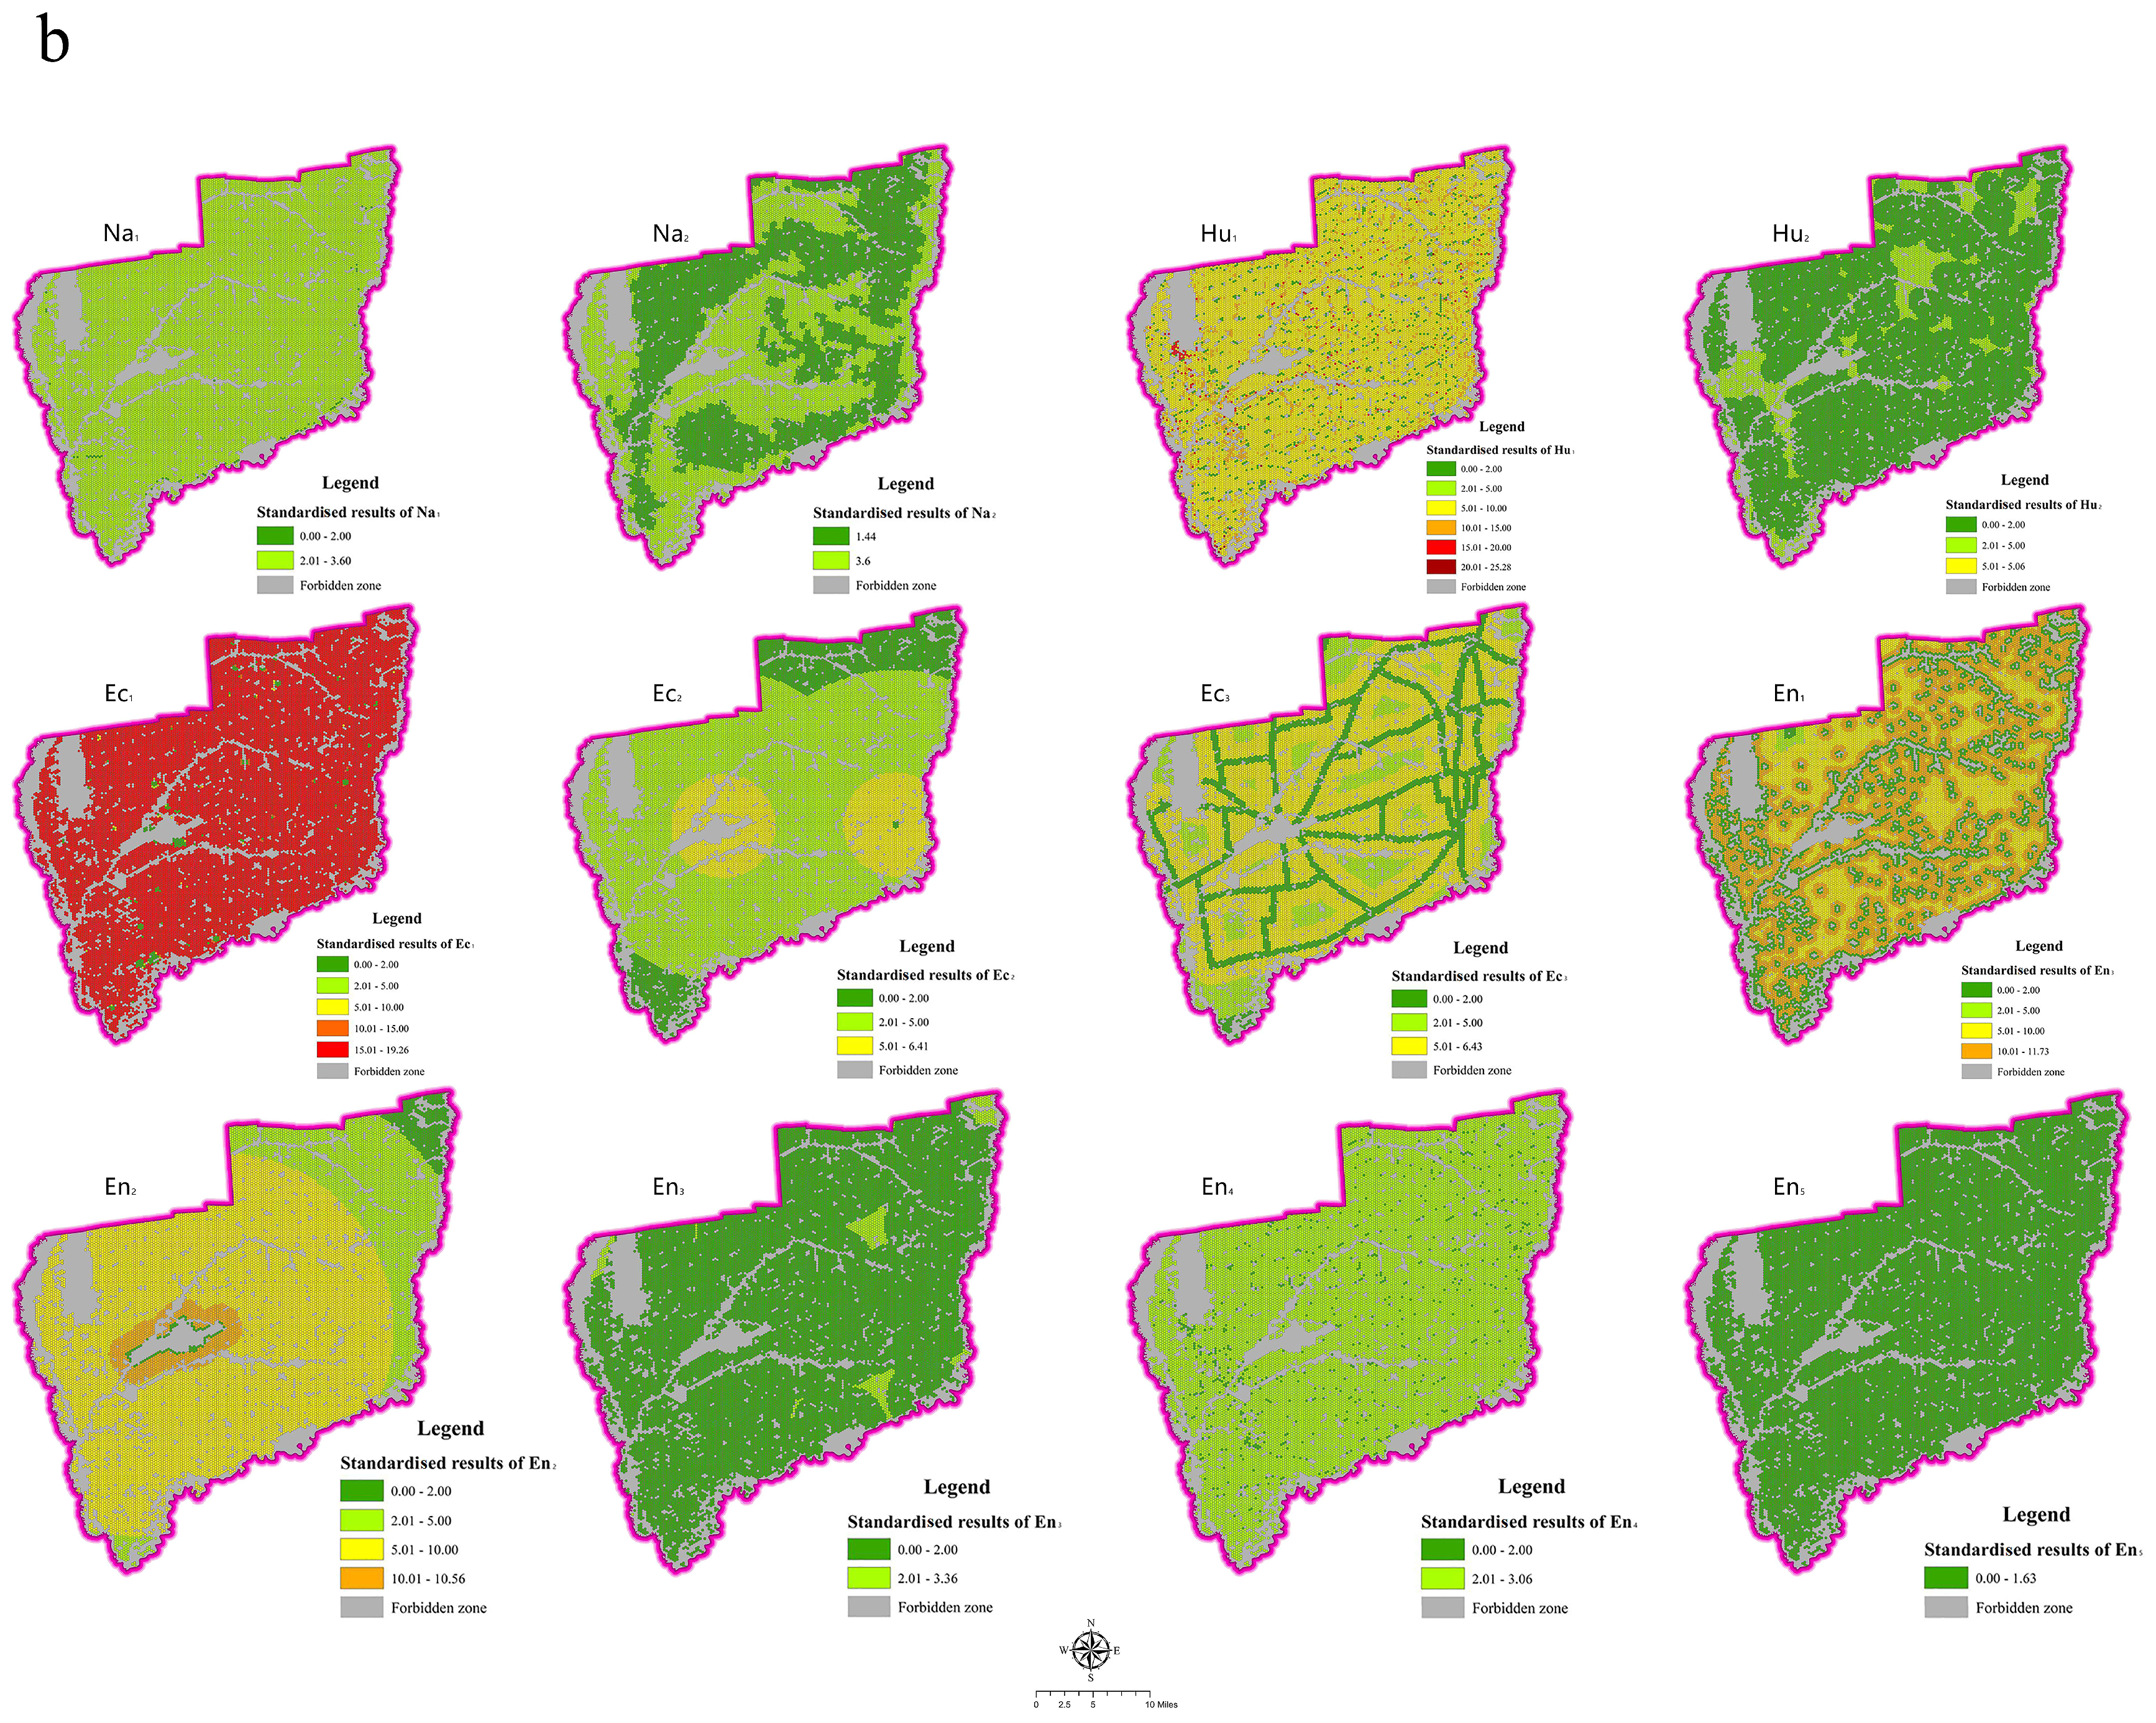
According to the yi means of indexes for the evaluation units included in each cluster (Supplementary Table S2) and the index weight (Table 3), the HDT was used to rank each cluster and the results are presented in Figure 6a. After ranking, the 26 clusters were divided into five levels. The clustering at the top of the picture had the highest suitability, and the clustering at the bottom of the picture had the lowest suitability. The suitability comprised five grades: Ⅴ—high suitability, which corresponds to the fifth level of the Hasse diagram, namely six clusters (C09, C11, C12, C16, C19, and C26); Ⅳ—medium suitability, which corresponds to the fourth level of the Hasse diagram, namely four clusters (C02, C14, C22, and C24); Ⅲ—low suitability, which corresponds to the third level of the Hasse diagram, namely eight clusters (C05, C06, C08, C10, C15, C17, C21, and C23); Ⅱ—low unsuitability, which corresponds to the second level of the Hasse diagram, namely seven clusters (C01, C03, C04, C07, C18, C20, and C25); and Ⅰ—high unsuitability, which corresponds to the first level of the Hasse diagram, namely one cluster (C13). The suitability grade was assigned to the evaluation units of the spatial feature layer and the spatial distribution map for the suitability grade of the evaluation units was obtained (Figure 6b). It can be seen from the figure that the high suitability evaluation units are mainly distributed in the west and northeast of Wangkui County, the medium suitability evaluation units are mainly distributed in the central area of Wangkui County, and the low suitability evaluation units are mainly distributed in the southwest of Wangkui County.
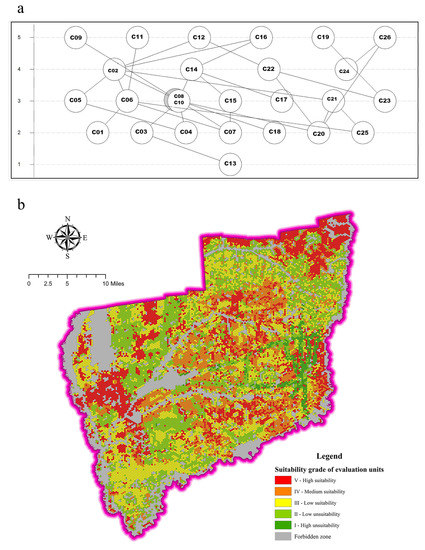
Figure 6.
Suitability ranking results. (a) Hasse diagram ranking results of clusters. (b) Spatial distribution map of evaluation units’ suitability grades.
3.5. Results of Suitable Breeding Zones
The evaluation units whose suitability grades are high, medium, and low are defined as suitable regions. Land plots in the suitable region were extracted using a GIS overlay analysis. Land types not suitable for LPB should be deducted from the land in the suitable region. The removal of finely divided plots of less than 1000 m2 was conducted. The spatial distribution of the suitability grade zones of land plots in the suitable region was obtained. See Figure 7a for details.

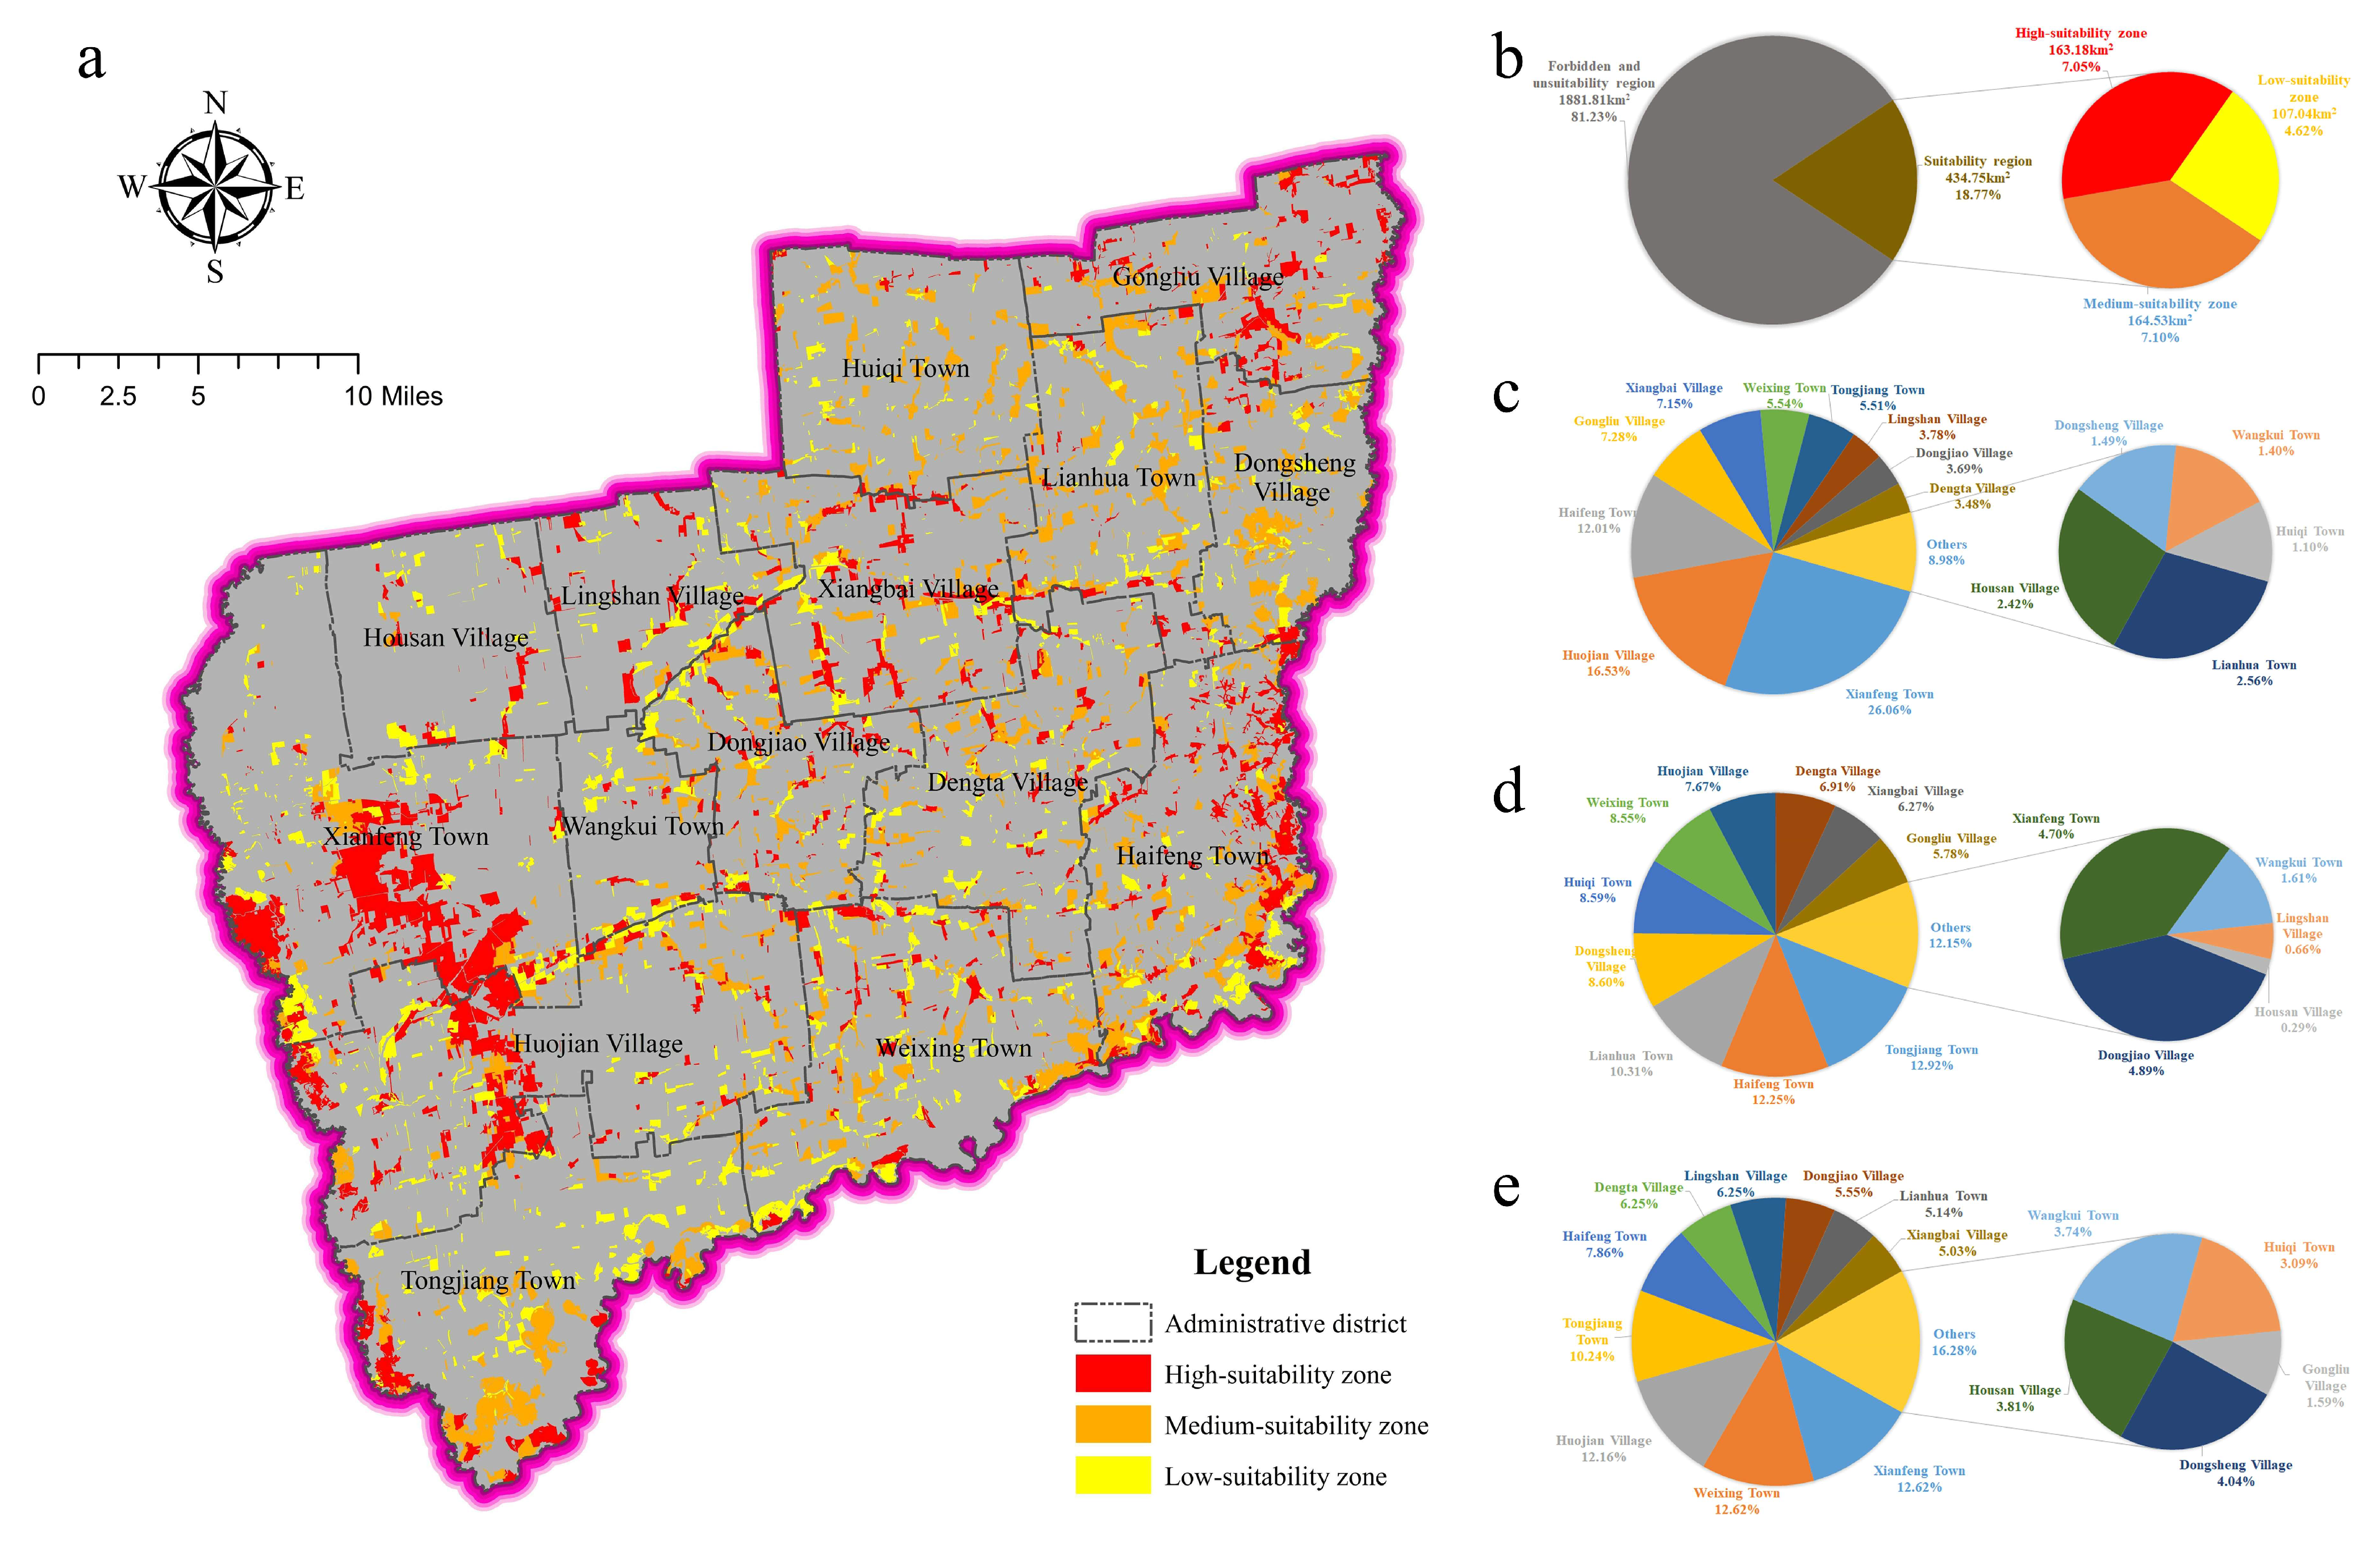
Figure 7.
Results of suitable breeding region. (a) Spatial distribution of suitable breeding region. (b) Proportion of suitable region and unsuitable region. (c) Proportion of high-suitability zone in each township. (d) Proportion of medium-suitability zone in each township. (e) Proportion of low-suitability zone in each township.
The forbidden and unsuitable region of Wangkui County is 1881.81 km2, accounting for 81.23% of the total area of the county. The suitable region is 434.76 km2, accounting for 18.77% of the total area of the county, of which the high-suitability zone is 163.18 km2, the medium-suitability zone is 164.53 km2, and the low-suitability zone is 107.04 km2, and the ratios to the total area of Wangkui County are 7.05%, 7.10%, and 4.62%, respectively (Figure 7b). The high-suitability zone has a large distribution area in Xianfeng Town, Huojian Village, and Haifeng Town (Figure 7c). Three townships, Tongjiang Town, Haifeng Town, and Lianhua Town, have high medium-suitability zone distribution ratios of more than 10% (Figure 7d). The townships with relatively high distribution ratios of low-suitability zones include Xianfeng, Weixing, Huojian, and Tongjiang (Figure 7e).
The land plots in the zones of high suitability, medium suitability, and low suitability were scattered throughout the county. Among them, there are two parts of the high-suitability zone with large partitions: they are located in the west and east of Wangkui County, and most of them are in Xiangfeng Town, Huojian Village, and Haifeng Town. The two parts have common characteristics: they are close to rivers and have sufficient water sources, they are close to farmers’ markets and main roads with developed transport and low transport costs, they are far away from the protected area and the pollution to the ecological protection area is low, and the surrounding farmland is sufficient and the nutrient demand is large, which is conducive to the nearby composting of livestock and poultry manure.
3.6. Space Optimisation of LPFs
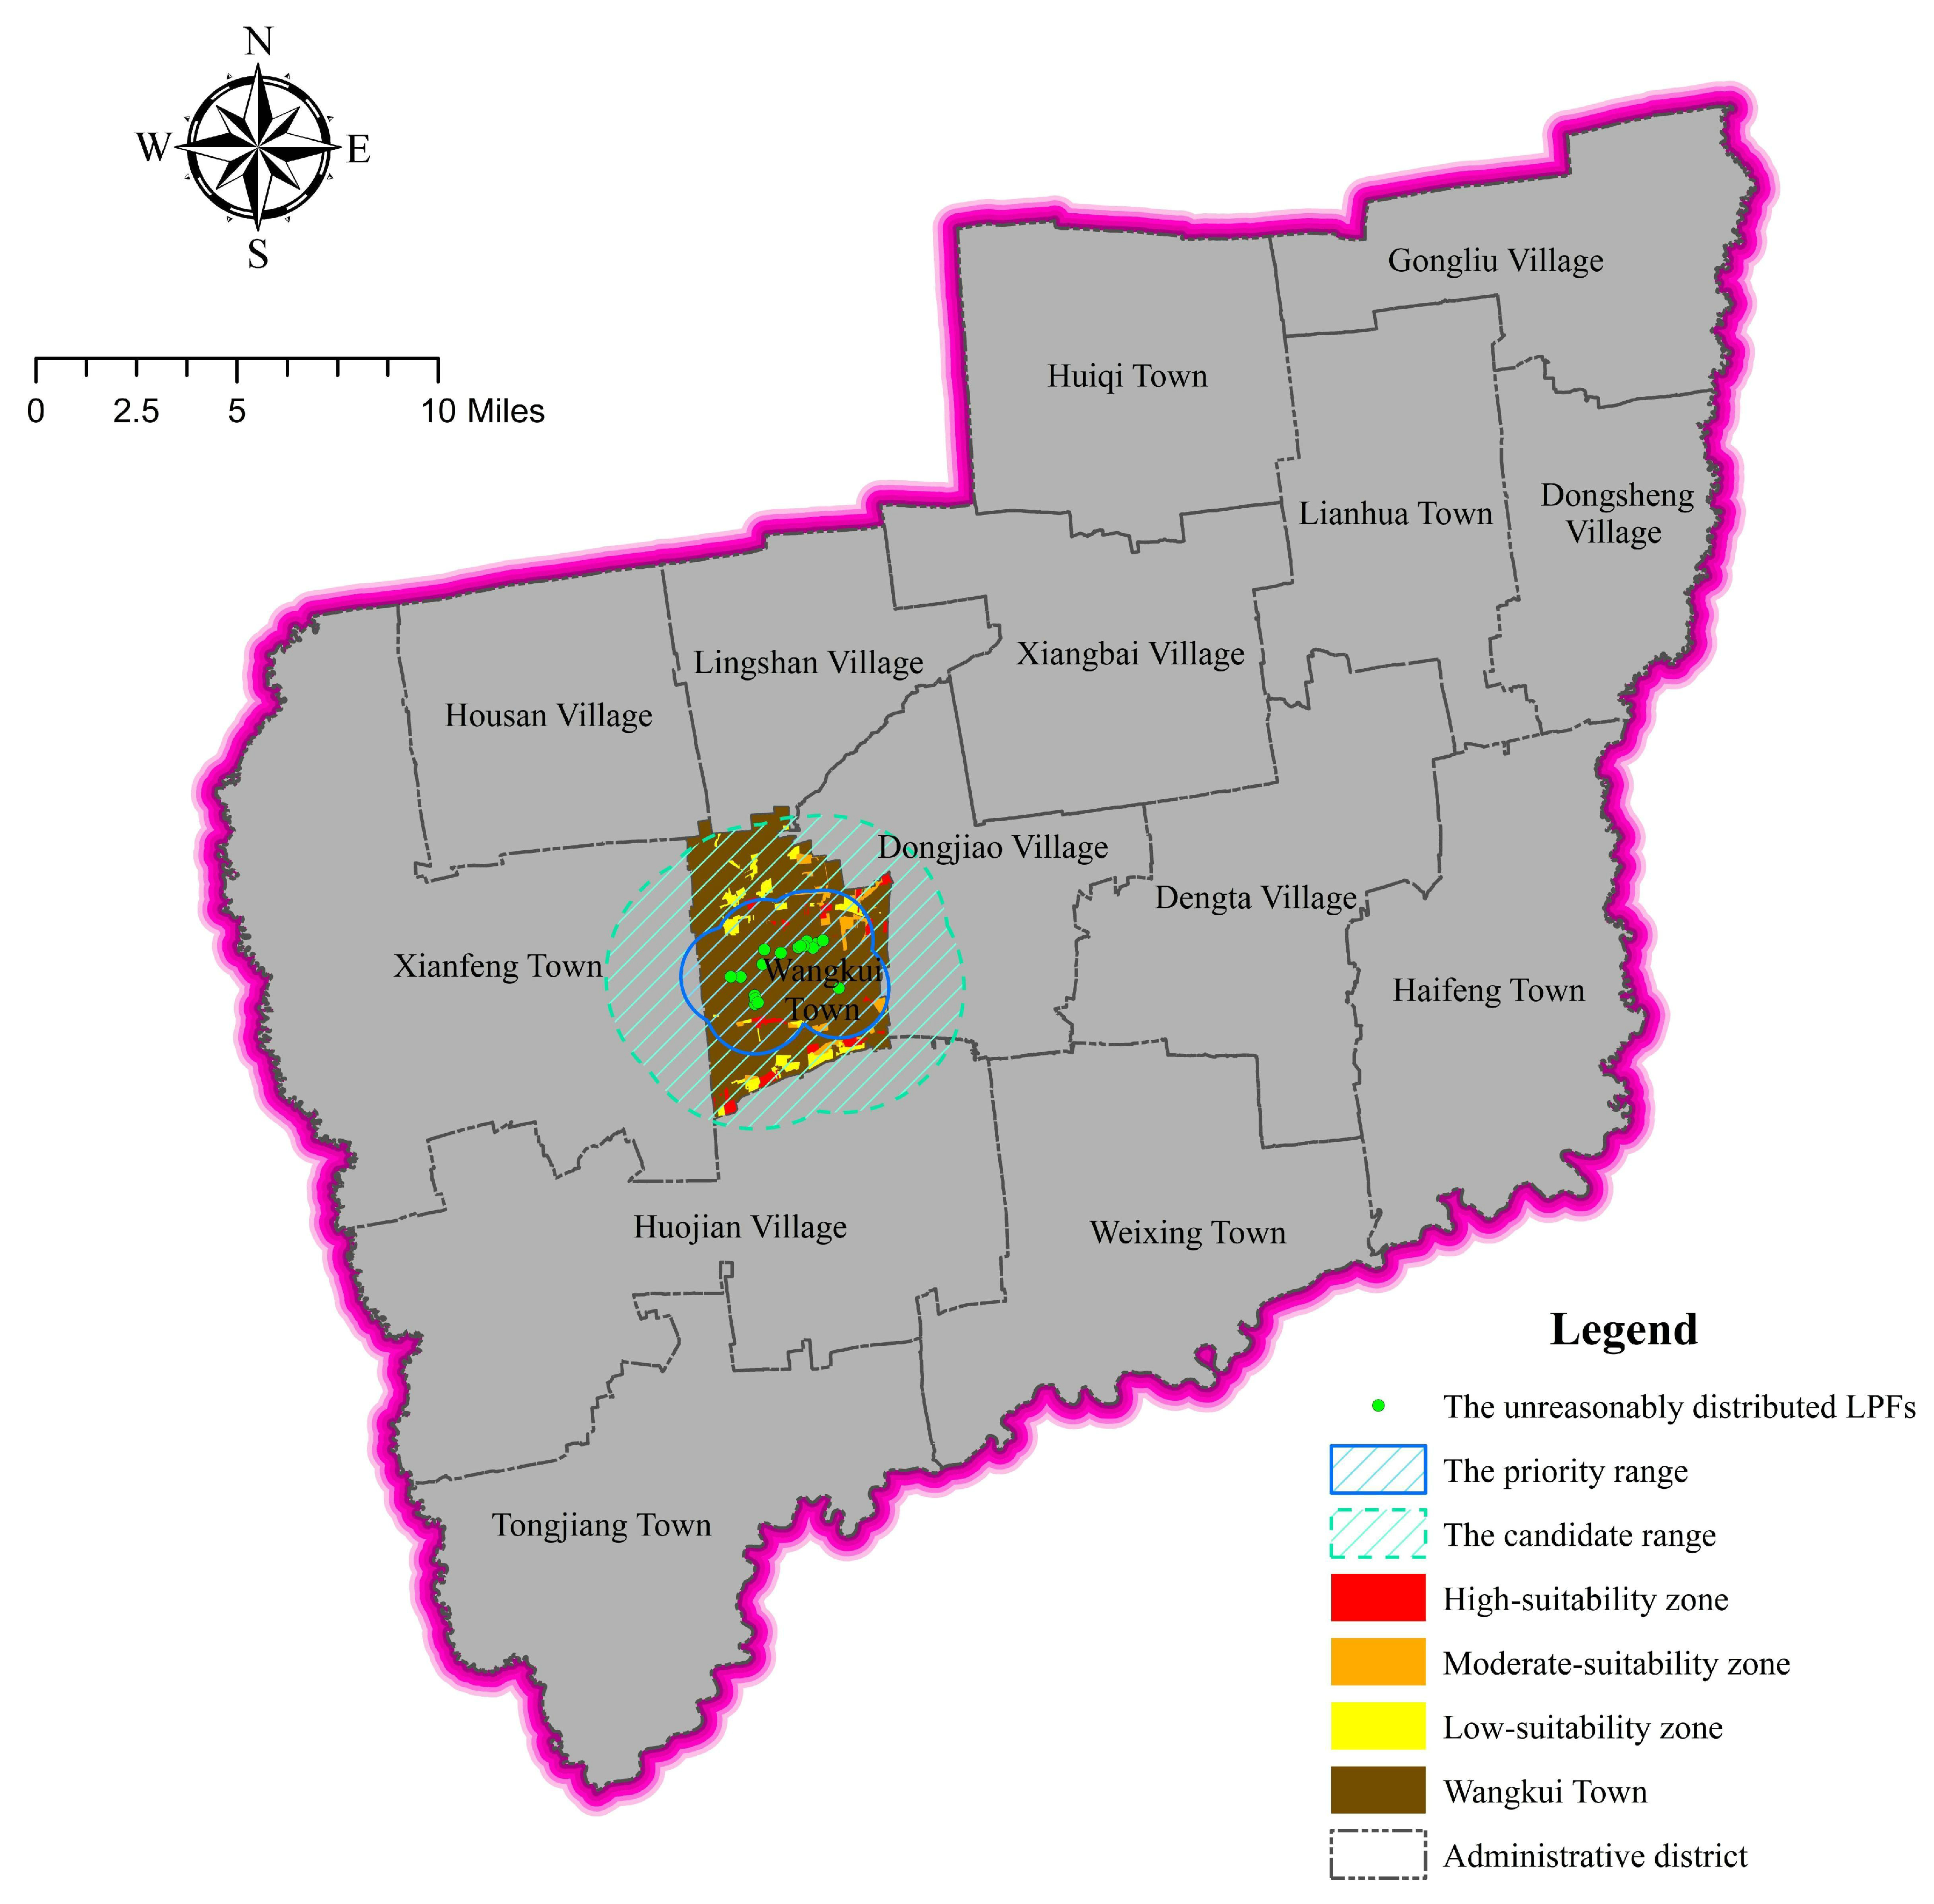
Seventeen large-scale LPFs are in Wangkui Town, which is located in an urban construction area, causing pollution risks to the living environment of residents. Relocation to nearby suitable breeding land plots is recommended. By analysing the two-level buffer zones of 17 LPFs and then performing overlay analysis with the administrative area, the ranking of the migration locations is obtained as follows: the high-suitability zone, medium-suitability zone, and low-suitability zone within the priority selection range, and then the high-suitability zone, medium-suitability zone, and low-suitability zone within the alternative range (Figure 8).
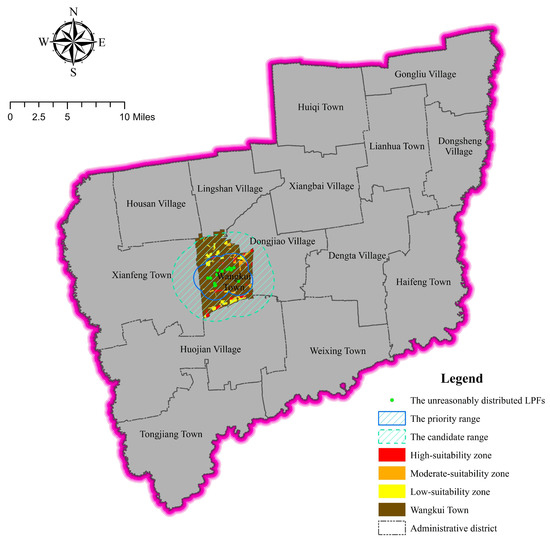
Figure 8.
Relocation planning analysis results of large-scale LPFs.
4. Discussion and Conclusions
In the current study, an index system for spatial suitability assessment of LPFs was established. The construction of this index system aims to improve the economic benefits of LPB and reduce the impact of environmental pollution and it is significant to solve the problem of environmental pollution caused by the vigorous development of the LPB industry. The index system comprehensively considers natural factors, human factors, economic factors, and environmental factors. This is different from previous studies [13,20] that focus on economic indexes. This index system focuses on the contribution of environmental factors and food security.
In this study, a spatial suitability evaluation method for LPB was constructed. Due to the large number of distance-related indexes, when dividing the evaluation unit, it is different from using administrative divisions or land plots as the dividing unit in previous studies [6,7,20]; using hexagons for division not only improves the evaluation accuracy but also reduces the error caused by the distance-related indexes in the evaluation process. When selecting the evaluation method, the commonly used multi-criteria decision making and AHP [6,13] methods are not used. Instead, according to the characteristics of nonlinear and partial order relationship after index quantisation, SOM nonlinear mapping technology and HDT partial order sorting are selected.
The results demonstrated that most of the land in Wangkui County is not suitable for LPB, mainly because Wangkui County has a large number of basic farmland and ecological protection areas. In order to ensure food security and protect the ecological environment, LPB on basic farmland and ecological reserves is prohibited. Only 18.77% of the land in Wangkui County is suitable for LPB. Except for the suitable land plots in the eastern and western regions that are concentrated and contiguous, the rest are small and relatively uniformly scattered throughout the county. This distribution feature is consistent with the following livestock and poultry farming needs: First, the area required for the construction of LPFs is not large, and the demand for large-scale land that is concentrated and contiguous is not high. Second, the nearby compost is returned to the field to fulfil the nutrient requirements of the surrounding farmland to prevent livestock and poultry manure from exceeding the carrying capacity of arable land and causing environmental pollution.
The rationality analysis showed that the distribution of most of the LPFs in Wangkui County is relatively reasonable, and only 13% of the LPFs were unsuitable, mainly around the urban settlements. One of the reasons is that, in the planning of space layout, too much emphasis is placed on economic indicators such as sales, production, and transportation, while ignoring the impact factors of environmental pollution; the other is that, due to the rapid expansion of cities and towns, the original LPFs could not be relocated in time according to the needs of development, resulting in the phenomenon that the LPFs surrounded the towns.
In this paper, a spatial optimisation model of LPFs was established and a selection plan for the relocation of new sites was proposed for the LPFs with unreasonable distribution. Unlike previous studies that only focus on cost factors, such as distance [6], the optimisation model not only pays attention to distance cost, but also considers the policy issue of administrative ownership. The new site that satisfies the relocation was preferentially selected for the land with the lowest distance cost and the highest suitability within the same jurisdiction, providing managers with solutions for LPB planning and management.
Due to the influence of the indexes of Ec1 and En3, the evaluation method of LPB suitability adopted in this study is dynamic. Each new construction, reconstruction, and expansion of an LPF affects the suitability of site selection for the next stage of LPFs. Therefore, the evaluation method has a large amount of calculation and is inconvenient for daily management and an information system is necessary to realise the automation of suitability evaluation. The absence of support for the information system provides the method with certain disadvantages in practical application but does not affect the method scientifically or affect its rationality. The construction of an information system for LPB suitability evaluation can be considered the next research direction.
Supplementary Materials
The following supporting information can be downloaded at: https://www.mdpi.com/article/10.3390/su14127464/s1, Table S1: Descriptive statistics for indexes value of evaluation units; Table S2: The yi means of indexes for the evaluation units included in each cluster.
Author Contributions
B.-L.L., conceptualization, methodology, formal analysis, data curation, and writing original draft. G.L., supervision and project administration. C.-X.Y., visualization, investigation, and writing. J.M., supervision. Y.Z., revising and polishing. S.-P.Y., reviewing. J.D., software and validation. H.G., resources and data curation. All authors have read and agreed to the published version of the manuscript.
Funding
This research has been funded by the Natural Science Foundation of Heilongjiang Province (No. LH2019D017) and The Education Science “Thirteenth Five-Year Plan” Key Issues of Heilongjiang Province (No. GJB1320175).
Institutional Review Board Statement
Not applicable.
Informed Consent Statement
Not applicable.
Data Availability Statement
All the data generated or analysed during this study are included in this published article (and its Supplementary Material files).
Conflicts of Interest
We declare that the manuscript titled “Spatial suitability evaluation of livestock and poultry breeding: a case study in Wangkui County, Heilongjiang Province, China” has no conflict of interest with other people or organisations.
References
- Qian, Y.; Song, K.; Hu, T.; Ying, T. Environmental status of livestock and poultry sectors in China under current transformation stage. Sci. Total Environ. 2018, 622–623, 702–709. [Google Scholar] [CrossRef]
- Liu, W.-R.; Zeng, D.; She, L.; Su, W.-X.; He, D.-C.; Wu, G.-Y.; Ma, X.-R.; Jiang, S.; Jiang, C.-H.; Ying, G.-G. Comparisons of pollution characteristics, emission situations, and mass loads for heavy metals in the manures of different livestock and poultry in China. Sci. Total Environ. 2020, 734, 139023. [Google Scholar] [CrossRef] [PubMed]
- Han, Z.; Han, C.; Yang, C. Spatial econometric analysis of environmental total factor productivity of ranimal husbandry and its influencing factors in China during 2001–2017. Sci. Total Environ. 2020, 723, 137726. [Google Scholar] [CrossRef]
- Jones, J.W.; Antle, J.M.; Basso, B.; Boote, K.J.; Conant, R.T.; Foster, I.; Godfray, H.C.J.; Herrero, M.; Howitt, R.E.; Janssen, S.; et al. Toward a new generation of agricultural system data, models, and knowledge products: State of agricultural systems science. Agric. Syst. 2017, 155, 269–288. [Google Scholar] [CrossRef] [PubMed]
- Yan, B.J.; Li, Y.X.; Yan, J.J.; Shi, W.J. Spatial site selection for a centralized treatment center of livestock excreta: Taking Nantong Town as an example. Comput. Electron. Agric. 2021, 180, 105885. [Google Scholar] [CrossRef]
- Yan, B.; Shi, W.; Yan, J.; Chun, K.P. Spatial distribution of livestock and poultry farm based on livestock manure nitrogen load on farmland and suitability evaluation. Comput. Electron. Agric. 2017, 139, 180–186. [Google Scholar] [CrossRef]
- Yang, N.; Chen, L.; Wang, W.; Shen, Z. The land carrying capacity and environmental risk assessment of livestock and poultry breeding considering crop planting. Environ. Sci. Pollut. Res. 2021, 28, 51356–51368. [Google Scholar] [CrossRef]
- Meng, X.; Zhou, H.; Zhang, J. Spatial and temporal characteristics and EKC verification for livestock pollution. J. Arid Land Resour. Environ. 2015, 29, 104–108. [Google Scholar] [CrossRef]
- Hollings, T.; Robinson, A.; van Andel, M.; Jewell, C.; Burgman, M. Species distribution models: A comparison of statistical approaches for livestock and disease epidemics. PLoS ONE 2017, 12, 19. [Google Scholar] [CrossRef] [Green Version]
- Chen, G.; Cao, H.; Ding, T.; Huo, W.; Pan, Y. Bearing Capacity of Livestock and Poultry Manure in Huang-Huai-Hai Region Based on Nitrogen and Phosphorus Farmland Utilization. J. Ecol. Rural Environ. 2021, 37, 714–723. [Google Scholar] [CrossRef]
- Yue, Z.; Huasheng, H.; Wenzhi, C.A.O.; Weiping, W.; Nengwang, C. GIS and BEHD based Farm Manure Evaluation and Its Spatial Optimization. Resour. Sci. 2006, 28, 25–29. [Google Scholar] [CrossRef]
- Wen, J.; Zhen, B.; Pu, Z.; Peng, X.; Tan, J.; Shao, Z.; Bao, B.; Ran, Z.; Gao, Q.; Deng, B. An improved method used for evaluating potential environmental pollution risk based on spatial distribution and density of farms. Environ. Sci. Pollut. Res. 2021, 28, 10564–10575. [Google Scholar] [CrossRef] [PubMed]
- Qiu, L.; Zhu, J.; Pan, Y.; Hu, W.; Amable, G.S. Multi-criteria land use suitability analysis for livestock development planning in Hangzhou metropolitan area, China. J. Clean. Prod. 2017, 161, 1011–1019. [Google Scholar] [CrossRef]
- Won, S.; Ahmed, N.; You, B.-G.; Shim, S.; Kim, S.-S.; Ra, C. Nutrient production from Korean poultry and loading estimations for cropland. J. Anim. Sci. Technol. 2018, 60, 3. [Google Scholar] [CrossRef] [Green Version]
- Wang, Y.; Pan, F.; Chang, J.; Wu, R.; Tibamba, M.; Lu, X.; Zhang, X. Effect and Risk Assessment of Animal Manure Pollution on Huaihe River Basin, China. Chin. Geogr. Sci. 2021, 31, 751–764. [Google Scholar] [CrossRef]
- Yan, B.; Yan, J.; Shi, W. Estimation of carrying capacity of livestock farm based on maximum phosphorus load of farmland and GIS spatial analysis technology. Curr. Sci. 2017, 112, 1931–1936. [Google Scholar] [CrossRef]
- Ouyang, W.; Hao, F.H.; Wei, X.F.; Huang, H.B. Spatial and temporal trend of Chinese manure nutrient pollution and assimilation capacity of cropland and grassland. Environ. Sci. Pollut. Res. 2013, 20, 5036–5046. [Google Scholar] [CrossRef]
- Li, J.; Liu, L. Determining the carrying capacity and environmental risks of livestock and poultry breeding in coastal areas of eastern China: An empirical model. Environ. Sci. Pollut. Res. 2020, 27, 7984–7995. [Google Scholar] [CrossRef]
- Li, Y.; Yan, B.; Yan, J.; Shi, W. Estimation of Carrying Capacity of Livestock and Poultry Based on RS and GIS: A Case in Minhou County, Fuzhou City. Pol. J. Environ. Stud. 2021, 30, 227–234. [Google Scholar] [CrossRef]
- Peng, L.H.; Chen, W.W.; Li, M.; Bai, Y.; Pan, Y.P. GIS-based study of the spatial distribution suitability of livestock and poultry farming: The case of Putian, Fujian, China. Comput. Electron. Agric. 2014, 108, 183–190. [Google Scholar] [CrossRef]
- Wu Kening, Z.R. Soil texture classification and its application in China. Soil J. 2019, 56, 227–241. [Google Scholar] [CrossRef]
- HJ/T 81—2001; PRC Technical Standard of Preventing Pollution for Livestock and Poultry Breeding. Ministry of Ecology and Environment: Beijing, China, 2001.
- Kohonen, T. Self-Organizing Maps; Springer: New York, NY, USA, 2001; Volume 30, Available online: https://h-s.link.springer.com.neau.vpn358.com/chapter/10.1007/978-3-642-56927-2_3 (accessed on 26 April 2022).
- Buckland, M. Kohonen’s Self Organizing Feature Maps; Springer: Berlin/Heidelberg, Germany, 2003; Available online: http://www.ai-junkie.com/ann/som/som1.html (accessed on 26 April 2022).
- Ni, M.; Cheng, H.; Lai, J. GAN-SOM: A clustering framework with SOM-similar network based on deep learning. J. Supercomput. 2021, 77, 4871–4886. [Google Scholar] [CrossRef]
- Czyzewska, M.; Szkola, J.; Pancerz, K. Towards Assessment of Innovativeness Economy Determinant Correlation: The Double Self-Organizing Feature Map Approach. Fundam. Inform. 2014, 129, 37–48. [Google Scholar] [CrossRef]
- Liu, B.L.; Li, G.; You, H.; Sui, M.R. Assessment of the surface water quality ranking in Mudan River using multivariate statistical techniques. Water Sci. Technol.-Water Supply 2015, 15, 606–616. [Google Scholar] [CrossRef]
- Pham, H.V.; Cooper, E.W.; Cao, T.; Kamei, K. Hybrid Kansei-SOM model using risk management and company assessment for stock trading. Inf. Sci. 2014, 256, 8–24. [Google Scholar] [CrossRef]
- Olkowska, E.; Kudłak, B.; Tsakovski, S.; Ruman, M.; Simeonov, V.; Polkowska, Z. Assessment of the water quality of Kłodnica River catchment using self-organizing maps. Sci. Total Environ. 2014, 476–477, 477–484. [Google Scholar] [CrossRef]
- Kudłak, B.; Tsakovski, S.; Simeonov, V.; Sagajdakow, A.; Wolska, L.; Namieśnik, J. Ranking of ecotoxisity tests for underground water assessment using the Hasse diagram technique. Chemosphere 2014, 95, 17–23. [Google Scholar] [CrossRef]
- Quintero, N.Y.; Bruggemann, R.; Restrepo, G. Ranking of 38 prokaryotes according to their uranium uptake capacity in aqueous solutions: An approach from order theory through the Hasse diagram technique. Toxicol. Environ. Chem. 2017, 99, 1242–1269. [Google Scholar] [CrossRef]
- Brüggemann, R.; Patil, G. Partial Order and Hasse Diagrams. In Ranking and Prioritization for Multi-indicator Systems; Environmental and Ecological Statistics; Springer: New York, NY, USA, 2011; pp. 13–23. Available online: http://h-s.link.springer.com.neau.vpn358.com/chapter/10.1007/978-1-4419-8477-7_2 (accessed on 26 April 2022).
- Brüggemann, R.; Münzer, B. A graph-theoretical tool for priority setting of chemicals. Chemosphere 1993, 27, 1729–1736. [Google Scholar] [CrossRef]
- Voigt, K.; Brüggemann, R.; Pudenz, S. A multi-criteria evaluation of environmental databases using the Hasse Diagram Technique (ProRank) software. Environ. Model. Softw. 2006, 21, 1587–1597. [Google Scholar] [CrossRef]
- Voyslavov, T.; Tsakovski, S.; Simeonov, V. Surface water quality assessment using self-organizing maps and Hasse diagram technique. Chemom. Intell. Lab. Syst. 2012, 118, 280–286. [Google Scholar] [CrossRef]
- Voyslavov, T.; Tsakovski, S.; Simeonov, V. Hasse diagram technique as a tool for water quality assessment. Anal. Chim. Acta 2013, 770, 29–35. [Google Scholar] [CrossRef] [PubMed]
- Carlsen, L.; Bruggemann, R.; Sailaukhanuly, Y. Application of selected partial order tools to analyze fate and toxicity indicators of environmentally hazardous chemicals. Ecol. Indic. 2013, 29, 191–202. [Google Scholar] [CrossRef]


Publisher’s Note: MDPI stays neutral with regard to jurisdictional claims in published maps and institutional affiliations. |
© 2022 by the authors. Licensee MDPI, Basel, Switzerland. This article is an open access article distributed under the terms and conditions of the Creative Commons Attribution (CC BY) license (https://creativecommons.org/licenses/by/4.0/).