1. Introduction
The EU and the EU countries have to reach by 2030 their Sustainable Development Goal 12.3 target to halve per capita food waste at the retail and consumer level, and reduce food losses (according to the EU actions against food waste). Around 88 million tons of food waste are delivered yearly in the EU. According to preliminary calculations, every EU citizen throws away about 173 kg of food every year that could still be consumed [
1]. For example, in Lithuania, the amount of food waste in the mixed municipal waste is about 15%, with an average of 41 kg of food waste per person per year; on the other hand. 75 million tons of bio-waste from municipal waste is created every year across Europe. It is crucial that recycling of bio-waste has to take place in order to meet the overall recycling target of 65% of municipal waste by 2035 [
2].
The problem of food waste is relevant throughout the food supply chain, from the production of agricultural products to storage, processing, transport, trade and consumption [
1]. Food waste poses environmental, ethical, and economical questions, and shows the need to change our food system.
Food waste prevention is included in the EU’s plan for a circular economy, which the European Commission defines as where “the value of products, materials and resources is maintained in the economy for as long as possible, and the generation of waste [is] minimised”. This strategy aims to improve competitiveness, promote sustainable growth, and create new jobs [
3].
The revised 2018 Waste Framework Directive adopted on 30 May aims to reduce and monitor food waste and report back regarding progress made. Therefore, Member States have to:
implement food waste prevention programs;
promote food donation and other redistribution, prioritizing human use over animal feed and the reprocessing into non-food products as part of measures taken to prevent waste generation;
deliver incentives for the application of the waste hierarchy, such as facilitation of food donation.
The crucial starting point of responsible consumption is awareness (behavior and attitude) of the impacts of consumption. Therefore, this paper aims to investigate whether people consume food responsibly.
The paper is presented in the following structure: the next section presents scientific analysis on the food waste issue. Then, research methods are described, and later main results and findings are presented. Finally, discussion and conclusions, with some suggestions for future research, close the paper.
2. Literature Review
Food waste is a global problem and it happens when food is left unused due to poor commercial appearance, or leftovers from uneaten food that are not composted. A common cause of food wastage is improper food storage—it spoils. Another is consumer shopping habits, and in some countries oversupply. Waste of food means any food lost due to spoilage or waste [
4,
5]. Thus, the term “wastage” encompasses both food loss and food waste [
6]. Food waste is defined as food lost in any food supply chain. The food is then discarded and not used for any other productive use, e.g., animal feed or seeds. The FUSIONS framework defines food waste as “food and inedible parts of food removed from the food supply chain” that is to be disposed of (e.g., crops ploughed back into the soil, left unharvested or incinerated, food disposed of in sewers or landfill sites, or fish discarded at sea) or used for nutrient recovery or energy generation (e.g., through composting, or anaerobic digestion and other bioenergy pathways) [
7]. Food is wasted in many ways, for example [
8]:
Fresh produce that deviates from what is considered optimal (e.g., size, shape or color) and is removed during sorting actions.
Foods that are discarded by retailers or consumers when they are close to or beyond the best before date.
Unused or leftover food that is thrown out from households or restaurants.
Food losses and waste also impact on other natural resources, many of which are scarce. Three key related resources are freshwater, cropland, and fertilizers [
9]. The problem of food wastage is multifaceted, ranging from the misuse of arable land, the financial loss to restaurants and hotels and the discarding of prepared meals by households, while counting the working time of employees in cooking [
10]. Another problem with food waste is that if food waste is not composted, it emits a lot of methane in landfills—more powerful greenhouse gases than even CO
2. Huge amounts of food emissions contribute to global warming and climate change. With agriculture accounting for 70 percent of global water consumption, food waste is also a huge waste of fresh and groundwater resources [
11].
Comparing the extent of food waste according to the level of development of countries, more unused food is discarded in economically stronger countries [
9]. However, there is also a significant amount of food wastage in developing countries, especially in the supply of food to retail chains. Researchers do not have exact data on how much unused food is lost to smallholder farms. Also, in developing countries, especially in Africa, storage losses on farms can be significant, although the exact nature of such losses is much debated [
9]. But, some research shows that consumers are becoming more socially conscious and are including ethical considerations in their purchase decisions [
12], as well as becoming increasingly interested in various forms of responsible consumption [
13]. Consumers have more product choices and, therefore, have more opportunities to reveal their social preferences when making purchase decisions.
Analyzing food waste by different food groups, the authors found that vegetables (24%) and fruit (22%), followed by cereals (12%), meat (11%) and oil crops (10%) accounted for the largest share of food waste. The fish and eggs food groups, which make up the smallest parts of the food supply chain, also generate the lowest quantities of food waste in absolute terms, despite the fact that much of these food groups (50% and 31%, respectively) go to waste [
14].
Based on the Lithuanian State Food and Veterinary Service [
1], unreasonable food waste is promoted by:
Improper planning of purchases and portions of food to be prepared;
Promotional shopping;
Lack of knowledge on how to use products marked with the terms ‘best before’ and ‘use by’;
Standard portions of meals in restaurants and canteens, too little for the consumer (half a portion) or not a whole portion (omitting any ingredient);
Challenges for restaurants, canteens, and other catering establishments in planning for the number of customers (surplus production);
Exceptional quality requirements and marketing rules for the shape, color, consistency, etc., of foodstuffs, in particular fruit, vegetables and pastries in retail trade;
Naturally occurring food surplus during the season;
Damage to the products or their packaging that does not affect safety during production, packaging or transport;
Improper storage/transportation of products;
Underestimation of production volumes, poor management of raw materials, and production surplus, etc.
Nowadays, the concept of sustainable consumption is becoming more and more a major interest of the population and the latter make more conscious food purchasing decisions [
15]. Indeed, increasing awareness towards environmental issues and climate change led society to the formation of sustainable consumption habits [
16]. However, Ganglmair-Wooliscroft and Wooliscroft [
17] argue that also external factors such as government regulations, business initiatives, and geographic characteristics determine consumers’ behavior, including food consumption as well as recycling.
On the other hand, Block et al. [
18] prove that consumers are often mistaken in estimating the consumption that is the basis of raising food waste. In the line with this, numerous initiatives have been launched in order to benefit from the remainder of these products. For instance, food waste valorization to hydrogen on the one hand reduces the harmful impact on nature, decreasing the quantity of spoiled food in the environment and, on the other hand, the alternative energy source is generated by transformation of biogas that can replace fossil fuel or produce electricity [
19,
20]. Additionally, it is economically feasible [
21].
According to [
22], the right tools for reducing food loss and waste have the potential to increase the sustainability of food supply chains. For this reason, authors suggest government to finance the relevant infrastructure for recycling disposed products and consumers’ education for shifting towards responsible consumption including earlier food donation. Similarly, Sundin et al. [
23] prove the environmental feasibility of food donation calculating a double of the benefit comparing to anaerobic digestion. Kumar and Dholakia [
24] see the huge role of the firms to change consumers’ behavior. Authors argue that firms have a power to promote innovative thinking, address consumers’ environmental identity as well as brand assurance, and edit consumers’ choices.
It is noteworthy that the COVID-19 pandemic has influenced consumers’ food purchase decisions, their management and consumption that, in turn, has reduced the household waste [
25,
26]. Nowadays, 81% of consumers make a list before shopping and check the expiration date of the product that is almost double of the number before pandemic [
27]. The increased awareness about food waste and its impact on the environment lead the reduction in the quantity of spoiled and thrown products even if purchases have increased during the COVID-19 pandemic [
28,
29,
30,
31].
In this context, as claimed by a recent research [
32], a holistic 4Es Ethical, Equity, Ecological and Economic approach can be useful for better handling food loss issues along the agri-food chain from upstream to consumers by changing the entrepreneur and consumer approaches. Finally, the spread of the pandemic has been leading society to re-think the manner in which we produce and consume food by facing new future green global challenges [
32,
33].
3. Research Methodology
The quantitative research method was used in the research. The questionnaire was prepared on the pollimill.com website, and the link was sent to respondents. Regarding the criteria, only those respondents who had an internet connection could participate in the study. The research was guided by ethical principles: the principle of goodwill is ensured by the statements of the questionnaire, which are presented in a respectful style, without creating preconditions for respondents to lose privacy; applying the principle of respect to the individual, the purpose of the study was explained to the respondents; volunteering is the free will of study participants to participate or not to participate in a study; research participants were guaranteed anonymity and data confidentiality. The collected empirical data were processed using the SPSS 20.00 (Klaipeda university, Klaipėda, Lithuania) (Statistical Package for the Social Sciences). The data processing descriptive statistics were used, such as percentiles, mean, mode, and standard deviation. The data were also processed by independent samples t-test where significant differences are when p ≤ 0.05. To assess the reliability, or internal consistency, of a set of scale, Cronbach’s alpha coefficient was used.
The research population. The questionnaire items are based on the analysis of scientific literature and EU strategy on sustainable consumption [
28,
31,
34,
35]. The survey was done in February and March 2022. The respondents were reached during the third pandemic period by means of internal research mailing lists of the University of Klaipeda and Foggia [
34,
35]. The goal was to get as many responses as possible from different European countries, but in this study we were only able to collect data from these countries. The study selected this kind of online research to survey consumers in a fast manner, thus assuring safety and security under pandemic conditions [
34,
35]. The items of the questionnaire were corroborated by a virtual focus of experts in the agri-food-sustainable field. The survey sample is composed of 1080 respondents. In this survey, 566 respondents from Lithuania and 514 from other European countries (Italy, Poland, Latvia, Germany and France) participated. A simple random sample was used in the research. This kind of sample is a subset of a statistical population in which each member of the subset has an equal probability of being chosen. Preferably, using random sampling, the sample size should be larger than a few hundred in order to allow a simple random sampling to be applied correctly. This method has been selected in order to get as much information as possible on the analyzed topic.
Principles of compiling the questionnaire. The questionnaire consisted of five-point ranking scale questions [
33]. First, we asked respondents where they usually buy food. The second and third questions in the questionnaire were designed to find out the respondents’ buying habits, how often they pay attention to certain aspects when shopping and how often they throw away certain types of uneaten food. Respondents rated the questions on a five-point ranking scale from 1 to 5, with 1—very often and 5—never. The four questions explain whether respondents compost the waste, and the last one explains responsible food consumption habits of respondents. For this question, respondents rated the statements on a five-point ranking scale from 1 to 5, with 1—strongly agree and 5—strongly disagree [
33].
The last four questions were designed to find out the demographics of the respondents, gender, age, monthly income and country of residence.
Demographic characteristics. The demographical data are provided in
Table 1. From the table we can see that 52.4% of the respondents were from Lithuania, and 47.6% of the respondents (from Latvia 4.6%, from Poland 12.7%, from Germany 2.3%, from Italy 18.5%, from France 9.4%) were from other EU countries (see
Table 1). As the number of respondents from different countries is quite different, the data will usually be analyzed together for other European countries, comparing the data with the Lithuanian data.
4. Results
The research evaluates the responsible food consumption habits in the daily life of Lithuanian and other European countries’ respondents. Respondents of the research had to evaluate items about shopping habits with a range scale, where 1 means that respondents very often do that, and 5—they never do that. For the assessment of the question scale internal consistency, Cronbach’s alpha coefficient was used, for a properly composed question scale should be greater than 0.7. In our case, Cronbach’s alpha coefficient value ranged from 0.733 to 0.946 (see
Table 2). A high Cronbach’s alpha coefficient means that the items in the questionnaire are highly correlated.
Analyzing respondents’ shopping habits, we submitted mean and
p value.
p value shows the significant differences between countries (significance level is
p ≤ 0.05) (see
Table 3). The standard deviation for the analyzed items ranges from 0.290 to 1.010.
The results show that the mean between Lithuania and other European countries are very similar, but shopping habits are quite different. Respondents were asked to evaluate their buying habits, how often they pay attention to certain aspects when shopping. Respondents rated the statements on a five-point ranking scale from 1 to 5, with 1—very often and 5—never. Research results reveal that most of the respondents only rarely buy products with a promotion, even if it was not in their plan (2.98); buy frozen food (mean 3.19) or shop as much as they need for the day (mean 3.33). Most of the respondents sometimes choose the foods advertised (mean 3.44); buy fast food products (processed, semi-finished) (mean 3.45) or buy products that are about to expire (because they are usually cheaper) (mean 3.60). Most of the respondents often plan purchases by making a list (mean 2.21); choosing foods and pay attention to the composition of the product (mean 2.20); choose foods of local origin (mean 2.19); buy fresh (unprocessed and not frozen) food (mean 1.99) and buy for a longer period (4–5 days) (mean 2.03) (see table).
The independent T sample test discloses the mean difference between country groups, significant data is in bold. The obtained data show that respondents from EU countries try to buy foods that are packaged in recyclable containers (p = 0.001 < 0.05); respondents from Lithuania prefer organic foods (p = 0.000 < 0.05). Respondents from EU countries are more likely to buy products with a promotion, even if it was not in their plan (p = 0.039 < 0.05). For a bigger part of respondents from Lithuania, the appearance of the product does not matter (p = 0.001 < 0.05). The Lithuanian respondents are more likely to choose foods of local origin (p = 0.000 < 0.05) and buy imported food (p = 0.001 < 0.05). The EU country respondents are more likely to buy fresh (unprocessed and not frozen) food compared with Lithuanian respondents (p = 0.017 < 0.05). For other items, country does not have a significant impact as the p-value is higher than 0.05, which indicates that there is no statistical difference.
If we look at the overall averages, the data ranges from 1.99 to 3.6 (mean). This shows that respondents are more likely to agree with the options available for purchase. The majority of respondents in both groups choose to buy fresh products and the minority buy products that will soon expire. It is interesting to note that in both groups, respondents said that they rarely choose the advertised products (average 3.44), which is somewhat surprising. This shows that respondents in the survey have an opinion about what they need when they go shopping, and it is difficult to change their opinion at the store. It is needed to mention that respondents from both groups go to the stores with a shopping list, plan to do so, and probably do not throw away unused food. Our respondents also look at the composition of the product and look if the packaging is recyclable.
We searched for whether there is a statistical relationship between the income received by the respondents and the place of shopping. However, no statistical dependencies have been identified. The responses of some higher-income respondents do not differ statistically from those of lower-income respondents. Respondents usually shop in supermarkets, it does not depend on the amount of income they receive. There is no statistical link between low-earning respondents growing their own vegetables or fruits.
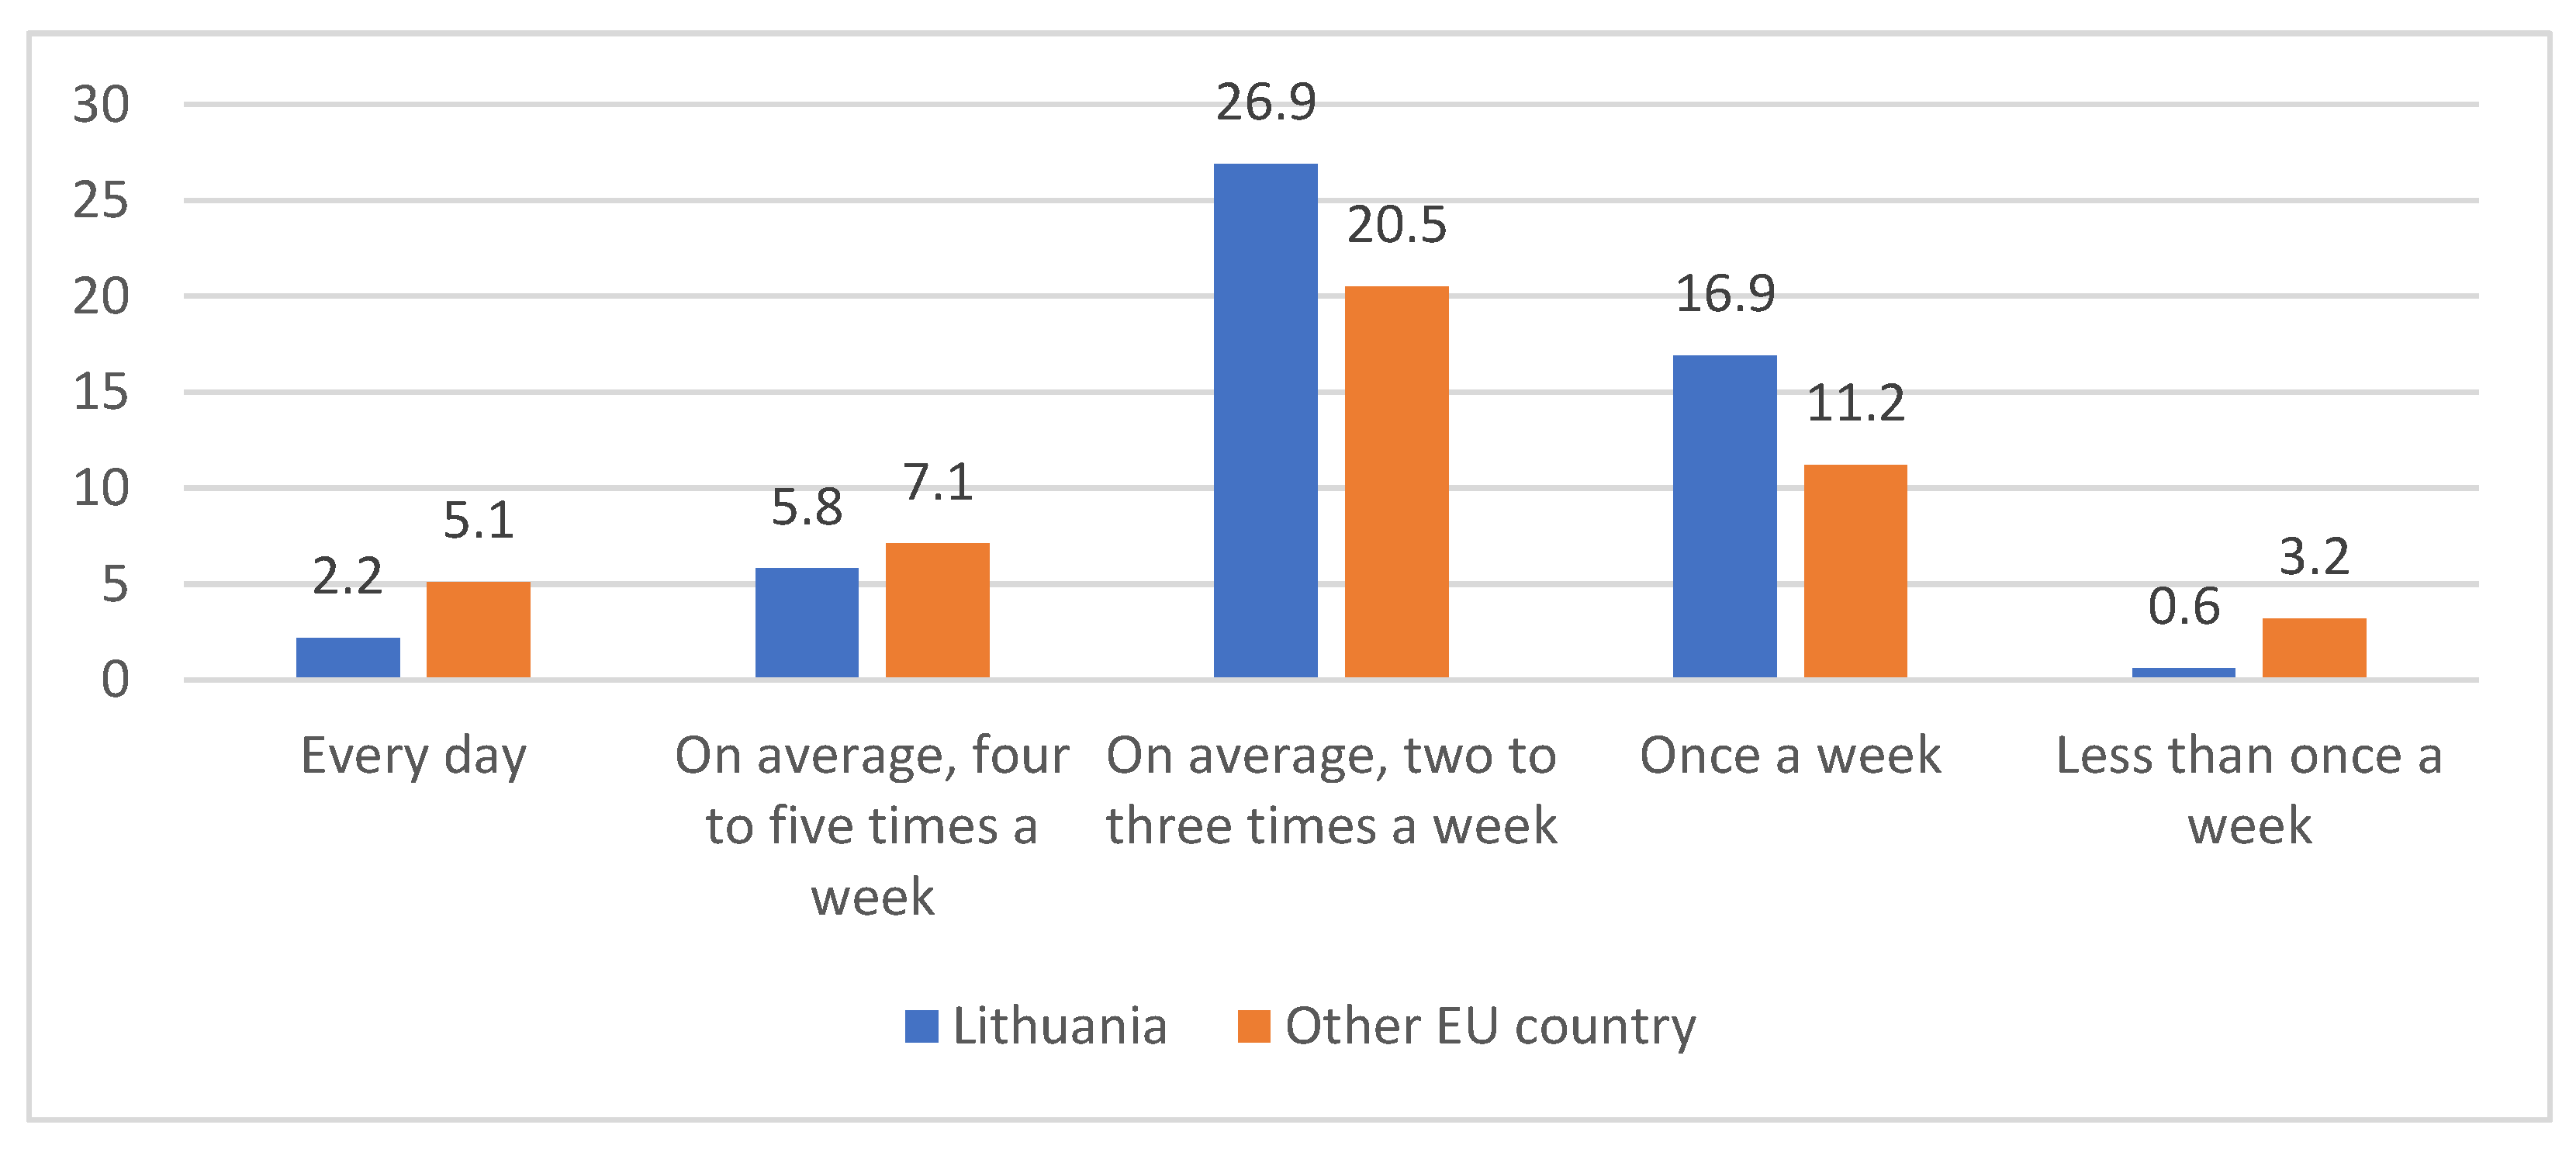
We were interested in how often respondents buy food. The results reveal that most of the respondents buy food on average two to three times a week (Lithuania 26.9%, other EU countries 20.5%) (
Figure 1). Also, a lot of respondents from Lithuania buy food once a week (16.9%). It is likely that the majority of respondents actually give priority to fresh produce when shopping several times per week, as mentioned in previous responses.
We searched for a statistical relationship between respondents’ income and shopping frequency. However, no statistical dependencies have been identified. The responses of some higher-income respondents do not differ statistically from those of lower-income respondents. Respondents usually shop two or three times a week, which does not depend on the amount of income they receive.
The research data reveal that respondents sometimes or never throw away food. The mean ranges from 3.10 to 4.41. The obtained data show that there are statistically significant differences between respondents from EU countries and Lithuania (
p = 0.000 < 0.05), analyzing the question of what products respondents throw away (see
Table 4). Respondents from Lithuania more often throw away bread products, fruits and vegetables, while respondents from European countries more often throw away dairy products, meat, fish, pasta, eggs and sweets compared to respondents living in Lithuania. Both groups of respondents throw away eggs the least. These responses are also consistent with the responses where we asked respondents about their shopping habits, showing that respondents do not usually buy unplanned groceries.
It is quite a big problem when people make unnecessary food, buy unplanned or order too much food in restaurants or cafés and do not consume it, and then they just throw it away. We asked respondents to evaluate some statements related with this. The research data reveal that the respondents are quite sustainable consumers, they disagree with most statements and the mean ranges from 2.57 to 4.10 (see
Table 5). Significant differences between two groups of respondents are seen in four statements. Research results show that respondents from European countries are less likely to order too much food in cafes than respondents living in Lithuania, however, these differences are very small. The Lithuanian population is less likely to use food products that have an expiration date and are less likely to buy products at a discount, although they do not consume them later and discard food less often depending on the seasonality of the year.
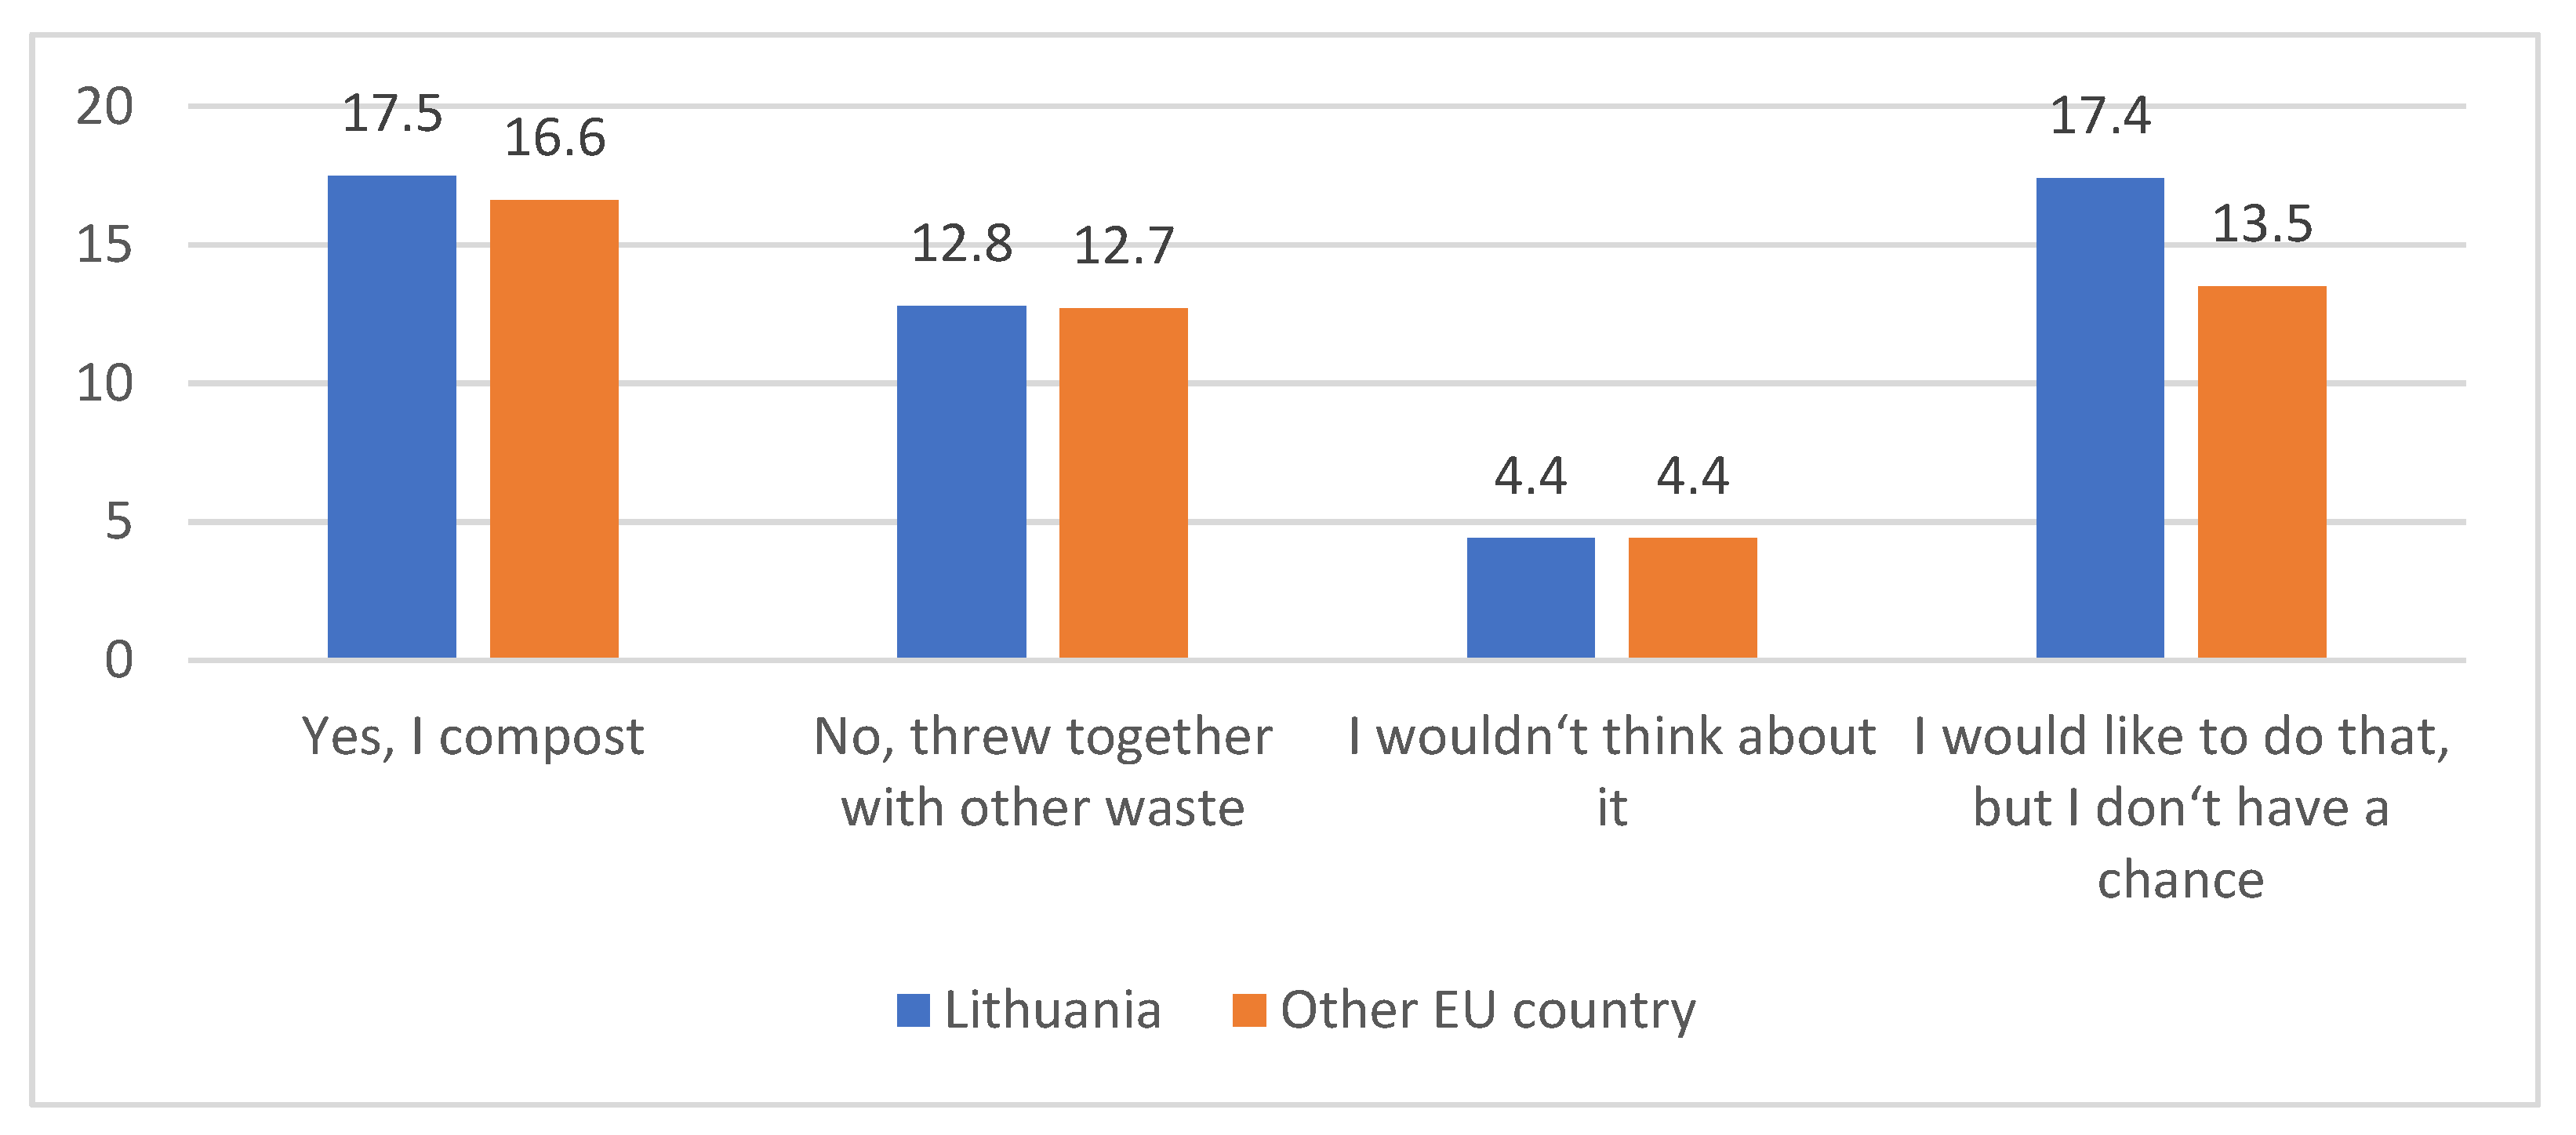
The results revealed that only about 17 percent of respondents compost food waste (Lithuania 17.5%; Europe 16.6%) (
Figure 2). About 13 percent of respondents threw it together with other waste. A total of 4.4 percent of respondents would not think about it. A total of 17.4 percent of Lithuanian respondents and 13.5 percent of respondents from Europe would like to do it, but do not have a chance.
Assessing the answers of both groups, it can be seen that a part of the respondents compost food; a large part of respondents would like to do it, but do not have the chance. In reality, only 34.3 percent of respondents are not worried about it and it is not relevant for them. We think the results are really promising. It is clear that it is important for the majority of respondents in the study not to waste food, while at the same time taking care of food waste disposal. It is likely that some live in apartments where composting is more difficult. Composting is an important element in sustainable waste management.
5. Discussion
Wasting food causes environmental and economic inefficiencies. It affects climate change, emissions, availability of natural resources, deterioration of land conditions, global hunger and can even be an underlying reason for an economic collapse [
36]. The European Commission is taking the issue of tackling food waste very seriously. Reducing food waste has enormous potential for reducing the resources we use to produce the food we eat. Being more efficient will save food for human consumption, save money and lower the environmental impact of food production and consumption (EU actions against food waste).
This paper contributes to current debates on food waste management [
10,
14,
37] by illustrating empirically what negative problems arise from unsustainable food waste.
To this aim, we conducted a study and assessed the food consumption habits of the European population. We compared the results with Lithuanian food consumption habits. This study allows to identify the respondents’ shopping habits and the main problems of food consumption in the EU.
Excessive purchasing, over-preparation and unwillingness to consume leftovers are some of the main antecedents of food waste [
11]. Part of the population does not even know that their actions are harmful to the environment and influence the economic circumstances negatively, which can be caused due to their cultural mindset, different traditions and certain everyday consumption routines. Therefore, having an educational intervention to increase consumers’ awareness of the importance of green consumption enhances the general approach towards food management, its preparation and planning processes, which results in a remarkable decrease in food loss and waste levels [
36,
38]. Unreasonable food waste is promoted by improper planning of purchases and portions of food to be prepared, promotional shopping and so on [
1]. Our study highlights that respondents are quite responsible, they do not make too much food and usually in a café/restaurant they order as much food as they can eat, but sometimes buy unplanned products at a discount.
In line with other research [
11,
14], we found that fruit and vegetables are the product group most commonly wasted. The fish and eggs food groups, which make up the smallest parts of the food supply chain, also generate the lowest quantities of food waste in absolute terms, despite the fact that much of these food groups (50% and 31%, respectively) go to waste [
14,
39]. The survey data also revealed that fish, eggs, grains and pasta are wasted less in the food supply chain.
Our findings also reveal that shopping habits of the respondents are quite different. Based on some research, customer shopping habits changed during the pandemic and unplanned shopping increased [
34]. Our study revealed that the majority of the respondents go shopping for food two or three times per week, they plan purchases by making a list. It is very important to shop smartly and realistically [
11].
Composting is an important element in sustainable waste management [
40,
41,
42]. We find out that most of the respondents do not compost food, but would like to do that. In Lithuania, the amount of food waste in the mixed municipal waste is about 15%, with an average of 41 kg of food waste per person per year. Across the European Union, somewhere between 118 and 138 million tons of bio-waste arise annually, of which currently only about 40% (equivalent to 47.5 million tons per annum) is effectively recycled into high-quality compost and digestate [
43].
6. Conclusions
The survey found that the majority of respondents state that food is not often wasted. This makes it a little more optimistic that global food waste and sorting problems will be addressed through people’s awareness and real action efforts. The results of our survey show that the population of Lithuania emits slightly less food than the population of the European countries participating in the survey. Clearly, food wastage is not just a problem of family-specific intolerance, it is a global food security problem. This problem is directly linked to climate change, waste sorting and recycling, and other global ecological and economic or social problems. It is possible to notice the crucial role of educating and informing people. This should be the responsibility of national governments when allocating funds to educational programs. These programs should cover all age groups, from kindergarten to advertisements, flyers and conversations with adults. Adults would probably best understand and stimulate economic interest, with an emphasis on saving food and then composting food waste, because, unfortunately, not all adults are able to adequately assess the effects of climate change and their food supply needs. Consumers should also purchase food avoiding shopping routines and try to plan their food basket more so that they do not end up wasting edible food. On the other hand, generally, there are not many messages towards sustainable consumption in the majority of retailers; the most famous food retailers arrange communication strategies starting from their commercial goals rather than toward a zero-waste responsible behavior [
44].
However, in line with recent research [
25,
26], it is possible to notice that the COVID-19 pandemic has affected consumer food habits, their management and consumption that, in turn, has reduced the household waste. Nowadays, most consumers try to define a meal list before shopping [
27]. This increased awareness about food waste and its impacts on the environment helps reduce the quantity of spoiled and thrown products even if purchases have increased during the COVID-19 pandemic [
28,
29,
30,
31].
In line with [
22], results highlight that adequate tools for reducing food loss and waste can become crucial to make green food supply chains. If, on one hand, it is relevant to implement infrastructures for recycling disposed products, on the other hand, training and education can shift habits towards responsible consumption as well as ethical consumption (i.e., by means of donations and food banks).
One of the best uses of discarded food is feeding livestock, saving precious resources that would have otherwise been used for producing commercial feed. If the food cannot be reused at all, we should at least try to recycle or compost it in a responsible manner instead of sending it to the landfills where it continues to rot [
11]. The draft State Waste Prevention and Management Plan 2021–2027 by the Ministry of Environment of Lithuania defines tasks and goals for implementing separate collection of food and kitchen waste by 31 December 2023. High-quality compost used in agriculture has to be made from the separately collected bio-waste, and the restoration of areas for the preparation of energy plant media has to be vulnerable [
45]. However, some findings show that people do not try to compost food and throw it away with other waste. The benefits of composting are significant: through composting, the quantity of garbage direct to the landfill is reduced, the organic matter is reused rather than dumped and it is recycled into a useful soil.
Composting can be defined as natural processes of recycling organic products such as leaves and food scraps into fertilizers that can enrich soil and plants. Recycling food and other organic waste into compost provides a range of environmental benefits, including improving soil health, decreasing greenhouse gas emissions, recycling nutrients, and mitigating the impact of climate changes. Composting can appear as much as an art as a science. Recent research and policies about managing wastes and producing food in an environmental way highlight a new interest in small-scale backyard composting as well as an interest in developing large-scale commercial and municipal composting systems.
Regarding research limitations, it can be noticed that only those respondents who use an internet connection and in the network of authors could participate in the study due to COVID-19 restrictions. The study makes uses also of a random selection of the respondents, so in the future it would be useful to do research that would cover all age groups and other demographical characteristics.
Future research direction aims to repeat the survey with as many European respondents as possible, to assess and understand food consumption habits and knowledge in the food waste chain and to make the widest possible range of consumers aware of the consequences of irresponsible food waste.
Author Contributions
Conceptualization, M.F., J.P. and L.Š.; methodology, M.F., J.P. and L.Š.; software, J.P. and L.Š.; validation, J.P. and L.Š.; formal analysis, J.P. and L.Š.; investigation, M.F., J.P. and L.Š.; resources, M.F., J.P. and L.Š; data curation, J.P.; writing—original draft preparation, M.F., J.P. and L.Š.; writing—review and editing, M.F., J.P. and L.Š.; visualization, J.P.; supervision, M.F. and L.Š.; project administration, L.Š.; funding acquisition, M.F. All authors have read and agreed to the published version of the manuscript.
Funding
This research received no external funding.
Institutional Review Board Statement
The study was conducted in accordance with the Declaration of Helsinki.
Informed Consent Statement
Informed consent was obtained from all subjects involved in the study.
Data Availability Statement
The data that support the findings of this study are available on request from the co-author J.P.
Conflicts of Interest
The authors declare no conflict of interest.
References
- State Food and Veterinary Service. Available online: https://vmvt.lt/maisto-sauga/maisto-sauga-ir-kokybe/maisto-svaistymas-ir-parama-maistu (accessed on 10 May 2022).
- EEA. Bio-Waste in Europe—Turning Challenges into Opportunities. 2020. Available online: https://www.eea.europa.eu/publications/bio-waste-in-europe (accessed on 6 June 2022).
- EIT Food. Available online: https://www.eitfood.eu/ (accessed on 6 June 2022).
- Wells, H.F.; Hyman, J.; Buzby, J.C. Estimated Amount, Value, and Calories of Postharvest Food Losses at Retail and Consumer Levels in the United States; Economic Research Service: Washington, DC, USA, 2014. [Google Scholar]
- Fiore, M.A.; Contò, F.; Pellegrini, G. Reducing Food Losses: A (Dis)-Opportunity Cost Model. Riv. Studi Sulla Sostenibilità 2015, 2015, 151–166. [Google Scholar]
- FAO. Food Wastage Footprint, Summary Report; FAO: Rome, Italy, 2013. [Google Scholar]
- FUSIONS. Available online: http://www.eu-fusions.org/index.php/about-foodwaste/280-food-waste-definition (accessed on 10 April 2022).
- FAO. Food Loss and Waste Database. Available online: https://www.fao.org/platform-food-loss-waste/flw-data/en/ (accessed on 3 May 2022).
- Kummu, M.; de Moel, H.; Porkka, M.; Siebert, S.; Varis, O.; Ward, P.J. Lost food, wasted resources: Global food supply chain losses and their impacts on freshwater, cropland, and fertiliser use. Sci. Total Environ. 2012, 438, 477–489. [Google Scholar] [CrossRef] [PubMed]
- Cordova-Buiza, F.; Paucar-Caceres, A.; Quispe-Prieto, S.C.; Rivera-Garré, A.P.; Huerta-Tantalean, L.N.; Valle-Paucar, J.E.; Ponce de León-Panduro, C.V.; Burrowes-Cromwell, T. Strengthening Collaborative Food Waste Prevention in Peru: Towards Responsible Consumption and Production. Sustainability 2022, 14, 1050. [Google Scholar] [CrossRef]
- Parameshwari, S. Impact of food waste and its effect on environment. Int. J. Food Sci. Nutr. 2017, 2, 184–187. [Google Scholar]
- Predergast, G.P.; Tsang, A.S.L. Explaining socially responsible consumption. J. Consum. Mark. 2019, 361, 146–154. [Google Scholar] [CrossRef]
- Schrader, U. The moral responsibility of consumers as citizens. Int. J. Innov. Sustain. Dev. 2007, 2, 79–96. [Google Scholar] [CrossRef]
- Caldeira, C.; Laurentiisa, V.; Corradoa, S.; Holsteijnb, F.; Salaa, S. Quantification of food waste per product group along the food supply chain in the European Union: A mass flow analysis. Resour. Conserv. Recycl. 2019, 149, 479–488. [Google Scholar] [CrossRef]
- Nagarajan, M.; Saha, R.; Kumar, R.; Sathasivam, D. Impact of peer influence and environmental knowledge on green consumption: Moderated by price premium. Int. J. Soc. Ecol. Sustain. Dev. 2022, 13, 16. [Google Scholar] [CrossRef]
- Venghaus, S.; Henseleit, M.; Belka, M. The impact of climate change awareness on behavioral changes in Germany: Changing minds or changing behavior? Energy Sustain. Soc. 2022, 12, 8. [Google Scholar] [CrossRef]
- Ganglmair-Wooliscroft, A.; Wooliscroft, B. An investigation of sustainable consumption behavior systems—Exploring personal and socio-structural characteristics in different national contexts. J. Bus. Res. 2022, 148, 161–173. [Google Scholar] [CrossRef]
- Block, L.; Vallen, B.; Paul Austin, M. Food waste (mis)takes: The role of (mis)perception and (mis)estimation. Curr. Opin. Psychol. 2022, 46, 101327. [Google Scholar] [CrossRef]
- Cudjoe, D.; Zhu, B.; Wang, H. Towards the realization of sustainable development goals: Benefits of hydrogen from biogas using food waste in China. J. Clean. Prod. 2022, 360, 132161. [Google Scholar] [CrossRef]
- Parra-Orobio, B.A.; Correa-Betancourt, M.A.; Lozano-Messa, M.T.; Foronda-Zapata, K.Y.; Marmolejo-Rebellón, L.F.; Torres-Lozada, P. Influence of Storage Time of Food Waste on the Substrate Characteristics and Energetic Potential Through Anaerobic Digestion. Water Air Soil Pollut. 2022, 233, 16. [Google Scholar] [CrossRef]
- Cudjoe, D.; Chen, W.; Zhu, B. Valorization of food waste into hydrogen: Energy potential, economic feasibility and environmental impact analysis. Fuel 2022, 324, 124476. [Google Scholar] [CrossRef]
- Dong, W.; Armstrong, K.; Jin, M.; Nimbalkar, S.; Guo, W.; Zhuang, J.; Cresko, J. A framework to quantify mass flow and assess food loss and waste in the US food supply chain. Commun. Earth Environ. 2022, 3, 83. [Google Scholar] [CrossRef]
- Sundin, N.; Osowski, C.P.; Strid, I.; Eriksson, M. Surplus food donation: Effectiveness, carbon footprint, and rebound effect. Resour. Conserv. Recycl. 2022, 181, 106271. [Google Scholar] [CrossRef]
- Zakarya, I.A.; Rashidy, N.A.; Izhar, T.N.T.; Ngaa, M.H.; Laslo, L. A Comparative Study on Generation and Composition of Food Waste in Desa Pandan Kuala Lumpur During COVID-19 Outbreak. In Proceedings of the 3rd International Conference on Green Environmental Engineering and Technology, Virtually, 8–9 September 2021; Springer: Berlin/Heidelberg, Germany, 2022; pp. 59–68. [Google Scholar] [CrossRef]
- Kumar, B.; Dholakia, N. Firms enabling responsible consumption: A netnographic approach. Mark. Intell. Plan. 2020, 40, 289–309. [Google Scholar] [CrossRef]
- Scacchi, A.; Catozzi, D.; Boietti, E.; Bert, F.; Siliquini, R. COVID-19 Lockdown and Self-Perceived Changes of Food Choice, Waste, Impulse Buying and Their Determinants in Italy: QuarantEat, a Cross-Sectional Study. Foods 2021, 10, 306. [Google Scholar] [CrossRef]
- Nicewicz, R.; Bilska, B. Analysis of Changes in Shopping Habits and Causes of Food Waste Among Consumers Before and During the COVID-19 Pandemic in Poland. Environ. Prot. Nat. Resour. 2021, 32, 8–19. [Google Scholar] [CrossRef]
- Pappalardo, G.; Cerroni, S.; Nayga, R.M., Jr.; Yang, W. Impact of COVID-19 on Household Food Waste: The Case of Italy. Front. Nutr. 2020, 7, 585090. [Google Scholar] [CrossRef]
- Marotta, G.; Nazzaro, C. Public goods production and value creation in wineries: A structural equation modelling. Br. Food J. 2020, 122, 1705–1724. [Google Scholar] [CrossRef]
- Lerro, M.; Vecchio, R.; Nazzaro, C.; Pomarici, E. The growing (good) bubbles: Insights into US consumers of sparkling wine. Br. Food J. 2019, 122, 2371–2384. [Google Scholar] [CrossRef]
- Šimanskienė, L.; Paužuolienė, J.; Fiore, M.; Župerkienė, E. Responsible Consumption: Society Habits in Time of Crisis. In Palgrave Studies in Cross-Disciplinary Business Research, In Association with EuroMed Academy of Business; Springer: Berlin/Heidelberg, Germany, 2022; pp. 281–304. [Google Scholar]
- Fiore, M. Food loss and waste: The new buzzwords. Exploring an evocative holistic 4Es model for firms and consumers. EuroMed J. Bus. 2020, 16, 526–543. [Google Scholar] [CrossRef]
- Menold, N.; Wolf, C.; Bogner, K. Design aspects of rating scales in questionnaires. Math. Popul. Stud. 2018, 25, 63–65. [Google Scholar] [CrossRef]
- Alaimo, L.S.; Fiore, M.; Galati, A. Measuring consumers’ level of satisfaction for online food shopping during COVID-19 in Italy using POSETs. Socio-Econ. Plan. Sci. 2021, 82, 101064. [Google Scholar] [CrossRef] [PubMed]
- Alaimo, L.S.; Fiore, M.; Galati, A. How the COVID-19 Pandemic Is Changing Online Food Shopping Human Behaviour in Italy. Sustainability 2020, 12, 9594. [Google Scholar] [CrossRef]
- Adamashvili, N.; Chiara, F.; Fiore, M. Food Loss and Waste, a global responsibility?! Food Econ. 2019, 21, 825–846. [Google Scholar] [CrossRef]
- Directive (EU) 2018/851 of the European Parliament and of the Council of 30 May 2018 Amending Directive 2008/98/EC on Waste. Available online: https://eur-lex.europa.eu/legal-content/EN/TXT/PDF/?uri=CELEX:32018L0851&from=EN (accessed on 6 June 2022).
- Romani, S.; Grappi, S.; Bagozzi, R.P.; Barone, A.M. Domestic food practices: A study of food management behaviors and the role of food preparation planning in reducing waste. Appetite 2018, 121, 215–227. [Google Scholar] [CrossRef]
- European Commission’s Knowledge Center for Bioeconomy. 2020. Available online: https://ec.europa.eu/knowledge4policy/bioeconomy (accessed on 15 May 2022).
- Slater, R.A.; Frederikson, J. Composting municipal waste in the UK: Some lessons from Europe. Resour. Conserv. Recycl. 2001, 32, 359–374. [Google Scholar] [CrossRef]
- EU Actions against Food Waste. Available online: https://ec.europa.eu/food/safety/food-waste/eu-actions-against-food-waste_en (accessed on 6 June 2022).
- Bernstad, A.; Jansen, J. Review of comparative LCAs of food waste management systems—Current status and potential improvements. Waste Manag. 2012, 32, 2439–2455. [Google Scholar] [CrossRef]
- Siebert, S.; Gilbert, J.; Jürgensen, M.R. Compost Production in Europe. Available online: https://www.compostnetwork.info/wordpress/wp-content/uploads/190823_ECN-Compost-Production-in-Europe_final_layout-ECN.pdf (accessed on 6 June 2022).
- Fiore, M.; Conte, A.; Contò, F. Retailers towards zero-waste: A walkthrough survey in Italy, Special Issue. Ital. J. Food Sci. SLIM 2015, 2016, 92–97. [Google Scholar]
- Ministry of Environment of the Republic of Lithuania. Available online: https://am.lrv.lt/en/ (accessed on 15 May 2022).
| Publisher’s Note: MDPI stays neutral with regard to jurisdictional claims in published maps and institutional affiliations. |
© 2022 by the authors. Licensee MDPI, Basel, Switzerland. This article is an open access article distributed under the terms and conditions of the Creative Commons Attribution (CC BY) license (https://creativecommons.org/licenses/by/4.0/).


