Article

Distinctive Features of Composts of Different Origin: A Thorough Examination of the Characterization Results

1
Centre of Chemistry, Department of Chemistry, Campus de Gualtar, University of Minho, 4710-057 Braga, Portugal
2
Cross-Disciplinary Research Centre in Environmental Technologies (CRETUS), Department of Physical Chemistry, University of Santiago de Compostela, 15782 Santiago de Compostela, Spain
3
Centre of Molecular and Environmental Biology (CBMA), Department of Biology, University of Minho, Campus de Gualtar, 4710-057 Braga, Portugal
4
Cross-Disciplinary Research Centre in Environmental Technologies (CRETUS), Department of Soil Science and Agricultural Chemistry, University of Santiago de Compostela, 15782 Santiago de Compostela, Spain
5
Campus Campo Mourão (UTFPR-CM), Universidade Tecnológica Federal do Paraná, Campo Mourão 87301-006, Paraná, Brazil
6
Laboratoire Interdisciplinaire des Environnements Continentaux (LIEC), Université de Lorraine/CNRS, UMR 7360, F-54000 Nancy, France
*
Author to whom correspondence should be addressed.
Sustainability 2022, 14(12), 7449; https://doi.org/10.3390/su14127449
Submission received: 1 May 2022 / Revised: 2 June 2022 / Accepted: 15 June 2022 / Published: 17 June 2022

Abstract

:
The potential of composts produced from different origin residues to be used in environmentally friendly agriculture is addressed in this work. Seven composts obtained from different raw materials and composting methodologies are compared using elemental, thermal and spectroscopic characterization data. Despite the stabilization of the organic matter in all composts being adequate for agricultural applications, they display distinct elemental and structural compositions. Likewise, the fertilisers have very different effects on lettuce growth. Despite the observed differences, some common features were found, namely a mass loss (TGA) of 25.2 g per mol C, association between groups of elements (Fe, Al, Ni, Co, Cr, Cu and S; Mg, Na, K and P, C, Coxi, N and Pb) and correlations between the amount of carbon nanostructures and the characteristic aromaticity parameters. These results suggest that the tuning of the compost features for specific cultures may be possible for sustainable food production.

Graphical Abstract

1. Introduction

Agricultural practices have experienced profound changes to give answers to economic and societal challenges posed to mankind through time. Presently, in addition to the expected increase in food demand (from 59% to 98% between 2005 and 2050) [1], agriculture needs to align its strategies with the Sustainable Development Goals [2].
The use of compost and the adoption of no-till farming practices are currently implemented by an increasing number of farmers that aim to respond to a growing demand for organic foods by more informed consumers. These farming practices contribute to global environment protection, e.g., improve water retention and CO2 fixation [3,4]. Besides the numerous advantages of using compost for soil and crops [5], composting is an environmentally friendly solution for sustainable organic waste management. This solution is of increased importance in view of the predictable increase in waste production at a global scale (from 2.01 billion tonnes in 2016 to 3.40 billion tonnes in 2050) [6].
Worldwide, only 19% of the waste is recovered through recycling and composting and 11% is treated by incineration [6], but almost 40% is still disposed of in landfills with high negative impacts to the environment. However, there are increasing restrictions to the disposal of the organic fraction of municipal solid waste, which represents a fraction of 44% of the total waste production [6]. In Europe, several directives (e.g., Directive (EU) 2018/851, Directive 2008/98/EC) [7,8] suggest that the prevention or reduction in waste production and the recovery of waste through recycling, re-use or reclamation needs to be encouraged.
Compost can be produced from an important diversity of waste materials, e.g., from food, agriculture, forest, algae or sewage sludge [9]. Furthermore, composting can be carried out by vermicomposting or by aerobic digestion, which, in turn, can be carried out using different methodologies. These include a large variety of composting approaches, from the most rudimentary domestic composting to the industrial composting, in pile or in tunnel [10,11,12,13]. There is evidence indicating that compost features are affected by the nature of raw materials and composting process, although there is no absolute agreement between the different authors as to how the properties of the compost are directly related to its origin. The deepening of this knowledge could be of great importance for the development of the compost recipes fitted to specific crops.
The impact of the sort of raw materials and composting methods has been studied in assays performed on the compost [14,15,16]. The studies based on the characterization of compost may use single characterization techniques, such as elemental characterization [17,18,19] or TGA [20], or on more than one characterization technique, combining elemental characterization information with thermogravimetric results [21,22]; spectroscopic data [21,23]; physico-chemical parameters, including water retention and particle size [24,25,26,27,28]; chemometric analyses [23,24,29] or plant growth assays [26,27,30]. In a study with three composts and three vermicomposts, authors found that the C/N ratio was lower for vermicomposts [21]. By FTIR, certain differences were noticed between the spectra from composts obtained from different feedstock. These differences were detected in specific wavenumbers, depending on the nature of the feedstock. By TGA it was noticed that vermicomposts showed larger residues. Using a principal component analysis (PCA), results from 21 composts and 7 vermicomposts were analysed. Authors identified the total N, TOC, pH and the germination index as the most relevant parameters but were not able to discriminate the samples from the different composting methodologies [31]. No significant differences were found in 12 of the 17 chemical parameters analysed in 27 samples of the home-composting and 25 samples of the industrial composting. However, the contents of Cu and Ni were higher in the industrial compost and the values of the C/N ratio were higher for the home-composting samples [17].
Some trends were observed in certain characterization parameters of the compost related to the nature of the feedstock. For example, the nitrogen content was reported to be higher for composts prepared from manure [27]. An association is also made between the urban biowastes and a low content of heavy metals in compost, particularly regarding Fe, Zn, Cu, Mn and Ni and between the sewage sludge and the high contents of Pb, Cr and of N, P, K, S, Ca, Mg and Na [26]. The algae wastes were associated with low values of C/N ratio and high contents in Cd [19]. The presence of green wastes was shown to influence the C/N ratio of the compost, although this effect is not consensual. In some studies, this type of raw material is associated with an increased value of C/N [25,27,29], whereas in another study it was reported the opposite [18]. With respect to the content of heavy metals, lower amounts of Cd, Pb and Ni are associated with green wastes [25]. Regarding the essential nutrients content, lower values of N, P and K were associated with green wastes [25], although the content of K was reported to be beneficially affected by the presence of this type of raw material [18]. Green waste composts were also associated with high levels of the nutrients Na, Mg and Ca [18] and simultaneously with a low content of organic matter [27].
There are few works that relate results from plant growth assays to the compost origin. Whereas seed germination and plant root growth were reported to be inhibited by compost from sewage sludge [26], seed germination was reported to be improved by composts from manure and domestic wastes [30]. In a plant growth study using cucumber, an increase in the weight of the fresh fruit was noticed when compost containing manure was used [27].
Due to the high number of parameters from a large number of techniques that are required for a thorough characterization and comparison of different composts, we are seeking to establish correlations between the composition of composts, their properties and origin, i.e., feedstock and composting process. These correlations contribute to simplifying the characterization task, reducing the number of analyses to be performed. In addition, the key parameters to differentiate composts of different origin are identified.

2. Materials and Methods

2.1. Identification of the Samples

The compost samples used in this study were produced from a diversity of raw materials (e.g., food waste, manure, algae, sludge from urban wastewater treatment) and through different composting processes: at an industrial level in a tunnel composting system, in a pile composting system, a vermicomposting system and a domestic composting system. The feedstock was predominantly of plant origin in CVDW, CDDW and CUW, while manure was incorporated in CVA, CLW and CSS, sewage sludge in CSS and algae in CVA and CA. The information regarding the origin of the samples (identification, abbreviation, composting procedure and raw material) is compiled in Table 1. An organic fertiliser (100% animal waste, mainly chicken manure), commonly used in agriculture, was also included in the study for comparative purposes.

2.2. Physico-Chemical Characterization

2.2.1. Elemental Characterization

The main physico-chemical characteristics of the compost samples were determined following standard methodologies for this type of materials. The C, H, N and S contents were determined with an elemental analyser (CHN-1000, Leco SC-144DR, TruSpec, St. Joseph, MI, USA). Oxidizable C was determined by the Sauerlandt’s method [32]. The total concentrations of the major elements were determined by ICP-OES (Optima 3300DV, Perkin-Elmer, Waltham, MA, USA) after acid digestion with aqua regia. The total concentration of P was determined in the digested compost samples by the molybdenum blue method [33]. The cation exchange capacity (CEC) was evaluated using an extraction solution of ammonium chloride [34].

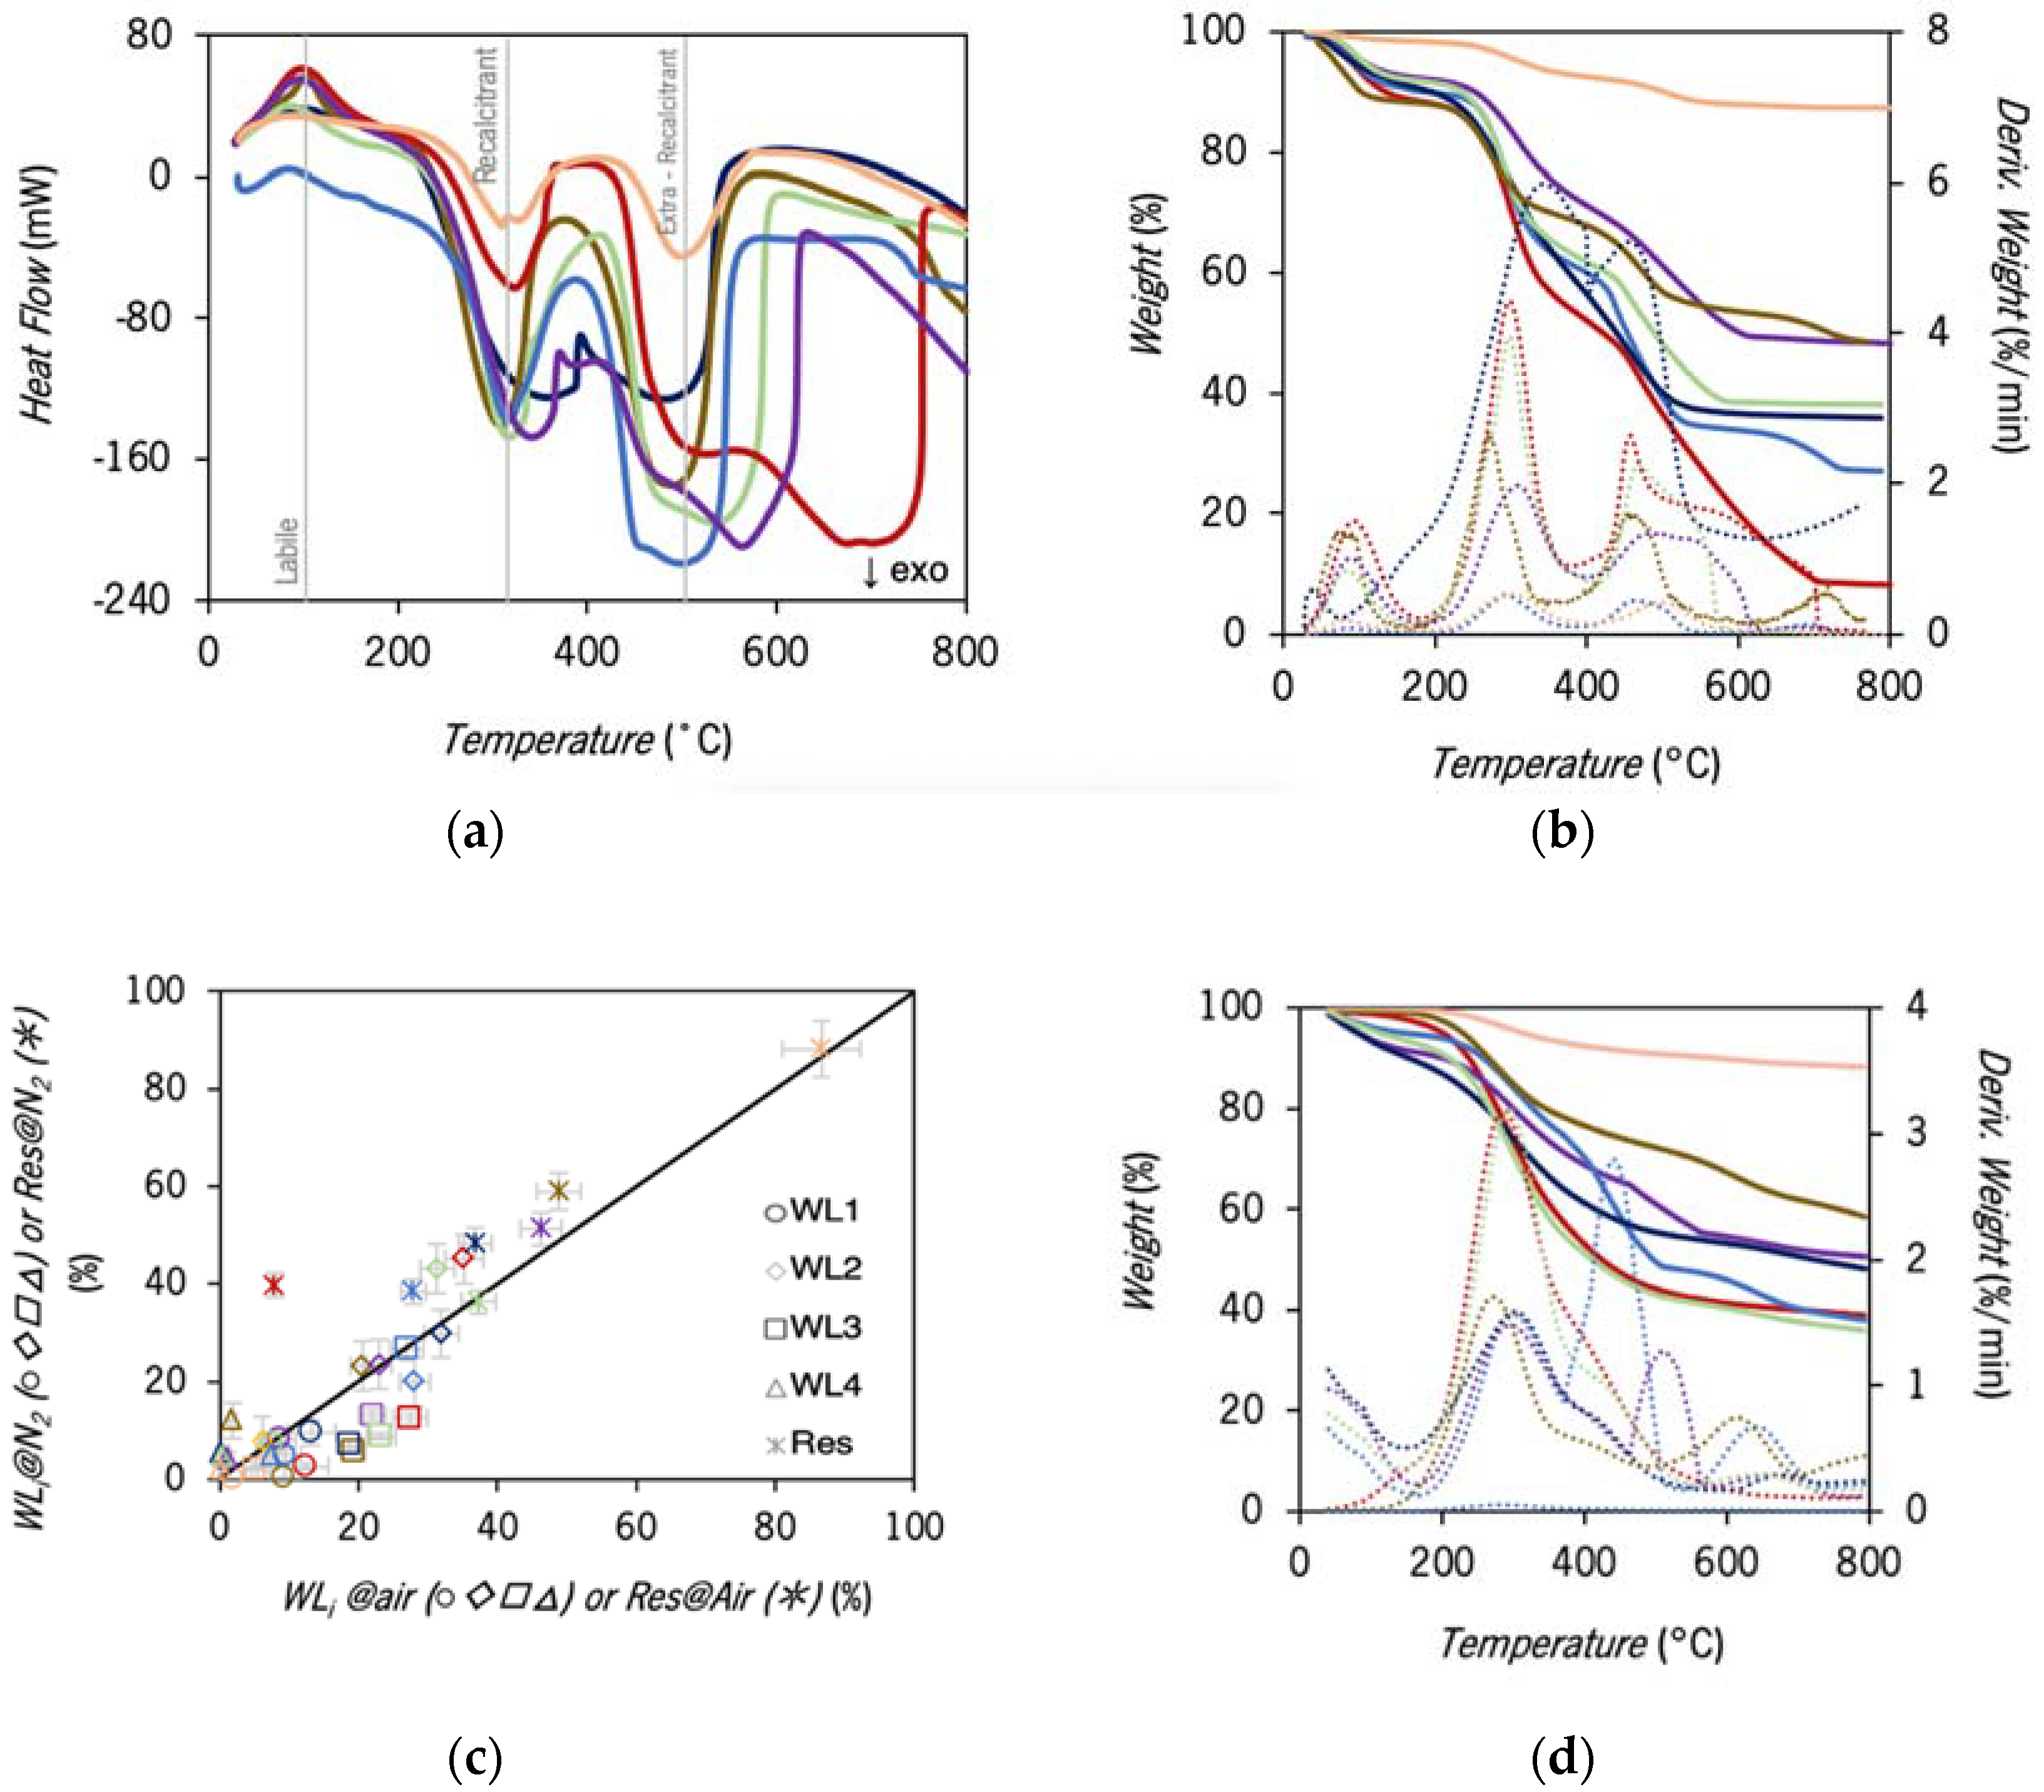
2.2.2. Characterization by TGA and DSC

Compost samples were characterised by Thermogravimetric Analysis (TGA) and Differential Scanning Calorimetry (DSC), using a Perkin-Elmer Simultaneous Thermal Analyzer STA 6000 (Waltham, MA, USA) and Thermal Analysis Instruments TGA500 (New Castle, DE USA). The analyses were performed on a dry basis using ceramic and aluminium crucibles (60 µL) in air and in N2 atmospheres, respectively, in the temperature range from 30 to 800 °C with a heating rate of 10 °C min−1. Samples (30–50 mg) of each compost were obtained from a portion of a sample of about one gram that was homogenised in an agate mortar. The baseline correction was performed using an empty crucible [29]. The enthalpies were calculated by integrating the area below the DSC curve drawing a horizontal baseline (heat flow 0), with the aid of Origin 2019b software. The weight loss was quantified in temperature ranges defined by means of the derivative thermogravimetric (DTG) curves. The uncertainties associated with results from TGA and DSC were estimated from replicates of independent measurements. The relative standard uncertainty associated with the values of weight loss, total weight loss and residue were estimated from the analysis of triplicates of 10 samples for a total of 20 degrees of freedom (N = 30 − 10). The estimated values of relative standard uncertainties were 26% for WL1, 7.8%, for WL2, 8.8% for WL3, 30% for WL4, 3.0% for TWL and 6.5% for Res. For the calorimetric measurements, the relative standard uncertainties were estimated from the analysis of duplicates of 10 samples for a total number of degrees of freedom of 10 (N = 20 − 10). The relative standard uncertainties estimated were 23% for H1, 13%, for H2 and 4.7% for H3.

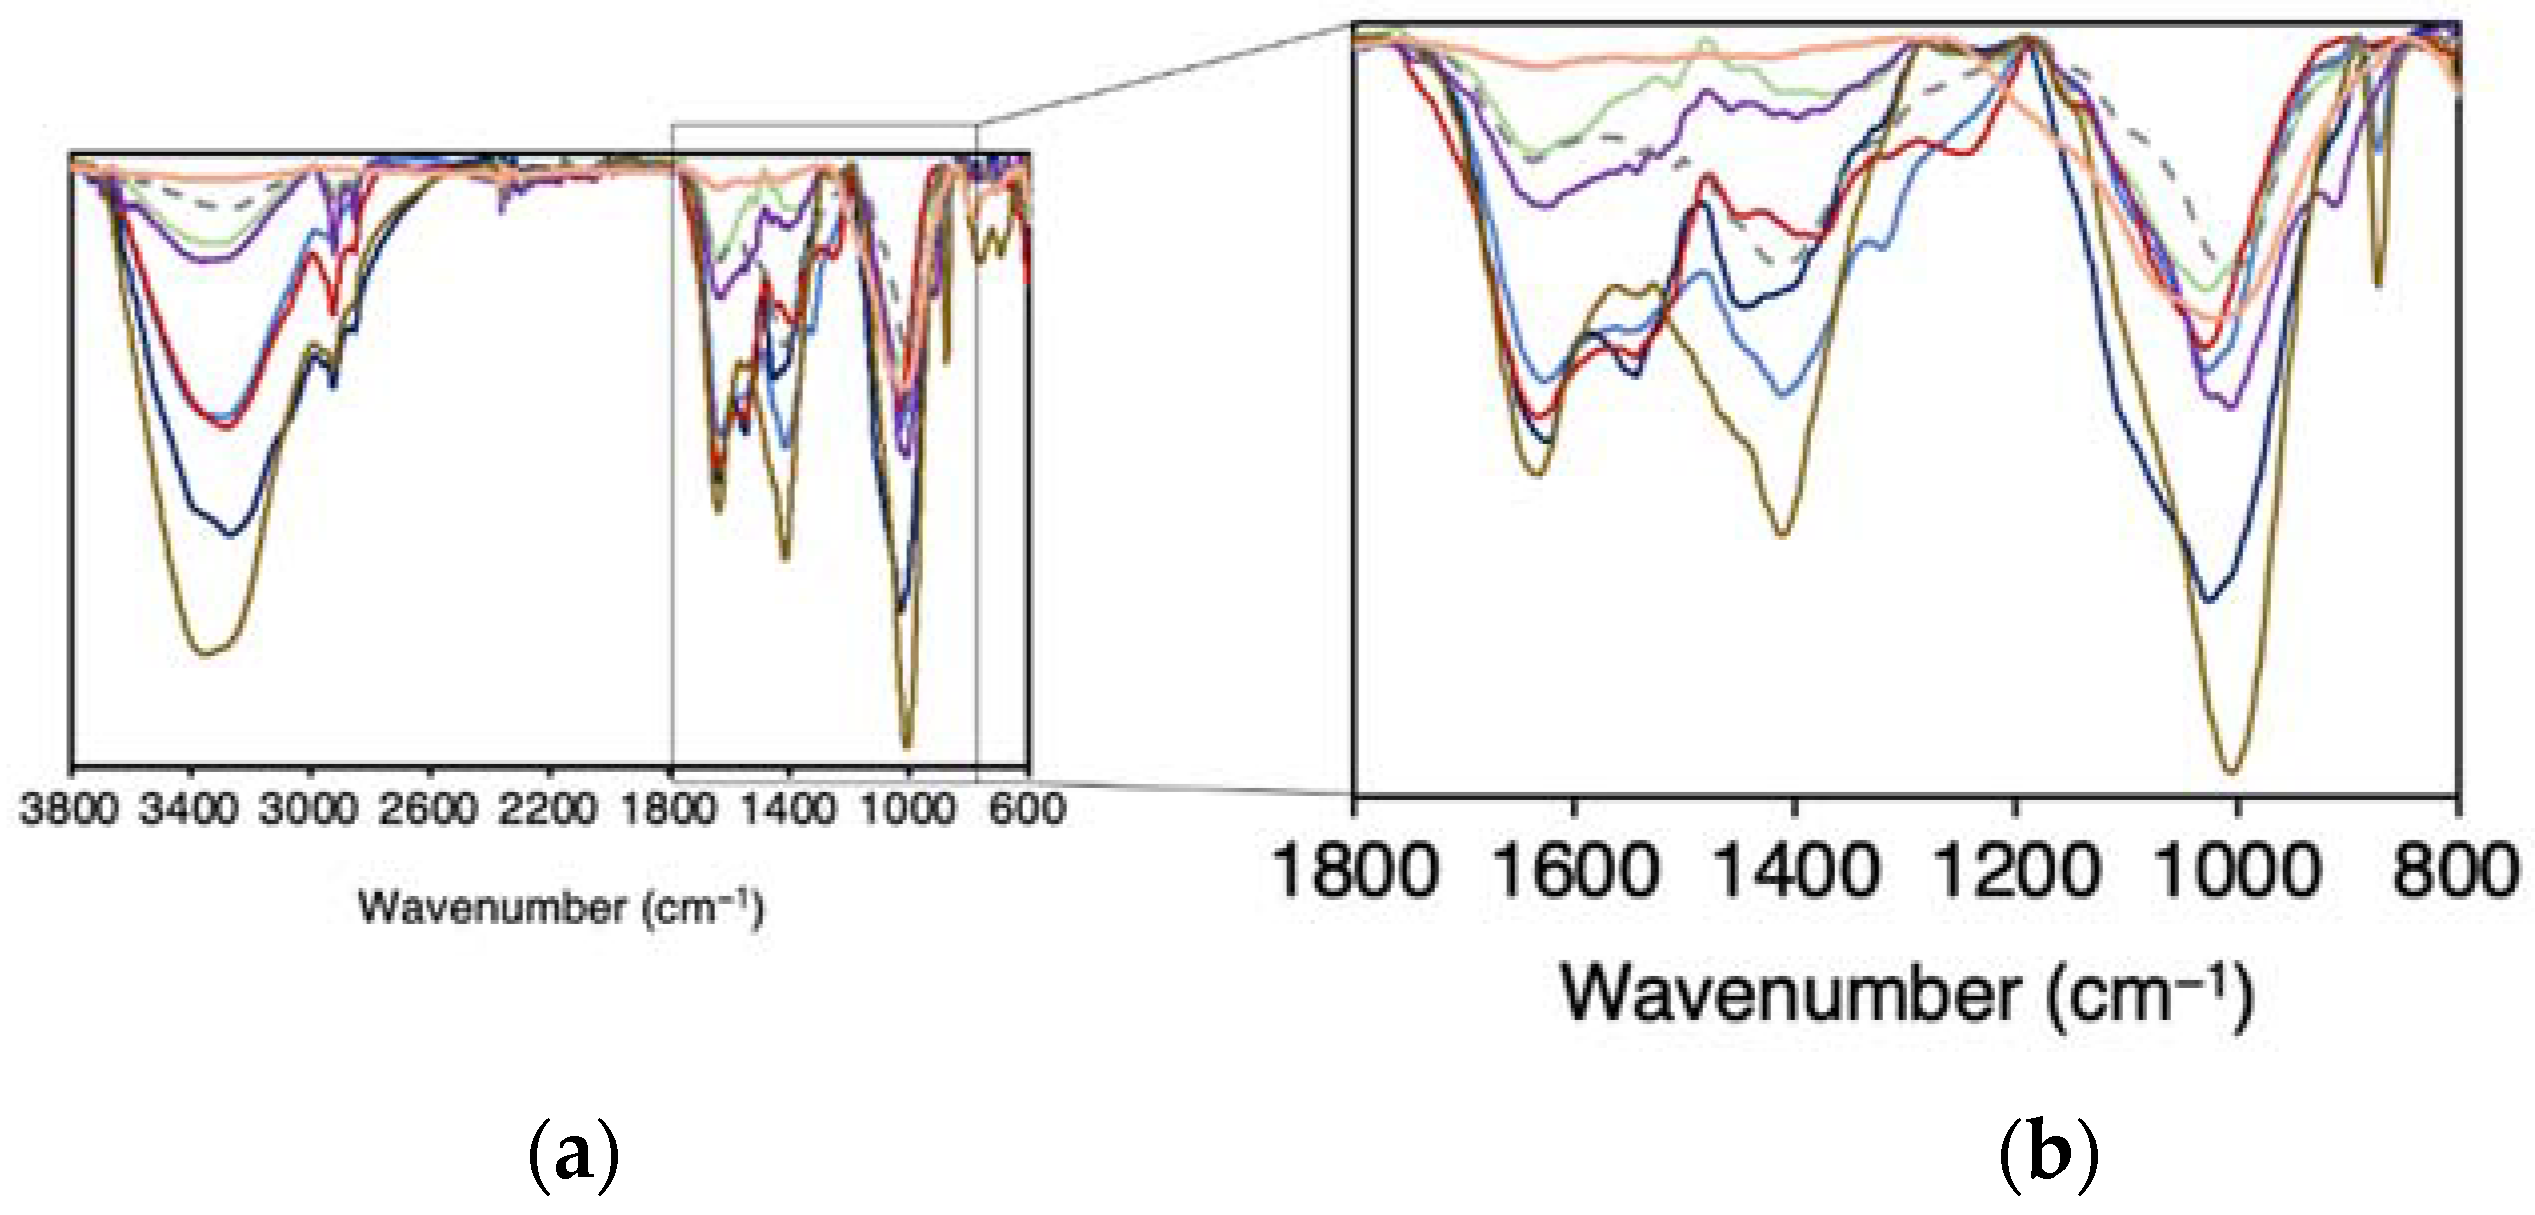
2.2.3. Characterization by ATR–FTIR Spectroscopy

The FTIR spectra of samples were recorded in the transmission mode using a Jasco FT/IR-4100 Spectrometer (Easton, MD, USA) with an ATR Specac Golden Gate, in a wavenumber range of 600–3800 cm−1 and corrected against an ambient air background. Each spectrum is the result of 64 scans with a resolution of 1 cm−1. The spectra were corrected with the baseline and submitted to a deconvolution process using Origin 2019b software. In the deconvolution process, the compensation of the intrinsic linewidths is performed to solve overlapping bands. Each sample of each compost was obtained from a portion of a sample (15 g) that was homogenised by manually grinding in an agate mortar.

2.2.4. Characterization by SEM and X-ray Diffraction Analysis

The surface morphology of CA and CVA samples were studied by scanning electron microscope (SEM) using a SEM Leica Cambridge S360 apparatus (Cambrigde, TX, USA). The mineralogical composition of these two samples was determined by X-ray diffraction using a Bruker D8 Discover ( Billerica, MA, USA) diffractometer with an X-ray tube using Cu Kα1 radiation (λ = 1.54060 Å) operated at 40 kV and 40 mA. X-ray diffraction patterns were recorded on powder samples using a LynxEye (Boston, MA, USA) detector, under ambient conditions and within a range of 2.5° to 65° 2θ, with 0.035° 2θ step size, and a 3 s counting time per step at 20 rpm.

2.3. Plant Field Experiment

The different compost samples were tested on relevant crop species at the field level to identify eventual biological effects. The organic fertiliser was also tested for comparative purposes.

2.3.1. Biological Material

Lettuce (Lactuca sativa L.) rooted plantlets of the variety Maravilha das 4 Estações were acquired from Casa Comercial Bragro (Braga, Portugal) and planted on the same day. Similar plants, of about 15 cm height and 4–6 leaves, were chosen.

2.3.2. Experimental Design and Sampling

On a plot of 25 m2 located at organic community gardens of the University of Minho, 15 beds were prepared for plantation. The composts CUW, CVA, CA and the fertiliser FLW were applied to topsoil and mixed coarsely following technical recommendations. The recommended doses from the producers (technical sheets) and amount applied, considering a bed area of 0.54 m2 (1.8 m long × 0.3 m wide), were 0.079 kg and 0.18 kg for CUW, 0.16 kg and 0.26 kg for FLW, 0.8 kg for CVA and 1.34 kg for CA (Table S1 in Supplementary Material). Control beds just with native soil were also used. Treatments and controls were randomly assigned to beds with three beds per condition as replicates. In each bed, 7 lettuce plantlets were planted 0.3 m away from each other (21 plants per condition). Plants were watered regularly whenever necessary. After 5 weeks of growth, 2 to 3 plants were collected from the inner region of all bed-replicates to prevent border effects (totalizing 6–9 replicates per condition), and the plant total leaf area was determined. For this, the length (L) and maximum width (W) of all leaves were measured and the leaf area (LA) of each leaf was calculated from the equation: LA = 0.7764 L × W–0.9761 (R2 = 0.984). This equation was previously obtained after L and W measurements and estimations of the respective leaf area of more than 70 leaves of different sizes. Here the leaf area of each leaf was estimated by the method of leaf silhouette on paper (relating the weight of the paper with the known area), after which the linear regression was performed with the respective L × W area.

2.4. Statistical Analyses

The relative dispersion of data was evaluated by means of the coefficient of variation (s/ x ¯ ) where x ¯ is the arithmetic mean and s the standard deviation [35]. For quantities where results from different samples showed high dispersion, the median was used as a reference value. The chemometric evaluation was performed by unsupervised pattern recognition through principal component analysis (PCA). PCA is one of the most powerful and common methods used for reducing the dimensionality of large data sets without information loss [36]. The scores and loadings are plotted together, where the scores matrix brings information regarding sample similarities, while loadings show how variables are responsible for the pattern observed in the scores’ clusters. PCA was applied using the Matlab software version R2007b (The Mathworks Inc., MA, USA) with autoscale preprocess (since the variables present different magnitudes and units). Two heatmaps were built using correlation analysis results [37] from quantitative data and properties related to structural features of the different samples. The maximum value of the correlation coefficient (r = 1) is represented by the more intense red colour, whereas the minimum value (r = 0) is represented by white and the antagonistic correlations between variables with a maximum value (r = −1) are represented by intense blue. The correlation analysis was performed using the Matlab software version R2007b (The Mathworks Inc., Natick, MA, USA).
Plant growth results are presented as mean ± standard deviation (4 ≤ n ≤ 8). One-way ANOVA followed by Tukey’s multiple comparisons test was performed using GraphPad Prism version 7.0 c for MAC OS X (GraphPad Software, La Jolla, CA, USA, www.graphpad.com, accessed on 30 April 2022). Significant differences (p ≤ 0.05) between samples are indicated with different letters.

3. Results and Discussion

3.1. Elemental Characterization and CEC

The total content of carbon (C) and of the macronutrients nitrogen (N), phosphorus (P), potassium (K), calcium (Ca), magnesium (Mg) and sulphur (S), that are essential for plant and microbial growth in soils are presented in Table 2. The content of the micronutrients iron (Fe), zinc (Zn), manganese (Mn), copper (Cu), niquel (Ni) and cobalt (Co) are presented in Table S2 together with the content of sodium (Na), arsenic (As), chromium (Cr) and lead (Pb).
The compost samples present varied amounts of C and N; these elements are shown by the relatively high values of s/ x ¯ for C (43%) and for N (51%). The compost samples with the highest and lowest content of C and N are CVDW and CA, respectively. The highest values of the macronutrients, P, K, Ca, Mg and S, are obtained for CLW, whereas CSS exhibits the highest amounts of micronutrients, with the exception of Mn that is higher for CVA. Regarding the C/N ratio, which is an important indicator of the compost maturity [21], the characterised compost samples exhibit values ranging from 8.6 (CSS) to 12.8 (CLW) with a s/ x ¯ of 16%. As all the values of the C/N ratios are lower than 15, that is the maximum value of this parameter recommended for agronomic application; all compost samples have a maturity degree compatible to this application. It is noteworthy to remark that the organic fertiliser (FLW) exhibits a value of 13.2, which is higher than all compost samples.
The values obtained from the CEC characterization vary over a wide range of values, from 46 to 167 cmol (+) kg−1, with s/ x ¯ of 44%, where the highest value is from CUW and the lowest from CSS and CA (Table 2). The values from these last two compost samples are lower than 60 cmol (+) kg−1, which is the minimum value expected for a fully matured compost [38].

3.2. ATR-FTIR Characterization

The ATR-FTIR spectra are shown in Figure 1. The spectra of all samples show the characteristic peaks of humified organic matter, namely: a band at 3320 cm−1 that is ascribed to C-H bonds and to O-H of alcohols, phenols or O-H carboxyl and also to N-H vibrations in amide functions [39]; two bands at 2925 and 2845 cm−1, attributed to symmetric and asymmetric vibrations of C-H stretching of CH3 and CH2 groups [40]; a band centred around 1640–1630 cm−1, attributed to aromatic C=C and C=O stretching of amide groups and quinonic C=O and/or C=O of H-bonded conjugated ketones [39]; a band at 1540 cm−1, assigned to secondary amides [39]; two other bands between 1440 and 1420 cm−1, associated with the O-H deformation and C-O stretching of carboxylic group, C-H deformations of CH3 and CH2 groups and asymmetric stretching of COO- groups [41]; a band around 1020 cm−1 that was attributed to the combination of C-O stretching of polysaccharides, in addition to Si-O-Si bonds of silica and to the group Si-O-C [39] and a band at 870 cm−1 assigned to carbonates [42].
To characterise the humified organic matter regarding the relative amount of aromatic structures with respect to the aliphatic structures empiric parameters designated by aromaticity indexes are calculated using the absorption intensities at characteristic frequencies, namely 1540, 1630, 2845 and 2945 cm−1 [43]. According to the values obtained for the four aromaticity indexes I1630/2925, I1630/2845, I1540/2845, I1540/2925, samples can be arranged in three groups: CDDW and CSS with the lowest values, CLW, CUW, CVDW and CVA with intermediate values and CA with the highest values (Table S2).

3.3. DSC and TGA Characterization

Differential scanning calorimetry (DSC) and thermogravimetric analysis (TGA) provide important information on the thermal resilience and the stabilisation degree of the organic matter and are frequently used for the characterization of materials containing humified organic matter [44]. In the DSC curves that are shown in Figure 2a, it can be noticed that the DSC curves exhibit marked changes in shape and height, despite having some common features, such as a minor endothermic band at the lower temperature limit (around 100 °C), usually ascribed to dehydration reactions, and two exothermic bands (around 320 °C and 500 °C), characteristic of stabilised organic matter and attributed to the decomposition of recalcitrant and extra-recalcitrant organic components [45,46,47]. The enthalpy values obtained by the integration of the DSC bands at the three temperature ranges 30–177 °C, 177–400 °C and 400–620 °C, designated by H1, H2 and H3, respectively, are shown in Table S2.
The DSC curves of the samples CA, CSS and CVDW show distinctive features with respect to the remaining four samples (CVA, CLW, CDDW and CUW). Although the shape of the DSC curve of CA is similar to that of the most representative curves, the values of H2 (−0.24 kJ g−1) and H3 (−0.35 kJ g−1) are abnormally lower than the median values (−1.55 and −2.98 kJ g−1, respectively) despite the ratio H3/H2 (1.46) being close to the median value (1.92). The DSC curve of CSS stands out because it does not show a clear distinction between the two exothermic processes displaying a value of H2 (−2.89 kJ g−1) that is above the median value and, consequently, a ratio H3/H2 (0.95) is significantly lower than the median value. The shape of the DSC curve of CVDW shows an abnormally wide second exothermic process that extends to 780 °C and exhibits an abnormally low value of H2 (−0.73 kJ g−1) and a rather high value of H3 (−5.93 kJ g−1), leading to a value of the ratio H3/H2 (8.18) that is four times larger than the median.
The TGA curves and the corresponding DTG curves of the compost samples recorded in air and N2 are shown in Figure 2b,c, respectively. The values of weight loss in air and in N2 atmospheres are shown in Table S2 (Supplementary Information). Although the air atmosphere is more frequently used for the characterization of samples, such as compost and soil, the TGA in N2 can provide interesting information, particularly if results from both atmospheres are compared [48].
The shape of the TGA curves in air, regarding the two first peaks, is similar. A third and, for some samples, a fourth peak are also visible. The differences between the shapes and the position of the peaks can be observed through the corresponding DTG curves (dotted lines in Figure 2b). Although all the DTG peaks are rather asymmetrical the third peak is particularly uneven, indicating that this peak results from the overlay of multiple single processes. From the DTG curves, four temperature ranges were defined and related to four main processes: dehydration and desorption processes (WL1, 30–177 °C) [49,50], decomposition of the easily biodegradable aromatic structures (carbohydrates moieties and aliphatic compounds) (WL2, 177–400 °C) [49,50], decomposition of the most stabilised organic matter (WL3, 400–620 °C) [49] and decomposition of inorganic carbonates (WL4, 620–800 °C) [49]. According to the temperature range of each process, an association can be established between the decomposition processes and enthalpies, namely WL1 can be associated with H1 (related to dehydration and desorption processes); WL2 with H2 (corresponding to decomposition of the recalcitrant substances) and WL3 + WL4 with H3 (associated to decomposition of the extra-recalcitrant substances and carbonates).
The values of the total weight loss (TWL) of the compost samples in air show important differences. The samples CLW, CDDW, CVA, CSS and CUW display values that are close to the median value of all samples (62.7%), while CVDW exhibits the highest value (92.3%) and CA the lowest value (13.3%). Despite the observed differences in the weight loss values, the ratio WL3/WL2, which is used as an indicator of the compost maturation degree [22] varies within a relatively narrow range, is between 0.58 and 0.96 for CSS and CUW, respectively. Using this parameter, samples can be divided into three groups, where CLW, CUW and CDDW display the highest values; CA, CVA and CVDW the intermediate values and CSS the lowest value. The comparison of TGA results of the compost samples with an organic fertiliser, FLW, is shown in Figure S1 (Supplementary Information).
The results of TGA (weight loss and residue) obtained in the N2 atmosphere are compared with those obtained in air (Figure 2d). Most of the data from the residue (star symbol) are located close to the equivalence line 1:1, but above it, indicating that the residues tend to be larger in the N2 atmosphere. CVDW is the only compost that shows a marked deviation from the equivalence line. With respect to the weight loss in the different temperature ranges, the values of WL2 and WL4 are positioned along and on both sides of the equivalence line, suggesting that the thermal decomposition occurs in similar extension by oxidation and pyrolysis. In opposition, the values of WL1 and WL3 are positioned under the equivalence line indicating that the weight loss extent is larger in oxidative conditions. The outcome of WL1 suggests that oxidation reactions are likely to occur besides the dehydration and desorption processes commonly assigned to this temperature range. With respect to WL3, significantly higher values were obtained for all samples in the presence of oxygen, except for CUW, whose point is located over the equivalence line. The average value of the difference between the extent of weight loss in the two atmospheres (for samples located below the equivalence line) is about 58%, which is a considerable difference considering the magnitude of these values. A detailed analysis of this difference is carried out in Section 3.4.

3.4. Correlations between Physico-Chemical Parameters

Results from the different physico-chemical parameters were used in two correlation analyses. The first uses the quantitative data from elemental characterization, TGA residue and CEC (Figure 3a), whereas the second uses values from intensive properties, such as the reaction enthalpies (H1, H2, H3), intrinsic parameters associated to the maturity of compost (e.g., I1630/2925, WL3@air/WL2@air) and normalised quantities, e.g., WL1@air/TWL@air and CEC/C (Figure 3b).
In Figure 3a the most prominent positive correlations (r > 0.7) are among: (i) C, Coxi, N and Pb; (ii) P, Mg, Na, K and Zn and (iii) Fe, Al, Co, Cr, Cu, Ni and S. Simultaneously, negative correlations with |r| > 0.7 are observed for C, Coxi and N with Res@air. Even though some of these correlations were not anticipated, particularly those in group (iii), the correlations of group (ii) can be due to the simultaneous occurrence of these elements in vegetables products [25]. The positive correlations in group (i) and the negative correlations with the Res@air can be explained considering that an increase in the residue must be associated with a decrease in the elements that constitute the organic fraction of the compost.
In Figure 3b, the most prominent positive correlations (r > 0.7) are among the following variables: (i) I1630/2925, H3 and CEC/C; and (ii) WL1@air/TWL@air, WL2@air/TWL@air and WL3@air/TWL@air. At the same time, negative correlations (|r| < 0.7) are found for: (i) I1630/2925 and CEC/C with H1; (ii) WL4@air/TWL@air and H2 with Coxi/C; and (iii) WL1@air/TWL@air and WL2@air/TWL@air with CEC/C.
The positive correlations of the first group indicate that there is a strong association between the relative amount of aromatic moieties (I1630/2925), the stabilisation degree of the organic matter (higher values of H3) and the ability of organic matter to bind metal cations (CEC/C). The correlations found in the second group are less obvious and are ruled by the amount of residue, i.e., the larger amounts of residue are associated with the lower values of weight loss in all temperature ranges.
With respect to the negative correlations, the relationships found in the first group suggest that the samples that strongly adsorb low molecular weight molecules (H1) are those with lower relative abundance of aromatic moieties (I1630/2925) and lower ability to exchange cations per gram of carbon content (CEC/C). The correlations between WL4@air/TWL@air with Coxi/C in the second group may be associated with the fact that WL4@air/TWL@air is linked to the inorganic fraction of C, while Coxi/C is related to the organic fraction. The negative correlation between H2 and Coxi/C indicates that the decomposition of recalcitrant structures releases lower amounts of energy when the ratio Coxi/C increases, suggesting that the carbon that is not readily oxidizable can contribute significantly to H2.
In these correlation analyses only the aromaticity index I1630/2925 was used, despite the previous allusion to the possible calculation of four ratios from the four independent absorption intensities. This decision was based on the result of the comparison between these aromaticity indexes (Figure 4a), which showed that the four parameters are correlated. The correlation between I1630/2925 and I1540/2925 and between I1630/2845 and I1540/2845 suggests that the chemical structures of the constituents in each compost sample have important similarities regarding a constant proportion between the amount of secondary amides (related to I1540/2925 and I1540/2845) with respect to the moieties containing C=C and C=O (related to I1630/2845 and I1630/2925). The observed deviation of the results of CVA points out that the molecular structures in this compost may differ significantly from the remaining ones.
The correlation between total weight loss in air (TWL@air) and total carbon content shown in Figure 4b was suggested by the negative correlation found between Res@air and C (Figure 3a). The slope of this correlation line corresponds to the stoichiometric proportion between the mass loss released by the combustion and the mass of carbon. This slope is similar for all compost samples and corresponds to about 2.1 g per gram of carbon (25.2 g per mol C). This value depends on the C:O:H molar ratio of the substances that are converted into CO2 and can vary from 44 g per mol C (for carbonates) to 14 g per mol C (for alkanes). The fact that all compost samples fit the same straight line suggests that the chemical structure of the fraction of compost that is decomposed by combustion has important similarities. A relevant outcome of the observed correlation is the possibility of estimating the carbon content of compost from a TGA analysis.
In order to explain the difference between the weight loss values in the two atmospheres (N2 and air) in the range 400–620 °C, values of ΔWL3 (= WL3@airWL3@N2) were calculated and were plotted against different quantities, attempting to correlate these values with elemental or structural data. The most significant correlation relates this quantity with the inorganic carbon through the representation of ΔWL3 + WL4 as a function of C-Coxi (Figure 4b), where WL4 accounts for the amount of carbonates and ΔWL3 may represent inorganic carbon in the form of carbon nanostructures. The presence of carbon nanostructures, such as graphenes or carbon-based dots, previously found in natural occurring humic substances using 13C-NMR [51], Raman, Transmission Electron Microscopy (TEM) and Atomic Force Microscope (AFM) [52], can explain the observed differences in weight loss in the range of 400–620 °C, as these type of structures are not decomposed in inert atmosphere but are oxidised in this temperature range [48].
If we consider that the formation of these nanostructures occurs during the maturation of compost alongside the formation of humic substances, it is expectable that the relative amount of these nanostructures may be related with the degree of aromaticity of the composts. In fact, there is a good correlation between ΔWL3/TWL@air and I1630/2925 (r = 0.81) for five of the seven compost samples (represented as full symbols in Figure 4c). The fact that CUW and CA did not follow the general trend suggests that the maturation of these two samples did not favour the formation of these nanostructures to the same extent of the remaining five samples.
To interpret and possibly justify the origin of the large differences between the values of the TGA residues in the air atmosphere of the different samples (Figure 2b), these values were compared with the total amount of metal oxides estimated using the ICP-OES results and considering the formation of the higher oxides of each metal (Figure 4d). Although the values of Res@air of all composts exceeded the calculated values, considering exclusively the presence of metal oxides, the values of CVDW, CUW, CSS and CLW were the closest to the performed estimate. In the case of CDDW, produced by domestic composting, the large deviation observed to the calculated residue may be due to the addition of soil to the composting mixture, which is a common practice in this composting technique. For CA and CVA, the large difference can be due to the presence of micro and nanometric silica residues from the algae collected from shore environments.
Although the raw material of CVA and CA is apparently identical (60% animal wastes and 40% vegetable remains including algae) the difference observed between the CA residue obtained in the TGA analysis and predicted exclusively from the metal oxides is 2.65 times higher than that of CVA, which must certainly be due to the heterogeneity of the feedstock. The SEM images of these two composts confirm the observed differences (Figure S1 in Supplementary information). The CVA images show packed fluffy- and floc-like structures of organic matter, while the CA images exhibit larger amounts of scattered structures. The amplified image of CA shows that the most abundant structures resemble silicate structures besides the presence of diatoms (in small amounts). The XRD analysis (Figure S2 in Supplementary Information) of CA identified large amounts of silicates in the forms of quartz, phyllosilicates (predominantly muscovite) and feldspars, whereas CVA shows a larger amount of amorphous material (most likely organic matter) and the predominance of quartz, with smaller amounts of phyllosilicates (muscovite), gypsum and traces of calcite.

3.5. PCA Analysis

The physico-chemical parameters characterised and analysed throughout this study were organised in two PCA. The first PCA (PCA1) aims to search for patterns in samples using data from quantitative analysis from parameters previously considered in the correlation analysis of Figure 3a, while the second PCA (PCA2) is built using parameters related to the structural properties of the samples (previously analysed in Figure 3b).
The three first principal components in PCA1 explained 83.85% of the total variance. Figure 5a shows the simultaneous representation of the loadings and scores on PC2 against PC3. The biplot of PC2 and PC3 was considered the most adequate to portray the differences between the samples, taking into account the nature of the samples, despite the explained variance of PC2 and PC3 being moderate (27.13% and 19.38%, respectively). This observation is in agreement with previous studies where it was shown that sometimes the main information of a dataset is not present in the PC with the highest explained variance [53,54]. In the biplot of PCA1, two samples are isolated and the remaining can be aggregated in two groups despite the distance between some of the samples, which in some cases is considerably large. The samples FLW and CLW (both derived exclusively from animal wastes) can be grouped on the PC2 positive side. The distinction is associated mainly with higher values of the macronutrients P, K, Ca and Mg and of CEC. The CUW, CVA, CSS and CDDW may be grouped on PC2 and PC3 negative values. This group stands out for the values of the macronutrient S and of the micronutrients Cr, Cu, Fe, Al, and Ni, wherein CSS displays the highest values. The compost samples CA and CVDW, that show up isolated, are separated from the other groups, CVDW on the negative side of PC2 and on the positive side of PC3 and CA on the negative values of PC2 and PC3. Although CVDW stands out for the highest values of N, C, Coxi and Pb, CA is highlighted for the highest values of residue (Res@air).
Regarding PCA2, the two first principal components explained 67.65% of the total variance. Although this biplot samples are well spread, an organisation based on three groups and one isolated sample can be arranged (Figure 5b). The compost CSS is isolated on the positive side of PC1 and the negative side of PC2, distinctly characterized for the highest value of Coxi/C. The CLW and the fertilizer FLW appear close to each other on the positive side of PC2 and on the negative side of PC1 and are characterised by high values of the parameters H2, C/N and WL3@air/WL2@air, where the latter two are common indicators of the stability of organic matter. The compost samples CVDW and CUW are grouped with CDDW despite the distance observed between them, as they are separated from the others on the positive sides of PC1 and PC2. These samples are characterised for displaying the higher values of H1, WL1@air/TWL@air, WL2@air/TWL@air, WL3@air/TWL@air and particularly of WL4@air/TWL@air. Composts in this group are from urban biowastes, which seems to be the main factor for the relative proximity of the three composts. In contrast, the composting methods that are different for the three samples (i.e., vermicomposting, industrial and domestic composting) did not play a significant role on the thermal stability of the compost. Similarly, the two algae-based compost samples CA and CVA arise on the negative side of PC1 and PC2. Despite the distance between the two samples in the plot, both are highlighted by the same parameters (I1630/2925 and H3 and CEC/C) that are characteristic of the presence of aromatic molecular structures with high stability and the presence of functional groups capable of complexing metallic cations.
From the analysis of PCA1 and PCA2 it is possible to conclude that the distribution pattern of samples in the representation plots follows a trend that is more closely associated with the nature of the raw materials than with the composting method.

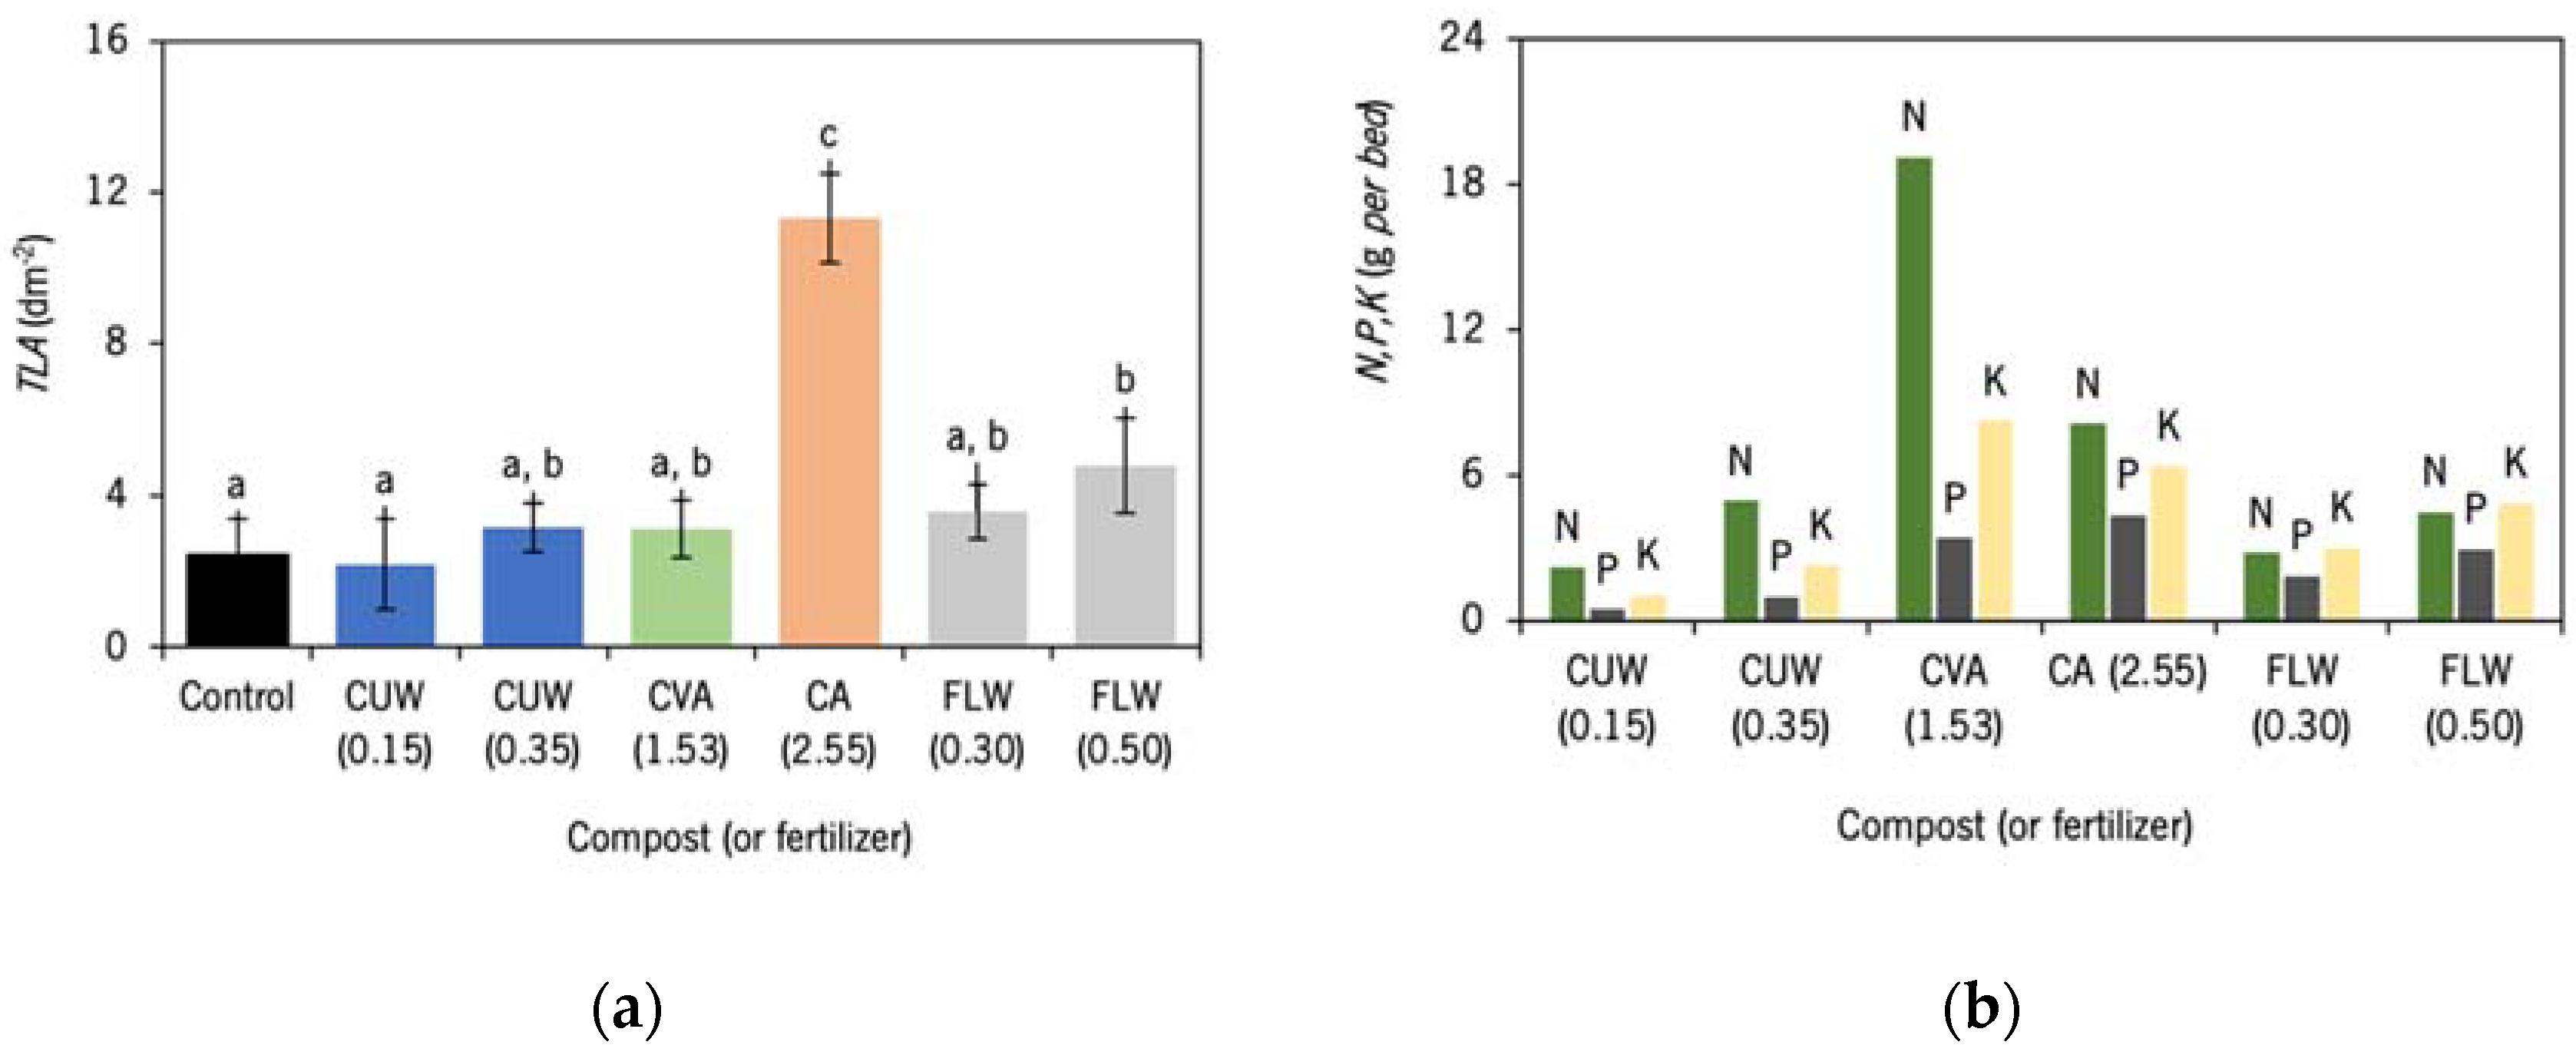
3.6. Impacts of Different Composts and Fertiliser on Lettuce Leaf Area

A crop field experiment was designed to investigate the potential effect of the compost origin at the plant level, using lettuce. The samples CUW, CA and CVA were selected for this study based on the nature of the feedstock and composting process. In this study, FLW (100% animal waste, not composted) was used as a reference organic fertiliser.
Results of this study, in Figure 6a, display the total leaf area obtained for the composts and organic fertiliser applications and for the control with native soil. Fertile soil may be used as a control to evaluate the effect of compost application [55,56]. Despite the tested samples being fitted for agricultural purposes, only the compost CA (assigned with c) and the organic fertiliser FLW at the highest dose (assigned with b) promoted a significant increase in the total leaf area (TLA) in relation to the control (Figure 6a). The results that cannot be differentiated from the control are assigned with a. Results from CUW (0.35), CVA (1.53) and FLW (0.30) are assigned with a, b because they cannot be statistically differentiated either from the control or FLW (0.50). Regarding the compost dosage effect, no significant differences were detected on TLA for CUW and FLW when comparing the minimum and maximal doses recommended by producers, suggesting that the lower dose was sufficient to maximise the vegetative growth for this productivity variable and for this plant crop species.
The amounts of N, P and K effectively applied per bed (Figure 6b) were calculated to compare results given the used doses (based on the suppliers’ indications). The larger amounts of N and K were provided to the soil by CVA, which are about 58% and 23% higher than those for CA, respectively. The largest amount of P was provided by CA (23% higher than the provided by CVA). Nevertheless, the observed impact of CA application is hardly explained by the value of P, as the variation of this nutrient with respect to CVA is lower than the observed for the dosage effect (using CUW and FLW).
The differential growth of lettuce where sample CA stood out was not explained by the relative amounts of N, P and K, considering the results from parameters related to structural properties. In PCA2, CA is associated with CVA whose results from the lettuce grow experiments were not significantly different from the control. Although CA is isolated in the PCA1, this placing is related to the higher amount of residue. It is not expected that this fraction of material can be responsible for the increased growth of lettuce as the residue is essentially composed of inert substances, mainly silicates. Furthermore, despite the differences in the composition of CVA and CUW (as the two samples are in two different groups in PCA2), the impact of these two samples in lettuce growth is indistinguishable.
Although the characterization data of the technical sheet that accompanies the compost refer to the characterization of the solid, it was not possible to find among these parameters one that could justify the effects observed in the growth of lettuce. Thus, we are led to think that other properties, namely those related to the reactivity of the components isolated in the different extracts, may be at the origin of these results. The characterization of the extracts of these composts is ongoing and will be presented in the near future.

4. Conclusions

The reported analytical results show that the composts of different origin display significant differences between the content of constituents, such as C and N, and between the amount of recalcitrant and extra-recalcitrant substances. From the examination of the two PCA (one using data from quantitative analysis and the other using parameters related to molecular structure) it is possible to conclude that the distribution pattern of samples in the representation plots follows a trend that is more closely associated with the nature of the raw materials than with the composting method. Despite the observed differences in most parameters, significant correlations are observed among the content of some constituents and between different intrinsic properties. These correlations, which are mostly reported for the first time, suggest that the chemical structure of the constituents of the compost produced from different feedstock and composting methodologies possess important similarities. Furthermore, the existence of these correlations enables reducing the number of analyses to be performed for the compost characterization. The formation of carbon nanostructures along the maturation is suggested by the combination of thermogravimetric, elemental analysis and FTIR. The nature of the compost residues in TGA was also diverse, while the residues of CVDW and CUW are predominantly metal oxides. The residues of CA and CVA contain high amounts of other inert materials, mainly silicates. From a crop field experiment, it was observed that CA led to the largest effect in terms of the increase in the leaf area on lettuce, as compared with CVA, CUW and FLW. This result was not directly related to the content of macronutrients, N, P or K or with another parameter that was distinctive of CA. Further studies are required to identify the most relevant analytical parameters that can be used to characterise and discriminate compost with respect to their action as fertiliser. The characterization of the reactivity of the extracts of these composts are being carried out with the aim to explain this result in a future piece of work.

Supplementary Materials

The following supporting information can be downloaded at: https://www.mdpi.com/article/10.3390/su14127449/s1, Table S1: Recommended doses from the producers (technical sheets) and amount applied considering a bed area of 0.54 m2 (1.8 m long × 0.3 m wide); Table S2: Elemental composition (from EA and ICP-OES) and data related to molecular structure (from CEC, UV-vis, ATR-FTIR, TGA and DSC) of the compost samples and the organic fertiliser.; Figure S1: Scanning electron images of (A) CA with a 200× magnification, (B) CA with a 1000× magnification and (C) CVA with a 200× magnification. Figure S2: X-ray diffraction (XRD) profiles of (A) CA and (B) VCA. Figure S3: Thermogravimetric characterization of FLW: (A) DSC curves and (B) TGA and DTG curves obtained in air.

Author Contributions

A.C.S.: Conceptualization, methodology, investigation, formal analysis, data curation, writing—original draft; A.T.: Investigation, data curation, validation; J.A.: Methodology, investigation, data curation, writing—review & editing; P.V.: Conceptualization, investigation, validation, data curation; R.O.: Data curation, validation; A.C.: Investigation, data curation, writing—review & editing; R.G.: Investigation, data curation, writing—review & editing; J.P.P.: Investigation, validation, data curation, writing—review & editing; S.F.: Conceptualization, funding acquisition, resources, validation, writing—review & editing; F.B.: Conceptualization, funding acquisition, resources, validation, writing—review & editing. All authors have read and agreed to the published version of the manuscript.

Funding

This work was financially supported by the Interreg VA Spain-Portugal Programme (EU) through the project Res2ValHum (0366_RES2VALHUM_1_P). A.C. Silva acknowledges receipt of a PhD grant (UMINHO/BD/40/2016) financed by the Operational Programme Norte 2020 (through the Project “NORTE-08-5369-FSE-000033”). A. Teixeira acknowledges the grant (Res2ValHum 01/2018) to develop experimental work for 11 months on the project. J. Antelo and S. Fiol are also grateful for the financial support provided by Xunta de Galicia—Consellería de Educación e Ordenación Universitaria de Galicia (Consolidation of Competitive Groups of Investigation; GI-1245, ED431C 2018/12 and CRETUS AGRUP2015/02, ref. 2018-PG10).

Institutional Review Board Statement

Not applicable.

Informed Consent Statement

Not applicable.

Data Availability Statement

Not applicable.

Acknowledgments

Thanks are due to Fundação para a Ciência e Tecnologia (FCT) and FEDER (European Fund for Regional Development)-COMPETE-QRENEU for financial support through the research units Chemistry Research Centre of (UID/QUI/00686/2020) and Centre of Molecular and Environmental Biology (CBMA) (UIDB/04050/2020) of University of Minho. P. Valderrama; thanks to CNPq (process 306606/2020-8). The XRD measurements work were carried out in the Pôle de compétences Physico-Chimie de l’Environnement, LIEC laboratory UMR 7360 CNRS—Université de Lorraine. The authors are thankful for the insight of Isabelle Bihanic for the discussion of these results.

Conflicts of Interest

The authors declare no conflict of interest.

References

  1. Valin, H.; Sands, R.D.; van der Mensbrugghe, D.; Nelson, G.C.; Ahammad, H.; Blanc, E.; Bodirsky, B.; Fujimori, S.; Hasegawa, T.; Havlik, P.; et al. The Future of Food Demand: Understanding Differences in Global Economic Models. Agric. Econ. 2014, 45, 51–67. [Google Scholar] [CrossRef]
  2. United Nations. General Assembly Resolution A/RES/70/1; Transforming Our World, the 2030 Agenda for Sustain—Able Development; FAO: Rome, Italy, 2015. [Google Scholar]
  3. Derpsch, R.; Friedrich, T.; Kassam, A.; Li, H. Current Status of Adoption of No-till Farming in the World and Some of Its Main Benefits. Int. J. Agric. Bio. Engineer. 2010, 3, 1–25. [Google Scholar]
  4. Somasundaram, J.; Sinha, N.K.; Dalal, R.C.; Lal, R.; Mohanty, M.; Naorem, A.K.; Hati, K.M.; Chaudhary, R.S.; Biswas, A.K.; Patra, A.K.; et al. No-Till Farming and Conservation Agriculture in South Asia—Issues, Challenges, Prospects and Benefits. Crit. Rev. Plant. Sci. 2020, 39, 236–279. [Google Scholar] [CrossRef]
  5. Toledo, M.; Siles, J.A.; Gutiérrez, M.C.; Martín, M.A. Monitoring of the Composting Process of Different Agroindustrial Waste: Influence of the Operational Variables on the Odorous Impact. Waste Manag. 2018, 76, 266–274. [Google Scholar] [CrossRef] [PubMed]
  6. Kaza, S.; Yao, L.; Bhada-Tata, P.; Van Woerden, F. What a Waste 2.0: A Global Snapshot of Solid Waste Management to 2050; World Bank Group: Washington, DC, USA, 2018. [Google Scholar]
  7. The European Parliament and the Council of the European Union. Directive (EU) 2018/851 of the European Parliament and of the Council of 30 May 2018 Amending Directive 2008/98/EC on Waste; European Union: Maastricht, The Netherlands, 2018; pp. 109–140. [Google Scholar]
  8. The European Parliament and the Council of the European Union. Directive 2008/98/EC of the European Parliament and of the Council of 19 November 2008 on Waste; European Union: Maastricht, The Netherlands, 2008; pp. 3–30. [Google Scholar]
  9. Rynk, R.; Schwarz, M.; Richard, T.L.; Cotton, M.; Halbach, T.; Siebert, S. Compost Feedstocks. In The Composting Handbook; Elsevier: Amsterdam, The Netherlands, 2022; pp. 103–157. [Google Scholar]
  10. Haug, R.T. The Practical Handbook of Compost Engineering, 1st ed.; Routledge: London, UK, 1993. [Google Scholar] [CrossRef]
  11. Michel, F.; O’Neill, T.; Rynk, R.; Bryant-Brown, M.; Calvez, V.; Li, J.; Paul, J. Contained and In-Vessel Composting Methods and Methods Summary. In The Composting Handbook; Elsevier: Amsterdam, The Netherlands, 2022; pp. 271–305. [Google Scholar]
  12. Michel, F.; O’Neill, T.; Rynk, R.; Gilbert, J.; Smith, M.; Aber, J.; Keener, H. Forced Aeration Composting, Aerated Static Pile, and Similar Methods. In The Composting Handbook; Elsevier: Amsterdam, The Netherlands, 2022; pp. 197–269. [Google Scholar]
  13. Michel, F.; O’Neill, T.; Rynk, R.; Gilbert, J.; Wisbaum, S.; Halbach, T. Passively Aerated Composting Methods, Including Turned Windrows. In The Composting Handbook; Elsevier: Amsterdam, The Netherlands, 2022; pp. 159–196. [Google Scholar]
  14. Fernández-Gómez, M.J.; Nogales, R.; Plante, A.; Plaza, C.; Fernández, J.M. Application of a Set of Complementary Techniques to Understand How Varying the Proportion of Two Wastes Affects Humic Acids Produced by Vermicomposting. Waste Manag. 2015, 35, 81–88. [Google Scholar] [CrossRef] [Green Version]
  15. Fuentes, M.; González-Gaitano, G.; García-Mina, J.M. The Usefulness of UV-Visible and Fluorescence Spectroscopies to Study the Chemical Nature of Humic Substances from Soils and Composts. Org. Geochem. 2006, 37, 1949–1959. [Google Scholar] [CrossRef]
  16. Li, X.; Xing, M.; Yang, J.; Huang, Z. Compositional and Functional Features of Humic Acid-like Fractions from Vermicomposting of Sewage Sludge and Cow Dung. J. Hazard. Mater. 2011, 185, 740–748. [Google Scholar] [CrossRef]
  17. Barrena, R.; Font, X.; Gabarrell, X.; Sánchez, A. Home Composting versus Industrial Composting: Influence of Composting System on Compost Quality with Focus on Compost Stability. Waste Manag. 2014, 34, 1109–1116. [Google Scholar] [CrossRef] [Green Version]
  18. Muscolo, A.; Papalia, T.; Settineri, G.; Mallamaci, C.; Jeske-Kaczanowska, A. Are Raw Materials or Composting Conditions and Time That Most Influence the Maturity and/or Quality of Composts? Comparison of Obtained Composts on Soil Properties. J. Clean. Prod. 2018, 195, 93–101. [Google Scholar] [CrossRef]
  19. Han, W.; Clarke, W.; Pratt, S. Composting of Waste Algae: A Review. Waste Manag. 2014, 34, 1148–1155. [Google Scholar] [CrossRef]
  20. Dhyani, V.; Kumar Awasthi, M.; Wang, Q.; Kumar, J.; Ren, X.; Zhao, J.; Chen, H.; Wang, M.; Bhaskar, T.; Zhang, Z. Effect of Composting on the Thermal Decomposition Behavior and Kinetic Parameters of Pig Manure-Derived Solid Waste. Bioresour. Technol. 2018, 252, 59–65. [Google Scholar] [CrossRef]
  21. Soobhany, N.; Gunasee, S.; Rago, Y.P.; Joyram, H.; Raghoo, P.; Mohee, R.; Garg, V.K. Spectroscopic, Thermogravimetric and Structural Characterization Analyses for Comparing Municipal Solid Waste Composts and Vermicomposts Stability and Maturity. Bioresour. Technol. 2017, 236, 11–19. [Google Scholar] [CrossRef]
  22. Dell’Abate, M.T.; Canali, S.; Trinchera, A.; Benedetti, A.; Sequi, P. Thermal Analysis in the Evaluation of Compost Stability: A Comparison with Humification Parameters. Nutr. Cycl. Agroecosyst. 1998, 51, 217–224. [Google Scholar] [CrossRef]
  23. Silva, M.E.F.; de Lemos, L.T.; Nunes, O.C.; Cunha-Queda, A.C. Influence of the Composition of the Initial Mixtures on the Chemical Composition, Physicochemical Properties and Humic-like Substances Content of Composts. Waste Manag. 2014, 34, 21–27. [Google Scholar] [CrossRef] [PubMed] [Green Version]
  24. Campitelli, P.; Ceppi, S. Chemical, Physical and Biological Compost and Vermicompost Characterization: A Chemometric Study. Chemom. Intell. Lab. Syst. 2008, 90, 64–71. [Google Scholar] [CrossRef]
  25. Reyes-Torres, M.; Oviedo-Ocaña, E.R.; Dominguez, I.; Komilis, D.; Sánchez, A. A Systematic Review on the Composting of Green Waste: Feedstock Quality and Optimization Strategies. Waste Manag. 2018, 77, 486–499. [Google Scholar] [CrossRef] [PubMed]
  26. Jakubus, M. A Comparative Study of Composts Prepared from Various Organic Wastes Based on Biological and Chemical Parameters. Agronomy 2020, 10, 869. [Google Scholar] [CrossRef]
  27. Zmora-Nahum, S.; Hadar, Y.; Chen, Y. Physico-Chemical Properties of Commercial Composts Varying in Their Source Materials and Country of Origin. Soil Biol. Biochem. 2007, 39, 1263–1276. [Google Scholar] [CrossRef]
  28. Dresbøll, D.B.; Thorup-Kristensen, K. Structural Differences in Wheat (Triticum Aestivum), Hemp (Cannabis Sativa) and Miscanthus (Miscanthus Ogiformis) Affect the Quality and Stability of Plant Based Compost. Sci. Hortic. 2005, 107, 81–89. [Google Scholar] [CrossRef]
  29. Smidt, E.; Tintner, J. Application of Differential Scanning Calorimetry (DSC) to Evaluate the Quality of Compost Organic Matter. Thermochim. Acta 2007, 459, 87–93. [Google Scholar] [CrossRef]
  30. López, R.; Antelo, J.; Silva, A.C.; Bento, F.; Fiol, S. Factors That Affect Physicochemical and Acid-Base Properties of Compost and Vermicompost and Its Potential Use as a Soil Amendment. J. Environ. Manag. 2021, 300, 113702. [Google Scholar] [CrossRef] [PubMed]
  31. Campitelli, P.; Ceppi, S. Effects of Composting Technologies on the Chemical and Physicochemical Properties of Humic Acids. Geoderma 2008, 144, 325–333. [Google Scholar] [CrossRef]
  32. Walkley, A. A Critical Examination of a Rapid Method for Determining Organic Carbon in Soils—Effect of Variations in Digestion Conditions and of Inorganic Soil Constituents. Soil Sci. 1947, 63, 251–264. [Google Scholar] [CrossRef]
  33. Murphy, J.; Riley, J.P. A Modified Single Solution Method for the Determination of Phosphate in Natural Waters. Anal. Chim. Acta. 1962, 27, 31–36. [Google Scholar] [CrossRef]
  34. Sumner, M.E.; Miller, W.P. Cation Exchange Capacity and Exchange Coefficients. In Methods of Soil Analysis Part 3—Chemical Methods; Sparks, D.L., Page, A.L., Helmke, P.A., Loeppert, R.H., Soltanpour, P.N., Tabatabai, M.A., Johnston, C.T., Sumner, M.E., Eds.; Soil Science Society of America, American Society of Agronomy: Madison, WI, USA, 1996; pp. 201–1229. [Google Scholar]
  35. Lovie, P. Coefficient of Variation. In Encyclopedia of Statistics in Behavioral Science; Everitt, B.S., Howell, D.C., Eds.; John Wiley & Sons, Ltd.: Chichester, UK, 2005. [Google Scholar]
  36. Kettaneh, N.; Berglund, A.; Wold, S. PCA and PLS with Very Large Data Sets. Comput. Stat. Data Anal. 2005, 48, 69–85. [Google Scholar] [CrossRef]
  37. Vilas-Boas, Â.; Valderrama, P.; Fontes, N.; Geraldo, D.; Bento, F. Evaluation of Total Polyphenol Content of Wines by Means of Voltammetric Techniques: Cyclic Voltammetry vs Differential Pulse Voltammetry. Food Chem. 2019, 276, 719–725. [Google Scholar] [CrossRef]
  38. Harada, Y.; Inoko, A. Relationship between Cation-Exchange Capacity and Degree of Maturity of City Refuse Composts. Soil Sci. Plant. Nutr. 1980, 26, 353–362. [Google Scholar] [CrossRef] [Green Version]
  39. Baddi, G.A.; Alburquerque, J.A.; Gonzálvez, J.; Cegarra, J.; Hafidi, M. Chemical and Spectroscopic Analyses of Organic Matter Transformations during Composting of Olive Mill Wastes. Int. Biodeterior. Biodegrad. 2004, 54, 39–44. [Google Scholar] [CrossRef]
  40. Kaiser, M.; Ellerbrock, R.H. Functional Characterization of Soil Organic Matter Fractions Different in Solubility Originating from a Long-Term Field Experiment. Geoderma 2005, 127, 196–206. [Google Scholar] [CrossRef]
  41. Fuentes, M.; Baigorri, R.; González-Gaitano, G.; García-Mina, J.M. The Complementary Use of 1H-NMR, 13C-NMR, FTIR and Size Exclusion Chromatography to Investigate the Principal Structural Changes Associated with Composting of Organic Materials with Diverse Origin. Org. Geochem. 2007, 38, 2012–2023. [Google Scholar] [CrossRef]
  42. Smidt, E.; Meissl, K.; Schwanninger, M.; Lechner, P. Classification of Waste Materials Using Fourier Transform Infrared Spectroscopy and Soft Independent Modeling of Class Analogy. Waste Manag. 2008, 28, 1699–1710. [Google Scholar] [CrossRef] [PubMed]
  43. Inbar, Y.; Chen, Y.; Hadar, Y. Solid-State Carbon-13 Nuclear Magnetic Resonance and Infrared Spectroscopy of Composted Organic Matter. Soil Sci. Soc. Am. J. 1989, 53, 1695–1701. [Google Scholar] [CrossRef]
  44. Plante, A.F.; Fernández, J.M.; Leifeld, J. Application of Thermal Analysis Techniques in Soil Science. Geoderma 2009, 153, 1–10. [Google Scholar] [CrossRef]
  45. Fernández, J.M.; Plaza, C.; Polo, A.; Plante, A.F. Use of Thermal Analysis Techniques (TG-DSC) for the Characterization of Diverse Organic Municipal Waste Streams to Predict Biological Stability Prior to Land Application. Waste Manag. 2012, 32, 158–164. [Google Scholar] [CrossRef] [PubMed]
  46. Dell’Abate, M.T.; Benedetti, A.; Trinchera, A.; Dazzi, C. Humic Substances along the Profile of Two Typic Haploxerert. Geoderma 2002, 107, 281–296. [Google Scholar] [CrossRef]
  47. Merino, A.; Fonturbel, M.T.; Fernández, C.; Chávez-Vergara, B.; García-Oliva, F.; Vega, J.A. Inferring Changes in Soil Organic Matter in Post-Wildfire Soil Burn Severity Levels in a Temperate Climate. Sci. Total Environ. 2018, 627, 622–632. [Google Scholar] [CrossRef]
  48. King, S.G.; McCafferty, L.; Stolojan, V.; Silva, S.R.P. Highly Aligned Arrays of Super Resilient Carbon Nanotubes by Steam Purification. Carbon 2015, 84, 130–137. [Google Scholar] [CrossRef]
  49. Som, M.P.; Lemée, L.; Amblès, A. Stability and Maturity of a Green Waste and Biowaste Compost Assessed on the Basis of a Molecular Study Using Spectroscopy, Thermal Analysis, Thermodesorption and Thermochemolysis. Bioresour. Technol. 2009, 100, 4404–4416. [Google Scholar] [CrossRef]
  50. Lim, S.L.; Wu, T.Y. Determination of Maturity in the Vermicompost Produced from Palm Oil Mill Effluent Using Spectroscopy, Structural Characterization and Thermogravimetric Analysis. Ecol. Eng. 2015, 84, 515–519. [Google Scholar] [CrossRef]
  51. Haumaier, L.; Zech, W. Black Carbon—Possible Source of Highly Aromatic Components of Soil Humic Acids. Org. Geochem. 1995, 23, 191–196. [Google Scholar] [CrossRef]
  52. Dong, Y.; Wan, L.; Cai, J.; Fang, Q.; Chi, Y.; Chen, G. Natural Carbon-Based Dots from Humic Substances. Sci. Rep. 2015, 5, 10037. [Google Scholar] [CrossRef] [PubMed] [Green Version]
  53. de Almeida, M.M.C.; Francisco, C.R.L.; de Oliveira, A.; de Campos, S.S.; Bilck, A.P.; Fuchs, R.H.B.; Gonçalves, O.H.; Valderrama, P.; Genena, A.K.; Leimann, F.V. Textural, Color, Hygroscopic, Lipid Oxidation, and Sensory Properties of Cookies Containing Free and Microencapsulated Chia Oil. Food Bioprocess Technol. 2018, 11, 926–939. [Google Scholar] [CrossRef]
  54. Moreira, I.; Scarminio, I.S. Chemometric Discrimination of Genetically Modified Coffea Arabica Cultivars Using Spectroscopic and Chromatographic Fingerprints. Talanta 2013, 107, 416–422. [Google Scholar] [CrossRef] [PubMed]
  55. Pavlou, G.C.; Ehaliotis, C.D.; Kavvadias, V.A. Effect of Organic and Inorganic Fertilizers Applied during Successive Crop Seasons on Growth and Nitrate Accumulation in Lettuce. Sci. Hortic. 2007, 111, 319–325. [Google Scholar] [CrossRef]
  56. Santos, F.T.; Goufo, P.; Santos, C.; Botelho, D.; Fonseca, J.; Queiros, A.; Costa, M.S.S.M.; Trindade, H. Comparison of Five Agro-Industrial Waste-Based Composts as Growing Media for Lettuce: Effect on Yield, Phenolic Compounds and Vitamin C. Food Chem. 2016, 209, 293–301. [Google Scholar] [CrossRef] [PubMed]
Figure 1. ATR-FTIR spectra of the different compost samples in (a) a wide range and in (b) a short-range frequency. CDDW (purple), CVDW (red), CVA (green), CA (orange), CUW (blue), CSS (dark blue), CLW (brown) and FLW (grey). The ATR-FTIR spectra of the analysed samples are in the same scale.
Sustainability 14 07449 g001
Figure 2. Thermogravimetric characterization of composts: (a) DSC curves; TGA and DTG curves obtained in (b) air and in (c) N2 atmospheres; and (d) comparison of TGA data obtained under the two atmospheres. CDDW (purple), CVDW (red), CVA (green), CA (orange), CUW (blue), CSS (dark blue) and CLW (brown). The straight line corresponds to the equivalence line 1:1.
Sustainability 14 07449 g002
Figure 3. Triangular heat map showing the pairwise Pearson correlation coefficients (r) of the parameters related to (a) elemental characterization data and (b) data related to molecular structure.
Sustainability 14 07449 g003
Figure 4. Correlations between characterization data from ATR-FTIR, TGA, EA and ICP-OES of the compost samples CDDW (purple), CVDW (red), CVA (green), CA (orange), CUW (blue), CSS (dark blue) and CLW (brown): (a) (▲) I1630/2925 vs. I1540/2925 and () I1630/2845 vs. I1540/2845 where the full line represents the linear fitting (r = 0.99). Data from CVA (open symbols) were not included in the fitting; (b) () TWL@air vs. C and the dotted line represents the linear fitting (r = 0.99), (▲) ΔWL3 + WL4@air vs. non-oxidizable carbon content (C-Coxi) and the full line represents the linear fitting (r = 0.84); (c) () ΔWL3/TWL@air vs. I1630/2925 where data from CUW and CVA (open symbols) were not included in the fitting and the full line was obtained by linear fitting (r = 0.81); and (d) (◆) Res@air vs. MOx, where open symbols are estimates of the total metal oxides mass, and the line represents y = x.
Sustainability 14 07449 g004
Figure 5. Principal Component Analysis (PCA) as biplot representation with loadings and scores in the coordinates (a) PCA1 using data from quantitative analysis and (b) PCA2 using data related to molecular structure of the compost samples (CDDW, CVDW, CVA, CA, CUW, CSS and CLW) and the organic fertiliser (FLW).
Sustainability 14 07449 g005
Figure 6. (a) Impact of the application of CUW, FLW, CVA and CA at the tested doses on total leaf area of lettuce plants after 5 weeks of culture in a field plot. Error bars represent the standard deviation and mean values topped by different letters (a, b and c) are significantly different (p ≤ 0.05); (b) The applied amount of N, P and K per bed. The number in each abbreviation refers to the applied dose in kg m−2.
Sustainability 14 07449 g006
Table 1. Identification of the samples analysed in the present work.
SampleComposting MethodologyRaw Material
Compost of urban waste (CUW)Tunnel compostingSelective collection of household food waste, food waste from restaurants, canteen, markets, fairs, festivities, pilgrimages and events, green waste from cemetery and household
Vermicompost of algae (CVA)Vermicomposting60% animal waste and 40% vegetable remains (fruits and algae), digested by Eisenia foetida earthworms.
Vermicompost of domestic waste (CVDW)Green waste (flowers, leaves, grass, fruit peels) and brown waste (straw, dry leaves, dry grass), digested by Eisenia foetida or Lumbricus rubellus earthworms.
Compost of livestock waste (CLW)Pile composting100% animal waste (a mixture of 5% sheep manure without straw, 25% chicken manure and 70% pig manure)
Compost of algae (CA)60% animal waste and 40% vegetable remains (fruits and algae).
Compost of sewage sludge
(CSS)
Forestry waste, sludge from urban wastewater treatment and sludge from local effluent treatment.
Domestic compost of domestic waste (CDDW)Domestic CompostingGreen waste (flowers, leaves, grass, fruit peels) and brown waste (straw, dry leaves, dry grass).
Organic Fertiliser
Fertiliser of livestock waste
(FLW)
-100% animal waste (chicken manure).
Mixture subjected to a high temperature to eliminate pathogens.
Table 2. Data from elemental composition (from EA and ICP-OES) and from CEC of the compost samples and the organic fertiliser.
TechniqueParameterCVACVDWCLWCSSCDDWCUWCAFLW
EAC (%)29.743.922.831.323.334.06.022.5
N (%)2.44.81.83.62.32.70.61.7
S (%)0.40.40.71.10.20.20.230.1
C/N12.59.212.88.610.312.69.9713.2
ICP-OESP (g kg−1)4.25.513.59.92.55.03.211.3
Ca (g kg−1)13.19.678.019.916.177.511.8212
Mg (g kg−1)4.54.418.25.23.63.73.16.2
Na (g kg−1)1.81.110.52.20.64.81.53.0
K (g kg−1)10.214.630.24.37.612.24.718.3
Cation exchange capacityCEC (cmol (+) kg−1)13798.915051.695.316746101
Publisher’s Note: MDPI stays neutral with regard to jurisdictional claims in published maps and institutional affiliations.

