Review

Techniques to Locate the Origin of Power Quality Disturbances in a Power System: A Review

1
Departamento de Ingeniería Eléctrica y Energética, Universidad de Cantabria, 39005 Santander, Spain
2
Fundación CIRCE, 50018 Zaragoza, Spain
*
Author to whom correspondence should be addressed.
Sustainability 2022, 14(12), 7428; https://doi.org/10.3390/su14127428
Submission received: 19 May 2022 / Revised: 13 June 2022 / Accepted: 14 June 2022 / Published: 17 June 2022
(This article belongs to the Special Issue Energy Efficiency in Power Lines)

Abstract

:
The complexity in the power system topology, together with the new paradigm in generation and demand, make achieving an adequate level of supply quality a complicated goal for distribution companies. The electrical system power quality is subject to different regulations. On one hand, EN-50160 establishes the characteristics of the voltage supplied by public electricity networks, therefore affecting distribution companies. On the other hand, the EN-61000 series of standards regulates the electromagnetic compatibility of devices connected to the network, therefore affecting the loads. Power companies and device manufacturers are both responsible and affected in the issue of quality of supply. Despite the regulations, there are certain aspects of the supply quality that are not solved. One of the most important is the location of the disturbance’s origin. This paper presents a review of the main techniques to locate the disturbance’s origin in the electric network through two approaches: identification of the disturbance’s cause and the location of the origin.

1. Introduction

The electric power system consists of the generation, transmission and distribution of energy to customers. The complexity of this system, together with changes in generation, demand, external factors such as weather conditions, load heterogeneity and other factors, make achieving an adequate supply quality level a complicated goal for distribution companies. IEEE describes the supply quality as “powering and grounding electronic devices so that they are suitable for operation and also compatible with the wiring system and other devices.” This is summarized by “Electromagnetic Compatibility”, which is defined as the ability of an equipment or system to work successfully in an electromagnetic environment without introducing intolerable electromagnetic disturbances into the network. With the new paradigm in electrical systems, supply quality problems are becoming increasingly serious because disruptive sources have multiplied. This problem has become a very important aspect for both energy distribution companies and end users due to different factors:
  • Current loads are very sensitive to supply voltage conditions.
  • Increased nonlinear loads cause harmonic disturbances that are on the rise in recent years.
  • Increased knowledge of end users in terms of supply quality that forces companies to improve conditions.
  • The distributed generation systems integration.
Power quality may represent an important factor in the competitiveness of several activities. This competitiveness is affected by the costs associated with the power quality problems and the growing number of customers with high requirements regarding power quality. Power quality problem costs are associated with production interruption, defective products, large restarting process, indirect costs, etc. In [1], a survey in the Portuguese industry concluded that costs associated with power quality problems represent, on average, 69% of annual electricity bills. In [2], it was concluded that the annual cost due to power quality problems in the industry and service sectors in Shanghai can be set in the range from USD 0.597 to 1.77 billion.According to [3], the cost associated with power quality problems in the European industry is around USD 150 billion. This fact encourages suppliers and the industry to locate disturbances’ origins to assign the responsibilities and, consequently, the costs.
A first step in having an electrical system with adequate power quality is the definition of supply quality regulations. There are numerous regulations in this regard with different areas of action. IEC has an international level with more than 60 partner countries, CENELEC and AENOR focus more on the countries of Europe and IEEE has its scope of action in America. IEC raised regulations on the supply quality that was adapted by CENELEC (Europe) and AENOR (Spain) to the EN-50160 [4] and EN-61000 series. In EN-50160, the main characteristics that the voltage supply must have at the point of delivery are defined as the “voltage characteristics of electricity supplied by public electricity networks”. This regulation is of direct application in energy supply companies, since they are responsible for energy reaching the customer with the required quality levels. In addition, the EN-61000 series of standards addresses the electromagnetic compatibility of devices in an environment:
  • Part 1: General.
  • Part 2: Environment.
  • Part 3: Emission Limits and Immunity.
  • Part 4: Testing and Measurement Techniques.
  • Part 5: Installation and Mitigation Guides.
  • Part 6: Generic Standards.
These standards are directly applicable to device manufacturers who are connected to the grid. This rule limits the emission of disturbances by devices on the network.
As can be seen through the regulations, there are two main agents in the supply quality: the generator, transporter and distributor of energy (electricity distribution companies) and loads (device manufacturers). Utilities and manufacturers are both responsible and affected in the supply quality issue. Electricity distribution companies are responsible for quality at the point of supply, so failure to meet the levels of disturbances established by the regulations may incur penalties. In the case of device manufacturers, they are affected in two ways: if your product does not comply with the regulations, it implies the noncertification of the product, and if the products are in an environment with low supply quality, they can be damaged. Despite the regulations, there are certain supply quality aspects that are not solved. One of the most important is the location of the disturbance’s origin. On numerous occasions, the supply quality is poor due to actions outside the power company, such as loads on users who introduce disturbances into the grid, although the loads are also subject to individual quality regulations. Users often have low-quality power problems in their facilities due to loads or processes they produce. For all this, detecting the disturbance’s source has two important implications for power companies: it allows to hold the user accountable for damages in case they are the disturbance’s source, avoiding possible litigation, and it allows to locate the disturbance and propose improvements.
Therefore, disturbances can be divided between those produced in the electric system, which is the distribution company’s responsibility, and disturbances due to loads. As mentioned, the current loads, due to their electronic components, are generators of disturbances, but they are also sensitive to them. The most common disturbances, their impact and causes are showed in Table 1 [5].
The disturbances produced in the electric system are mainly those related to failures in insulation that produce voltage sags and unbalances, contact faults (animals or trees) that produce surges, voltage sags and interruptions and operations in the network that produce surges and transients. In the case of customers (equipment), the disturbances are from asynchronous motors that produce voltage sags during the starting process and harmonics due to nonlinearities, welding machines or arc furnaces that produce voltage sags, harmonics, unbalances, voltage fluctuations, converters that produce surges and harmonics, nonlinear loads that produce harmonics and capacitor banks that produce voltage sags, surges, harmonics and voltage fluctuations.
In the technical literature, there are numerous references for the location of the disturbance’s origin. It is a complicated topic, since networks are currently very complex due to intricate topology, the integration of distributed generation that in addition to changing the direction of traditional flow from medium voltage to low voltage introduces converters that generate disturbances, the large number of nonlinear loads, etc.
This study presents a review of the main techniques to locate a disturbance’s origin in the electric network. This study presents the following novelties:
  • Solutions for improving the responsibility assignment. This review explores and analyzes a great number of options for suppliers and industrial users to locate the origin of power quality problems. This review summarizes different available algorithms in the technical literature, highlighting their characteristics, advantages, disadvantages and the type of disturbances for which the algorithms are intended.
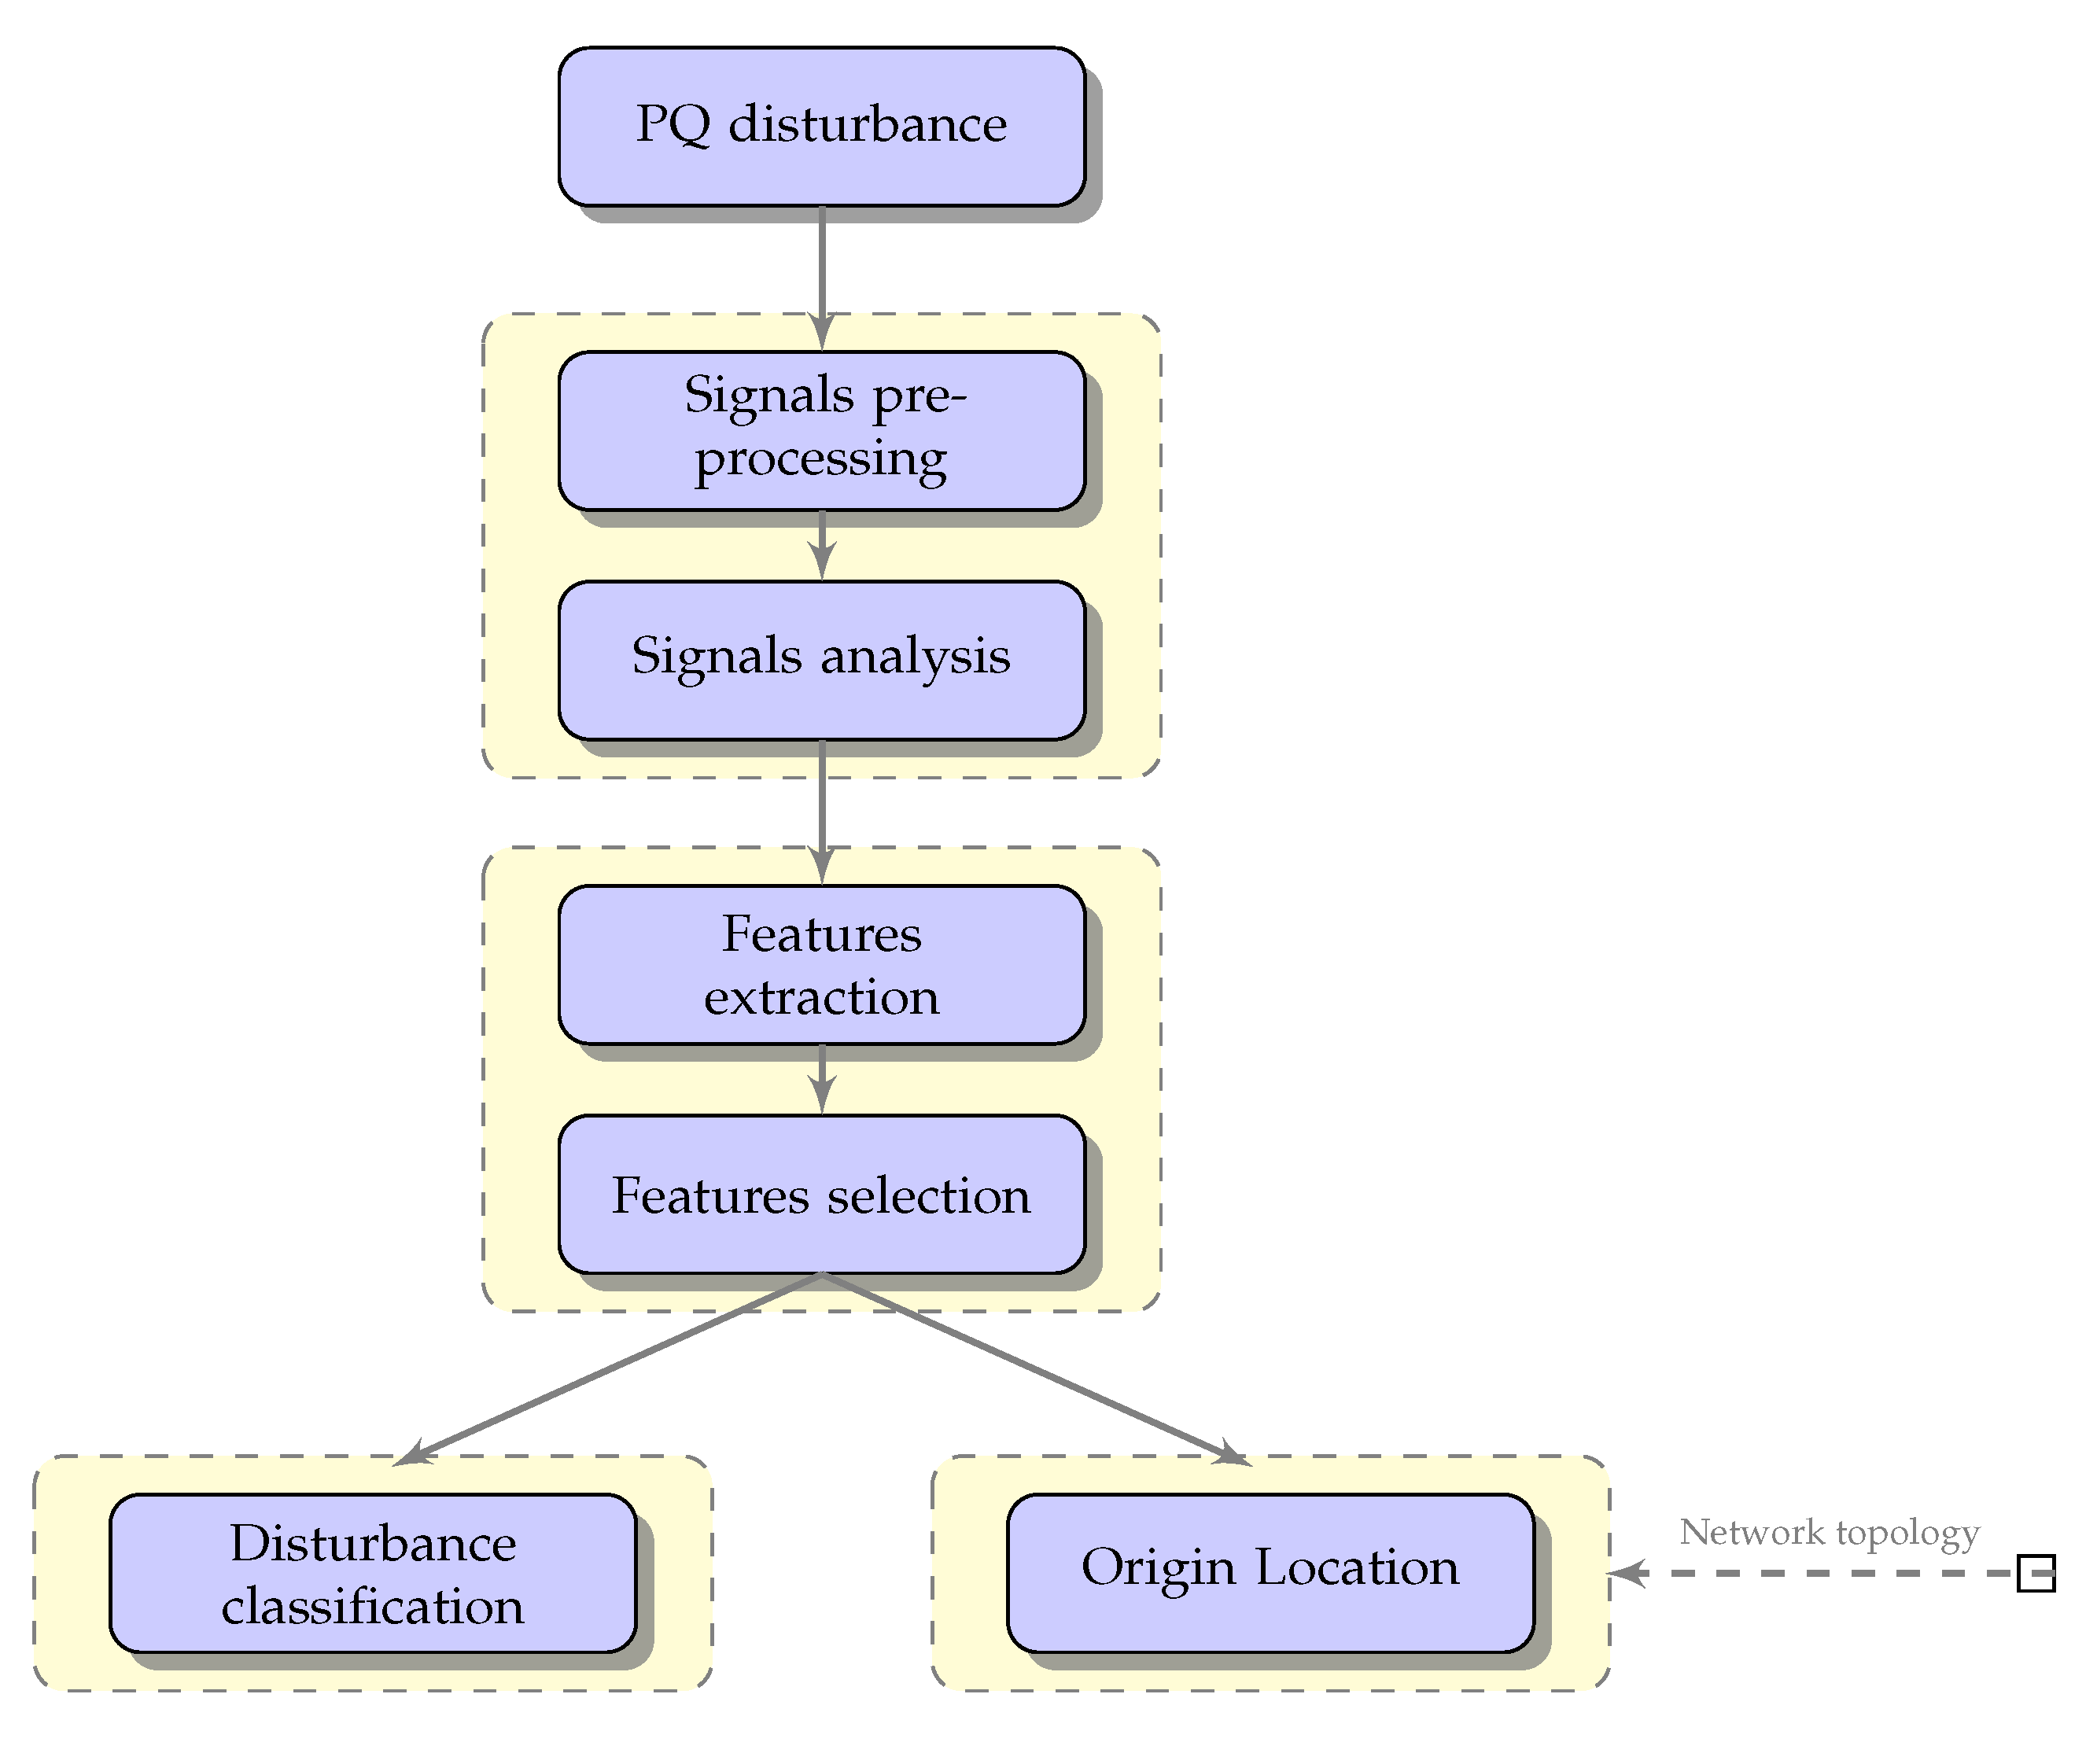
  • Process to locate the poor power quality source. This review explores two different approaches to achieve good-quality location of a disturbance’s origin; identification of the disturbance cause and the location of the origin. A complete analysis with the two approaches improves the accuracy of the disturbance origin location, knowing the approximate location and the type of load that produced it. In the first of the approaches, there is greater technical knowledge, but the complexity of the network makes the second approach more difficult to analyze. Figure 1 summarizes the process followed during the identification of the disturbance type and the location of the origin.
  • Fault location solutions. Faults in the electrical system are a very great source of power quality problems. On this basis, this review analyzes different solutions to locate the faults in the electrical system to achieve good-quality location of the origin of this disturbance type.
There are some reviews of this topic in the technical literature. The review in [6] focuses on analyzing international standards and solutions for improving power quality, but it does not provide information about the different existing techniques to precisely locate the source of disturbance. In [7,8], the existing methodologies for the Responsibilities Assignment Problem are described and reviewed. In [9], the important novelty is that these existing methodologies are compared through a laboratory setup. In the case of these references, there is no mention of other algorithms of disturbance location. In [10], an extensive review about the automatic recognition of PQ events is presented.The present review complements previous ones, extending the analysis to other algorithms, not only for location of the disturbance source, but also for identification of the disturbance type. This fact can improve the quality of the outcomes.
The papers selected in this review were searched in the relevant data bases: IEEE Xplore, Scopus, Engineering Village and Web of Science. The criteria used in this paper is the search for the most relevant references regarding each topic. For the identification of disturbing cause types, the main search keywords were “power quality disturbances”, “power quality classification”, “power quality feature extraction”, “power quality signal analysis”, “power quality pattern recognition” and “power quality disturbances identification”. In the case of disturbing source locations, the main search keywords were “power quality disturbances origin”, “disturbances source origin”, “responsibilities in power quality”, “disturbance origin assessment”, “power quality event source location” and “locate power quality disturbance source”. In this way, 100 papers from 1989 to 2021 were analyzed for this review. As it can be seen in Figure 2, a higher number of papers are concentrated the last 15 years. The journal with the most contributions to this review is IEEE Transaction on Power Delivery, with 20 % of the contributions.

2. Identification of Disturbing Cause Types

The first approach for the location of the disturbing element is the identification of the type of loads that cause the disturbance. Different types of disturbances and their most common causes were identified in the previous section, but perfect identification is a more complex process. In the technical literature, there are numerous references in which methods are proposed for the identification of loads based mostly on three steps: signal analysis and feature extraction, feature selection and classification.

2.1. Signal Analysis and Feature Extraction

There are different methodologies for analyzing and extracting signal characteristics from network monitoring. Signal decomposition methods are mainly used.

2.1.1. Wavelet Transform

Wavelet Transform is an efficient tool for analyzing nonstationary signals with fast transients. There are numerous modifications to the Wavelet Transform base to suit the different characteristics of the problem. In [11,12], Wavelet Transform is used for signal decomposition. In [13], a normalization and segmentation process is added before the Wavelet Transform to obtain the distinctive characteristics of each event that are extracted through a two-stage feature extraction process. In [14], an improvement in the Wavelet method is presented for analyzing nonstationary signals of disturbances using Wavelet Transform with modified frequency fraction that provides frequency-dependent resolution with additional window parameters for better feature localization. An advantage of this system is that the sine modulation signals are fixed on the axis of time, while a Gaussian window dilates and moves it. In [15,16,17], Wavelet Transform with multiresolution analysis is used for signal analysis. In the case of [15], the Wavelet Db4 family is used, and in [17], it is combined with the Parseval theorem to calculate the energy distribution as it is a very good parameter for the classification of supply quality events. In [18], features are extracted through an entropy-based Wavelet normalization method. In [19], an adaptive harmonic transform of Wavelet is used for the extraction of characteristics. The advantage of this system is that it analyzes disturbances in voltage and current with better performance than other methods, as it provides a better representation of quality signals.

2.1.2. S-Transform

The S-Transform is a generalization of Fourier’s short-term transformation, expanding the continuous Wavelet Transform and overcoming some of its disadvantages. It can also be said to be a Wavelet Transform with phase correction. It has several advantages over Wavelet and Fourier. First, the modulated sine signals are fixed on the time axis which identifies dilatations and transfers of the Gaussian window. In addition, it has no cross-term problems and obtains a clearer signal than the Gabor transform. The disadvantage of thiS-transform is that the clarity of the signal is worse than that of Wigner’s and Cohen’s distribution function. Additionally, the characteristics obtained with the S-Transform are more suitable for pattern recognition purposes than Wavelet’s. In general, the S-Transform has excellent time-frequency resolution and needs fewer features than the Wavelet Transform to achieve the same results.
In [20,21], the transform is used to extract the characteristics of the signals taking advantage of that of Wavelet. In [20], the hyperbolic function of the S-Transform combined with genetic algorithms is used to select the optimal characteristics. In [21], it combines with an algorithm called Dynamics (Dyn) that significantly reduces the simulation time of the S-transform. This article performs the extraction of 5 characteristics for further classification. In [22,23], a multiresolution S-Transform is used to generate optimal feature vector sets. In the case of [22], it is combined with the Parseval theorem to obtain the energy vectors, and in the case of [23], it is based on a variable width analysis window that changes frequently depending on the user needs.

2.1.3. Hilbert Transform

A real function and its Hilbert transform manage to create a strong analytical signal. This signal can be represented with an amplitude and a phase where the derivative of the phase can be identified as the instantaneous frequency. Therefore, the instantaneous frequency is defined through the series itself and its mathematical transform. The S-transform has limited use because it needs a signal with narrow bandwidth to make its result suitable. Due to this limitation, an improved version is usually used, namely the Hilbert–Huang transform that allows to break down the signal into different oscillation modes, because the distorted wave can be understood as overlapping different oscillation modes. Empirical decomposition is used to separate modes and Hilbert to obtain instantaneous amplitude and phase for feature extraction.
In most cases found in the technical literature, the Hilbert–Huang combination [24,25,26,27] is used.

2.1.4. Statistical Methods

The use of statistical methods based on statistical analysis of typical disturbed signals can be used for characteristic extraction. In [28], the characteristics are extracted using statistical methods combined with a decision tree with gradient enhancement to recognize the sources of disturbance.

2.1.5. Empirical Decomposition in Set Modes

The Hilbert transform was modified into the Hilbert–Huang transform to improve its characteristics through decomposition in different oscillation modes. In this case, empirical decomposition in modes is used without the part of the Hilbert method and modified to obtain empirical decomposition of modes by sets that allows to improve the first. Empirical mode decomposition is affected by the effect of mode mixing (modal overlap), while empirical mode decomposition by sets solves this problem. This method allows for better capacity for scale separation, adding different series of white noise to the signal.
In [29], this system is used to obtain the moment and duration of the disturbance and the frequency and amplitude of the signal. In the case of [30], it is combined with multilabel learning so that empirical decomposition in set modes extracts the characteristics of complex disturbances, defining differences in energy levels in each mode.

2.1.6. Discrete Cosine Transform

Discrete Cosine Transform is based on Fourier discrete transform but using only real numbers. ThiS-transform expresses a sequence of several points as a result of the sum of different sine signals for different frequencies and amplitudes. In the case of the Fourier Transform, complex exponentials are used, while discrete cosine transforming works with cosine. The advantages of this method are that it concentrates most of the information into few transformed coefficients, the algorithm does not vary depending on the data it receives and has great capacity to interpret the coefficients from a frequency point of view.
In [31,32], this method is used for the extraction of characteristics mainly for short disturbances over time.

2.2. Feature Selection

The second stage is the selection of the most appropriate extracted characteristics for the subsequent event classification. In this case, there are also different methodologies for selecting the characteristics of signals from network monitoring.

2.2.1. Genetic Algorithms

Genetic algorithms base their behavior on the way human genes work. These algorithms cause a population of data to evolve by subjecting it to random actions similar to those that act in genetics (mutations, genetic combinations, etc.). Different criteria, at the base of the problem necessities, are used to select the most appropriate characteristics.
In [33], a wrapping-based approach that integrates multiobject genetic algorithms is used. In this article, Wavelet Transform and S-Transform are used to extract features. Multiobject genetic algorithms are then trained to find a subset of relevant characteristics that minimize classification errors and classifier size.

2.2.2. Image Enhancement Techniques

There are image enhancement techniques for multiple applications, but in this case these techniques are used to highlight in the image the characteristics of the different disturbances.
In [34], image enhancement techniques are used to select the most appropriate features.

2.2.3. Principal Component Analysis (PCA)

This is a statistical procedure that uses orthogonal transformation to transform a set of variable observations that may have correlation into a set of values that are not correlated with each other, which are called major components.
In [11], Wavelet Transform is used for signal decomposition, and subsequently, analysis procedures of the main component are used to select the characteristics most suitable for subsequent classification.

2.3. Classification

The final stage in identifying disturbances is classification. At this stage, numerous learning algorithms are used in which procedures are trained through features extracted and selected with procedures from the previous steps.

2.3.1. Neural Networks

Neural Networks are a great exponent within the field of artificial intelligence. Neural networks are inspired by the behavior of human neurons and their connections. They consist of input elements, neurons, connections and output elements. These algorithms have a training stage by which they are fed with the input signals. Target vectors are established so that during training the network updates the weights and, in some cases, the architecture. The latter is made in order to make the output vector the most similar to the target vector.
In [35], Neural Network algorithms combined with a rule-based decision tree are used for classification of both isolated events and event combinations. In [36], Neural Networks are used for the classification of events using Wavelet for feature extraction and selection. In the case of [37], Neural Networks are used for the identification of the harmonic source. It is trained, first, to extract the most important characteristics of an intensity signal, and then for classification models with multilayer perceptron, radial base function network and support vector machines and with linear, polynomial and radial-based kernels. These models are trained and tested using data derived from a Fourier analysis of the waveform obtained in the presence of different devices. In the case of [15], probabilistic Neural Networks are compared with multilayer with feedback using Wavelet with multiresolution analysis to extract the characteristics, and it was concluded that probabilistic Neural Networks are more efficient than multilayer Neural Networks. In [38], the increased effectiveness of probabilistic Neural Networks for event classification was also concluded. In this case, instead of performing it in the frequency domain, it is performed in the time domain, so that the analysis and extraction of characteristics is conducted through mathematical morphology models and with the Teager energy operator.In [39], convolutional Neural Networks are used to detect and classify disturbances.

2.3.2. Genetic Algorithms

As described in the previous section for the feature selection stage, genetic algorithms are algorithms inspired by individuals’ natural selection and genetic combination mechanisms. They are adaptive methods that can be used to solve search and optimization problems, so they are suitable for the classification of types of disturbances.
In [12], genetic algorithms are used to classify faults. In this case, the analysis and extraction of features is performed with Wavelet.

2.3.3. Decision Trees

Decision-tree-based learning is used as a predictive or classification model. In decision tree structures, the leaves represent the different classes and branches the characteristics that lead to the classes.
In [40], a method based on decision trees is used for detection and classification. In this case, the analysis of the signals is performed with a mode of variable decomposition. This article discusses both simple and combined events. In [41], a rule-based decision tree is used as a classifier, while analysis and feature extraction is performed with a multiresolution S-transform. In [28], a gradient-enhanced decision tree is used to recognize the disturbance source, compromised in the article is the fact that gradient-enhanced decision trees enable better recognition efficiency.

2.3.4. Statistical Methods

In [42], a new approach to event classification using the Hidden Markov model combined with Wavelet Transform is proposed. Wavelet Transforms result in the power distribution of signals. They are then used as input to the Hidden Markov model. In addition, the Dempster–Shafer algorithm is used to improve classification accuracy.In [43], an expert system is used for classification that uses an analytical hierarchical process as learning.

2.3.5. Euclidean Distance Methods

They are classification algorithms that base their decision making on the Euclidean distance between the test case and the class models. In [42], a classification model based on Euclidean distance, combined with a feature extraction based on the Discrete Cosine Transform, allows to identify seven types of disturbance events.

2.3.6. Fuzzy Systems

Fuzzy systems are based on fuzzy logic, which adapts the problem to the real-world language. It is based on different join, intersection, difference, denial, or addition operations. For each fuzzy set there is an associated membership function for its elements that indicates the extent to which that element is part of the fuzzy set. It is based on heuristic rules of the form If... then... . These systems are used when the complexity of the process is very high and there are no mathematical models that model it accurately (nonlinear processes, subjective processes, etc.). It is widely used for decision systems, so it is suitable in the objective of disturbances classification.
In [44], fuzzy logic is used to cluster signal characteristics extracted using Fuzzy C-means algorithms combined with either particle swarm optimization or genetic algorithms to improve efficiency.

2.3.7. Neuro-Fuzzy Systems

The union of Neural Networks and fuzzy logic allows a hybrid system combining the human reasoning of fuzzy techniques and the learning and connective structure of Neural Networks. The strength of these systems is the ability to involve two requirements: interpretability and accuracy. Systems that focus on interpretability often use the Mamdani model and focus on accuracy use the Takagi–Sugeno–Kang model. Normally, this combination generates expert systems. These systems emulate human reasoning by behaving as an expert in an area of knowledge would. To perform this, expert systems are based on pre-established rules and Bayesian Networks. For cases with similar problems that adapt to the new problem, expert systems uses fuzzy logic. Bayesian Networks are based in statistical and Bayes Theorem.
In [45], a Neuro-Fuzzy based on learning and classification is used. In [46], a new technique allows learning about supply quality waveforms. The approach is the use of an intelligent technique based on leveraging the adaptive learning capabilities of adaptive Neuro-Fuzzy systems. In [47], an expert system consisting of a combination of Neural Networks and fuzzy logic is used to increase classification accuracy by up to 98.19 %.

2.3.8. Random-Forest Systems

They are systems in which predictive decision trees are combined so that every tree depends on the values of a random vector that is tested. In terms of performance, it is very similar to decision trees with gradient enhancement, but it is easier to train and adjust, so Random-Forest is very popular and highly used. The main advantages of this system are that it is one of the most efficient learning algorithms that is available both by results and by simulation time, it provides information on the most important variables in the classification, and is a very effective method to estimate data when there has been a loss of them.
In [34], Random-Forest is used as a classifier using as input the optimal characteristic values obtained from an analysis with an image enhancement system.

2.3.9. Support Vector Machines (SVM)

Support vector machines are a set of supervised learning algorithms used for classification and regression.
In [48], the characteristics of the disturbances are extracted with an S-Transform and then classified with a support vector machine with a directed acyclic graph. This DAG-SVM system allows you to predict the types of disturbances. The high effectiveness of this system is checked for both simple events and combinations. In [30], empirical decomposition in set modes is used for feature extraction and multilabel learning based on a Wavelet vector support machine.

2.4. Summary of Methods for Identification of Disturbing Cause Types

A summary of the different methods explained above is presented in Table 2.
Figure 3 represents the level of performance in the y-axis versus the level of complexity in the x-axis versus the level of development of the purpose techniques that is represented by the marker’s size.The evaluation of the performance, complexity and development of each technique is obtained through a decision matrix. In this matrix, the level of performance is weighted based on the results and conclusions obtained in each reference, the level of complexity is weighted based on the complexity of the mathematical developments and the processing costs associated with each reference and the level of development is weighted based on the scope of the results, the number of references for each technique and the applications of each technique. The assessment of the application of each technique is not only made for the purpose of the paper but also for similar applications. The scope of the results is evaluated with three stages; theoretical development, simulation applied development and field applied development. In Table 3, the normalized weights from 0 to 1 for each method is showed. All this criteria is summarized in Figure 3.

3. Location of Disturbing Sources

The physical locations of disturbing sources have greater complexity than their identification. Identification is based to a greater extent on learning algorithms that, based on the characteristics of each event, can estimate what type of event has occurred. The case of localization has greater complexity because the networks are currently very complex topologically, the distributed generation introduces converters that generate disturbances, there are a large number of nonlinear loads, etc. Despite this, there are numerous solutions that can be applied to locate the disturbing source in the technical literature. In the case of localization, they are grouped by the type of disturbance they locate. First, references to a system for the location of all disruptive loads are analyzed, and subsequently those that study a system for specific disturbances.

3.1. Methods for Localization of All Kinds of Disturbances

There are numerous references regarding the location of all kinds of disturbances in a network in the technical literature. Most of them are divided into two main methods. The first is the location of disturbances based on the disturbances’ interaction method, and the second is the location in the base of the direction of disturbance.

3.1.1. Methods Based on Interaction Disturbance Methods

In [49], different alternatives are planned for the allocation of responsibility for disturbances. To perform this, the aim is to compare the extracted components of the current with the current in general. The decomposition in this paper is based on the FBD theory proposed by Depenbrock for stationary cases that are presented by the German Standards DIN-40110-1 [50] and DIN-40110-2 [51]. Finally, the method is based on the orthogonal decomposition of current in 5 components related to asymmetry, phase displacement and waveform distortion.
A causality assessment based on epidemiological criteria and the method of interaction of disturbances is carried out in [52]. The disturbance interaction method is first applied to compare currents with reference conditions. To assess the interaction of disturbances between company and customers, the measures should follow the guidelines of the Standard IEC-61000-4-30 [53]. Subsequently, the interaction matrices and contributions of each of the circuits are calculated in each disturbance. Finally, causality is assessed, understood as the identification of elements belonging to a system and that with their conditions that are combined result in a state of lack of supply quality. Several methods are discussed, among which are: the critical impedance method [9,54], the multipoint method [9], the measures-based index [9,55], the harmonic pollution method [9] and the DIN-40110 indicators and IEEE 1459 [9,56] indicators. Specifically, in [9], existing methodologies for the Responsible Assignment Problem are compared through a laboratory setup. This paper achieves useful conclusions to select the most appropriate method. The accuracy of the results in the critical impedance method is heavily dependent on the modeling of the feeding system and the loads. In the case of the feeding system, the modeling is solved and employed by many technical papers and standards, but in the case of the nonlinear loads, this fact is not solved. This method would need different solutions for every case when nonlinear loads are being modeled. In the case of the multipoint method, it is concluded that it is one of the most important methods to evaluate the location of the disturbance origin, but the analysis of the index obtained by the method is a very difficult task. This method needs modification to improve the quality of the results. The harmonic pollution method presents an interesting option to asses the contribution of several customers or utilities in a disturbance. The advantage of this method is that it uses the currents measured and does not need power quantities, which could increase the uncertainty of the method. In addition, the use of the current, that is a physical variable, helps to understand the results and simplifies the implementation. The main disadvantage of this method is the need for simultaneous measurements and a high degree of knowledge of the system and load impedances. Finally, the review analyzes the application of the German Standard DIN 40110. The advantage of this method is that the current decomposition proposed allows for focusing on a specific component of the current and is universally applicable.
In [57], a statistical analysis is carried out to the [49] procedure to improve the allocation of responsibilities in the disturbance interaction method.

3.1.2. Methods Based on the Direction of Disturbance

The other main method that is repeated in the state of the art of disturbance location is a method based on the direction of disturbance.
In [58], a systematic algorithm for locating the source of disturbance based on the distribution scheme of monitoring sensors and the search for the direction of disturbance is presented. The first step is to construct a graph that represents the topology of its incident matrix to have a network matrix (impedance or support matrix). Next is the generation of the coverage matrix that indicates the relationship between the location of the measurement device and the line. The following task is the representation of the direction matrix, which can be obtained by different methods: energy flow method, power harmonic flow method, etc. Finally, by multiplying the coverage matrix by the direction matrix, it is possible to identify the likely locations of the disturbance. A distance calculation algorithm is used to obtain better accuracy.
In [59], the coverage matrix defined in [58] is improved by calculating vectors through the relationship between the absolute value of the final disturbance energy and the absolute value of the disturbance energy peak. Vector coefficients allow to observe which line is most likely to be the source of the disturbance.
In [60], an improvement of the disturbances diagnosis by modifying the coverage matrix is proposed.This article locates the disturbing source by decomposing the disturbance signal using the Wavelet Transform and extracting transient signals from the disturbance power and stationary state, respectively. It uses two localization algorithms depending on the characteristics of the disturbance. In addition, it proposes the use of evidence theory to process information that comes from different sources and thus improve accuracy.
In [61], there is also a model proposing the use of the power disturbance direction and the disturbance energy as a locator. In this case, the direction is obtained with an orthogonal Wavelet transformation to obtain the high-frequency energy. The disturbance direction information at each monitoring point is then used as input to a Bayesian network system to locate the source.

3.1.3. Other Alternative Methods

In [62], the model proposed is more focused on low-voltage public networks. This model is based on the correlation between the trend of supply quality parameters in a low-voltage network and the characteristics of consumption connected to the MV/LV transformation center. In [63], the authors intended to identify both the disturbance cause and the cause through measures of tension and current.In the first step, a causal and anticausal segmentation of the voltage registers of different monitoring points is performed to find the transition segments. Disturbances are then preclassified based on the number of transition segments. With a Kalman filter, a gross estimate of the location is obtained that is fine-tuned through the information obtained through the phase angles of the current before and after the disturbance, with the initial angles of the fundamental and subsequent harmonics, etc.

3.2. Harmonics Localization Methods

In the case of harmonic locations, the methods are mainly divided in two categories; one based on the equivalent circuit model and the other based on the harmonic state estimation.

3.2.1. Methods Based on Equivalent Circuit Model

There are authors who perform a location of the customer or generator that produces harmonics in the network using the theory of linear electrical circuits applying superposition [64,65,66]. In [67], the superposition method described in the previous articles is improved to obtain results without the need to know perfectly the equivalent impedances of the system and customers. This article bases the selection of the responsibilities on the the complex value of the harmonic currents generated by the supplier and the costumer. It uses a tuned filter, a dominant impedance, in the coupling point between the source and the load that provides the proportions of responsibilities.
In [68], a method which measures the voltage at two arbitrary points of the circuit and obtains the stress ratio is used. This method is based on the relationship between the voltage of two nodes in a system which have a constant value defined only by the source of disturbances.
A method of dividing responsibilities based on the total distortion impedances is presented in [69]. The first step in the method is to apply the waveform correlation coefficient method to identify the harmonics of the circuits. The second step is to establish the equivalent model of the multiple harmonic sources identified based on the equivalent circuit. The third step is the calculation of the harmonic impedance by linear regression method. Finally, the estimation result of the regression equation with a higher fitting degree is selected as the total harmonic impedance. The estimation accuracy can be improved if the type of the disturbance is identified, and then the harmonic responsibility is obtained. This method is compared with the method of estimating harmonic responsibility directly based on Fourier, and the proposed method is more accurate.

3.2.2. Methods Based on Harmonic State Estimation

In [70], the authors propose a method based on the IEEE Std 1459-2010 [71], where the harmonic distortion power is defined. Through the decomposition of the voltage and current into fundamental and harmonic components, the distortion power is obtained. This index can only identify the load condition, but it is difficult to locate the responsible harmonics between the utility and the customer. The information of the grid is used to obtain a threshold value to determine if the main harmonics source is the utility or the customer. The threshold value is defined as the squared value of the background voltage THD. If the harmonic distortion is larger than the threshold, the harmonic distortion is on the customer side, otherwise it is on the utility side.
In [72], a software (HARM TRACER) is developed to identify the source and type of harmonics in a radial distribution network based on harmonic measurements at a given location on the network. This program is based on the direction harmonics flow in the network relative to the measurement points.
In [73], as in [72], a method based on power harmonic flow direction is developed. In this case, the Fourier series decomposition is used to identify the magnitude and phase of the harmonic components. The differences between each angle of the voltage harmonics and the current harmonics are identified, with differences ranging between 270 and 360 and 0 and 90 considered as the positive direction of the current.
In [74], two harmonic localization methods are compared: the harmonic power flow direction method and the harmonic voltage and harmonic current correlation analysis method. This paper concludes that, for the events analyzed, the harmonic power flow direction method is more reliable.
In [75], a novel method is proposed to use less prior information. This method is the result of the combination of the Complex Independent Component Analysis (CICA), which is an advanced signal processing method designed to separate mutually independent components and sparse component analysis. This article concludes that this method improves the accuracy of the harmonic source location without the need of precise knowledge of the system impedances. In practical application, this method requires many measurement nodes and the knowledge of the number of harmonic sources to achieve good accuracy. For this reason, a new blind source separation approach based on Sparse Component Analysis is developed in [76]. The harmonic voltage is used as the input of the Sparse Component Analysis to separate the harmonic current and the conditional entropy. The harmonic current and the system node are calculated.The node with the minimum condition entropy is the location of the harmonic source.
In [77], the authors propose a method based on the variation of the power system resistance and transformer resistance by changing the transformation ratio in substations, taking into account that the voltage total harmonic distortion depends on the transformation ratio. The procedure calculates the derivative of the voltage total harmonic distortion with respect to the transformation ratio. If the derivative increases, the influence by the source of distortion on the load side increases, and if the derivative decreases, the influence by the source of distortion on the supply’s main side increases.
Other methods include the state estimation technique for identifying the spectrum of the injection bus current combined with least squares to locate the harmonic source [78].

3.3. Methods of Voltage Sag and Capacity Switching Localization

3.3.1. General Methods to Locate Voltage Sag and Capacity Switching

A common method for identifying the voltage sag’s source in a system is based on the direction of disturbance through power and disturbing energy. In [79], a joint analysis of the voltage sag source identification and capacity switching is conducted. This paper uses the voltage and current waveforms in the monitoring elements to calculate the instantaneous power. The difference between three-phase instantaneous power during the event and three-phase instantaneous power in the stationary state is called disturbing power. This disturbance power analyzes the existence of a voltage sag or switching of capacities. The disturbance energy is then calculated taking into account that changes in power and disturbance energy indicate the direction of the sag’s source and capacity switching.
In [80], the flow direction method posed in [79] is used, but more specific rules for capacity switching are defined. In this case, the net change in the disturbance energy (the relationship between the maximum negative disturbance energy and the change in the disturbance energy), the polarity of the initial peak of the disturbance power and the polarity of the maximum peak of the disturbance power are analyzed.
Another method proposed in the technical literature is based on the relationship between the magnitude of the voltage and the power factor versus the magnitude of the current. This relationship is different depending on the location of the voltage sag sources. In the case of [81], it is raised only for sags.
In [81], the origin of a voltage sag is obtained through the estimation of the equivalent impedance of the nondisruptive side using the changes in voltage and current caused by the disturbance. The sign of the equivalent impedance’s actual part can reveal where the voltage sag occurred.
In [82], a method based on the analysis of energy and a method base on the impedance variation during the disturbance are compared, and the advantages and disadvantages of each method are presented.
In the case of [83], a clustering algorithm combined with decision rule is used to point out the region that aggregates the place of origin. In this case, the clustering algorithm analyzes the voltage signal and separates into clusters. Then, the Partial Decision Tree algorithm defines the decision rule set to be compared with the characteristics of each cluster.
In [84], a combination of the Adaboost algorithm and Neural Networks is used as a base classifier to determine the zone where the voltage sag starts.

3.3.2. Power System Fault Location Algorithms

One of the most important sources of voltage gaps are the faults on the electrical lines of the power system. For electricity distribution companies, the fault location is essential to improve the supply quality. Fault location algorithms enable the isolation and power restoration from the grid with the objective of developing a fully automatic self-healing system. There are a multitude of methods used for fault location, but so far no single method has been developed that is fully reliable, cost-effective and universally used. Depending on the type of fault and the type of network in which the detection is performed, the proposed algorithm will be more effective.
The are several methods for fault location using impedance-based methods. In [85], a traditional impedance-based fault location method is used. The line reactance after the occurrence of a fault is calculated and compared with the line reactance measured before the fault occurs, so that the distance to the fault can be estimated. In [86], variations to the traditional impedance-based method are made by making assumptions on the fault resistance and the load current distribution along the feeder. The results show that the method is limited to low-impedance faults and is not widely applied in practice. In [87], the analysis is based on the symmetrical component theory. In this method, the total feeder load is modeled as an equivalent load tap located at a certain distance from the substation where the voltage gap due to a ground fault is maximum.
More advanced methods include the fault location using traveling waves. This method is based on the transient voltages and currents, called traveling waves (pulses), which are generated at the fault location and propagate from that point in both directions towards the line terminals. Because a current or voltage wave travels at the speed of light, it is possible to estimate the distance to the fault point by measuring arrival times of the wave and its reflection. In [88,89], an air-mode reflected pulse is used. This method can locate quite high fault resistances. However, it requires a complicated system and no field tests have been performed to verify the method. A different method is presented in [90], which is based on injecting a continuous series of high-frequency pulses into the distribution network and recording the response in order to build a snapshot of the system behavior under prefault conditions. Once a fault is detected, the same procedure is performed. Due to the fault, this time the response will be different. Considering the propagation speed of the pulse through the line, the distance to the fault is calculated based on the time difference between the moments when the pulse is injected and when the two responses are separated.
Artificial intelligence methods are also used for fault location. In [91], fault location is obtained by training an adaptive neuro-noise inference system (ANFIS). The inputs to the system are obtained by analyzing the waveform of a current measured at the substation. In [92], a learning algorithm for the classification of multivariate data analysis (LAMDA) is developed for fault location. Other approaches use Wavelet Transform to decompose transients. These components contain information to locate the fault. This information is used to train a fuzzy neural system in [93,94] and an artificial neural network in [95] to locate the faults occurring in the network.
With the recent development and installation of intelligent elements for reading and communication along the electrical system, a greater number of fault location methods have been developed.
In [96,97,98], several methods based on monitoring smart meters implemented along the feeder in the low-voltage grid areas are proposed. Despite the large number of these devices implemented along the low-voltage grid, these types of methods are yet to be verified in the field and are methods that need further development to be considered.
In the case of isolated neural and compensated networks, the fault’s location is more complex due to the small fault currents produced. In [99], three methods based on the measurement of the current negative sequence component are presented. One of the methods is based on measuring the changes in the symmetrical components of the currents during a fault condition. Under fault conditions, the negative sequence current is quite significant with small variations from the feeder substation to the fault location, while it is negligible after the fault point. This forms the basis of the method. However, the evaluation of the method presented in this paper is based on simulations only. Furthermore, it does not provide sufficient information on the negative sequence component behind the fault point.

3.4. Methods for Localizing Unbalances

In the event that disturbances are caused by offsets in waveforms or unbalances of voltage and current, there are also several methods for locating the disturbance sources.
In [49], the method of disturbances interaction focused on offset unbalances and wave distortion is discussed. In this case, the sign of the active power negative sequence measured at the common coupling point is used. If the sign is positive, it indicates that the dominant asymmetry source is located on the power side, if negative it indicates that it is on the client side.
In [100], a systematic theoretical approach is used to study voltage unbalance. This unbalance is detected through asymmetry in lines and loads on interconnected networks. A new term called a voltage unbalance emission vector is defined to determine the overall influence produced by an asymmetric line or load on an unbalance. This identifies sources that are dominant in the production of unbalances.

3.5. Summary of Methods for the Disturbing Source Location

A summary of the different methods explained above is presented in Table 4. Figure 4 represents the level of performance in the y-axis versus the level of complexity in the x-axis versus the level of development of the purpose techniques, which is represented by the size of the markers. In the same way as in the methods for the identification of the disturbing cause types, the evaluation of the performance, complexity and development of each technique is obtained through a decision matrix. In this matrix, the level of performance is weighted based on the results and conclusions obtained in each reference, the level of complexity is weighted based on the complexity of the mathematical developments and the processing costs associated with each reference and the level of development is weighted based on the scope of the results, the number of references for each technique and the applications of each technique. The assessment of the application of each technique is not only made for the purpose of the paper but also for similar applications. The scope of the results is evaluated with three stages; theoretical development, simulation applied development and field applied development. In Table 5, the normalized weights from 0 to 1 for each method is showed. All this criteria is summarized in Figure 4.

4. Discussion

The complexity of the power system encourages electrical companies to keep the power quality at appropriate levels. In this paper. multiple methods to identify disturbance types and locate their origin were presented.
In the case of the identification of disturbance types, the most common methods are based on the signal processing through mathematical transforms (Wavelet—nine references, Hilbert Transform—six references and S-transform—four references) and the feature selection and classification of the disturbances through machine learning (Neural Networks—three references, Genetic Algorithms—three references and Neuro-Fuzzy systems—three references). The combination of these types of methods allows obtaining good levels of accuracy in the disturbance identification cause when the power systems signals are monitored with high sample rates. In high-voltage systems, the monitoring is very widespread, but in distributed or low-voltage systems there is a lack of monitoring systems to acquire a signal with a high sample rate.
In the case of the disturbing source’s location, the most common methods are based on Interaction Disturbances Methods with eight references and Direction of Disturbance methods with six references.There are two main problems associated with the method for the location of the disturbance. Firstly, the same disadvantage as that in the case of the disturbance type identification, the sample rates of the electrical signals, although in the Direction of Disturbance methods the suitable sample rate is not as high as in the identification of the disturbance type. Secondly, the difficulty to locate the disturbance’s origin when there is more than one disturbing origin. This last problem is the most important entry barrier to develop this type of method in an electrical power system.

Author Contributions

Conceptualization, R.M., P.C. and A.A.; formal analysis, R.M., P.C. and A.A.; investigation, R.M., N.G., F.S.M.; resources, R.M.; writing—original draft preparation, R.M., P.C. and A.A.; writing—review and editing, M.M., N.G., F.S.M., S.B. and A.L.; visualization, P.C. and A.A.; supervision, P.C. and A.A.; project administration, M.M.; funding acquisition, M.M. All authors have read and agreed to the published version of the manuscript.

Funding

This research was funded by the Ministery of Science, Innovation and Universities – State Research Agency (Spain) and the European Union FEDER funds with grant number “RTC-2017-6782-3” and name “LOcalización de averías, monitorización de estado y Control en redes de bAja TEnsión—LOCATE” and the Horizon 2020 Program by the European Commission with project reference No 864579, H2020-LC-SC3-2019-ES-SCC.

Institutional Review Board Statement

Not applicable.

Informed Consent Statement

Not applicable.

Data Availability Statement

No applicable.

Conflicts of Interest

The authors declare no conflict of interest.

References

  1. Patrão, C.; Delgado, J.; de Almeida, A.T.; Fonseca, P. Power Quality Costs estimation in Portuguese industry. In Proceedings of the 11th International Conference on Electrical Power Quality and Utilisation, Lisbon, Portugal, 17–19 October 2011; pp. 1–6. [Google Scholar] [CrossRef]
  2. Zhong, Q.; Huang, W.; Tao, S.; Xiao, X. Survey on assessment of power quality cost in Shanghai China. In Proceedings of the 2014 IEEE PES General Meeting|Conference Exposition, National Harbor, MD, USA, 27–31 July 2014; pp. 1–5. [Google Scholar] [CrossRef]
  3. Targosz, R.; Manson, J. Pan-European power quality survey. In Proceedings of the 2007 9th International Conference on Electrical Power Quality and Utilisation, Barcelona, Spain, 9–11 October 2007; pp. 1–6. [Google Scholar] [CrossRef]
  4. EN 50160:2010. Voltage Disturbances Standard EN 50160-Voltage Characteristics in Public Distribution Systems; Normalization Spanish Association: Madrid, Spain, 2010. [Google Scholar]
  5. Kaleybar, H.J.; Brenna, M.; Foiadelli, F.; Fazel, S.S.; Zaninelli, D. Power Quality Phenomena in Electric Railway Power Supply Systems: An Exhaustive Framework and Classification. Energies 2020, 13, 6662. [Google Scholar] [CrossRef]
  6. Lumbreras, D.; Gálvez, E.; Collado, A.; Zaragoza, J. Trends in Power Quality, Harmonic Mitigation and Standards for Light and Heavy Industries: A Review. Energies 2020, 13, 5792. [Google Scholar] [CrossRef]
  7. Garzón, C.; Pavas, A. Review of Responsibilities Assignment Methods for Harmonic Emission. In Proceedings of the 2019 IEEE Milan PowerTech, Milan, Italy, 23–27 June 2019; pp. 1–6. [Google Scholar] [CrossRef]
  8. Pavas, A.; Staudt, V.; Torres-Sanchez, H. Discussion on existing methodologies for the Responsibilities Assignment Problem. In Proceedings of the 2008 International School on Nonsinusoidal Currents and Compensation, Lagow, Poland, 10–13 June 2008; pp. 1–7. [Google Scholar] [CrossRef]
  9. Pavas, A.; Staudt, V.; Torres-Saanchez, H. Experimental investigation of existing methodologies for the Responsibilities Assignment Problem. In Proceedings of the 2009 IEEE Bucharest PowerTech, Bucharest, Romania, 28 June–2 July 2009; pp. 1–8. [Google Scholar] [CrossRef]
  10. Mishra, M. Power quality disturbance detection and classification using signal processing and soft computing techniques: A comprehensive review. Int. Trans. Electr. Energy Syst. 2019, 29, e12008. [Google Scholar] [CrossRef] [Green Version]
  11. Masoum, M.; Jamali, S.; Ghaffarzadeh, N. Detection and classification of power quality disturbances using discrete wavelet transform and wavelet networks. IET Sci. Meas. Technol. 2010, 4, 193–205. [Google Scholar] [CrossRef]
  12. Panigrahi, B.; Pandi, V. Optimal feature selection for classification of power quality disturbances using wavelet packet-based fuzzy k-nearest neighbour algorithm. IET Gener. Transm. Distrib. 2009, 3, 296–306. [Google Scholar] [CrossRef]
  13. Erişti, H.; Demir, Y. Automatic classification of power quality events and disturbances using wavelet transform and support vector machines. IET Gener. Transm. Distrib. 2012, 6, 968–976. [Google Scholar] [CrossRef]
  14. Mishra, S.; Biswal, B. Power signal disturbance identification and classification using a modified frequency slice wavelet transform. IET Gener. Transm. Distrib. 2013, 8, 353–362. [Google Scholar] [CrossRef]
  15. Win, N.N.K.; Zin, T.; Tun, H.M. Comparison of Power Quality Disturbances Classification Based on Neural Network. Int. J. Sci. Technol. Res. 2015, 4, 97–103. [Google Scholar]
  16. He, H.; Starzyk, J.A. A self-organizing learning array system for power quality classification based on wavelet transform. IEEE Trans. Power Deliv. 2006, 21, 286–295. [Google Scholar] [CrossRef]
  17. Gaing, Z.L. Wavelet-based neural network for power disturbance recognition and classification. IEEE Trans. Power Deliv. 2004, 19, 1560–1568. [Google Scholar] [CrossRef] [Green Version]
  18. Uyar, M.; Yildirim, S.; Gencoglu, M.T. An effective wavelet-based feature extraction method for classification of power quality disturbance signals. Electr. Power Syst. Res. 2008, 78, 1747–1755. [Google Scholar] [CrossRef]
  19. Chand, P.; Davari, A.; Liu, B.; Sedghisigarchi, K. Feature extraction of power quality disturbances using adaptive harmonic wavelet transform. In Proceedings of the Annual Southeastern Symposium on System Theory, Macon, GA, USA, 4–6 March 2007. [Google Scholar] [CrossRef]
  20. Ray, P.K.; Mohanty, S.R.; Kishor, N.; Catalao, J.P. Optimal feature and decision tree-based classification of power quality disturbances in distributed generation systems. IEEE Trans. Sustain. Energy 2014, 5, 200–208. [Google Scholar] [CrossRef]
  21. He, S.; Li, K.; Zhang, M. A real-time power quality disturbances classification using hybrid method based on s-transform and dynamics. IEEE Trans. Instrum. Meas. 2013, 62, 2465–2475. [Google Scholar] [CrossRef]
  22. Gargoom, A.M.; Ertugrul, N.; Soong, W.L. Automatic classification and characterization of power quality events. IEEE Trans. Power Deliv. 2008, 23, 2417–2425. [Google Scholar] [CrossRef] [Green Version]
  23. Chilukuri, M.V.; Dash, P.K. Multiresolution S-Transform-Based Fuzzy Recognition System for Power Quality Events. IEEE Trans. Power Deliv. 2004, 19, 323–330. [Google Scholar] [CrossRef]
  24. Li, T.Y.; Zhao, Y.; Li, N.; Feng, G.; Gao, H.H. New Method for Power Quality Detection based on HHT. Proc. CSEE 2005, 25, 52–56. [Google Scholar]
  25. Shukla, S.; Mishra, S.; Singh, B. Power quality event classification under noisy conditions using EMD-based de-noising techniques. IEEE Trans. Ind. Inform. 2014, 10, 1044–1054. [Google Scholar] [CrossRef]
  26. Shukla, S.; Mishra, S.; Singh, B. Empirical-mode decomposition with hilbert transform for power-quality assessment. IEEE Trans. Power Deliv. 2009, 24, 2159–2165. [Google Scholar] [CrossRef]
  27. Biswal, B.; Biswal, M.; Mishra, S.; Jalaja, R. Automatic classification of power quality events using balanced neural tree. IEEE Trans. Ind. Electron. 2014, 61, 521–530. [Google Scholar] [CrossRef]
  28. Pan, C.; Tan, J.; Feng, D. Identification of Power Quality Disturbance Sources using Gradient Boosting Decision Tree. In Proceedings of the 2018 Chinese Automation Congress, CAC 2018, Xi’an, China, 30 November 2018–2 December 2018. [Google Scholar] [CrossRef]
  29. Wang, Q.; Wang, T.; Sheng, J.; Zhang, X.; Shi, G. The power quality disturbance detection and classification method based on EMD. In Proceedings of the 2012 IEEE Innovative Smart Grid Technologies—Asia, ISGT Asia 2012, Tianjin, China, 21–24 May 2012. [Google Scholar] [CrossRef]
  30. Liu, Z.; Cui, Y.; Li, W. A Classification Method for Complex Power Quality Disturbances Using EEMD and Rank Wavelet SVM. IEEE Trans. Smart Grid 2015, 6, 1678–1685. [Google Scholar] [CrossRef]
  31. Xiao, Y.; Yang, H.; Liu, A. Short time disturbance detection using DCT analysis in distribution system. In Proceedings of the CIRED 2005—18th International Conference and Exhibition on Electricity Distribution, Turin, Italy, 6–9 June 2005. [Google Scholar] [CrossRef]
  32. Imtiaz, H.; Sanam, T.F. Frequency domain feature extraction for power quality disturbance classification. In Proceedings of the 2013 International Conference on Informatics, Electronics and Vision, ICIEV 2013, Dhaka, Bangladesh, 17–18 May 2013. [Google Scholar] [CrossRef]
  33. Krishna, B.; Kaliaperumal, B. Efficient Genetic-Wrapper Algorithm Based Data Mining for Feature Subset Selection in a Power Quality Pattern Recognition Application. Int. Arab J. Inf. Technol. 2011, 8, 397–405. [Google Scholar]
  34. Lin, L.; Wang, D.; Zhao, S.; Chen, L.; Huang, N. Power Quality Disturbance Feature Selection and Pattern Recognition Based on Image Enhancement Techniques. IEEE Access 2019, 7, 67889–67904. [Google Scholar] [CrossRef]
  35. Kumar, R.; Singh, B.; Shahani, D.T.; Chandra, A.; Al-Haddad, K. Recognition of Power-Quality Disturbances Using S-Transform-Based ANN Classifier and Rule-Based Decision Tree. IEEE Trans. Ind. Appl. 2015, 51, 1249–1258. [Google Scholar] [CrossRef]
  36. Liao, W.; Wang, H.; Han, P. Neural network-based detection and recognition method for power quality disturbances signal. In Proceedings of the 2010 Chinese Control and Decision Conference, CCDC 2010, Xuzhou, China, 26–28 May 2010; pp. 1023–1026. [Google Scholar] [CrossRef]
  37. Srinivasan, D.; Ng, W.S.; Liew, A.C. Neural-network-based signature recognition for harmonic source identification. IEEE Trans. Power Deliv. 2006, 21, 398–405. [Google Scholar] [CrossRef]
  38. Chen, Z.M.; Li, M.S.; Ji, T.Y.; Wu, Q.H. Detection and classification of power quality disturbances in time domain using probabilistic neural network. In Proceedings of the International Joint Conference on Neural Networks, Vancouver, BC, Canada, 24–29 July 2016; pp. 1277–1282. [Google Scholar] [CrossRef]
  39. Wang, S.; Chen, H. A novel deep learning method for the classification of power quality disturbances using deep convolutional neural network. Appl. Energy 2019, 235, 1126–1140. [Google Scholar] [CrossRef]
  40. Achlerkar, P.D.; Samantaray, S.R.; Sabarimalai Manikandan, M. Variational Mode Decomposition and Decision Tree Based Detection and Classification of Power Quality Disturbances in Grid-Connected Distributed Generation System. IEEE Trans. Smart Grid 2018, 9, 3122–3132. [Google Scholar] [CrossRef]
  41. Huang, N.; Zhang, S.; Cai, G.; Xu, D. Power quality disturbances recognition based on a multiresolution generalized S-transform and a PSO-improved decision tree. Energies 2015, 8, 549–572. [Google Scholar] [CrossRef]
  42. Dehghani, H.; Vahidi, B.; Naghizadeh, R.A.; Hosseinian, S.H. Power quality disturbance classification using a statistical and wavelet-based Hidden Markov Model with Dempster-Shafer algorithm. Int. J. Electr. Power Energy Syst. 2013, 47, 368–377. [Google Scholar] [CrossRef]
  43. Rajeshbabu, S.; Manikandan, B.V. Detection and classification of power quality events by expert system using analytic hierarchy method. Cogn. Syst. Res. 2018, 52, 729–740. [Google Scholar] [CrossRef]
  44. Biswal, B.; Dash, P.K.; Panigrahi, B.K. Power Quality Disturbance Classification Using Fuzzy C-Means Algorithm and Adaptive Particle Swarm Optimization. IEEE Trans. Ind. Electron. 2009, 56, 212–220. [Google Scholar] [CrossRef]
  45. Sekhar, P.C. Neuro-Fuzzy Approach for Fault Location and Diagnosis Using Online Learning System. J. Theor. Appl. Inf. Technol. 2010, 15, 48–55. [Google Scholar]
  46. Anis Ibrahim, W.R.; Morcos, M.M. Adaptive fuzzy technique for learning power-quality signature waveforms. IEEE Power Eng. Rev. 2001, 21, 56–58. [Google Scholar] [CrossRef]
  47. Reaz, M.B.I.; Choong, F.; Sulaiman, M.S.; Mohd-Yasin, F.; Kamada, M. Expert system for power quality disturbance classifier. IEEE Trans. Power Deliv. 2007, 22, 1979–1988. [Google Scholar] [CrossRef] [Green Version]
  48. Lin, S.; Huang, N.; Zhu, M. The study of the power quality emission characteristics of different types of lamps and their impacts on distribution systems. In Proceedings of the 2016 IEEE 11th Conference on Industrial Electronics and Applications, ICIEA 2016, Hefei, China, 5–7 June 2016; pp. 613–618. [Google Scholar] [CrossRef]
  49. Pavas, A.; Torres-Sánchez, H.; Staudt, V. Method of disturbances interaction: Novel approach to assess responsibilities for steady state power quality disturbances among customers. In Proceedings of the ICHQP 2010—14th International Conference on Harmonics and Quality of Power, Bergamo, Italy, 26–29 September 2010. [Google Scholar] [CrossRef]
  50. DIN 40110-1:1994-03. Quantities Used in Alternating Current Theory; Two-Line Circuits.; German Institute for Standardization: Berlin, Germany, 1994. [Google Scholar]
  51. DIN 40110-2:2002-11. Quatities Used in Alternating Current Theory—Part 2: Multi-Line Circuits; German Institute for Standardization: Berlin, Germany, 2002. [Google Scholar]
  52. Pavas, A.; Garzón, C. Application of the method of disturbances interaction for assessing origin of stationary power quality disturbances. In Proceedings of the International Conference on Harmonics and Quality of Power, ICHQP, Belo Horizonte, Brazil, 16–19 October 201; pp. 709–714. [CrossRef]
  53. IEC-61000-4-30:2015. Electromagnetic Compatibility (EMC)—Part 4-30: Testing and Measurement Techniques—Power Quality Measurement Methods; International Electrotechnical Commission: Geneva, Switzerland, 2015. [Google Scholar]
  54. Li, C.; Xu, W.; Tayjasanant, T. A “critical impedance”-based method for identifying harmonic sources. IEEE Trans. Power Deliv. 2004, 19, 671–678. [Google Scholar] [CrossRef]
  55. Castaldo, D.; Fenvro, A.; Salicone, S.; Testa, A. A power-quality index based on multi-point measurements. In Proceedings of the 2003 IEEE Bologna Power Tech Conference Proceedings, Bologna, Italy, 23–26 June 2003; pp. 722–726. [Google Scholar] [CrossRef]
  56. Muscas, C. Assessment of electric power quality: Indices for identifying disturbing loads. Eur. Trans. Electr. Power 2007, 8, 287–292. [Google Scholar] [CrossRef]
  57. Pavas, A.; Torres-Sanchez, H.; Staudt, V. Statistical analysis of power quality disturbances propagation by means of the Method of Disturbances Interaction. In Proceedings of the IEEE PES Innovative Smart Grid Technologies Conference Europe, Berlin, Germany, 14–17 October 2012; pp. 1–9. [Google Scholar] [CrossRef]
  58. Won, D.J.; Chung, I.Y.; Kim, J.M.; Moon, S.I.; Seo, J.C.; Choe, J.W. A new algorithm to locate power-quality event source with improved realization of distributed monitoring scheme. IEEE Trans. Power Deliv. 2006, 21, 1641–1647. [Google Scholar] [CrossRef]
  59. Guo, Q.; Jia, Q.; Bo, Z. Locating Power-Quality Event Source through Disturbance Measures. In Proceedings of the 45th International Universities Power Engineering Conference UPEC2010, Cardiff, UK, 31 August–3 September 2010. [Google Scholar]
  60. Dong, H.; Guo, Q.; Jia, Q.; Bo, Z.; Wang, S.; Yang, X. An algorthithm to locate power-quality disturbance source based on disturbance measures and information fusion theory. In Proceedings of the DRPT 2011—2011 4th International Conference on Electric Utility Deregulation and Restructuring and Power Technologies, Weihai, China, 6–9 July 2011. [Google Scholar] [CrossRef]
  61. Xu, R.; Tu, F.; Ren, L.; Zeng, Y.; Yuan, Q. Research on power quality disturbance source location of distribution network with distributed generation. In Proceedings of the 2017 International Conference on Circuits, Devices and Systems, ICCDS 2017, Chengdu, China, 5–8 September 2017. [Google Scholar] [CrossRef]
  62. Meyer, J.; Schegner, P. Characterization of power quality in low voltage networks based on modeling by mixture distributions. In Proceedings of the 2006 9th International Conference on Probabilistic Methods Applied to Power Systems, PMAPS, Stockholm, Sweden, 11–15 June 2006. [Google Scholar] [CrossRef]
  63. Le, C.D.; Bollen, M.H.; Gu, I.Y. Analysis of Power Disturbances from Monitoring Multiple Levels and Locations in a Power System. In Proceedings of the ICHQP 2010: 14th International Conference on Harmonics & Quality of Power, Bergamo, Italy, 26–29 September 2010; p. 7. [Google Scholar]
  64. Xu, W.; Liu, Y. A method for determining customer and utility harmonic contributions at the point of common coupling. IEEE Trans. Power Deliv. 2000, 15, 804–811. [Google Scholar] [CrossRef] [Green Version]
  65. Xu, W.; Liu, Y. A method to determine customer harmonic contributions for incentive-based harmonic control applications. In Proceedings of the 1999 IEEE Power Engineering Society Summer Meeting. Conference Proceedings (Cat. No.99CH36364), Edmonton, AB, Canada, 18–22 July 1999; Volume 1, pp. 361–366. [Google Scholar] [CrossRef]
  66. de Paula Silva, S.; Oliveira, J. The sharing of responsibility between the supplier and the consumer for harmonic voltage distortion: A case study. Electr. Power Syst. Res. 2008, 78, 1959–1964. [Google Scholar] [CrossRef]
  67. Santos, I.N.; de Oliveira, J.C.; Macedo, J.R. Modified superposition method for assignment of responsibilities on harmonic distortions. In Proceedings of the 11th International Conference on Electrical Power Quality and Utilisation, St. Petersburg, Russia, 27–30 June 2005; pp. 1–5. [Google Scholar] [CrossRef]
  68. Korovkin, N.; Balagula, Y.; Adalev, A.; Nitsch, J. A method of a disturbance source localization in a power system. In Proceedings of the 2005 IEEE Russia Power Tech, St. Petersburg, Russia, 27–30 June 2005; pp. 1–6. [Google Scholar] [CrossRef]
  69. Yu, X.; Liu, H.; Wu, L.; Gan, G.; Chen, S. A Method of Dividing Harmonic Responsibility Based on Total Harmonic Impedance. In Proceedings of the 2021 4th International Conference on Energy, Electrical and Power Engineering (CEEPE), Chongqing, China, 23–25 April 2021; pp. 998–1003. [Google Scholar] [CrossRef]
  70. Jun, L.; Mingxing, T.; Ziting, W. The Location of the main harmonic source based on the nonfundamental apparent power in the IEEE Std. 1459-2010. Electr. Meas. Instrum. 2018, 55, 34–39. [Google Scholar]
  71. IEEE Standard Definitions for the Measurement of Electric Power Quantities Under Sinusoidal, Nonsinusoidal, Balanced, or Unbalanced Conditions. IEEE Std 1459-2010 (Revision of IEEE Std 1459-2000); IEEE: Manhattan, NY, USA, 2010; pp. 1–50. [Google Scholar] [CrossRef] [Green Version]
  72. Teshome, A. Harmonic source and type identification in a radial distribution system. In Proceedings of the Institute of Electrical and Electronics Engineers (IEEE), Dearborn, MI, USA, 6 August 2002; pp. 1605–1609. [Google Scholar] [CrossRef]
  73. Leiria, A.; Morched, A.; Correia De Barros, M.T. Identification of harmonic content and their origin in Power Networks. In Proceedings of the 2003 IEEE Bologna PowerTech—Conference Proceedings, Bologna, Italy, 23–26 June 2003. [Google Scholar] [CrossRef]
  74. Schau, H.; Novitskiy, A. Identification of the Dominant Harmonic Source in the LV Network on the Base of Anomalous Power Flows Considerations. In Proceedings of the 2005 IEEE Russia Power Tech, PowerTech, St. Petersburg, Russia, 27–30 June 2005; pp. 1–5. [Google Scholar] [CrossRef]
  75. Wang, G.; Ma, X.; Wang, W.; Yang, H.; Chen, C.; Yang, Q. Multi-harmonic sources location based on sparse component analysis and complex independent component analysis. IET Gener. Transm. Distrib. 2020, 14, 4195–4206. [Google Scholar] [CrossRef]
  76. Du, Y.; Yang, H.; Ma, X. Multi-Harmonic Source Localization Based on Sparse Component Analysis and Minimum Conditional Entropy. Entropy 2020, 22, 65. [Google Scholar] [CrossRef] [PubMed] [Green Version]
  77. Skamyin, A.N.; Dobush, V.S.; Rastvorova, I.V. Method for Determining the Source of Power Quality Deterioration. In Proceedings of the 2019 IEEE Conference of Russian Young Researchers in Electrical and Electronic Engineering (EIConRus), Saint Petersburg and Moscow, Russia, 28–31 January 2019; pp. 1077–1079. [Google Scholar] [CrossRef]
  78. Heydt, G. Identiication od Harmonic Sources by a State Estimation Technique. IEE Trans. Power Deliv. 1989, 4, 569–576. [Google Scholar] [CrossRef] [Green Version]
  79. Parsons, A.; Grady, W.; Powers, E.; Soward, J. A direction finder for power quality disturbances based upon disturbance power and energy. In Proceedings of the 8th International Conference on Harmonics and Quality of Power. Proceedings (Cat. No.98EX227), Athens, Greece, 14–16 October 1998; Volume 2, pp. 693–699. [Google Scholar] [CrossRef]
  80. Parsons, A.C.; Grady, W.M.; Powers, E.J.; Soward, J.C. Rules for locating the sources of capacitor switching disturbances. In Proceedings of the 1999 IEEE Power Engineering Society Summer Meeting, PES 1999—Conference Proceedings, Edmonton, AB, Canada, 18–22 July 1999; Volume 2, pp. 794–799. [Google Scholar] [CrossRef]
  81. Tayjasanant, T.; Li, C.; Xu, W. A resistance sign-based method for voltage sag source detection. IEEE Trans. Power Deliv. 2005, 20, 2544–2551. [Google Scholar] [CrossRef]
  82. Solak, B.; Sikorski, T. Analysis of Voltage Dip Source Location Methods. In Proceedings of the 2019 Modern Electric Power Systems (MEPS), Wroclaw, Poland, 9–12 September 2019; pp. 1–6. [Google Scholar] [CrossRef]
  83. Filho, J.L.; da Silva Borges, F.A.; Rabelo, R.d.A.L.; Silva, I.S.; Junior, R.P.T.; de Carvalho Filho, A.O. Methods for voltage sag source location by Cluster Algorithm and Decision Rule Labeling with a Comparative Approach of K-means and DBSCAN Clustering Algorithms. In Proceedings of the 2020 5th International Conference on Smart and Sustainable Technologies (SpliTech), Split, Croatia, 23–26 September 2020; pp. 1–8. [Google Scholar] [CrossRef]
  84. Borges, F.A.S.; Rabêlo, R.A.L.; Fernandes, R.A.S.; Araújo, M.A. Methodology Based on Adaboost Algorithm Combined with Neural Network for the Location of Voltage Sag Disturbance. In Proceedings of the 2019 International Joint Conference on Neural Networks (IJCNN), Budapest, Hungary, 1419 July 2019; pp. 1–7. [Google Scholar] [CrossRef]
  85. Novosel, D.; Hart, D.; Hu, Y.; Myllymaki, J. System for Locating Faults and Estimating Fault Resistance in Distribution Networks with Tapped Loads. U.S. Patent 5839093, 17 November 1998. [Google Scholar]
  86. Hänninen, S.; Lehtonen, M. Earth Fault Distance Computation with Fundamental Frequency Signals based on Measurements in Substation Supply Bay. VTT Research Notes 2153. 2002. Available online: https://www.vttresearch.com/sites/default/files/pdf/tiedotteet/2002/T2153.pdf (accessed on 16 May 2021).
  87. Altonen, J.; Wahlroos, A. Advancements in fundamental frequency impedance-based earth-fault location in unearthed distribution systems. In Proceedings of the CIRED 19th International Conference on Electricity Distribution, Vienna, Austria, 21–24 May 2007. [Google Scholar]
  88. Elkalashy, N.I.; Sabiha, N.A.; Lehtonen, M. Earth Fault Distance Estimation Using Active Traveling Waves in Energized-Compensated MV Networks. IEEE Trans. Power Deliv. 2015, 30, 836–843. [Google Scholar] [CrossRef]
  89. Sadeh, J.; Bakhshizadeh, E.; Kazemzadeh, R. A new fault location algorithm for radial distribution systems using modal analysis. Int. J. Electr. Power Energy Syst. 2013, 45, 271–278. [Google Scholar] [CrossRef]
  90. Buzo, R.F.; Barradas, H.M.; Leão, F.B. A New Method for Fault Location in Distribution Networks Based on Voltage Sag Measurements. IEEE Trans. Power Deliv. 2021, 36, 651–662. [Google Scholar] [CrossRef]
  91. Mora, J.J.; Carrillo, G.; Perez, L. Fault Location in Power Distribution Systems using ANFIS Nets and Current Patterns. In Proceedings of the 2006 IEEE/PES Transmission Distribution Conference and Exposition: Latin America, Caracas, Venezuela, 15–18 August; pp. 1–6. [CrossRef]
  92. Mora-Florez, J.; Barrera-Nunez, V.; Carrillo-Caicedo, G. Fault Location in Power Distribution Systems Using a Learning Algorithm for Multivariable Data Analysis. IEEE Trans. Power Deliv. 2007, 22, 1715–1721. [Google Scholar] [CrossRef]
  93. Chunju, F.; Li, K.; Chan, W.; Weiyong, Y.; Zhaoning, Z. Application of wavelet fuzzy neural network in locating single line to ground fault (SLG) in distribution lines. Int. J. Electr. Power Energy Syst. 2007, 29, 497–503. [Google Scholar] [CrossRef]
  94. Rafinia, A.; Moshtagh, J. A new approach to fault location in three-phase underground distribution system using combination of wavelet analysis with ANN and FLS. Int. J. Electr. Power Energy Syst. 2014, 55, 261–274. [Google Scholar] [CrossRef]
  95. Pourahmadi-Nakhli, M.; Safavi, A.A. Path Characteristic Frequency-Based Fault Locating in Radial Distribution Systems Using Wavelets and Neural Networks. IEEE Trans. Power Deliv. 2011, 26, 772–781. [Google Scholar] [CrossRef]
  96. Pereira, R.A.F.; da Silva, L.G.W.; Kezunovic, M.; Mantovani, J.R.S. Improved Fault Location on Distribution Feeders Based on Matching During-Fault Voltage Sags. IEEE Trans. Power Deliv. 2009, 24, 852–862. [Google Scholar] [CrossRef]
  97. Jia, K.; Ren, Z.; Bi, T.; Yang, Q. Ground Fault Location Using the Low-Voltage-Side Recorded Data in Distribution Systems. IEEE Trans. Ind. Appl. 2015, 51, 4994–5001. [Google Scholar] [CrossRef]
  98. Trindade, F.C.L.; Freitas, W.; Vieira, J.C.M. Fault Location in Distribution Systems Based on Smart Feeder Meters. IEEE Trans. Power Deliv. 2014, 29, 251–260. [Google Scholar] [CrossRef]
  99. Lehtonen, M.; Siirto, O.; Abdel-Fattah, M.F. Simple fault path indication techniques for earth faults. In Proceedings of the 2014 Electric Power Quality and Supply Reliability Conference (PQ), Rakvere, Estonia, 11–13 June 2014; pp. 371–378. [Google Scholar] [CrossRef]
  100. Paranavithana, P.; Perera, S. Location of sources of voltage unbalance in an interconnected network. In Proceedings of the 2009 IEEE Power and Energy Society General Meeting, PES’09, Rakvere, Estonia, 11–13 June 2014; pp. 1–6. [Google Scholar] [CrossRef]
Figure 1. Summary of the identification and location process.
Sustainability 14 07428 g001
Figure 2. Histogram of the publication years of each paper.
Sustainability 14 07428 g002
Figure 3. Performance vs. complexity vs. development of the proposed techniques for type identification.
Sustainability 14 07428 g003
Figure 4. Performance vs. complexity vs. development of the proposed techniques for disturbance locations.
Sustainability 14 07428 g004
Table 1. Most common disturbances with their impacts and causes.
CategoryCausesImpacts
Voltage SagsLightning.
Contact with animals or trees.
Connection of large loads.
Starting an engine—three-phase fault (fast).
Power supply of a transformer.
Transformer socket change (fast).
Disconnecting capacitors.
Insulation failure.
Shooting sensitive equipment.
Reset control systems.
Motor lock/trigger.
Flicker.
SurgesDisconnect/reject large loads.
Missing phase.
Load switching.
Voltage regulation.
Condenser power supply.
Sensitive equipment firing.
Damage to isolators and windings.
Damage to power supplies.
Problems with equipment requiring constant tension.
HarmonicsPower supply of a transformer (pairs).
Nonlinear loads.
Industrial furnaces.
Transformers/generators.
Rectifiers.
Ferroresonance.
Faulty operation in sensitive equipment and relays.
Failures in the capacitors or fuses thereof.
Phone interference in old analogic circuits.
Frequency
variation
Loss of generation.
Extreme charging conditions.
Engines run at lower speeds.
Harmonic filters do not work properly.
Voltage
fluctuation
AC motor drives.
Currents with interharmonic components.
Welders and arch furnaces.
Flicker.
UnbalancesUnbalanced loads.
Unbalanced impedances.
Insulation failures.
Engine/generator overheating.
Interruption of three-phase operation.
InterruptionsFuse burnt.
Switching switches.
Faults.
Control system failures.
Power loss.
Computer shutdown.
Engine firing.
UndervoltagesLoss of generation.
Very loaded network.
Low power factor.
All equipment without additional power.
TransientsPower supply of capacitors.
Rays.
Switching switches.
Voltage regulation.
Switching nonlinear loads.
Reset control systems.
Damage to sensitive electronic equipment.
Damage to insulators.
Low Power FactorNonlinear loads.
Rectifiers.
Switching switches.
Lower efficiency.
High power losses.
Heating of devices.
High voltage sags.
Electromagnetic InterferenceTelecomunication systems.
Electronical devices.
Switching systems.
Electrostatic discharge.
Induction motors.
Lower efficiency.
Interruptions.
Malfunction of devices.
Table 2. Summary of methods for identification of disturbing cause types.
MethodApplicationModificationsAdvantagesDisadvantages
Signal
Analysis
and Feature
Extraction
Feature
Selection
Classification
Wavelet [11,12]Wavelet + normalization + segmentation [13]
Wavelet + modified frequency fraction [14]
Wavelet + multiresolution analysis [15,16,17]
Wavelet + entropy-based normalization [18]
Wavelet + adaptative harmonic transform [19]
Efficient for analyzing nonstationary signals with
fast transients.
Better performance than other methods.
Cross-term problems.
The accuracy highly depends on the Wavelet function selected.
It is usually difficult to determine the decomposition scales.
Traditional Wavelet is not completely self-adapting.
S-transform [20] S transform + reduction in simulation time [21]
S-transform + multiresolution [22,23]
S-transform + Parseval theorem [22]
Identifies dilatations and transfers of the Gaussian
window.
The characteristics obtained are more suitable for
pattern recognition than Wavelet.
Excellent time-frequency resolution.
Fewer features than Wavelet to obtain the same result.
The clarity of the signal is worse than others.
Hilbert Transform Hilbert–Huang combination [24,25,26,27]The combination with the Huang algorithm improve its
characteristics.
Only Hilbert Transform needs a signal with
narrow bandwidth.
Statistical
Methods [28]
For feature selection:
- Orthogonal transformation [11]
For classification:
- Hidden Markov Model [42]
- Dempster–Shafer algorithm [42]
- Expert system with analytical hierarchical
process [43]
Simple algorithms.Less accuracy.
Empirical
decomposition
in set modes
EMD + Hilbert Transform [29,30]With set decomposition the problem of modal overlaps
is solved.
Better capacity for scale separation.
If there is mode mixing, EMD cannot decompose the
original data sequence correctly.
Discrete cosine
transform [31,32]
Simpler than Fourier.
Concentrates most of the information into few transformed
coefficients.
The algorithm is independent on the input data.
Great capacity to interpret the coefficients from a frequency
point of view.
Accuracy result only for short time disturbances and
heavy noise.
Genetic algorithms Multi-object genetic algorithms [33]
Genetic Algorithm + Wavelet [12]
For feature selection, minimize classification errors
and size.
For classification, represent adaptive methods.
The selection of the appropriate Genetic Algorithms is complex.
The complexity of the optimum algorithms is high.
Image enhancement techniques [34] Highlights in an image the most appropriate characteristics.This technique applied to feature selection is a low-usage technique.
Neural NetworksNeural Networks + rule-based decision tree [35]
Neural Networks + multilayer perceptron [37]
Neural Networks + radial-based function [37]
Neural Networks + support vector machine [37]
Neural Networks + kernels [37]
Convolutional Neural Networks [39]
Simple use for appropriate results.Complex use for the highest accuracy.
Decision treeDecision tree + mode of variable decomposition [40]
Rule-based Decision Tree [41]
Gradient-enhanced Decision Tree [28]
Gradient-enhanced Decision Tree enables better
recognition efficiency.
Changes in the data greatly affect the stability of the system.
It is not suitable for regression and prediction of continuous
values.
Fuzzy Systems [44]Fuzzy C-means
Fuzzy + Genetic Algorithms
Efficient when the complexity of the process is very
high and there are no mathematical models.
Subjective or qualitative results.
An expert is needed to train the algorithm.
Neuro-Fuzzy
Systems [45,46,47]
Neuro-Fuzzy + Mamdami model
Neuro-Fuzzy + Takagi–Sugeno–Kang model
Neuro-Fuzzy + Bayesian Networks
Improves the interpretability and the accuracy.An expert is needed to train the algorithm.
Random Forest
Systems [34]
High accuracy similar to Gradient-enhanced
Decision Tree.
One of the most efficient learning algorithms by
results and simulation time.
Very effective to estimate data when there has been
a loss of data.
The computational requirements and the training time are high.
Support Vector
Machines
Support Vector Machine + direct acylic graph [47]
Support Vector Machine + Wavelet [30]
High effectiveness for both simple events and
combinations.
It is not suitable for large data sets.
Table 3. Normalized weights of each method.
ComplexityPerformanceDevelopment
Wavelet0.330.711.00
S-Transform0.500.860.78
Hilbert Transform0.830.430.44
Statistical Methods0.000.000.89
Empirical Decomposition0.830.140.44
Discrete Cosine Transform0.500.140.33
Genetic Algorithms0.830.570.78
Image Enhancement Techniques0.500.000.00
Neural Networks0.171.001.00
Decision Tree0.670.430.78
Fuzzy Systems0.500.710.78
Random Forest0.831.000.89
Support Vector Machine1.000.710.67
Table 4. Summary of methods for the disturbing sources location.
Type of
Disturbances
General MethodCombinationsInput
Variables
AdvantagesDisadvantages
All kind of
disturbances
Interaction Disturbances Methods- FBD theory + Orthogonal decomposition of current
(based on DIN-40110-1 and DIN-40110-2) [49]
- Causality assessment based on epidemiological
criteria (IEC-61000-4-30) [52]
- Critical Impedance Method [9,54]
- Multipoint method [9]
- Measures-based index [9,55]
- Harmonic Pollution method + DIN-40110 indicator
+ IEEE 1459 indicators  [9,56]
- Statistical analysis [57]
CurrentThe method helps
the user to asses the contribution of each
circuit to the power quality problem.
- The complexity of the method is high.
- The interpretation of the results have a
degree of subjectivity.
- The waveform of the current is not
a typical value measured in the medium
and low-voltage systems.
-The method does not precisely locate
the disturbances’ origin.
Direction of disturbance:
- Disturbance Power
- Disturbance Energy Flow Method
- Disturbance Power Harmonic Flow Method
- Systematic algorithm based on scheme of monitoring
sensors [58]
- Wavelet signal decomposition + evidence theory  [60]
- Bayesian network [61]
Current- This method allows to locate the origin
of the disturbance with higher accuracy
than previous ones.
- In [58], good accuracy needs a complete deployment
of PQ sensors along the network.
- The location of the PQ sensors has a
great influence on the results.
- The inverse flow of current due to distributed
generation can affect to the accuracy of the method.
Correlation with characteristic values [62] Current and
voltage
- Simple method.- This method is very theoretical and the accuracy
decreases with the complexity of the real network.
Causal and anticausal segmentation of
voltage [63]
- Kalman filter [63]Current and
voltage
- This method combines the identification
of the cause and the location of the origin.
- Simple method.
- It is not suitable for systems with distributed
generation. The part of classification and feature
selection needs improvement.
HarmonicsEquivalent circuit model- Superposition [64,65,66,67]
- Nodes Ratio Voltage [68]
- Total Distortion Impedances [69]
Current and
voltage
-Simple methods.- Necessity of storing a large volume of information
for cases with more than three disturbing sources.
- In nonlinear circuits, the disturbance should be
small compared with the operating mode of the device.
- If the origin of disturbance is located symmetrically
regarding test nodes, then it is impossible to locate
this source.
Harmonic State Estimation- Harmonic Power Flow [70,72,73,74]
- CICA [75]
- Sparse Component Analysis [76]
- Variation of power system and
transformer resistances [77]
- Least Squares [78]
Current and
voltage
- These methods allow to locate the origin
of the disturbance with higher accuracy
than the previous ones.
- The location of the PQ sensors has a
great influence on the results.
- The inverse flow of current due to distributed
generation can affect to the accuracy of the methods.
Voltage sag
and capacity
switching
Direction of disturbance:
- Disturbance Power [79]
- Disturbance Energy Flow Method [79]
- Disturbance Power Harmonic Flow Method
- Net change in disturbance energy + polarity of
the initial peak of disturbance power + polarity
of the maximum peak of disturbance power [80]
Current and
voltage
- This method locates the origin of the
disturbance with high accuracy.
- The location of the PQ sensors has a
great influence on the results.
- The inverse flow of current due to distributed
generation can affect the accuracy of the methods.
Relationship between voltage and the power
factor with current [81]
Current and
voltage
- Simple method.- This method is not tested in a practical way.
- This method does not locate the origin of the
disturbance, it just decides which part of the network it is in.
Equivalent impedance variation [82] Current and
voltage
- Simple method.- This method is not tested in a practical way.
- This method does not locate the origin of the
disturbance, it just decides which part of the network it is in.
- If distributed generation exists, the method is not valid.
Clustering algorithm- Decision rule [83]Current and
voltage
- This method identifies the location of the
smallest region of voltage sag disturbance.
- The location and number of PQ sensors has a
great influence on the results.
Adaboost algorithm- Neural Networks [84]Current and
voltage
- This method identifies the location of the
region of voltage sag disturbance with an
appropriate accuracy.
- Existing data is needed to train the Neural Networks.
- The location and number of PQ sensors has a
great influence on the results.
- It is only tested for one source of disturbance.
Impedance-based methods [85,86,87] Current- The method is simple.- It is not widely applied in practice.
- It is limited for low-impedance faults.
- The accuracy is lower than other methods.
Traveling waves [88,89,90] Current and
voltage
- The accuracy is high.- The method is complex.
- The integration of a new device in the network is needed.
- The accuracy is very dependent on the type of the network
and the type of fault.
Artificial intelligence- ANFIS [91]
- LAMDA [92]
- Fuzzy neural system [93,95]
- Neural Networks [94]
Current and
voltage
- High accuracy in the fault location.- These methods are complex.
- Existing data is needed to train algorithms.
Smart meter monitoring [96,97,98] Current and
voltage
- Devices widely installed.
- The inversion in
additional devices is not needed.
- These methods are not tested in the field.
Negative sequence components [99] Current and
voltage
- Simple method.
- The inversion in
additional devices is not needed.
- This method is not tested in the field.
UnbalancesInteraction Disturbance Methods- Focused on offset unbalances and wave
distortion [49]
Current and
voltage
- The method helps
the user to assess the contribution of each
circuit to the power quality problem.
- The complexity of the method is high.
- The interpretation of the results have a
degree of subjectivity.
- The method does not accurately locate
the disturbance’s origin.
Voltage unbalance emission vector [100] Voltage- The method allows to identify the level of
contribution made by individual sources.
- The complex part of the method is the interpretation of the
results.
Table 5. Normalized weights for each method.
ComplexityPerformanceDevelopment
Direction of Disturbance0.711.001.00
Interaction Disturbance Methods1.000.500.50
Correlation with Characteristic Values0.000.000.00
Causal and Anticausal Methods0.140.000.00
Equivalent Circuit0.290.500.50
Harmonic State Estimation1.001.001.00
Relationship between Voltage and Power Factor0.290.000.00
Equivalent Impedance Variation0.140.170.17
Cluttering0.430.170.17
Adaboost0.710.170.17
Voltage Unbalance Emission Vector0.570.330.33
Random Forest0.831.000.89
Support Vector Machine1.000.710.67
Publisher’s Note: MDPI stays neutral with regard to jurisdictional claims in published maps and institutional affiliations.

