1. Introduction
Technology-based innovation continues to rise in importance. In the Boston Consulting Group’s tenth annual global survey of the state of innovation, 79% of respondents ranked innovation as either the top priority or a top-three priority at their company. The highest percentage since we began asking the question in 2005 was 66% of respondents who said that innovation was their top or among their three top priorities [
1]. However, despite its perceived value, successfully bringing a new product or service to market is still a mystery to some entrepreneurs and executives. Research shows that 40% of new products and services fail [
2]. There is a popular idea that technology development success depends on some kind of creative magic to be successful. However, Stanford Byers Center for Biodesign (2022) [
3] strongly opposes the following provisions: “We have a different take. Stanford Biodesign was founded on the belief that innovation is a process that can be learned, practiced, and perfected. It is hard work, takes lots of time, and requires multidisciplinary teamwork, but it is not magic”. Turning an idea into reality requires having an excellent understanding of the development process from idea to market. That process forces representatives of R&D organizations to think through different steps, in order to solve the problems properly; these researchers regularly gather customer feedback, iterate when necessary, and secure the right resources and methods to fully realize the innovation [
4]. The technology commercialization process is broken down into phases in which vital decision-making points exist.
In the scientific literature, which examines and analyzes the process of technological development and its problems, there is a variety of views and opinions related to both the concepts used to define this process and its content. Sometimes different concepts are used to define the same phenomenon or content, which involves a different number of stages. These motives led to the formulation of this article’s the first objective: to analyze technology development models studied by different researchers and used by different reliable organizations, to link the concept of technology development with the content, and to determine key decision points.
There are many vital decisions in technology development; however, the analysis of technology-development models has shown that the evaluation carried out before moving from plans to implementation determines whether other vital decision points will be reached. Based on the identification of results, large-scale investments are made for technology protection and further technology development. The right decision at this stage determines whether a project will have success, but the wrong decision can result in a never-returning investment. The specifics of the different technology industries are apparent, and these differences may be affected by the identification of commercial opportunities. The article also sought to reveal the specifics of commercialization for different technology industries and present the research results showing the differences in identifying commercial opportunities for nanotechnologies, mechatronics, and lasers.
2. An Overview of the Content and Decision-Making Points in the Technology Development Process
Many publications are aimed at managing the problems of the technology-development process. Sources of professional/practical literature have been used to examine this process in detail and to identify vital decision-making points. Earlier studies show an apparent lack of research covering development processes that are alternative or related to the content of the technology-development process, such as technology transfer, commercialization of new product development, and others. Due to the use of different concepts to name processes with similar content, chaos prevails both in the scientific literature and in the field of R&D organizations.
The models of technology commercialization were reviewed in the scientific literature and used in practice to link the content of technology commercialization to the concept. These models are discussed in the works of Cooper (2006) [
5], Yencken and Gillin (2014) [
6], Jones and Jain (2002) [
7], Thursby and Thursby (2007) [
8], Siegel et al. (2007) [
9]. The content of technology commercialization models can be judged by the models used in practice by Stanford University, Office of Technology Licensing (2022) [
10]; Michigan Technological University, Office of Innovation and Commercialization (2022) [
11]; Oklahoma State University, Technology Development Center (2022) [
12]; University of Texas Rio Grande Valley, the Office of Research Translation (2022) [
13]; and University of Nebraska Omaha, College of Business Administration, Nebraska Business Development Canter (2022) [
14]. The typical commercialization scheme is reflected in the stages of technology commercialization at Stanford University [
10], which include: (1) research; (2) invention disclosure; (3) assessment; (4) protection of intellectual property; (5) marketing to find a licensee; (6) selecting a licensee; (7) commercialization; (8) licensing; and (9) royalties.
The technology commercialization process usually begins with research, followed by the disclosure of the invention and its evaluation. The overall process is often divided into an assessment phase and an implementation phase, which shows the importance of assessing commercial potential. It depends on the assessment results whether there will be a transition to implementation at all. The whole commercialization process concludes with a transfer of intellectual property rights to a company willing and able to move the technology from the lab into use by the public. Most models of the commercialization process have a commercialization phase as one of the last stages of the process, which includes three possible alternatives to the direct sale, licensing of the invention, or the establishment of a start-up company.
The University of Nebraska Omaha (2022) [
14] uses the Goldsmith Technology commercialization model. A feature of this model, compared to other models, involves steps from concept evaluation to business maturity, which includes the process from idea to the moment of return of investment from end users. This model allows researchers to analyze a business enterprise that is generating increasing profits through multiple revenue streams. This model consists of (1) the concept phase, (2) the development phase, and (3) the growth phase. Each stage involves the simultaneous development of technical, market, and business activities.
Likewise, Cooper (2006) [
5] illustrates a typical technology development process, which has been adopted in USA, leading companies that undertake fundamental research projects and recommending that they abandon the use of traditional methods for non-traditional projects. This process consists of three stages and four gates. These activities are designed to acquire vital information and reduce the unknowns and, hence, the project’s risk from Stage to Stage. The gates are the “Go/Kill” decision points; in other words, at these points, management meets with the project team to decide whether the project merits additional funding and resources to move to the next stage. If a positive decision is taken, resources are committed at the Gate, and the project and team move forward. The trigger for the process is the first stage in which much of the work is often done by scientists or technical people, work that involves discovery or idea generation. Quality ideas are essential to a successful technology program, and thus technology ideas from multiple sources must be sought for consideration at Gate 1. The goal of Gate 1 is the ideas screen, and it is the initial decision to commit a limited amount of time and money to the research project. This Gate poses the question: Does the idea merit expending any effort? Stage 1 includes Project Scoping. This stage aims to build the foundation for the research project, define the scope of the project, and map the forward plan. Stage 1 activities are conceptual and involve preparation work, a technical literature search, patent and IP search, a competitive alternatives assessment, a resource gaps identification, and a preliminary technical assessment. Gate 2 includes Technical Assessment. This decision allows the beginning of limited experimental or technical work in Stage 2. This Gate poses the question: Does the idea merit limited experimental work? Gate 2 does not require financial analysis because the resulting product, process, or impact of technology development is still largely unknown. The purpose of Stage 2 is to demonstrate the technical or laboratory feasibility of the idea under ideal conditions. Activities here typically include undertaking a thorough conceptual and technological analysis, executing feasibility experiments, developing a partnership network, identifying resource needs and solutions to resource gaps, and assessing the potential impact of the technology on the company. Gate 3 includes a Detailed Technical Investigation that opens the door to a more extensive and expensive investigation in Stage 3. This gate decision is based on new information from Stage 2. The Gate 3 gatekeepers usually include the corporate head of technology (VP of R&D or CTO), other senior technology or R&D people, corporate marketing or business development, and the heads of the involved businesses (e.g., general managers). Because Gate 3 is a heavy commitment gate, senior managers of the business units that will take ownership of the resulting technology should be the Gate 3 gatekeepers. Their insights into the project’s commercial viability are essential at Gate 3; further, earlier engagement ensures a smoother transition to the business unit once the commercial phase of the project gets underway. Stage 3 is to implement the entire experimental plan, prove technological feasibility, and define the scope of the technology and its value to the company. This stage could entail significant expenditures and potentially years of work. Apart from the extensive technical work, other activities focus on defining commercial product or process possibilities; undertaking market, manufacturing, and impact assessments on these possibilities; and preparing an implementation business case. If the TD project veers significantly off course or encounters serious barriers to completion during Stage 3, the project is cycled back to Gate 3 for another Go/Kill decision. The final Gate 4 in the technology development process is the “door opener” to one or more new product or process development projects. Here, the technical work results are reviewed to determine the technology’s applicability, scope, and value to the company, and the next steps are decided. This Gate 4 is often combined with an early gate in the usual product development process. Gatekeepers are typically the senior corporate R&D people, corporate marketing or business development people, plus the leadership team from the relevant business that will assume ownership of the resulting commercial development projects.
Allen (2003) [
15] presented a model for technology commercialization and argues that there are two crucial moments of self-determination in commercialization processes. The first of these is the choice: whether intellectual property should be patented or not? At this stage, it is essential to answer the following questions: is it possible to develop the technology in the company? Is technology designed to meet the US Patent and Trademark Office requirements? Is the patent necessary for successful technology commercialization? After this stage, the second major critical decision stage presents the inventor with three choices: (1) he or she claims licensed rights to manufacture and market existing businesses and to receive royalties tax, which is calculated from the product/service sales; (2) he or she may sell the technology directly to another company; (3) he or she can establish a company to produce and market his invention. These are very different solutions for scientists and inventors who work in a university environment, research institutes, and government laboratories. The creation of a firm may mean it will be necessary to leave the current position and seek resources to maintain the start-up.
In order to link the content of technology transfer to the concept, the models of technology transfer were reviewed in the works of Tseng and Raudensky (2014) [
16], Wang et al. (2003) [
17], and Miller et al. (2011) [
18] and used by the European Commission, Competence Centre on Technology Transfer (2021) [
19]; Jackson State University, Center for Innovation, Entrepreneurship and Economic Development (2021) [
20]; Oxford University Innovation (2021) [
21]; Massachusetts Institute of Technology, Technology Licensing Office (2021) [
22]; Louisiana State University, Office of Innovation & Technology Commercialization (2021) [
23]. The technology transfer process usually begins with research, followed by an invention, the disclosure of the invention, and its evaluation. All models of the technology-transfer process have a commercialization stage as one of the last elements of the process. The technology-transfer process content is identical to many commercialization process models, except for the Goldsmith technology commercialization model used by the University of Nebraska Omaha (2022) [
14].
As an analysis of the content of technology commercialization and technology transfer has shown, the process of commercialization is understood in the literature in three ways: (1) in the narrow sense as activities ranging from the disclosure of an invention to the transfer of technology to business entities; (2) in a broad sense as activities ranging from concept to business maturity (Goldsmith technology commercialization model) [
14]; (3) and as the last step of the technology transfer/commercialization process.
The content of technology commercialization (narrow sense) and the technology-transfer process are often identical if the process starts with the invention and concludes with a transfer of intellectual property rights to a company that is willing and able to move the technology from the lab into an industrial environment. In the process, the commercialization of technology (narrow sense) and the technology-transfer process the first stage starting with research or the discovery of an invention and often ending with the transfer of technology to industry, which will lead to the production of a product or service [
24]. The technology prepared for transfer to the industrial environment must be identified for its patentability and commercial opportunities, and its price is set on that basis; intellectual property rights must protect this technology. With regard to the European Commission (2022) [
19], when trying to reach the market, we have three options: selling the patent application, licensing the technology, or making a spin-off. Selling: one way of transferring technology is the outright sale, assigning all IP rights to the other entity. The outright sale would be without any restrictions. The new owner will have all rights over the IP assets. This ownership is transferred, and the seller has no further claim on it. Licensing: the most commercial route for academic innovation is licensing to the industry. License agreements are used to grant the licensee the right to use a particular piece of intellectual property rights owned by the licensor, while the ownership of intellectual property rights remains with the licensor. Spin-off /start-up: the university will license the technology to a newly formed company specifically created to produce the technology. The company will use the technology, and the university will receive patent royalties in exchange for investment in future research work. Once the decision to create spin-ups / start-ups has been made, funding is needed to cover the cost of manufacturing locations, materials, and others initial expenses, such as the basic running costs that include payroll and various operating expenses. The inventor can use their resources or search for funding from a Business Angel, Venture Capitalist, crowdfunding end, etc.
3. Identification of Commercial Opportunities for Mechatronics, Lasers, Nanoelectronics Technologies
There are many vital decision-making points in the process of technology development. However, only one identification of commercial opportunities determines whether other vital decision points will be reached. Based on the identification results, large-scale investments are made. The decision made at this stage determines whether or not a project will have a successful return on investment. The identification of commercial opportunities technology is also usually carried out at the initiative of interested third parties who desire important information about the technology situation. The identification and selection activities are especially critical from the point of view of decision-making, as they are usually framed in the processes of strategic and technological planning, thereby defining future lines of development, as well as the fundamentals for their scientific and economic competitivity and sustainability [
25].
In the Cooper (2006) [
5] model, the identification of commercial opportunities is very well reflected in Gate 3. Detailed technical investigation opens the door to a more extensive and expensive investigation in Stage 3. This gate decision is based on new information from Stage 2. The Gate 3 gatekeepers usually include the corporate head of technology (VP of R&D or CTO), other senior technology or R&D people, corporate marketing or business development, and the heads of the involved businesses (e.g., general managers). Because Gate 3 is a heavy commitment gate, senior managers of the business units that will take ownership of the resulting technology should be the Gate 3 gatekeepers. Their insights into the project’s commercial viability are essential at Gate 3. Further, more early engagement ensures a smoother transition to the business unit once the commercial phase of the project gets underway [
5]. The overall technology commercialization process in Michigan Technological University, Office of Innovation and Commercialization (2022) [
11] includes the assessment and implementation phases. The assessment phase consists of three stages: (1) value proposition, (2) competitive advantage, and (3) market opportunity. With regard to the University of Florida (2022) [
26], when the evaluation phase comes, the licensing team will meet with the inventor(s). They will discuss the invention and make a preliminary evaluation of manufacturing feasibility, patentability, novelty, potential applications, and potential markets. Patenting an invention is expensive. Sometimes the licensing officer decides not to pursue the commercialization of an invention. If the invention is pursued, a preliminary licensing strategy will be developed. At this stage, the inventors may assist in the evaluation by participating in a prior art search. Tech Licensing also welcomes the inventors’ suggestions for the best strategy for licensing the technology (e.g., exclusive vs. non-exclusive) [
26]. The evaluation process of Oklahoma State University, Technology Development Canter (2022) [
12] has two main components: (1) Intellectual Property evaluation to determine the ability to protect the intellectual property (IP) of the invention; (2) Market evaluation to assess the commercialization opportunity for the invention. In the Goldsmith technology commercialization model, aspects relevant to identifying commercial opportunities are addressed in steps 1–3, but steps 4, 5, and 6 complement this [
14]. The objectives of the technical concept analysis (step 1) are to define the concept succinctly, assess the implementation potential of the technical aspects of the concept, and establish its uniqueness. The second step–is a market-needs assessment. This step aims to identify a potential market for the concept, estimate the market size, and determine a preliminary value of the product. The objective of the venture assessment (step 3) is to determine if the concept offers sufficient profit potential to pursue the additional investment of time and money for additional research. The objective of the fourth step, the technical-feasibility step, is to confirm that the product will perform and verify that there are no production barriers. The fifth step involves both identifying the price range at which a quantified market segment is willing to purchase the product and justifying why the target market will choose the product over the competition. The objective of the sixth step, the economic-feasibility step, is to develop a financial model of the business venture and to answer the following question: does the venture demonstrate positive economic feasibility?
Different authors and different organizations use different concepts to name this stage of evaluation, such as “the commercial viability” [
5], “innovation potential” [
27], just “assessment,” which is broken down into separate elements: assessment value proposition, competitive advantage, market opportunity” [
11], “evaluation patents, technologies, and research projects” [
28]. Previously developed models of identification of commercial opportunities by Cho & Lee (2013) [
29], Price et al. (2008) [
30], Dereli & Altun (2013) [
27], Park et al. (2017) [
31], as well as other sources provided by different organizations, such as WIPO (2005) [
32], EPO (2012) [
28], NASA (2017) [
33], were dedicated to the evaluation of technologies in all technology industries, focused on different technology levels, and did not consider the specifics of the different technology industries. These specifics are apparent, and these differences may affect the identification of commercial opportunities [
34]. Until this moment, in the scientific space, the proposed tools for evaluating commercial opportunities of technologies were fragmented and difficult to apply quantitatively in practice. A customization model for evaluating the commercial opportunities of technologies for different technology industries will allowstakeholders to reach a more objective assessment of the commercial opportunities and more rational use of resources.
5. Evaluation of the Weight of Factors for Identifying Commercial Opportunities
In the second stage, the experts expressed their position on the weight of factors. In this case, the most significant element receives the highest point, whereas the least important the lowest one. The direct expert evaluation of the significance was applied, and a ten-point scale was used (see
Table 1).
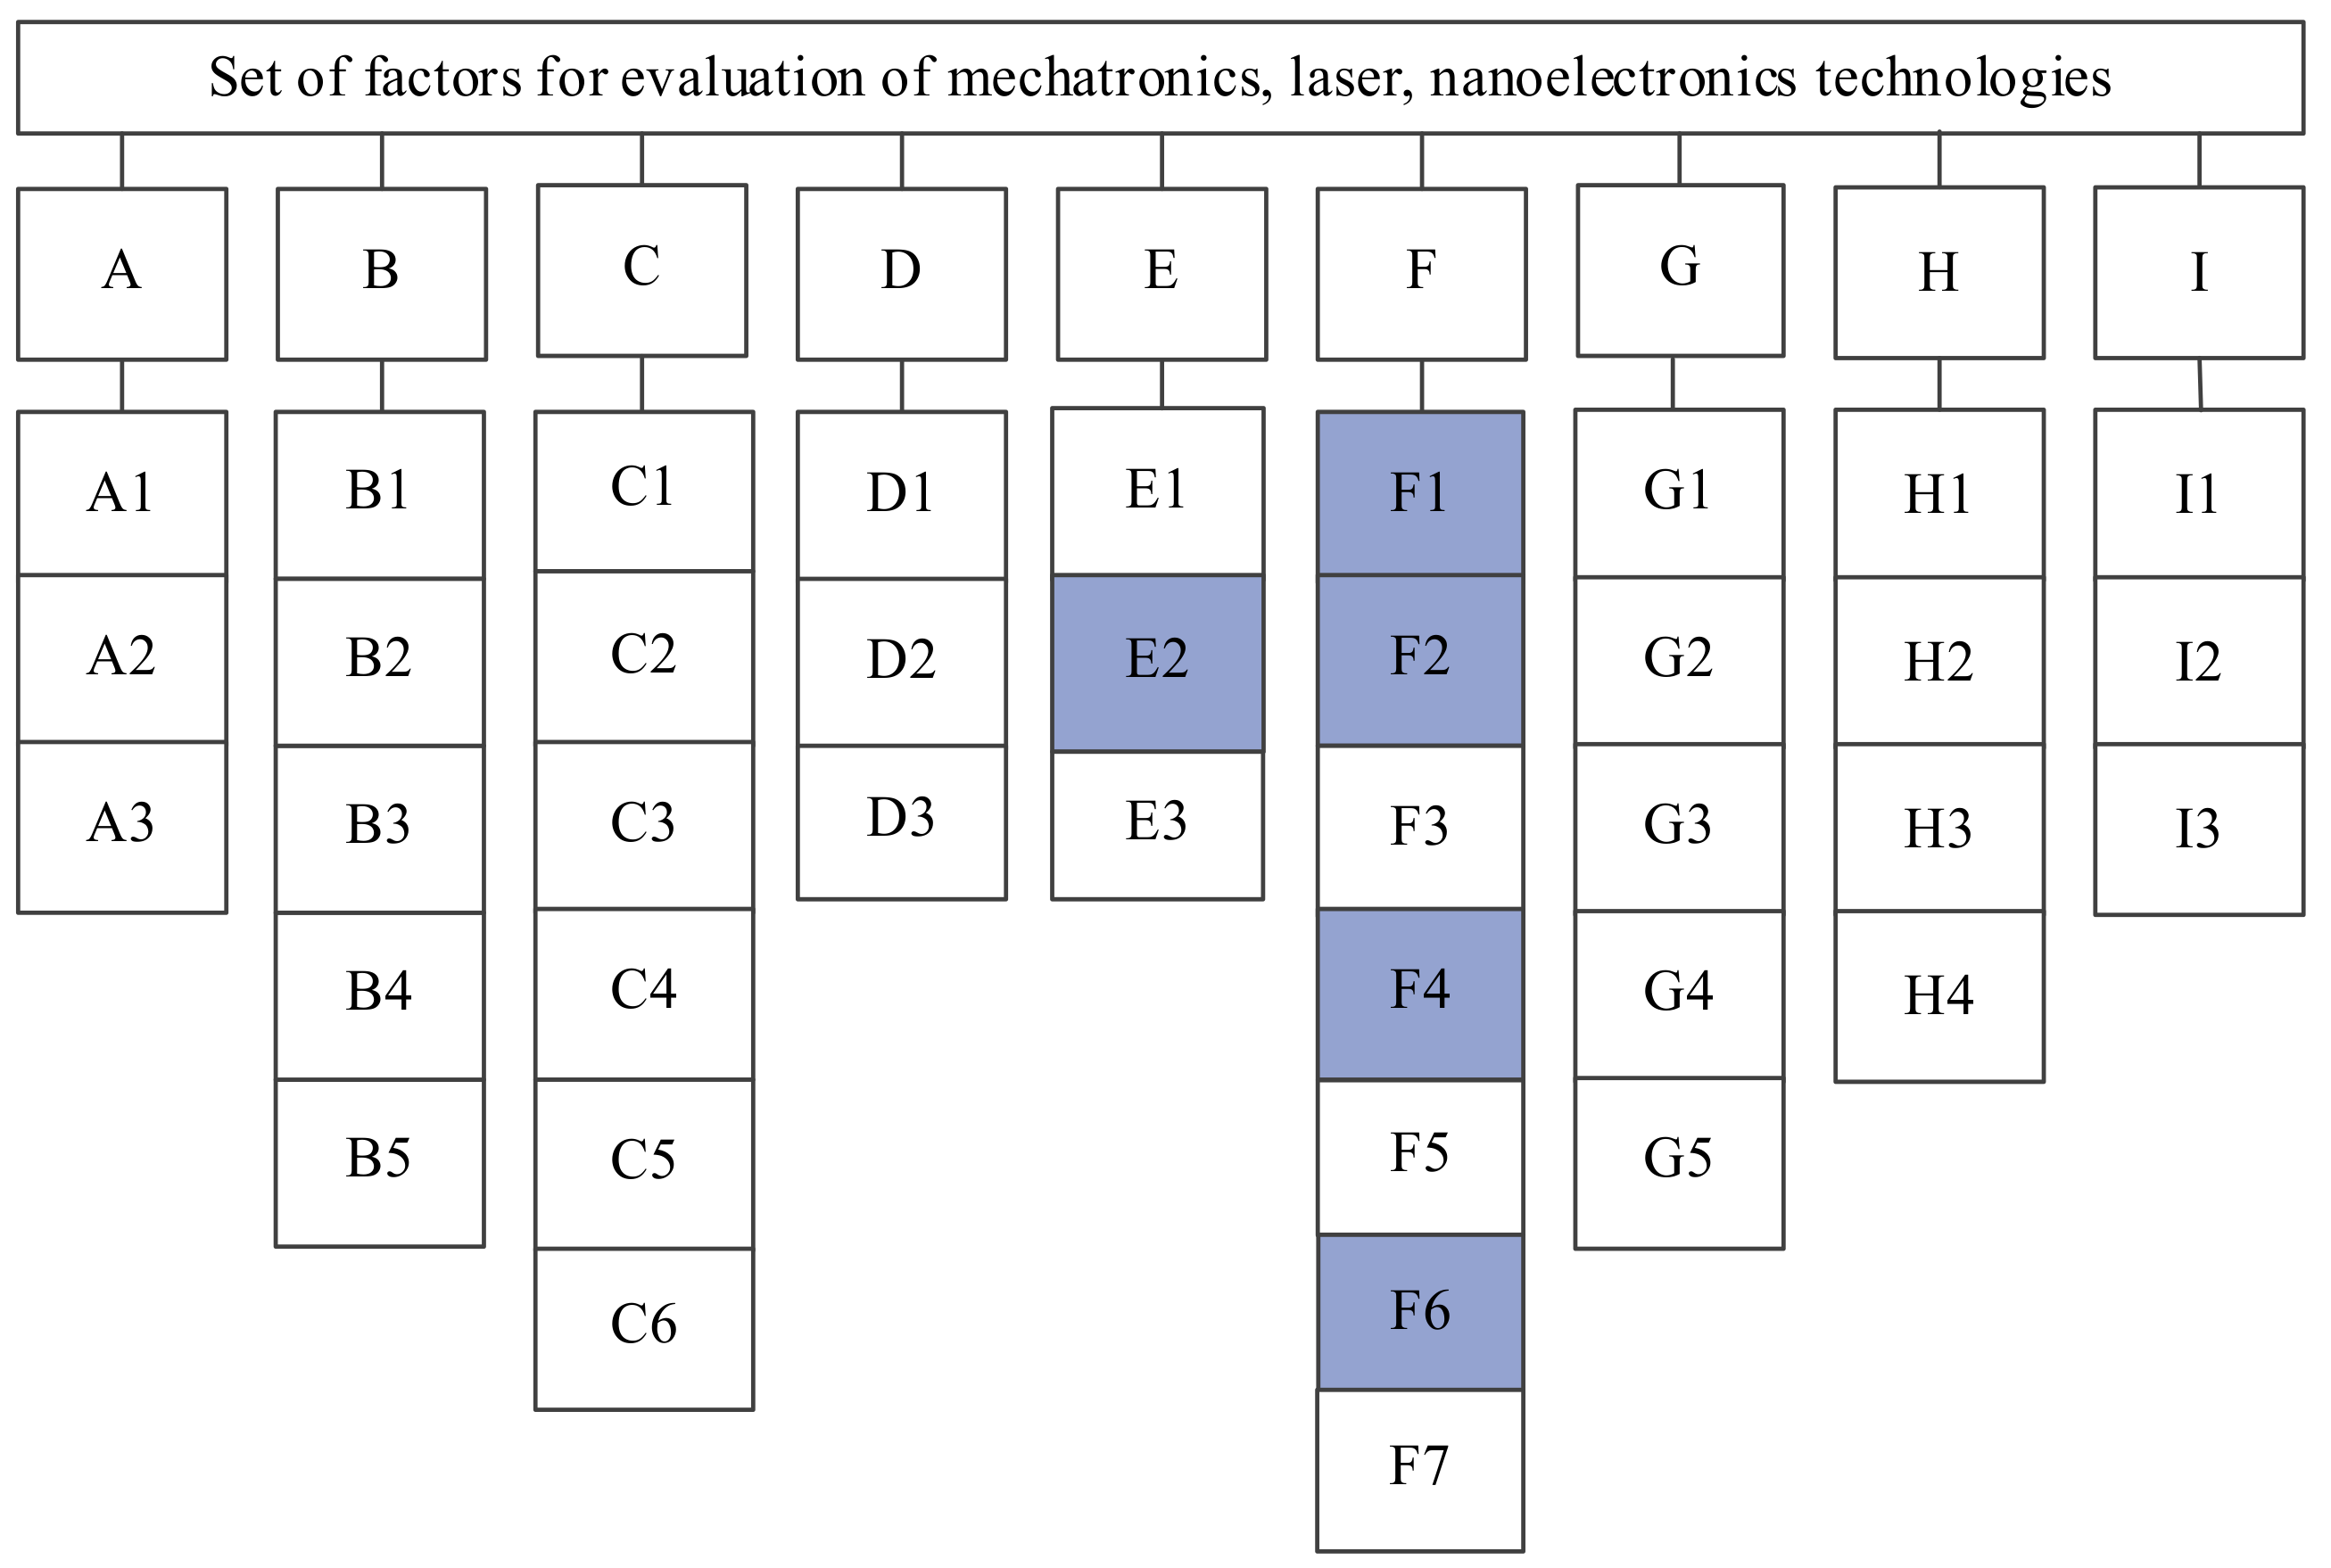
During the research, seventy-two correctly completed questionnaires were received: twenty-four questionnaires for mechatronics, twenty-four questionnaires for lasers, and twenty-four for nanoelectronics technology. The authors of this study established factors for assessing the commercial feasibility of mechatronics, laser, and nanoelectronic technologies, emphasizing the identification of differences in assessments between these different technology industries based on the weight of the factors (
Figure 1). For this reason, the composed model proposes to use multi-criteria decision aiding (MCDA) methods as a universal and reliable approach to classify possible efficiency characteristics and choose the best options [
38]. Multi-dimensional challenges need to allocate a weight for each [
39]. Researchers presented different criteria weight estimation methods: Analytic Hierarchy Process (AHP) [
40], Entropy [
41], SWARA [
42], and others.
The literature review and expert assessments during the application of Delphi technology were the basis for selecting the initial set of requirements. This research modified an integrated fuzzy Delphic-Eckenrode Likert-type scale-based rating technique [
43] for grey numbers. A grey extension of the group the Eckenrode weight assessment technique is similar to the fuzzy Eckenrode rating technique [
43,
44,
45] and is presented below:
Decision-makers, computing weight
wcj for criterion
c from the judge
j, have given ratings. Judge
j to criterion
c gives rating
pcj. Further, they calculate
wc as follows:
Judge rated each criterion on a scale of 0–10 (
Table 1). The synthesizing of ratio judg-ments applies grey numbers theory. Grey theory, proposed and initially developed by Deng (1982) [
46], is an effective mathematical means to:
Deal with problems described by incomplete information;
To avoid the inherent defects of conventional statistical methods;
Moreover, an advantage is to use a limited amount of data to estimate the behavior of an uncertain system when the data are discrete, and the information is incomplete.
Deng (1982; 1992) [
46,
47] proposed a grey system theory to study vague systems and introduced the concept of interval grey numbers. This theory provides an efficient approach for solving problems with significant uncertainty [
48] and has been successfully applied in modeling [
49], forecasting [
50], and many fields for analysis [
51]. It is challenging to use ordinary methods due to incomplete information and uncertain relations. Nevertheless, the obtained information from the real world is always uncertain or incomplete. Hence, extending the applications from white numbers (crisp values) to grey numbers is necessary for real-world applications. A grey number is a number whose exact value is unknown but with a known range.
Usually, a grey number is a closed interval or a set of numbers. Let be a grey value. If and is an interval grey number, while and are the upper and lower limits (boundaries) of and and .
- 2.
The basic definitions and operations of grey numbers are as follows. Let +, −, ×, and ÷ define addition, subtraction, multiplication, and division. These operations for the grey numbers
and
can be as follows [
52,
53]:
| Addition | | (3) |
| Division | | (4) |
| Multiplication | | (5) |
Number product of grey numbers
if (k is a positive real number) | | (6) |
| Substraction | | (7) |
- 3.
The Equations (3) and (4) for the grey model are as follows:
- 4.
There is minimum possible value and is the maximal possible value of j criterion.
- 5.
Decision-makers selected an average technique to produce a quantifiable result in crisp logic:
The importance of factors reflects the influence of the factors on the assessed object. The evaluation of factors and sub-factors resulting weight for mechatronics, laser, and nanoelectronics technologies were provided in
Figure 2,
Figure 3,
Figure 4,
Figure 5,
Figure 6 and
Figure 7. Experts in the study evaluated the weight of the factors and sub-factors, and later calculations were made, and a comparison of the factors and sub-factors was performed (
Appendix A). The ranking is when the essential element is provided with the position equal to 1, the second element according to importance is given 2, etc. The last element, according to importance, takes rank
m [
36]. There are two main reasons for ranking popularity. The first is its simplicity, as ranking provides a complex, multifaceted phenomenon of multiple-image elements, which are summarized in a way that would be easier to assess and compare. Another reason is that ranking determines changes in performance. Ranking causes private and public organizations to question their standards [
54]. In order to present the results of the research are provided
Figure 2,
Figure 3,
Figure 4,
Figure 5,
Figure 6 and
Figure 7.
Figure 2 demonstrates the results of the commercialization opportunities factors weight for mechatronic technology. Most are influenced by factors such as
value for the consumer (B),
Competitive environment (D),
and Technology features (E), and the weight of these factors is the same–0.157. Considering the weight, the
Situation in the market (A) together with
the Financial environment (C) goes in the second position–0.113,
Competency of technology developers (F) in the third position–0.104,
Internal policy of the organization (I) in the fourth position–0.130,
Inventor/s profile (H) in the fifth position–0.070, and in the sixth position is
Legal environment (G)–0.052.
Figure 3 demonstrates the results of the commercialization opportunities sub-factors weight for mechatronic technology. In the highest position are the following sub-factors in descending order:
Compatibility of the potential product with the existing products (E2)–0.081;
Complexity of technology (E1)–0.077;
Ability to copy technology (D2)–0.057;
Intensity of competition (D3)–0.056;
Predicted lifetime of technology (D1)–0.049;
Relative advantage of the potential product (B5)–0.040;
Target market share of the potential product at the technology assessment moment (A1);
Level of the readiness of the market for the product (A3)–0.038;
Level of the customer‘s needs regarding the potential product (A2)–0.037;
Compliance of the project on technology with the strategy of the organization (I1);
Image of the organization in the area of technology (I3)–0.028.
In the lowest position, these sub-factors are in ascending order: Benevolence of national legislation for commercialization (G1)–0.009; Significance of improvement on prior art-difference compared to the analog (G4)–0.010; Utilization potential of technology (G2), Novelty of technology (G3)–0.011, Potential to finance (C1), Price for legal protection (G5)–0.012; Competence of technology transfer personnel (F5), Inventor’s predicted level of involvement as a team member in technology commercialization (H3), Inventor’s financial contribution to technology commercialization (H4)–0.014; Utilization potential of technology (C2), Accessibility of specialized engineering staff (F7)–0.015.
In terms of laser technology’s commercialization opportunities, factors such as
Situation in the market (A),
value for the consumer (B) and
Competitive environment (D)–0.167 go in the 1st position;
Financial environment (C),
Technology features (E),
Competence of technology developers and related opportunities (F)–0.111 in the 2nd; and
Legal environment (G),
Inventor/s profile (H),
Internal policy of the organization (I)–0.056 is in the 3rd position (
Figure 4).
Figure 5 demonstrates the results of the commercialization opportunities sub-factors’ weight for laser technology. In the highest position are the following sub-factors in descending order:
Dependence of technology functioning on geographical/climatic circumstances (E2)–0.081;
Complexity of technology (E1)–0.077;
Ability to copy technology (D2)–0.057;
Intensity of competition (D3)–0.056;
Predicted lifetime of technology (D1)–0.049;
Relative advantage of the potential product (B5)–0.040;
Target market share of the potential product at the technology assessment moment (A1),
level of the readiness of the market for the product (A3)–0.038;
Level of the customer‘s needs regarding the potential product (A2)–0.037;
Feedback of target customers regarding product concept (B2)–0.031.
In the lowest position, these sub-factors are in ascending order: Benevolence of national legislation for commercialization (G1)–0.009; Significance of improvement on prior art–difference compared to the analog (G4)–0.010; Utilization potential of technology (G2), Novelty of technology (G3)–0.011; Potential to finance (C1), the price for legal protection (G5)–0,012; Inventor’s predicted level of involvement as a team member in technology commercialization (H3), Inventor’s financial contribution to technology commercialization (H4)–0,014; Accessibility of specialized engineering staff (F7)–0,015.
Figure 6 demonstrates the results of the commercialization opportunities factors weight for nanoelectronic technology. Most are influenced by factors such as
value for the consumer (B),
Financial environment (C),
Technology features (E), and the weight of these factors is the same–0.188 and are in 1st position;
Situation in the market (A),
Competitive environment (D),
Competence of technology developers and related opportunities (F),
Inventor/s profile (H)–0.179 go in the 2nd position;
Internal policy of the organization (I)–0.098 is in the 3rd position; and
Legal environment (G)–0.080 is in the 4th position.
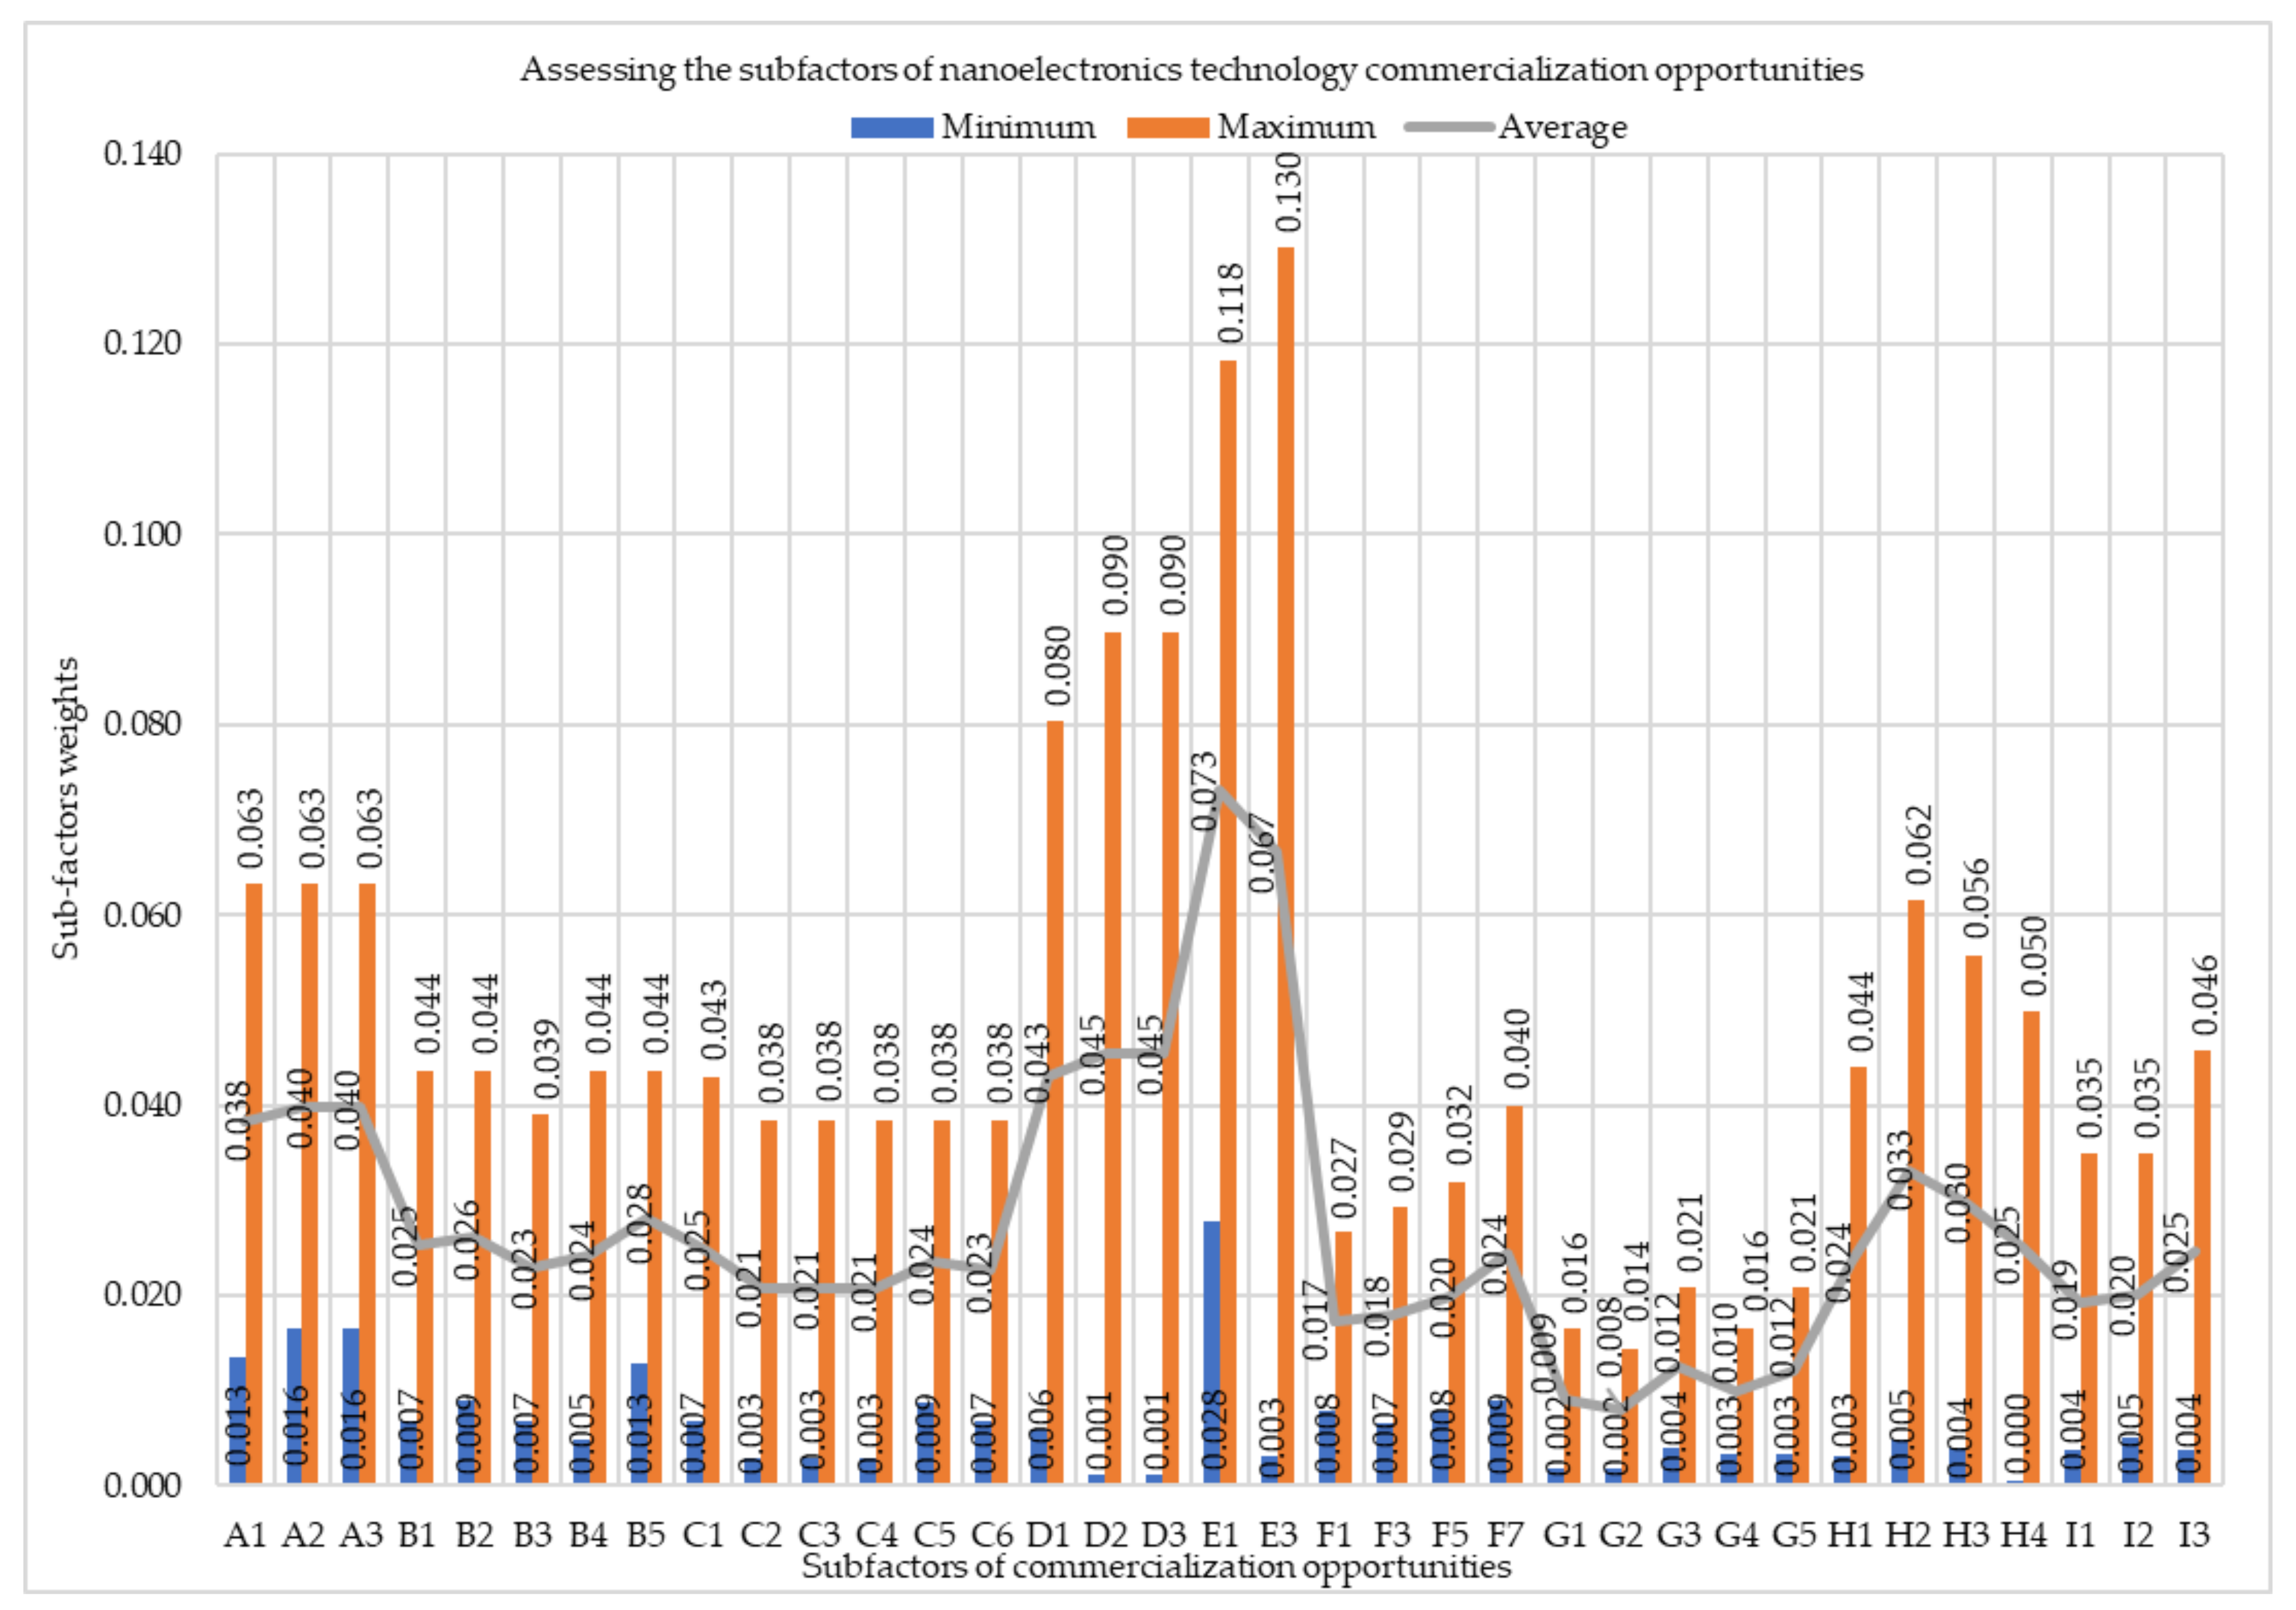
Figure 7 demonstrates the results of the commercialization opportunities sub-factors’ weight for nanoelectronics technology. In the highest position are the following sub-factors in descending order:
Complexity of technology (E1)–0.073;
Compatibility of the potential product with the existing products (E2)–0.067;
Intensity of competition (D3),
ability to copy technology (D2)–0.045;
Predicted lifetime of technology (D1)–0.043;
Level of the customer‘s needs regarding the potential product (A2),
Level of the readiness of the market for the product (A3)–0.040;
Target market share of the potential product at the technology assessment moment (A1)–0.038;
Inventor’s academic recognition (H2)–0.033;
Inventor’s predicted level of involvement as a team member in technology commercialization (H3)–0.030.
In the lowest position, these sub-factors are in ascending order: Novelty of technology (G2)–0.008; Benevolence of national legislation for commercialization (G1)–0.009; Significance of improvement on prior art-difference compared to the analog (G4)–0.010; Novelty of technology (G3), Price for legal protection (G5)–0.012; Competence of specialized engineering staff (F1)–0.017; Competence of marketing personnel (F3)–0.018; Compliance of the project on technology with the strategy of the organization (I1)–0.019; Competence of technology transfer personnel (F5), Acceptance of the organization strategy of commercialization for the inventor (I2)–0.020.
The greatest contrasts between the weight of factors, which is marked in red [0.09276; 0.123] (see
Appendix A,
Table A1), are found in terms of
Inventor/s profile (H) between the laser technology–0.056 and nanoelectronics technology–0.179 and between the weight of mechatronic technology–0.070 and nanoelectronics technology–0.179.
Slightly lower contrasts, which are marked in blue [0.06251; 0.09275] (see
Appendix A,
Table A1), are found in terms of weight of
Financial environment (C) between lasers–0.111 and nanoelectronic technology–0.188 and between mechatronic–0.113 and nanoelectronic technology–0.188. A similar situation is due to factor
Competency of technology developers (F) and to the weight between lasers–0.111 and nanoelectronic technology–0.179; mechatronic–0.104 and nanoelectronic technology–0.179. The following contrasts are marked in blue: in terms of the factor
Situation in the market (A), a weight contrast between mechatronic (0.113) and nanoelectronic technology (0.179); in terms of the factor
Technology features (E), a weight contrast between lasers (0.111) and nanoelectronic technology (0.1880); and in terms of the factor
Internal policy of the organization (I), a weight contrast between mechatronic (0.130) and lasers technology (0.0560).
Lower contrasts (marked in yellow [0.03226; 0.06250] (see
Appendix A,
Table A1) in terms of the weight factor
Situation in the market (A) are between mechatronic–0.113 and laser technology–0.167; in terms of the factor
Technology features (E), lower contrasts lie between mechatronic–0.157 and laser technology–0.111; and in terms of the factor
Internal policy of the organization (I), lower contrasts lie between lasers–0.056 and nanoelectronic technology–0.098, as well as between mechatronic–0.130 and nanoelectronic technology–0.098.
The lowest contrast between weights [0.002; 0.03225] (see
Appendix A,
Table A1) is marked in the table in green, and this color dominates the table, which means that most of the factors have a minimal difference in terms of weight.
The greatest contrast between the weight of sub-factors (marked in red [0.0368; 0.0490]; see
Appendix A,
Table A2) can be seen the factor
Complexity of technology (E1) between the mechatronic–0.077 and laser technology–0.040; between laser–0.040 and nanoelectronic technology–0,073. A similar situation with the factor
Compatibility of the potential product with the existing products (E2), can be seen in the significant mechatronic technology–0.077, as well as lasers technology–0.040.
A slightly lower contrast (marked in blue [0.0246; 0.0368]; see
Appendix A,
Table A2) can be seen in the weight factor
Compatibility of the potential product with the existing products (E2) between mechatronic technology–0.081 and nanoelectronic technology–0.067.
We can see lower contrasts (marked in yellow [0.0123; 0,0245]; see
Appendix A,
Table A2) in weight factor
Target market share of the potential product at the technology assessment moment (A1) between mechatronic technology–0.038 and laser technology–0.054, as well as between mechatronic–0.038 and nanoelectronic technologies–0.038. A similar situation can be seen in the factor
Level of the customer‘s needs regarding the potential product (A2) between weight mechatronic–0.037 and lasers technology–0.054, as well as between mechatronic–0.037 and nanoelectronic technology–0.040. In terms of the factor
Level of the readiness of the market for the product (A3), we can see a weight contrast between mechatronic–0.038 and laser technology–0.054, as well as between mechatronic–0.038 and nanoelectronic technology–0.040; in terms of the factor
The potential to finance (C1), we can see a contrast between weight laser technology–0.012 and nanoelectronic–0.025, as well as between mechatronic–0.012 and nanoelectronic technology–0.025; in terms of the factor
Compatibility of the potential product with the existing products (E2), we can see a contrast between weight mechatronic–0.081 and nanoelectronic technology–0.067; in terms of the factor
Inventor’s academic recognition (H2), we can see contrast between weight laser–0.017 and nanoelectronic technology–0.033; and in terms of the factor
Inventor’s predicted level of involvement as a team member in technology commercialization (H3), we can see a contrast between laser technology 0.016 and nanoelectronic technology–0.030, as well as between mechatronic–0.014 and nanoelectronic technology–0.030.
The lowest contrast between weights [0.002; 0.03225] is marked in the table in green (see
Appendix A,
Table A2), and this color dominates the table, which means that most of the factors have a minimal difference in terms of weight.
6. Discussion
Turning technology into reality requires an excellent understanding of the development process from idea to market, because the process of technology commercialization is broken down into phases in which vital decision-making points exist. In the scientific literature, there is a variety of views and opinions related to the concepts and their content. These motives led to the formulation of this article’s the first objective: to analyze technology-development models studied by different researchers and used by different reliable organizations, to determine the content of the technology development process and processes that are alternative or related to the content of the technology development process, and to elucidate the differences and interfaces between these models and the vital decision-making points. The typical commercialization scheme includes: (1) research; (2) invention and disclosure; (3) assessment; (4) protection intellectual property; (5) marketing to find a licensee; (6) selecting a licensee; (7) commercialization; (8) licensing; (9) royalties.
The technology commercialization process usually begins with research, followed by the disclosure of the invention and its evaluation. The overall process is sometimes divided into an assessment phase and an implementation phase, which shows the importance of assessing commercial opportunities. It depends on the assessment results whether there will be a transition to implementation at all. The whole commercialization process concludes with a transfer of intellectual property rights to a company willing and able to move the technology from the lab into use by the general public. Most models of the commercialization process have a commercialization phase as one of the last stages of the process, which includes three possible alternatives: the direct sale, the licensing of the invention, or the establishment of a start-up company.
The technology transfer process usually begins with research, followed by an invention, the disclosure of the invention, and its evaluation. All models of the technology transfer process have a commercialization stage as one of the last elements of the process. The technology transfer process content is identical to many models of the commercialization process, except the Goldsmith technology commercialization model.
As an analysis of the content of technology commercialization and technology transfer has shown, the process of commercialization is understood in the literature in three ways: (1) in the narrow sense as activities ranging from the disclosure of an invention to the transfer of technology to business entities; (2) in a broad sense as activities ranging from concept to business maturity as in Goldsmith technology commercialization model; (3) and as the last step of the technology transfer/commercialization process.
There are many vital decision-making points in the early stage of technology development. However, only one identification of commercial opportunities determines whether other vital decision points will be reached. Based on the identification results, large-scale investments are made. The decision made at this stage determines whether or not a project will have a successful return on investment. However, the specifics of the different technology industries are apparent, and these differences may affect the identification of commercial opportunities. The article also sought to reveal the specifics of commercialization for different technology industries and present the research results showing the differences in identifying commercial opportunities for mechatronics, laser, and nanoelectronic technologies.
In this case, the difference between the evaluation of these technologies can be seen by comparing the weight of the factors and sub-factors and the differences between them. The greatest difference, which is marked in red, between weights lie within Inventor/s profile (H) between the laser technology and nanoelectronics technology and between the weight of mechatronics technology and nanoelectronics technology, [0.09276; 0.123]. Slightly lower contrasts were marked in blue [0.06251; 0.09275], and lower contrasts were marked in yellow [0.03226; 0.06250]. The lowest contrast between weights [0.002; 0.03225] is marked in the table in green (see
Appendix A,
Table A1).
The greatest contrast between the weight of sub-factors (marked in red [0.0368; 0.0490] can be seen in terms of the factor
Complexity of technology (E1) between the mechatronic and laser technology, as well as between laser and nanoelectronic technology. A similar situation can be seen in the factor
Compatibility of the potential product with the existing products (E2), between the significant mechatronic technology and lasers technology (see
Appendix A,
Table A2). Slightly lower contrasts were marked in blue [0.0246; 0.0368], and lower contrasts were marked in yellow [0.0123; 0,0245]. The lowest contrast between weights [0.002; 0.03225] is marked in the table in green, and this color dominates the table, which means that most of the factors have a minimal difference in weight (see
Appendix A,
Table A2).
7. Conclusions
Technology development and its application for human activities have been recognized as a source of progress, solution to many problems, and high added value. To ensure the sustainable activity of the institutions engaged in R&D and minimize the uncertainty of the commercialization of technologies, a tool for verifying decisions on technology development at the early stages of commercialization is needed. Ability to timely and objectively assess the expedience of technology commercialization in order to avoid non-productive investments is a crucial and unsafe move for the institutions engaged in R&D. The owner of the technology, the potential investor, or buyer must make a decision on the future of the technology and answer questions such as the following: is worth developing this technology, investing in it, or buying it? In order to answer these questions and make the right decision, tools for assessing the commercial potential of technologies are in use.
Previously developed models for identifying commercial opportunities were dedicated to the evaluation of technologies in all technology industries, focused on different technology levels, and did not consider the specifics of the different technology industries. These specifics are apparent, and these differences may affect the identification of commercial opportunities. Until this moment, in the scientific space, the proposed tools for evaluating commercial opportunities of technologies were fragmented and difficult quantitatively to apply in practice. A customization model for evaluating the commercial opportunities of technologies for different technology industries will allow researchers and business personnel to achieve a more objective assessment of the commercial opportunities and more rational use of resources.
The first step in identifying commercial opportunities is creating the set of factors for mechatronics, lasers, and nanoelectronics technologies. The set of factors is the foundation for the establishment weight of factors and the meanings of factors’ values, which are essential elements in the multi-criteria decision-making (MCDM) evaluation and are subsequently combined to give the evaluation result. The first stage of the expert’s research was compiled, and it validated the final set of factors for mechatronics, laser, and nanoelectronics technologies. The second stage of expert research was conducted to establish the relative weight of the factors in the set. The research had a third stage to identify the meanings of factors’ values, but this research is not the subject of this article but the subject of future research.
The set of factors and the relative weight of the factors in the set can be used as recommended guidelines for technology developers, investors, and potential owners in the decision-making processes of commercialization, investment, or purchase. The developed model for assessing the commercial potential of technologies should be used by the institutions engaged in scientific research and R&D to support the decision for the expedience of technology commercialization and to decide on commercialization regarding technology portfolio. Moreover, the model can be used to identify technology commercialization opportunities for different stakeholders interested in investing in technologies and the acquisition of technology and as a bargaining tool in the process of technology exchange.


