
Study of Chemical Pollutants and Ecological Reconstruction Methods in the Tismana I Quarry, Rovinari Basin, Romania


 ,
,  , and
, and
Abstract
:
1. Introduction
- ■
- geotechnical drilling to monitor surface stability;
- ■
- the reprofiling of high slopes with classic excavators.
2. Materials and Methods
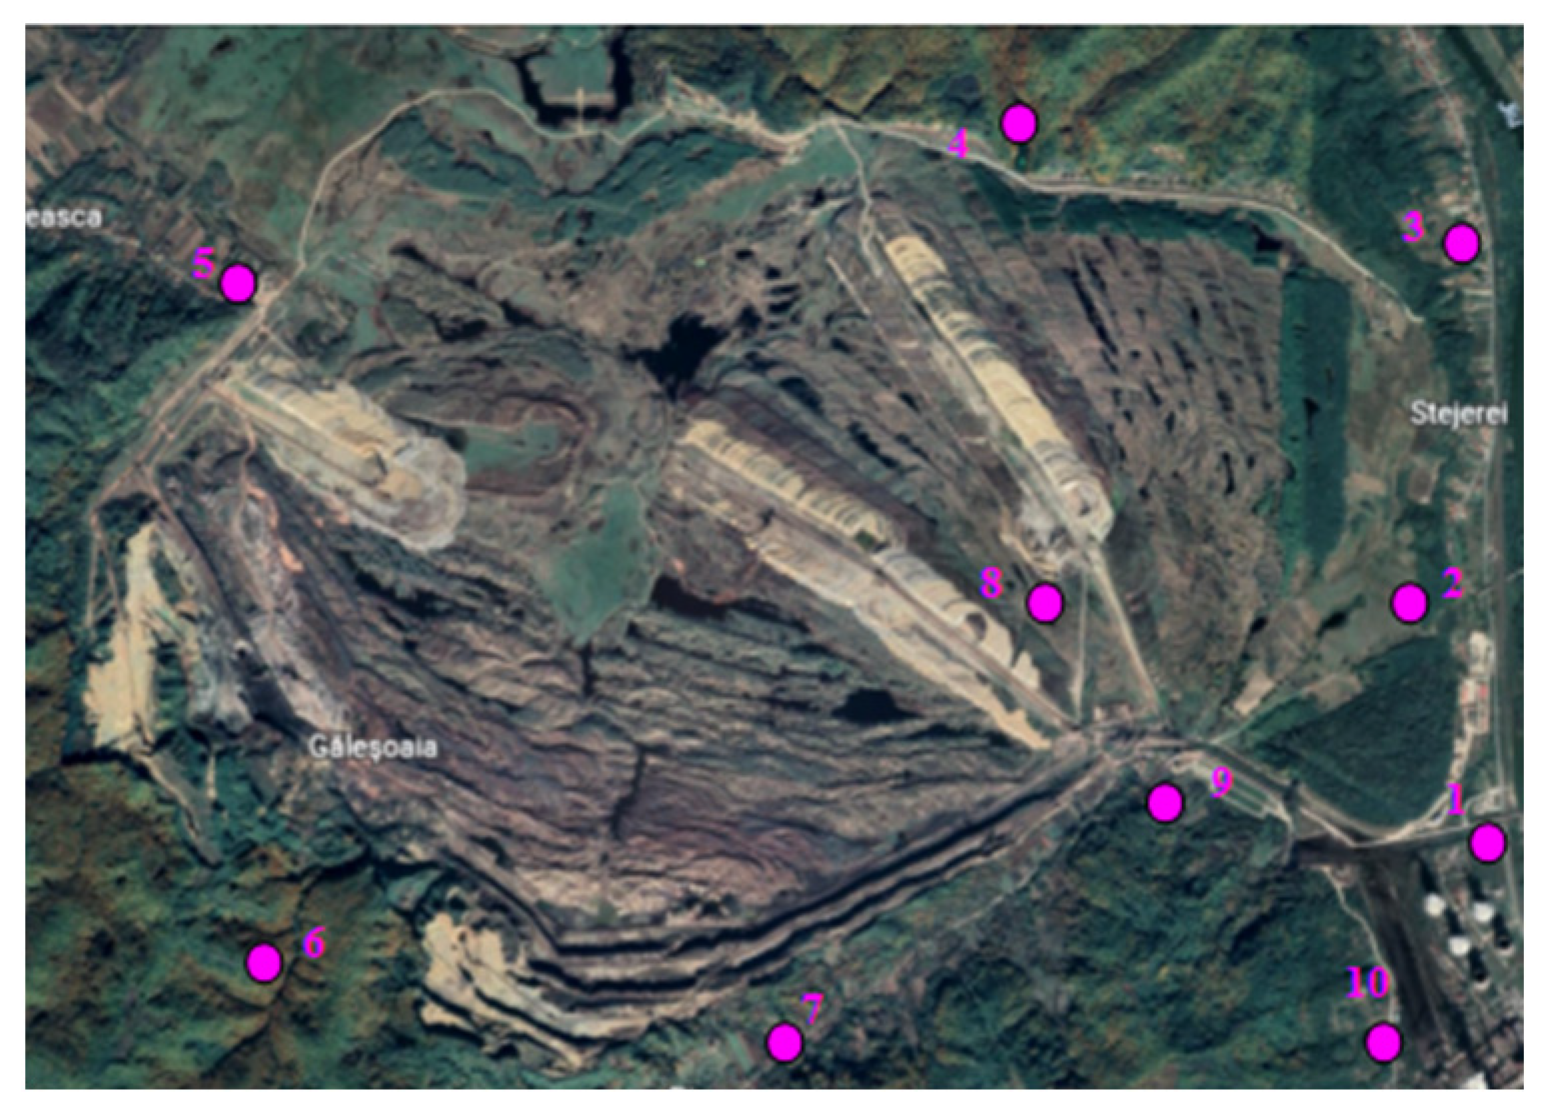
2.1. Soil Sampling Points
2.2. Apparatus, Reagents, and Methods
3. Results
4. Discussion
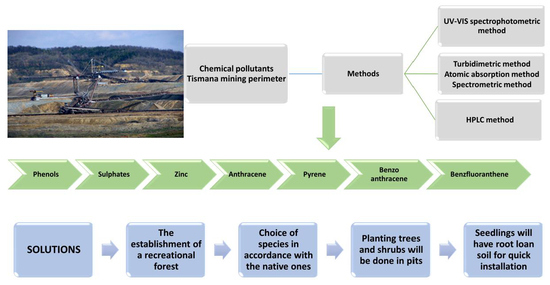
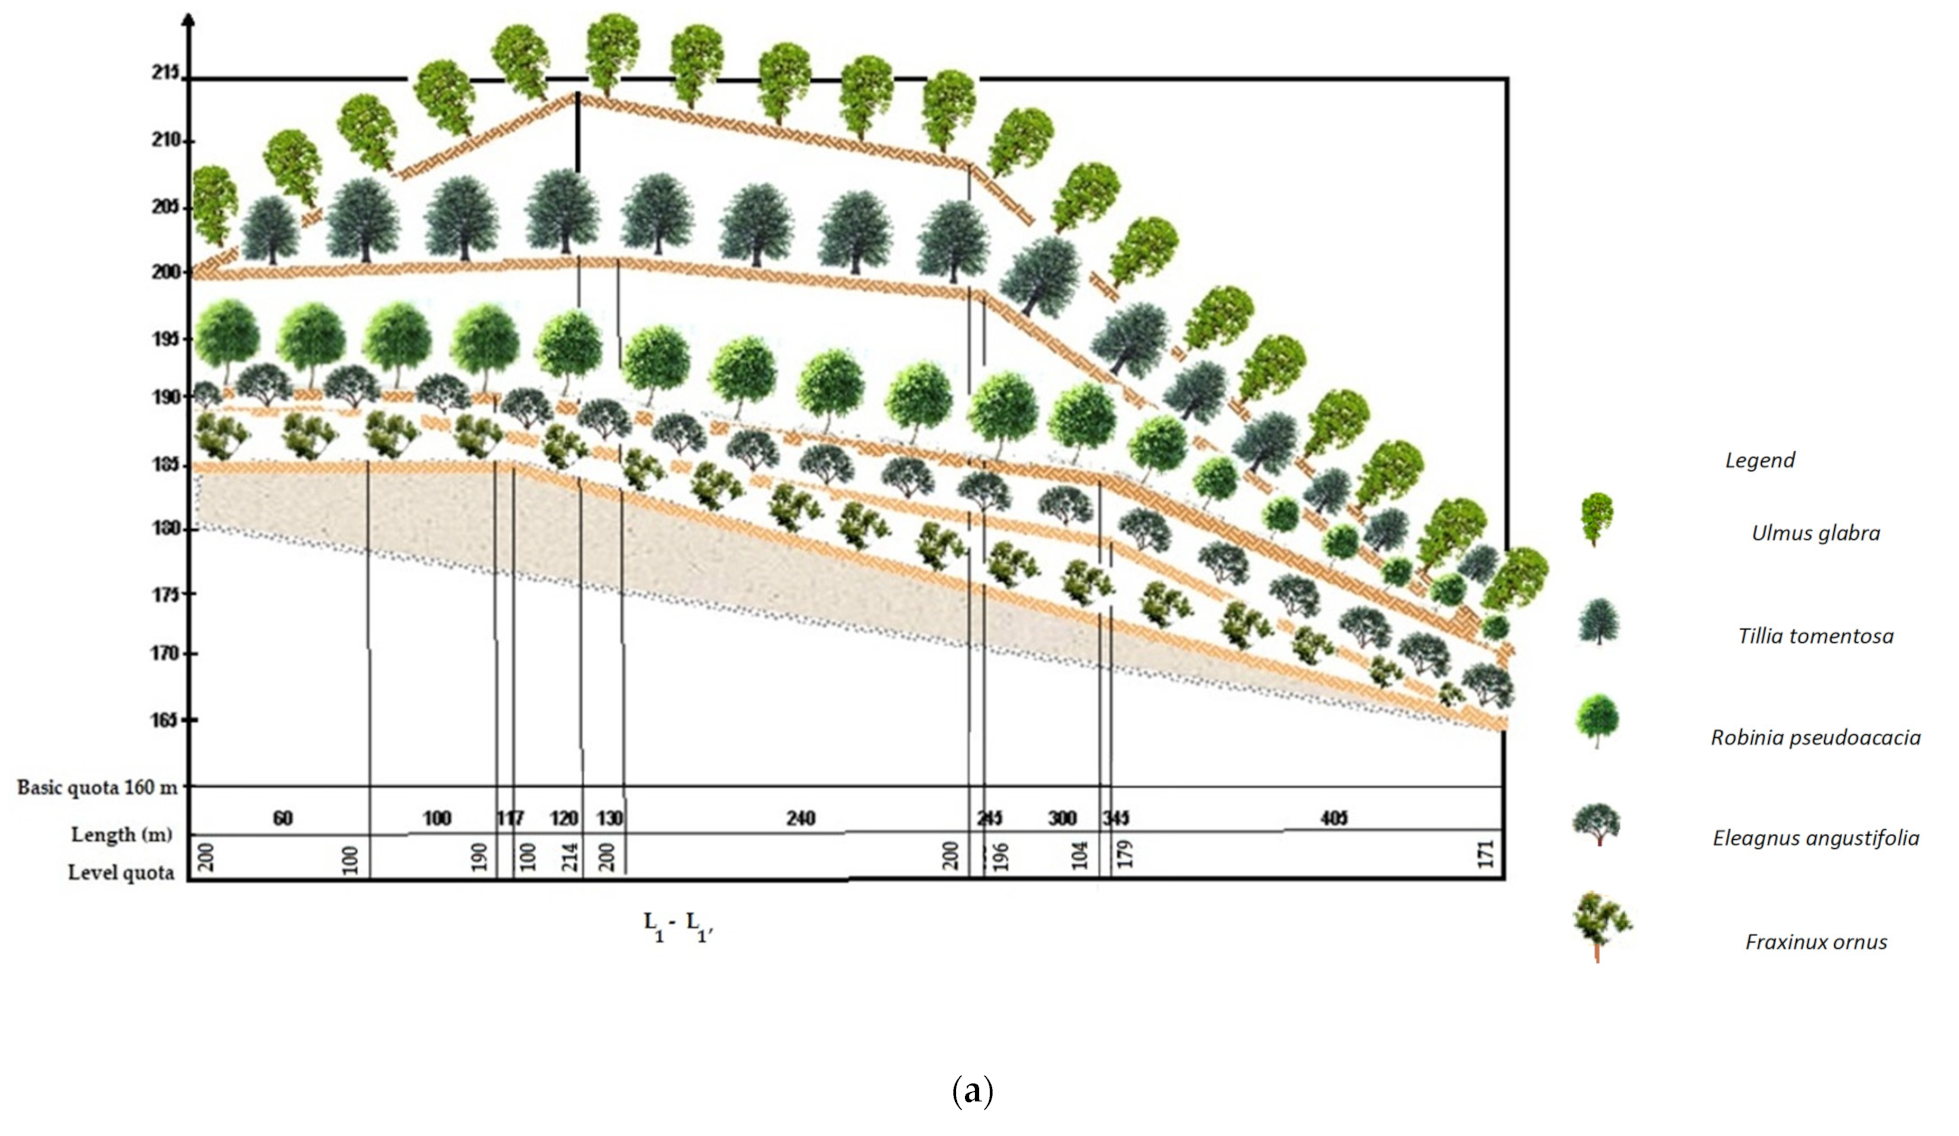
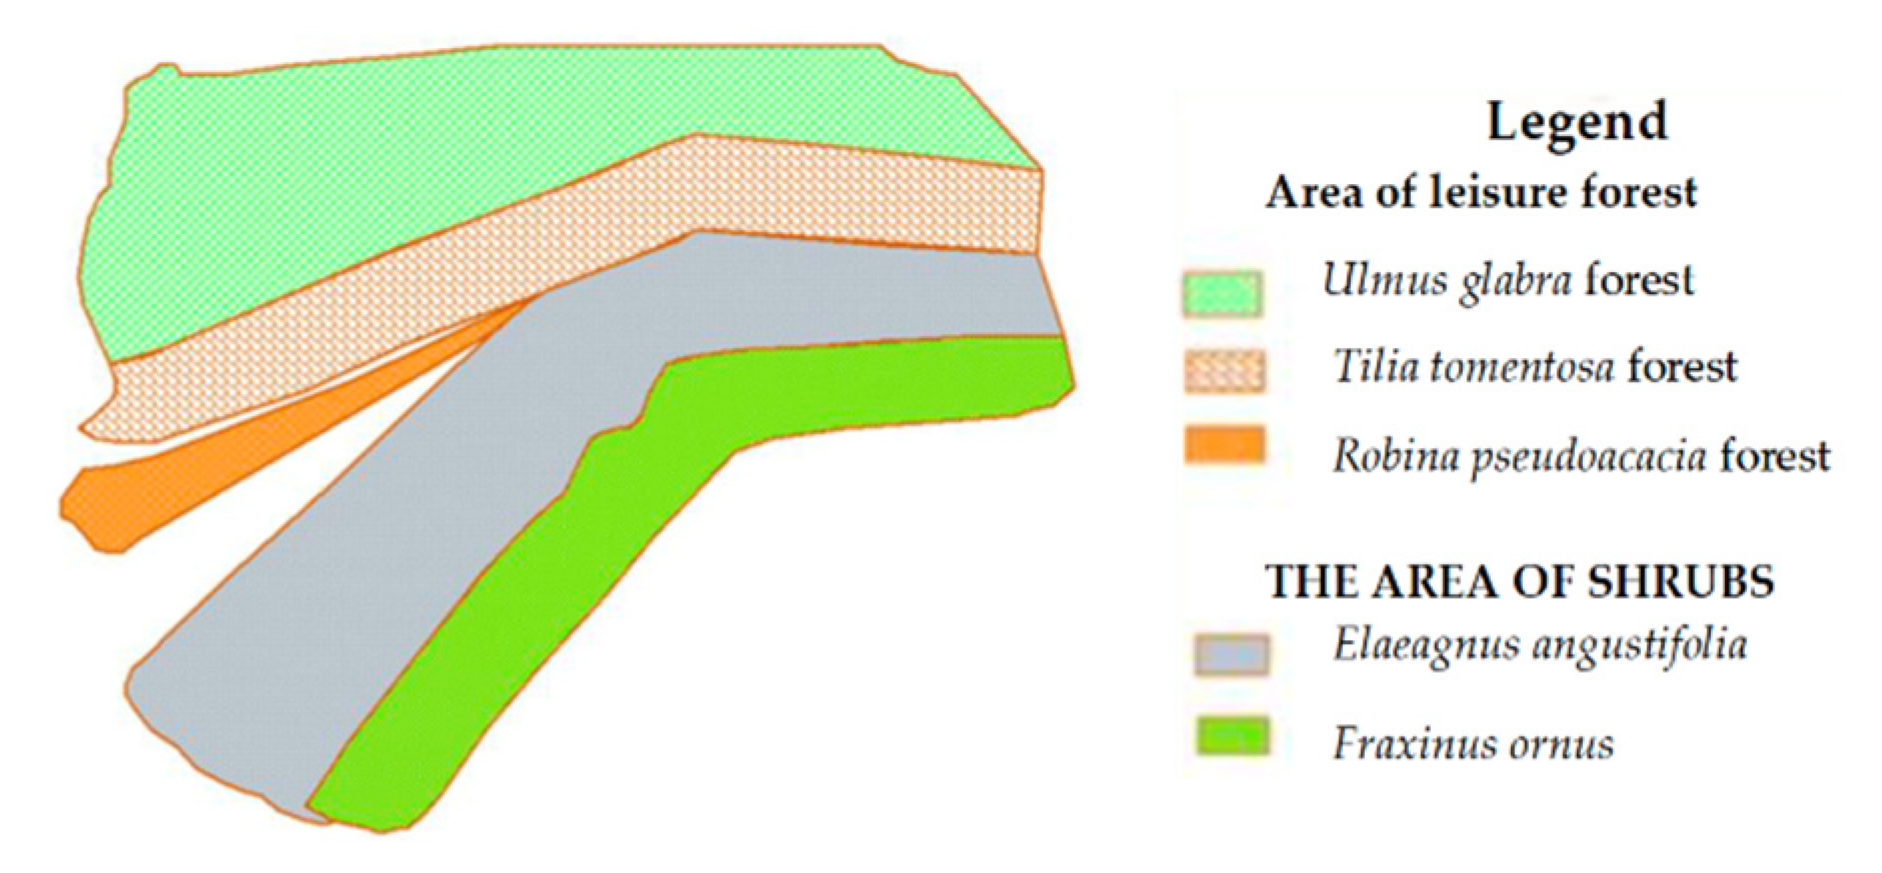
Possibilities for the Ecological Reconstruction of the Tismana I Quarry
- ■
- the possibility to generate less secondary waste;
- ■
- minimal degradation of the environment;
- ■
- the possibility to leave the soil in place, and in conditions of use after treatment;
- ■
- low design costs for land candidate for remediation;
- ■
- requiring very little technique, because the implementation requires little more than the basic physico-chemical techniques;
- ■
- the possibility of alternately placing accumulating species that are considered resistant species with sensitive species, e.g., Eleagnus angustifolia and Fraxinuxornus, with the sensitive species Tillia tomentosa, Ulmus glabra and Robiniapseudoacacia.
- ■
- the long time required (over 10 years of growth);
- ■
- the limited depth to which it can be applied (1.2 m for the soil) because the roots can only effectively clean a limited depth;
- ■
- the possibility that pollutants may enter the food chain through animal consumption of plants;
- ■
- the fact that the operating characteristics and costs for a large scale of implementation have not yet been fully assessed;
- ■
- plant residues which may require disposal as hazardous residues, or require additional treatment;
- ■
- the fact that degradation by-products can be mobilized to groundwater or bioaccumulated in animals;
- ■
- the possibility that if the concentration of contaminants is too high the plants may die;
- ■
- the fact that plant growth can be seasonal depending on the location;
- ■
- the climatic and hydrological conditions (e.g., floods, drought), which may restrict the growth rate of the type of plant that can be used;
- ■
- the fact that the surface of the local land can be modified to prevent floods or erosion;
- ■
- the fact that soil amendments may be needed, including chelating agents to facilitate the uptake of pollutants by plants by breaking the bonds between contaminants and soil particles.
5. Conclusions
- -
- The quality of the soil environmental factor in the mining and scrap mining perimeter is totally negatively modified by the direct and related coal mining activities. The same situation is found in the subsoil, where the mining activity effectively destroys the natural geological environment.
- -
- The potential environmental impact of the soil and subsoil is related to the risk of accidents or catastrophes related to:
- the risk of environmental accidents that could cause the self-ignition of coal in the layer or in the surface deposits;
- accidents or catastrophes leading to major disturbances of the geological environment, mixtures of aquifers, and penetration of pollutants from the surface;
- the adoption of organizational measures and exploitation technologies which do not limit the effective action “in situ” to that which is strictly necessary, and which are not adapted to the specifics of the local geological structure; this can generate an amplification and diversification of the complexity of the effects of coal on the ground and subsoil;
- the local accentuation of the instability of the geological strata, favoring landslides and settlements.
Author Contributions
Funding
Institutional Review Board Statement
Informed Consent Statement
Data Availability Statement
Acknowledgments
Conflicts of Interest
References
- Matei, R.; Dunca, E.-C.; Matei, A. Badanie zanieczyszczeń chemicznych i metod rekonstrukcji gospodarczej basenu Rovinar. Inżynieria Miner. 2020, 2, 50. [Google Scholar] [CrossRef]
- Almeida, J.; Ribeiro, A.B.; Silva, A.S.; Faria, P. Overview of mining residues incorporation in construction materials and barriers for full-scale application. J. Build. Eng. 2020, 29, 101215. [Google Scholar] [CrossRef]
- Samuel, A.D.; Bungau, S.; Tit, D.M.; Melinte, C.E.; Purza, L.; Badea, G.E. Effects of Long Term Application of Organic and Mineral Fertilizers on Soil Enzymes. Rev. Chim. 2018, 69, 2608–2612. [Google Scholar] [CrossRef]
- Boengiu, S.; Licurici, M.; Marinescu, E. Landscape changes induced by the mining activity at the contact between the Olteώ Piedmont and Gorj Subcarpathians. GIS Appl. Bull. Hell. Geol. Soc. 2008, 42, 74–81. [Google Scholar]
- Dimulescu, I.A.; Nechifor, A.C.; Bardaca, C.; Oprea, O.; Pascu, D.; Totu, E.E.; Albu, P.C.; Nechifor, G.; Bungau, S.G. Accessible Silver-Iron Oxide Nanoparticles as a Nanomaterial for Supported Liquid Membranes. Nanomaterials 2021, 11, 1204. [Google Scholar] [CrossRef]
- Nechifor, A.C.; Goran, A.; Grosu, V.A.; Bungau, C.; Albu, P.C.; Grosu, A.R.; Oprea, O.; Pancescu, F.M.; Nechifor, G. Improving the Performance of Composite Hollow Fiber Membranes with Magnetic Field Generated Convection Application on pH Correction. Membranes 2021, 11, 445. [Google Scholar] [CrossRef]
- Nechifor, A.C.; Cotorcea, S.; Bungau, C.; Albu, P.C.; Pascu, D.; Oprea, O.; Grosu, A.R.; Pirtac, A.; Nechifor, G. Removing of the Sulfur Compounds by Impregnated Polypropylene Fibers with Silver Nanoparticles-Cellulose Derivatives for Air Odor Correction. Membranes 2021, 11, 256. [Google Scholar] [CrossRef]
- Prada, M.; Popescu, D.E.; Bungau, C.; Pancu, R. Parametric Studies on European 20-20-20 Energy Policy Targets in University Environment. J. Environ. Prot. Ecol. 2017, 18, 1146–1157. [Google Scholar]
- Lechner, A.; Arnold, S.; McCaffrey, N.; Gordon, A.; Erskine, P.; Gillespie, M.; Mulligan, D. Applying modern ecological methods for monitoring and modelling mine rehabilitation success. Start Finish –Life -Mine Perspect. 2018, 3, 109–116. [Google Scholar]
- Cooke, J.; Johnson, M. Ecological restoration of land with particular reference to the mining of metals and industrial minerals: A review of theory and practice. Environ. Rev. 2002, 10, 41–71. [Google Scholar] [CrossRef] [Green Version]
- Bungau, S.; Behl, T.; Aleya, L.; Bourgeade, P.; Aloui-Sosse, B.; Purza, A.L.; Abid, A.; Samuel, A.D. Expatiating the impact of anthropogenic aspects and climatic factors on long-term soil monitoring and management. Environ. Sci. Pollut. Res. 2021, 28, 30528–30550. [Google Scholar] [CrossRef] [PubMed]
- McKenna, P.B.; Lechner, A.M.; Phinn, S.; Erskine, P.D. Remote Sensing of Mine Site Rehabilitation for Ecological Outcomes: A Global Systematic Review. Remote Sens. 2020, 12, 3535. [Google Scholar] [CrossRef]
- Padró, J.-C.; Cardozo, J.; Montero, P.; Ruiz-Carulla, R.; Alcañiz, J.M.; Serra, D.; Carabassa, V. Drone-Based Identification of Erosive Processes in Open-Pit Mining Restored Areas. Land 2022, 11, 212. [Google Scholar] [CrossRef]
- Vermaak, J.; Wates, J.; Bezuidenhout, N.; Kgwale, D. The evaluation of soil covers used in the rehabilitation of coal mines. Water Res. Comm. Rep. 2004, 4, 2761. [Google Scholar]
- Godbold, D.Á.; Hüttermann, A. Effect of zinc, cadmium and mercury on root elongation of Picea abies (Karst.) seedlings, and the significance of these metals to forest die-back. Environ. Pollut. Ser. A Ecol. Biol. 1985, 38, 375–381. [Google Scholar] [CrossRef]
- Kabata-Pendias, A.; Piotrowska, M.; Witek, T. Assessment of agricultural quality and possibilities of use of soils contaminated with heavy metals. Eval. Soil Contam. Plants. Pulawy IUNiG Inst. Soil Sci. Plant Cultiv. State Res. Inst. Pulawy 1993, 4, 5–10. (In Polish) [Google Scholar]
- Pietrzykowski, M.; Krzaklewski, W. Heavy metals content in initial soil formed under succession communities on sand mine quarry. Electron. J. Pol. Agric. Univ. 2010, 13, 1762. [Google Scholar]
- Iung-Pib, S.; Regionach, U.P.R.W.; Zanieczyszczonych, O.D.U.G.; Śladowymi, M. Źródła zanieczyszczenia gleb metalami. IUNG-PIB 2018, 58, 81–95. Available online: https://iung.pl/sir/zeszyt58_6.pdf (accessed on 20 April 2022). [CrossRef]
- Greszta, J.; Godzik, S. Wpływ hutnictwa cynku na gleby. Rocz. Glebozn 1969, 20, 286. [Google Scholar]
- Haigh, M.J. Problems in the reclamation of coal-mine disturbed lands in Wales. Int. J. Surf. Min. Reclam. Environ. 1992, 6, 31–37. [Google Scholar] [CrossRef]
- Zwoliński, J. Effects of emissions from non-ferrous metal works on forest environment—The role of heavy metals in forest degradation. J. For. Res. Inst. Ser. A 1995, 809, 1–86. [Google Scholar]
- Pietrzykowski, M.; Socha, J.; van Doorn, N.S. Linking heavy metal bioavailability (Cd, Cu, Zn and Pb) in Scots pine needles to soil properties in reclaimed mine areas. Sci. Total Environ. 2014, 470, 501–510. [Google Scholar] [CrossRef] [PubMed]
- Kabata-Pendias, A. Trace Metals in Soils of Poland. Trace Subst. 1992, 25, 53. [Google Scholar]
- Leitgib, L.; Kálmán, J.; Gruiz, K. Comparison of bioassays by testing whole soil and their water extract from contaminated sites. Chemosphere 2007, 66, 428–434. [Google Scholar] [CrossRef]
- Awasthi, G.; Nagar, V.; Mandzhieva, S.; Minkina, T.; Sankhla, M.S.; Pandit, P.P.; Aseri, V.; Awasthi, K.K.; Rajput, V.D.; Bauer, T. Sustainable Amelioration of Heavy Metals in Soil Ecosystem: Existing Developments to Emerging Trends. Minerals 2022, 12, 85. [Google Scholar] [CrossRef]
- United States Environmental Protection Agency. Green Remediation: Incorporating Sustainable Environmental Practices into Remediation of Contaminated Sites; United States Environmental Protection Agency: Cincinnati, OH, USA, 2008. Available online: https://www.epa.gov/sites/default/files/2015-04/documents/green-remediation-primer.pdf (accessed on 20 April 2022).
- Prada, M.F.; Popescu, D.E.; Bungau, C. Building Education, Source of Energy Saving in Romania. In Proceedings of the 15th National Technical-Scientific Conference on Modern Technologies for the 3rd Millennium, Oradea, Romania, 27–28 November 2015; pp. 157–162. [Google Scholar]
- Bungau, C.C.; Prada, I.F.; Prada, M.; Bungau, C. Design and Operation of Constructions: A Healthy Living Environment-Parametric Studies and New Solutions. Sustainability 2019, 11, 6824. [Google Scholar] [CrossRef] [Green Version]
- Dobre-Baron, O.; Nițescu, A.; Niță, D.; Mitran, C. Romania’s Perspectives on the Transition to the Circular Economy in an EU Context. Sustainability 2022, 14, 5324. [Google Scholar] [CrossRef]
- Bacali, L.; Lakatos, E.S.; Naghiu, M.O.; Bungau, C. Analysis on the Impact of History on Economic Development and the Entrepreneurial Map in Romania. Transylv. Rev. 2017, 26, 287–297. [Google Scholar]


| No. | Soil Sampling Point Symbol | Name of Soil Sampling Point |
|---|---|---|
| 1 | S1A, S1S– soil | Materials warehouse recovered Rovinari |
| 2 | S2A, S2S– soil | Poiana colony |
| 3 | S3A, S3S– soil | Warehouse subassemblies recovered Gârla |
| 4 | S4A, S4S– soil | The northeastern part of the quarry |
| 5 | S5A, S5S– soil | Hodăreasca village, the first house |
| 6 | S6A,S6S– soil | Găleşoaia village, the first house |
| 7 | S7A,S7S– soil | Near the first house in Pinoasa village, in front of the Tismana I mining perimeter |
| 8 | S8A, S8S– soil | Exit from career |
| 9 | S9A, S9S– soil | In the Tismana I quarry waste oil depot, 30 m from fixed oil storage containers |
| 10 | S10A, S10S– soil | Near the first house in the village of Arderea, near the perimeter of Tismana I |
| Apparatus | Reagents | Method |
|---|---|---|
| Sulphates of Cd, Cu, Pb, Ni, Zn, and Phenols Determination by Turbidimetry Method | ||
| Atomic absorption spectrophotometer Agilent 280FS (Agilent Technologies, Inc., Santa Clara, CA, USA) Agilent Sample Introduction and Preparation System, Double Pump Accessory (SIPS 20) (Agilent Technologies, Inc., Santa Clara, CA, USA) Achieve high sensitivity—typically > 0.9 Abs. from 5 mg/L Cu. | 240 g NaCl + 20 mL HCl + H2O up to 1 L 50 mL glycerol + 100 mL EtOH and BaCl2 0.1479 g Na2SO4 + H2O up to 1 L Reagents from Merck KGaA, Germany. | 5 g of air-dried soil + 50 mL of distilled H2O; the resulted suspension was filtered through Whatman filter paper, the filtrate being analyzed. |
| Cyanides Determination by Spectrofluorimetric Method | ||
| UV-VIS Fluorescence Spectrophotometer (FLS1000 Spectrofluorometer, Edinburgh Instruments Ltd., Livingston, UK). Sensitivity >35,000:1 standard H2O Raman measurement conditions: excitation λ = 350 nm excitation/emission bandwidths =5 nm step size = 1 nm integration time = 1 s emission λ = 397 nm noise measured at 450 nm calculation based on the SQRT method | At an aliquot of 1 mL standard cyanide solutions + 10 mL H2O + 8 mL PBS + 2 mL CAT reagent. Leave the solution to stand for 5 min. +10 mL solution of PY and H-Bar + H2O up to 50 mL. The solution is leaved to stand for 1 h. Reagents from Merck KGaA, Germany. | Determination of easily released cyanide by steam distillation of buffered and air-dried soil, pH = 4, followed by spectrophotometric determination using CAT and H-Bar. The absorbance of the solution is read in a cell with a path length of 10 mm, λ = 575 nm, using H2O as control solution. This λ may not be the maximum absorption λ. The absorbance calibration based on the amount of cyanide in V1 mL of standard working cyanide solution is plotted. |
| Polynuclear aromatic hydrocarbons (PAHs) determination by HPLC chromatographic method | ||
| Agilent ZORBAX Eclipse PAH Column (4.6 mm × 50 mm, 1.8 mm), p/n 959941-918 (Agilent Technologies, Inc., Santa Clara, CA, USA) Agilent 1200 Series HPLC (Agilent Technologies, Inc., Santa Clara, CA, USA) equipped with a binary pump and a FLD set to variation with excitation and emission wavelengths. Data were processed by 2D HPLC. In the case of the method using the FLD detector, the sensitivity (signal-to-noise ratio> 10: 1) is in the range of picograms. | CH3CN and PAH were purchased from Sigma-Aldrich (St. Louis, MO, USA). H2O used came from a MilliQ system (Milford, MA, USA). The mobile phase was filtered through a Whatman membrane filter (47 mm diameter, 2 μm pore size). Standard stock solutions (1 mg/mL) were prepared by dissolving 10 mg of PAH in 10 mL CH3CN, stored at −20 °C. The daily working solutions were freshly prepared by serial dilutions with CH3CN. | Analytes were separated on the column by gradient elution with a binary system of CH3CN-H2O with subsequent fluorescence detection set at the corresponding excitation/emission λ. The recoveries of the analytes varied between 86.0–99.2%, with RSD ranging between 0.6–1.9%, at 3 different levels of fortification. LODs ranged from 0.005 to 0.78 ng/g, and the LOQs ranged from 0.02 to 1.6.6 ng/g. The selection of excitation/emission λ for fluorescence detection was based on the optimal responses for different PAHs. |
| Quality Indicators (mg/kg su) (LOD/LOQ) | Soil Sampling Points | |||||||||
|---|---|---|---|---|---|---|---|---|---|---|
| S1S | S1A | S2S | S2A | S3S | S3A | S4S | S4A | S5S | S5A | |
| Level | I | II | I | II | I | II | I | II | I | II |
| Cadmium (2.0/6.6) | <2.0 * | <2.0 * | <2.0 * | <2.0 * | <2.0 * | <2.0 * | <2.0 * | <2.0 * | <2.0 * | <2.0 * |
| Lead (2.0/6.6) | 2.57 ± 0.01 | 2.52 ± 0.07 | <2.0 * | <2.0 * | 2.62 | 2.66 ± 0.03 | <2.0 * | <2.0 * | <2.0 * | <2.0 * |
| Free cyanides (0.05/0.16) | <0.05 * | <0.05 * | 0.21 ± 0.05 | <0.05 * | <0.05 * | 0.083 ± 0.03 | <0.05 * | <0.05 * | <0.05 * | <0.05 * |
| Phenols (2.0/6.6) | 0.23 ± 0.03 | <2.0 * | 0.08 ± 0.01 | 0.23 ± 0.01 | <2.0 * | 0.25 ± 0.01 | 0.15 ± 0.01 | 0.17 ± 0.01 | 0.39 ± 0.03 | 0.66 ± 0.02 |
| Sulphates (0.1/0.33) | 339.1 ± 0.10 | 141.12 ± 0.21 | 248.11 ± 0.13 | 98.03 ± 0.11 | 198.93 ± 0.27 | 102.05 ± 0.31 | 98.22 ± 0.07 | 49.27 ± 0.05 | 97.65 ± 0.11 | 97.94 ± 0.23 |
| Copper (2.0/6.6) | 21.41 ± 0.07 | 8.4 ± 0.10 | 4.31 ± 0.21 | 3.32 ± 0.05 | 13.09 ± 0.10 | 8.85 ± 0.11 | 4.27 ± 0.02 | 8.55 ± 0.07 | 4.78 ± 0.09 | 4.79 ± 0.08 |
| Nickel (2.0/6.6) | 16.64 ± 0.03 | <2.0 * | <2.0 * | <2.0 * | 31.83 ± 0.13 | 17.2 ± 0.10 | <2.0 * | 16.62 ± 0.11 | 16.47 ± 0.11 | 16.52 ± 0.10 |
| Zinc (0.1/0.33) | 214.06 ± 0.12 | 255.0 ± 0.19 | 32.31 ± 0.22 | 12.25 ± 0.18 | 342.76 ± 0.29 | 79.1 ± 0.17 | 19.8 ± 0.10 | 53.45 ± 0.23 | 59.03 ± 0.18 | 59.17 ± 0.10 |
| PAH (0.01/0.033) | 2.9 ± 0.07 | 0.1 ± 0.03 | 0.14 ± 0.03 | 0.24 ± 0.02 | 0.03 ± 0.01 | 0.14 ± 0.02 | 0.27 ± 0.10 | 0.13 ± 0.03 | 0.09 ± 0.03 | 0.18 ± 0.02 |
| Naphthalene (0.01/0.033) | <0.01 * | <0.01 * | <0.01 * | <0.01 * | <0.01 * | <0.01 * | <0.01 * | <0.01 * | <0.01 * | <0.01 * |
| Phenanthrene (0.01/0.033) | <0.01 * | <0.01 * | <0.01 * | <0.01 * | <0.01 * | 0.03 ± 0.01 | <0.01 * | <0.01 * | <0.01 * | <0.01 * |
| Anthracene (0.01/0.033) | 0.05 ± 0.01 | <0.01 * | <0.01 * | <0.01 * | <0.01 * | <0.01 * | <0.01 * | <0.01 * | <0.01 * | <0.01 * |
| Fluoranthene(0.01/0.033) | 0.07 ± 0.01 | <0.01 * | <0.01 * | <0.01 * | <0.01 * | <0.01 * | <0.01 * | <0.01 * | <0.01 * | <0.01 * |
| Pyrene (0.01/0.033) | 1.32 ± 0.03 | <0.01 * | 0.02 ± 0.01 | 0.02 ± 0.01 | <0.01 * | 0.06 ± 0.10 | 0.05 ± 0.10 | 0.05 ± 0.01 | 0.03 ± 0.01 | <0.01 * |
| Benz(a) anthracene (0.01/0.033) | 1.28 ± 0.03 | <0.01 * | 0.02 | <0.01 * | <0.01 * | <0.01 * | 0.04 | 0.03 | <0.01 * | <0.01 * |
| Chrysene (0.01/0.033) | <0.01 * | <0.01 * | <0.01 * | <0.01 * | <0.01 * | <0.01 * | <0.01 * | <0.01 * | <0.01 * | <0.01 * |
| Benz fluorantrain (0.01/0.033) | 0.18 ± 0.01 | 0.1 ± 0.01 | 0.1 ± 0.01 | 0.22 ± 0.03 | 0.03 ± 0.01 | 0.05 ± 0.01 | 0.18 ± 0.10 | 0.05 ± 0.02 | 0.06 ± 0.03 | 0.18 ± 0.02 |
| Benz(a) pyrene (0.01/0.033) | <0.01 * | <0.01 * | <0.01 * | <0.01 * | <0.01 * | <0.01 * | <0.01 * | <0.01 * | <0.01 * | <0.01 * |
| Benzo(ghi) perilen (0.01/0.033) | <0.01 * | <0.01 * | <0.01 * | <0.01 * | <0.01 * | <0.01 * | <0.01 * | <0.01 * | <0.01 * | <0.01 * |
| Indene pyren (0.01/0.033) | <0.01 * | <0.01 * | <0.01 * | <0.01 * | <0.01 * | <0.01 * | <0.01 * | <0.01 * | <0.01 * | <0.01 * |
| Quality Indicators (mg/kg su) | Soil Sampling Points | |||||||||
|---|---|---|---|---|---|---|---|---|---|---|
| S6S | S6A | S7S | S7A | S8S | S8A | S9S | S9A | S10S | S10A | |
| Level | I | II | I | II | I | II | I | II | I | II |
| Cadmium | <2.0 * | <2.0 * | <2.0 * | <2.0 * | <2.0 * | <2.0 * | <2.0 * | <2.0 * | <2.0 * | <2.0 * |
| Lead | <2.0 * | <2.0 * | <2.0 * | <2.0 * | <2.0 * | <2.0 * | <2.0 * | <2.0 * | <2.0 * | 36.9 |
| Free cyanides | 0.046 ± 0.03 | 0.057 ± 0.03 | <0.05 * | <0.05 * | <0.05 * | 0.18 ± 0.04 | <0.05 * | <0.05 * | 0.08 ± 0.02 | <0.05 * |
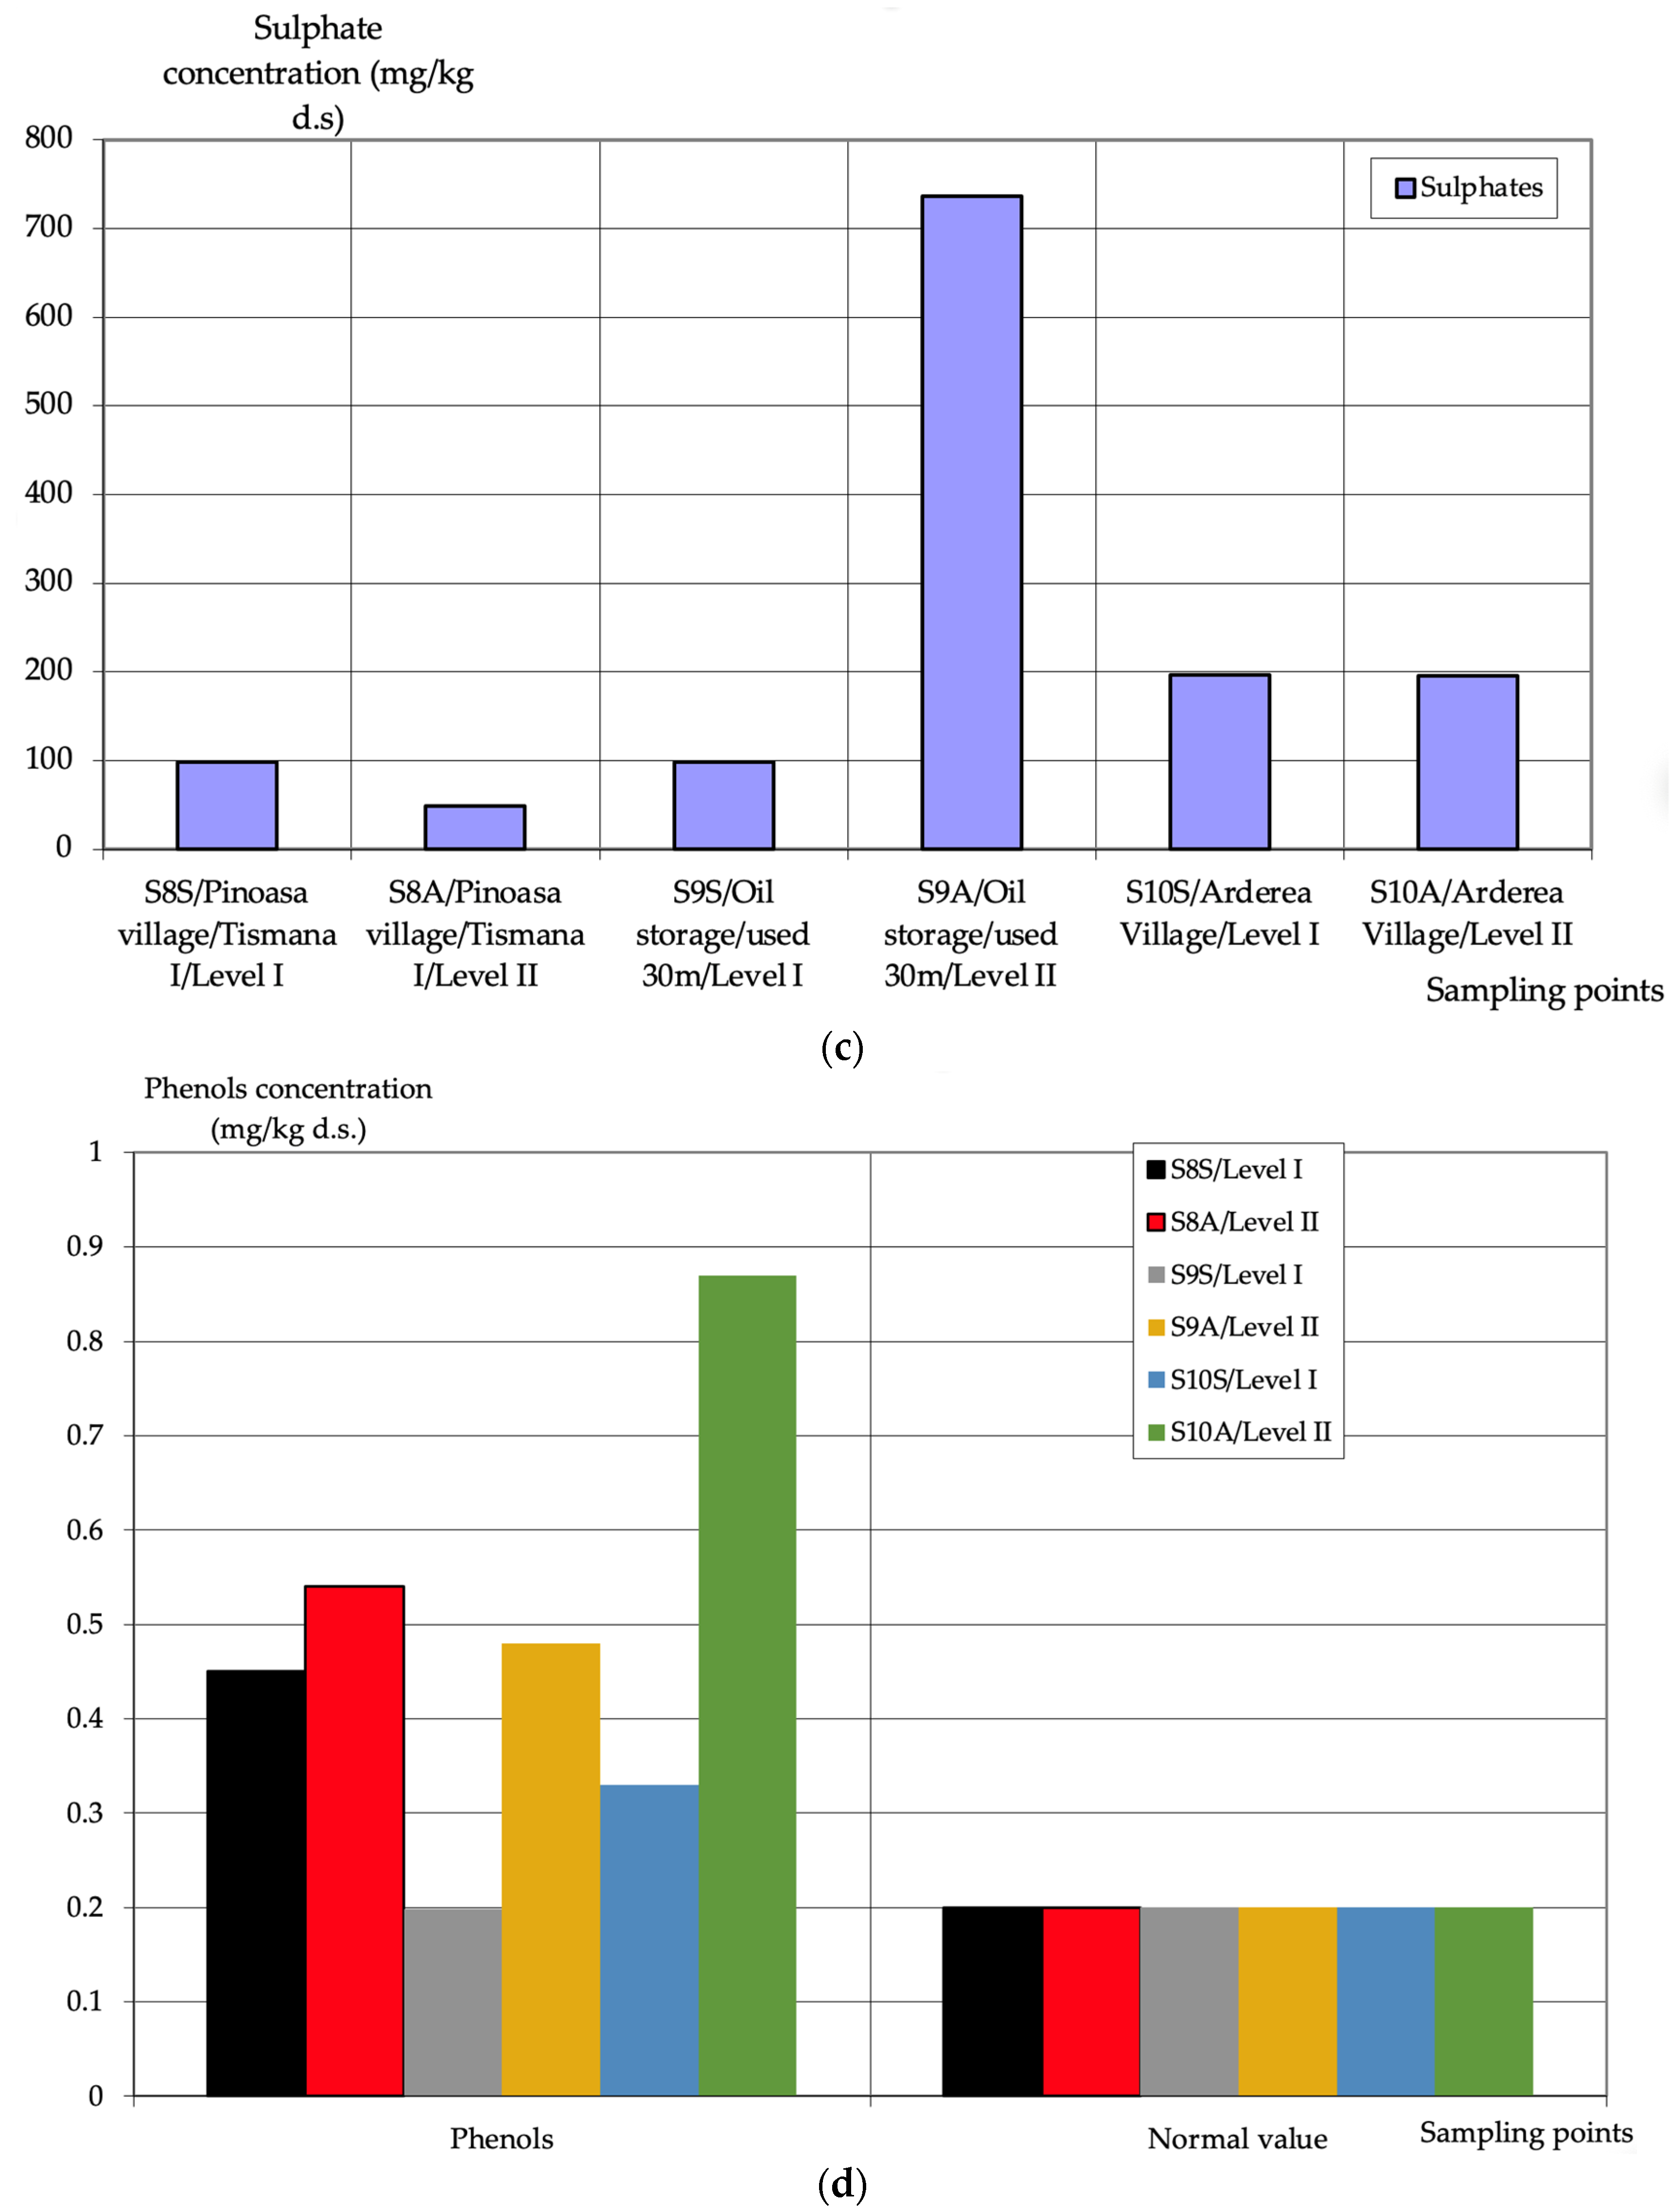
| Phenols | <0.02 * | 0.66 ± 0.07 | <0.02 * | 0.065 ± 0.07 | 0.45 ± 0.03 | 0.54 ± 0.05 | 0.189 ± 0.03 | 0.48 ± 0.02 | 0.33 ± 0.01 | 0.87 ± 0.02 |
| Sulphates | 143.98 ± 0.27 | 98.5 ± 0.29 | 96.94 ± 0.17 | 48.23 ± 0.21 | 98.31 ± 0.19 | 48.9 ± 0.26 | 97.92 ± 0.21 | 736.34 ± 0.29 | 196.5 ± 0.17 | 195.15 ± 0.17 |
| Copper | 3.34 ± 0.11 | 3.33 ± 0.08 | 3.28 ± 0.08 | 4.77 ± 0.07 | 4.81 ± 0.09 | 3.31 ± 0.11 | 3.32 ± 0.10 | 3.32 ± 0.10 | 4.31 ± 0.17 | 12.84 ± 0.11 |
| Nickel | <2.0 * | <2.0 * | 7.35 ± 0.12 | 16.42 ± 0.23 | 16.58 ± 0.12 | 16.48 ± 0.10 | 16.51 ± 0.13 | 16.56 ± 0.11 | 16.74 ± 0.10 | 31.22 ± 0.22 |
| Zinc | 26.02 ± 0.13 | 45.8 ± 0.24 | 24.04 ± 0.26 | 28.68 ± 0.19 | 106.68 ± 0.29 | 136.35 ± 0.27 | 166.96 ± 0.23 | 47.18 ± 0.17 | 153.87 ± 0.21 | 183.87 ± 0.23 |
| PAH | 0.19 ± 0.03 | 0.06 ± 0.01 | 0.42 ± 0.02 | 0.17 ± 0.03 | 0.05 ± 0.01 | 0.1 ± 0.01 | 0.15 ± 0.03 | 0.15 ± 0.03 | 0.08 ± 0.02 | 1.45 ± 0.08 |
| Naphthalene | <0.01 * | <0.01 * | <0.01 * | <0.01 * | <0.01 * | <0.01 * | <0.01 * | <0.01 * | <0.01 * | <0.01 * |
| Phenanthrene | <0.01 * | <0.01 * | <0.01 * | <0.01 * | <0.01 * | <0.01 * | 0.02 ± 0.01 | <0.01 * | <0.01 * | <0.01 * |
| Anthracene | <0.01 * | <0.01 * | <0.01 * | <0.01 * | <0.01 * | <0.01 * | <0.01 * | <0.01 * | <0.01 * | 0.13 ± 0.03 |
| Fluoranthene | <0.01 * | <0.01 * | <0.01 * | <0.01 * | <0.01 * | <0.01 * | <0.01 * | <0.01 * | <0.01 * | <0.01 * |
| Pyrene | <0.01 * | <0.01 * | 0.31 ± 0.01 | <0.01 * | <0.01 * | <0.01 * | <0.01 * | <0.01 * | 0.04 ± 0.02 | 0.55 ± 0.03 |
| Benz(a) anthracene | <0.01 * | <0.01 * | <0.01 * | <0.01 * | <0.01 * | <0.01 * | <0.01 * | <0.01 * | <0.01 * | 0.56 ± 0.01 |
| Chrysene | <0.01 * | <0.01 * | <0.01 * | <0.01 * | <0.01 * | <0.01 * | 0.02 ± 0.01 | <0.01 * | <0.01 * | <0.01 * |
| Benz fluorantrain | 0.19 ± 0.03 | 0.06 ± 0.03 | 0.11 ± 0.01 | 0.17 ± 0.01 | 0.05 ± 0.01 | 0.1 ± 0.01 | 0.11 ± 0.03 | 0.15 ± 0.03 | 0.04 ± 0.01 | 0.21 ± 0.07 |
| Benz(a) pyrene | <0.01 * | <0.01 * | <0.01 * | <0.01 * | <0.01 * | <0.01 * | <0.01 * | <0.01 * | <0.01 * | <0.01 * |
| Benzo(ghi) perilen | <0.01 * | <0.01 * | <0.01 * | <0.01 * | <0.01 * | <0.01 * | <0.01 * | <0.01 * | <0.01 * | <0.01 * |
| Indene pyren | <0.01 * | <0.01 * | <0.01 * | <0.01 * | <0.01 * | <0.01 * | <0.01 * | <0.01 * | <0.01 * | <0.01 * |
| Quality Indicators | Soil Sampling Points (mg/kg su) | Normal Values | Alert Thresholds | Intervention Thresholds | |||||||
|---|---|---|---|---|---|---|---|---|---|---|---|
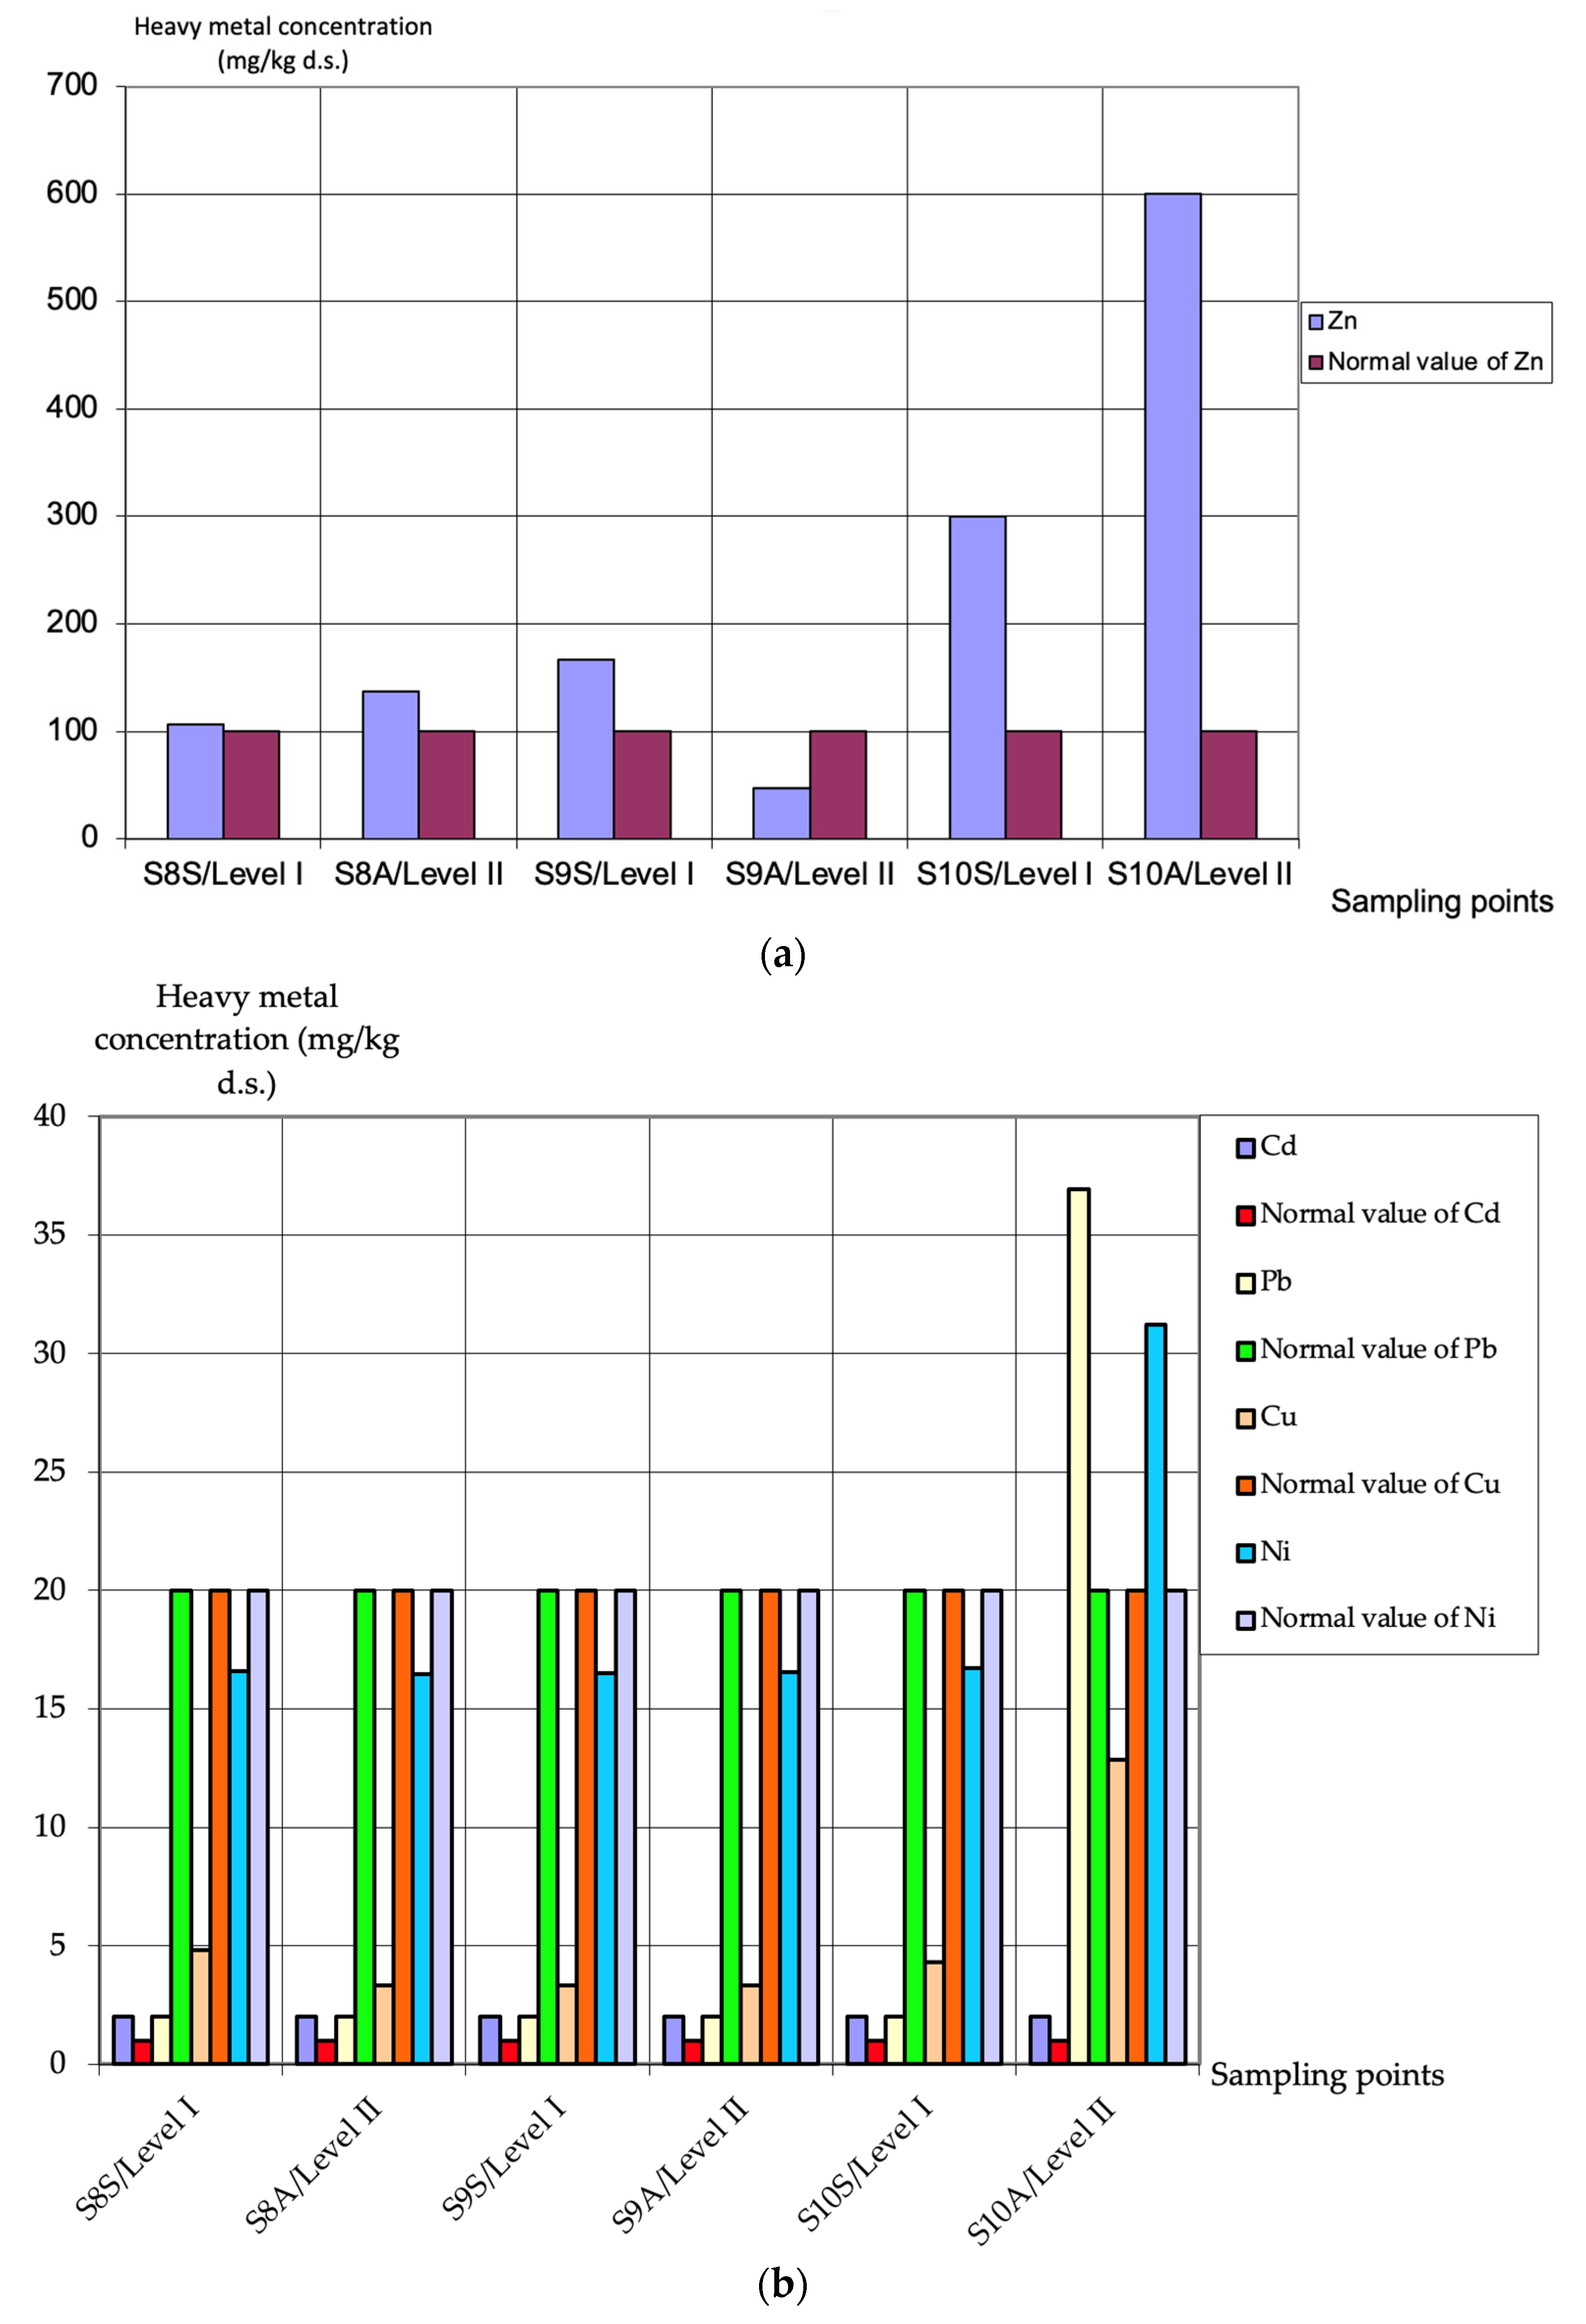
| S8S | S8A | S9S | S9A | S10S | S10A | Types of Uses | |||||
| Level | I Ss | II Depth 20 cm | I Ss | II Depth 20 cm | I Ss | II Depth 20 cm | Sensitive | Less sensit. | Sensitive | Less sensit. | |
| Cadmium | <2.0 * | <2.0 * | <2.0 * | <2.0 * | <2.0 * | <2.0 * | 1 | 3 | 5 | 5 | 10 |
| Lead | <2.0 * | <2.0 * | <2.0 * | <2.0 * | <2.0 * | 36.9 | 20 | 50 | 250 | 100 | 1000 |
| Free cyanides | <0.05 | 0.18 ± 0.04 | <0.05 | <0.05 | 0.08 ± 0.02 | <0.05 * | <1 | 5 | 10 | 10 | 20 |
| Phenols | 0.45 ± 0.03 | 0.54 ± 0.05 | 0.189 ± 0.03 | 0.48 ± 0.02 | 0.33 ± 0.01 | 0.87 ± 0.02 | <0.02 | 5 | 10 | 10 | 40 |
| Sulphates | 98.31 ± 0.19 | 48.9 ± 0.26 | 97.92 ± 0.21 | 736.34 ± 0.29 | 196.5 ± 0.17 | 195.15 ± 0.17 | - | 2000 | 5000 | 10,000 | 50,000 |
| Copper | 4.81 ± 0.09 | 3.31 ± 0.11 | 3.32 ± 0.10 | 3.32 ± 0.10 | 4.31 ± 0.17 | 12.84 ± 0.11 | 20 | 100 | 250 | 200 | 500 |
| Nickel | 16.58 ± 0.12 | 16.48 ± 0.10 | 16.51 ± 0.13 | 16.56 ± 0.11 | 16.74 ± 0.10 | 31.22 ± 0.22 | 20 | 75 | 200 | 150 | 500 |
| Zinc | 106.68 ± 0.29 | 136.35 ± 0.27 | 166.96 ± 0.23 | 47.18 ± 0.17 | 153.87 ± 0.21 | 183.87 ± 0.23 | 100 | 300 | 700 | 600 | 1500 |
| PAH | 0.05 ± 0.01 | 0.1 ± 0.01 | 0.15 ± 0.03 | 0.15 | 0.08 ± 0.02 | 1.45 ± 0.08 | <0.1 | 7.5 | 25 | 15 | 150 |
| Naphthalene | <0.01 * | <0.01 * | <0.01 * | <0.01 * | <0.01 * | <0.01 * | <0.02 | 2 | 5 | 5 | 50 |
| Phenanthrene | <0.01 * | <0.01 * | 0.02 ± 0.01 | <0.01 * | <0.01 * | <0.01 * | <0.05 | 2 | 5 | 5 | 50 |
| Anthracene | <0.01 * | <0.01 * | <0.01 * | <0.01 * | <0.01 * | 0.13 ± 0.03 | <0.05 | 5 | 10 | 10 | 100 |
| Fluoranthene | <0.01 * | <0.01 * | <0.01 * | <0.01 * | <0.01 * | <0.01 * | <0.02 | 5 | 10 | 10 | 100 |
| Pyrene | <0.01 * | <0.01 * | <0.01 * | <0.01 * | 0.04 ± 0.01 | 0.55 ± 0.03 | <0.02 | 2 | 5 | 5 | 50 |
| Type of Land | Afforestation Formula | Type of Species | Surface Excessively Eroded Land (ha) | Density Seedlings/ha |
|---|---|---|---|---|
| For excessively eroded land | 40% Ul + 30% Sc + 30% Te | Ulmus glabra (Ul) Robinia pseudoacacia (Sc) Tillia tomentosa (Te) | 740.5 | 1332,900 1488,405 999,675 |
| The protection curtains | 60% El.a. + 40 Mj | Eleagnus angustifolia (El.a.) Fraxinux ornus (Mj) | 740.5 | 1110,750 740,500 |
Publisher’s Note: MDPI stays neutral with regard to jurisdictional claims in published maps and institutional affiliations. |
© 2022 by the authors. Licensee MDPI, Basel, Switzerland. This article is an open access article distributed under the terms and conditions of the Creative Commons Attribution (CC BY) license (https://creativecommons.org/licenses/by/4.0/).
Share and Cite
Matei, O.-R.; Dumitrescu Silaghi, L.; Dunca, E.-C.; Bungau, S.G.; Tit, D.M.; Mosteanu, D.-E.; Hodis, R. Study of Chemical Pollutants and Ecological Reconstruction Methods in the Tismana I Quarry, Rovinari Basin, Romania. Sustainability 2022, 14, 7160. https://doi.org/10.3390/su14127160
Matei O-R, Dumitrescu Silaghi L, Dunca E-C, Bungau SG, Tit DM, Mosteanu D-E, Hodis R. Study of Chemical Pollutants and Ecological Reconstruction Methods in the Tismana I Quarry, Rovinari Basin, Romania. Sustainability. 2022; 14(12):7160. https://doi.org/10.3390/su14127160
Chicago/Turabian StyleMatei, Oana-Raluca, Luminița Dumitrescu Silaghi, Emilia-Cornelia Dunca, Simona Gabriela Bungau, Delia Mirela Tit, Danut-Eugeniu Mosteanu, and Ruxandra Hodis. 2022. "Study of Chemical Pollutants and Ecological Reconstruction Methods in the Tismana I Quarry, Rovinari Basin, Romania" Sustainability 14, no. 12: 7160. https://doi.org/10.3390/su14127160
APA StyleMatei, O.-R., Dumitrescu Silaghi, L., Dunca, E.-C., Bungau, S. G., Tit, D. M., Mosteanu, D.-E., & Hodis, R. (2022). Study of Chemical Pollutants and Ecological Reconstruction Methods in the Tismana I Quarry, Rovinari Basin, Romania. Sustainability, 14(12), 7160. https://doi.org/10.3390/su14127160