Article

Predicting Pedestrian Crashes in Texas’ Intersections and Midblock Segments

by
Natalia Zuniga-Garcia
1,
Kenneth A. Perrine
2 and
Kara M. Kockelman
1,*
1
Department of Civil, Architectural and Environmental Engineering, The University of Texas at Austin, Austin, TX 78712, USA
2
Center for Transportation Research, The University of Texas at Austin, Austin, TX 78712, USA
*
Author to whom correspondence should be addressed.
Sustainability 2022, 14(12), 7164; https://doi.org/10.3390/su14127164
Submission received: 14 March 2022 / Revised: 11 May 2022 / Accepted: 25 May 2022 / Published: 10 June 2022
(This article belongs to the Special Issue Vulnerable Road Users in Safe System Approach)

Abstract

:
This study analyzes pedestrian crash counts at more than one million intersections and midblock segments using Texas police reports over ten years. Developing large-scale micro-level analyses is challenging due to the lack of geographic information and characterization at a statewide scale. Therefore, key contributions include methods for obtaining many points and related variables across a vast network while controlling for traffic control variables (signalized intersections), highway design details, traffic attributes, and land use information across multiple sources. The analytical framework includes a method to estimate the intersection and midblock segments’ geometry and characteristics, data processing of historical pedestrian crashes and mapping to the estimated geometry, and the development of predictive models. A negative binomial model for crash counts across the state of Texas and within the city of Austin suggests that signalized intersections, arterial roads, more lanes, narrower or non-existent medians, and wider lanes coincide with higher crash rates per vehicle-mile traveled (VMT) and per walk-mile traveled. The analysis suggests that daily VMT increases the likelihood of pedestrian crashes, and midblock segments are more vulnerable than intersections, where one standard deviation increase in VMT caused an increase in crashes at intersections and midblock sections of 52% and 187%, respectively. Furthermore, the number of intersection crashes in Austin is higher than in the rest of Texas, but the number of midblock crashes is lower. Analysis of the Austin area suggests that the central business district location is critical, with midblock crashes being more sensitive (240%) in this area than intersection (78%) crashes. Moreover, a significant inequity was found in the area: an increase of USD 41,000 in average household income leads to a reduction of 32% (intersections) and 39% (midblock) in pedestrian crash rates.

1. Introduction

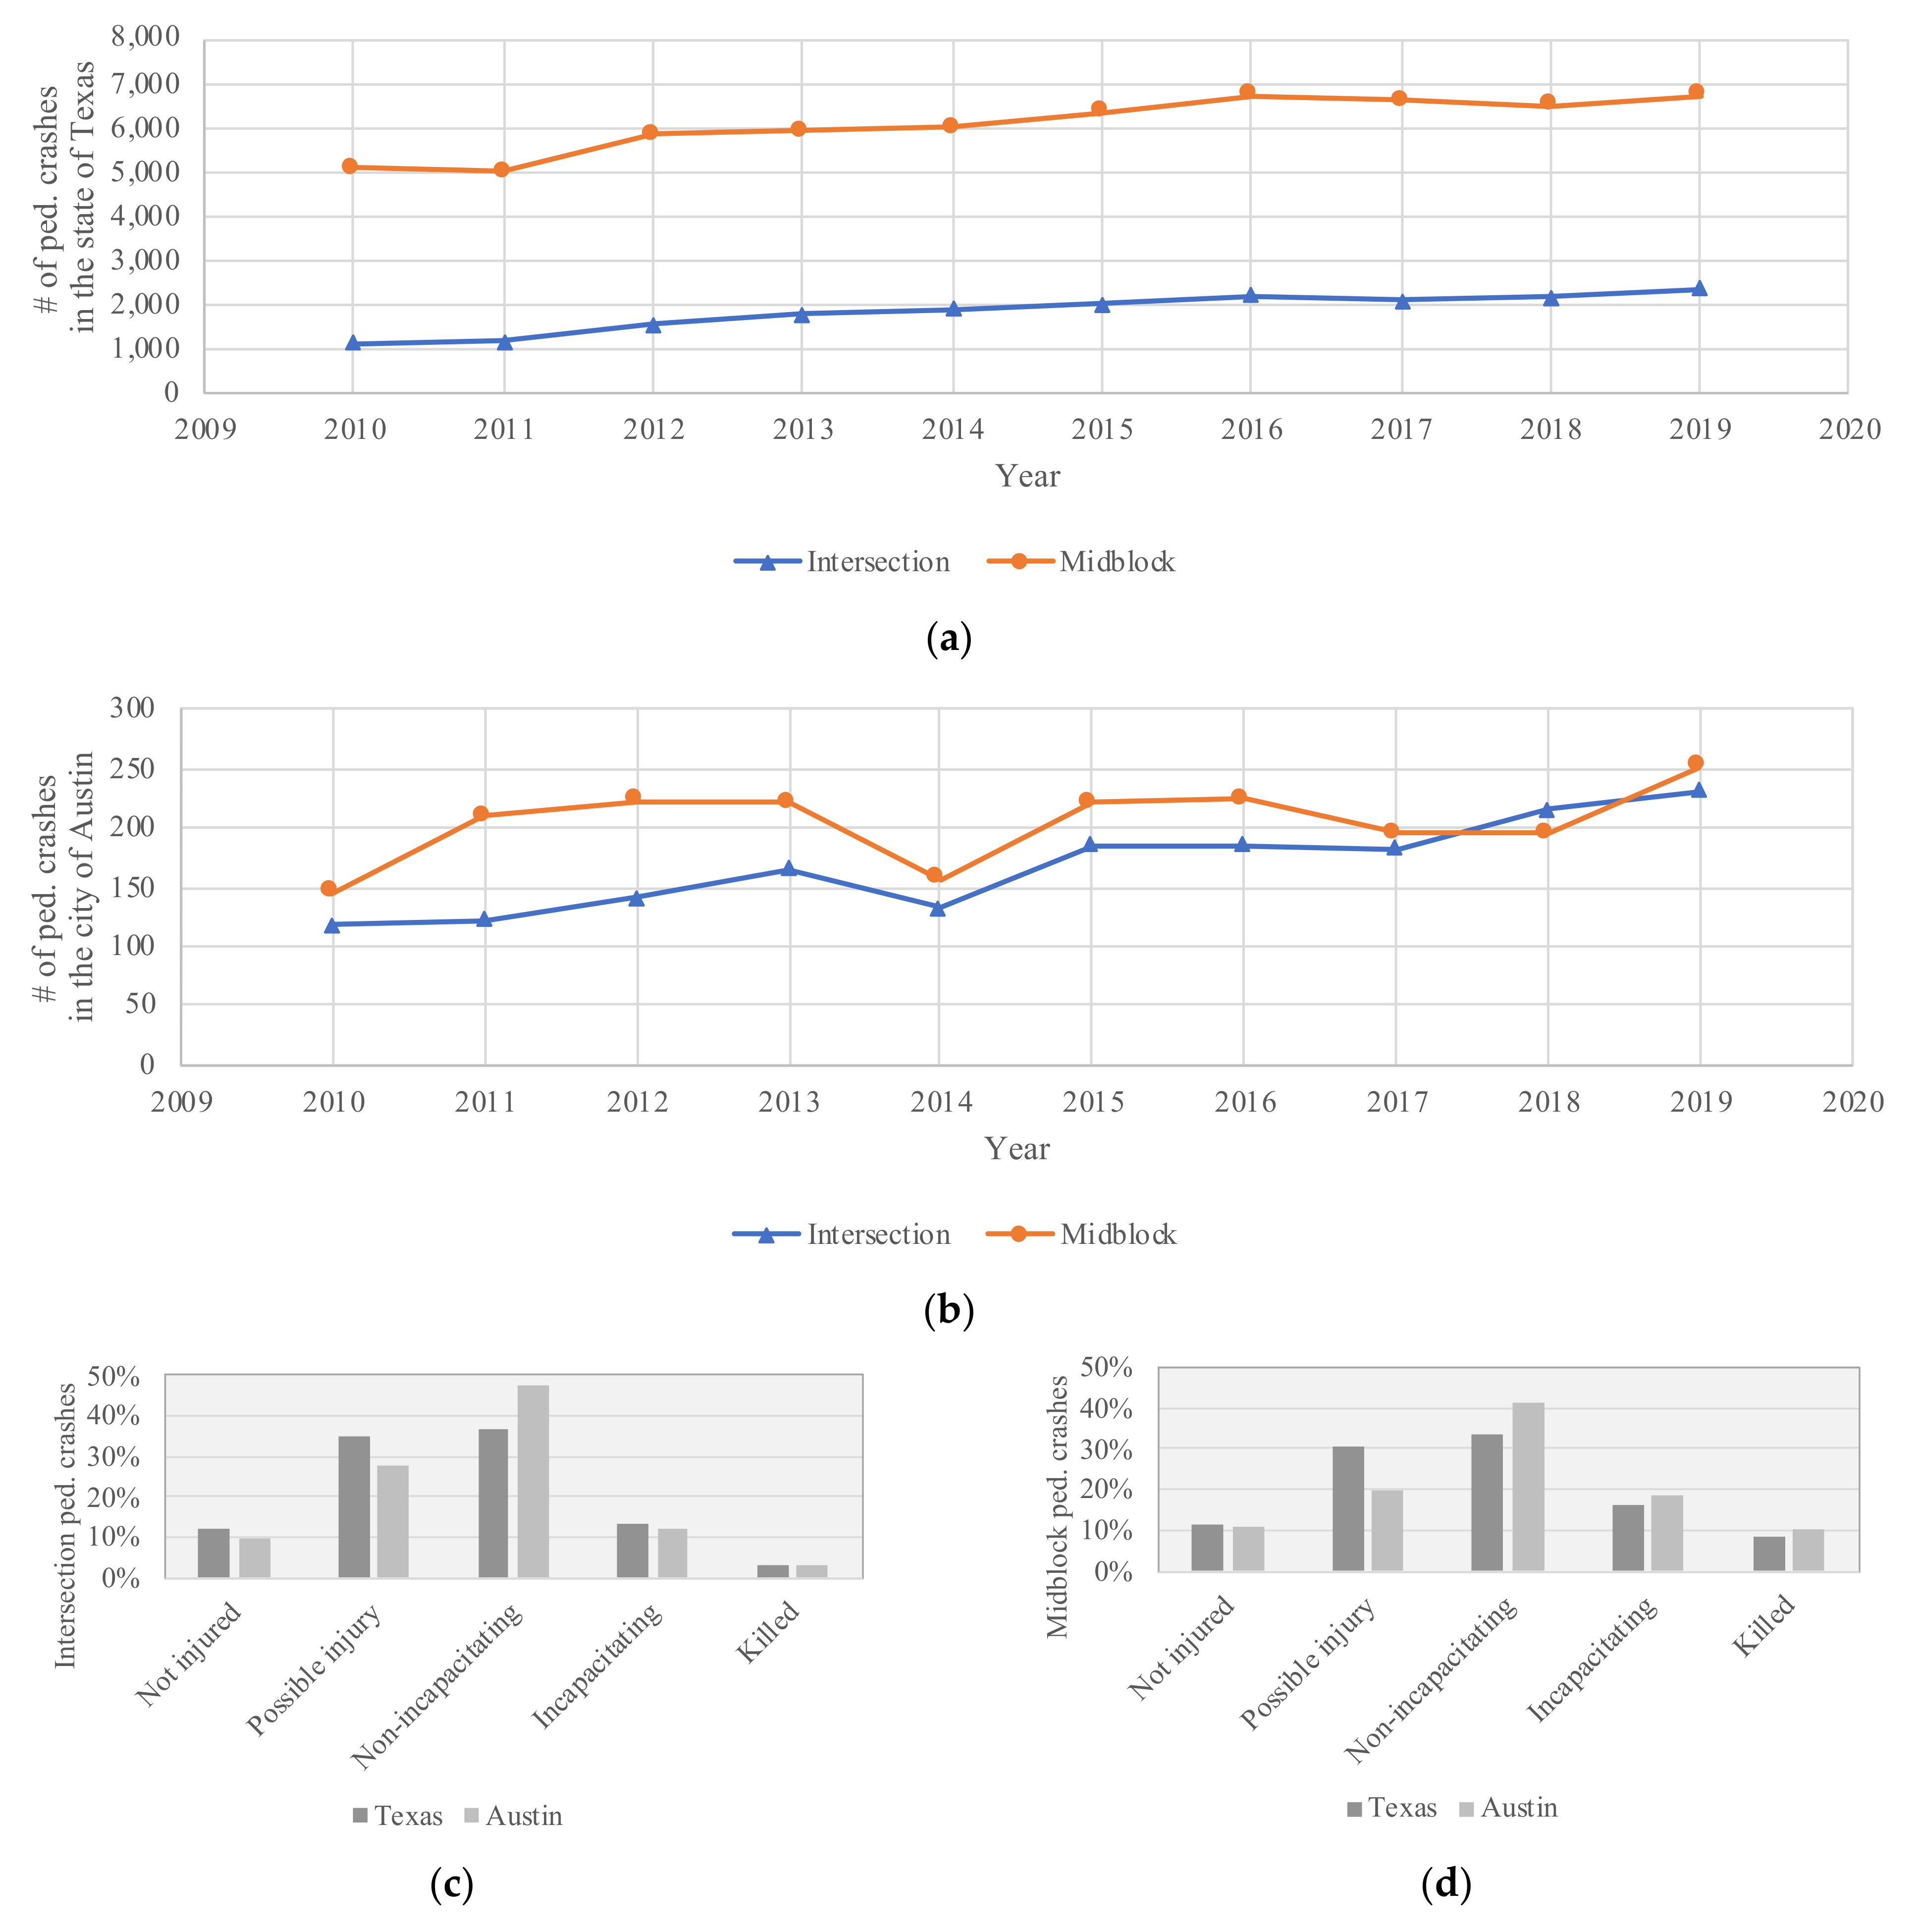
Despite being the oldest and most environmentally friendly form of transportation, walking has become increasingly risky in the U.S. While total walk-miles traveled (WMT) is estimated to have risen 16% [1] between 2009 and 2017, the number of (reported) pedestrian deaths rose 46% [2]. Texas averaged 1.14 pedestrian deaths per 100,000 residents in 2019 [2], which is 26% higher than the U.S. average of 0.90. Transportation planners and policymakers can reduce crash risks by implementing countermeasures based on benefit-cost analyses (BCAs). However, such analyses perform best with site-specific evaluations that are difficult to conduct at scale, due to a lack of detailed road feature variables. Between 2010 and 2020, the number of intersection crashes doubled in both Texas and the city of Austin, while midblock segment crashes rose 30% and 75%, respectively (Figure 1). Figure 1 shows how midblock pedestrian fatalities are more prevalent than those at intersections (where vehicle speeds are often lower, and pedestrians are more expected), at a rate of more than three to one.
Most past pedestrian safety studies used macro-level information, with data aggregated at traffic analysis zones (TAZs) [3], census tracts [4], census blocks groups [5], and zip codes [6], while studies at point level are more limited. In the past, a key limitation of intersection-safety studies is the sample size, due to a lack of information across wide networks. Xie et al. [7] used a Bayesian measurement error model with 262 signalized intersections in Hong Kong and found that the number of crossing pedestrians and passing vehicles, the presence of curb parking, and the presence of shops were associated with higher pedestrian crash counts, while the presence of playgrounds came with lower counts. Pulugurtha and Sambhara [8] used 176 randomly selected signalized intersections in Charlotte, North Carolina, to understand the factors affecting pedestrian crash counts using a negative binomial (NB) count model with different buffer widths (0.25-mile, 0.5-mile, and 1-mile) to extract data at intersection levels. They found that using a 0.5-mile-wide buffer to extract demographic, socio-economic, and land use characteristics would yield better estimates for low pedestrian activity signalized intersections, and a 1-mile-wide buffer would yield better estimates in cases of high pedestrian activity signalized intersections. Unfortunately, estimation of exposure variables, such as site-level/highly local WMT, is challenging since pedestrian volumes are rarely available (unlike annualized vehicle counts). Studies have relied on surrogate measures, such as the presence of schools and businesses, car ownership, pavement condition, sidewalk width, bus ridership, intersection control type, and presence of sidewalk barriers, to develop analyses, as seen in Lee et al. [9].
Midblock level analyses are more common in past research since midblock crashes tend to be more severe and more frequent, and most transportation departments maintain corridor design variables. Kwayu et al. [10] analyzed two years of crash information from Michigan and found that the average midblock pedestrian crash took place while pedestrians were crossing 130 feet from the nearest intersection/crosswalk. Key predictors of more pedestrian deaths in these settings were a lack of lighting during a nighttime crash, crashes involving an older pedestrian, and crashes along corridors that carry higher traffic volumes. Diogenes and Lindau [11] developed a Poisson regression using 21 midblock crosswalks and found that pedestrian crash counts rise with the presence of busways and bus stops, road widths, more traffic lanes, and higher volumes of pedestrians and vehicles. Rahman et al. [12] and Zhao et al. [13] used Texas pedestrian crashes summarized in 700,000+ midblock segments using Texas roadway inventory geometry. However, the authors did not divide the crashes into midblock and intersections, and instead combined all of them at a segment level. Analyses at both intersections and midblock segments for the same locations are limited and tend to focus on small areas [14] or are based on comparisons of crash characteristics [15]. Table 1 summarizes previous research in the field and provides a description of the geometric aggregation used in the studies. As described previously, the use of large samples is often limited due to the lack of information at the network level (e.g., at the state level). Therefore, the contribution of this research is relevant to the field because it provides analysis across 600,000+ intersections and 500,000+ midblock segments comprising the entire network of the state of Texas. This geometry preserves roadway inventory characteristics, such as traffic control variables (signalized intersections), highway design details, traffic attributes, and land use information. To the authors’ knowledge, no published work has yet developed crash count models for both intersections and midblock segments across thousands of locations.
Figure 1. Description of pedestrian crashes at intersections and midblock [16]. (a) Number of pedestrian crashes in the state Texas; (b) Number of pedestrian crashes in the city of Austin; (c) Intersection crashes severity levels; (d) Midblock crashes severity levels.
Sustainability 14 07164 g001
The main goal of this research is to develop a large-scale micro-level analysis of pedestrian crashes at intersections and midblock segments using historical pedestrian crash information from police reports in Texas. To this end, a three-pronged analytical framework is developed, including:
  • A geometry estimation step where data from multiple sources are used to estimate the geometric description and characteristics, such as traffic control variables (signalized intersections), highway design details, traffic attributes, and land use information of intersections and uniform roadway segments in the state of Texas.
  • A data processing step where pedestrian crash counts are obtained from over ten years of Texas police reports. The geographic location and crash report information are used to classify them as midblock or intersection crashes and to map them to the estimated geometry.
  • A modeling step where crash counts are used to develop predictive models at both intersection and roadway segment levels, which allows micro-level estimates to be used in studies, such as BCAs, at a large scale. Information from multiple sources is used to obtain a wide variety of variables for the model, including the use of WMT estimated at the state-wide level.
On the methodological side, the contributions of this work include (i) a method to estimate intersection and midblock segment geometries with road-specific attributes that can be used to understand crashes at different locations. (ii) The estimated geometry for intersections and midblock segments and their respective characteristics for the state of Texas are made available online to support other studies in the area. Users can access the dataset at https://github.com/ut-ctr-nmc/peds-midblocks-intersections (accessed on 1 May 2022). (iii) The developed geometries are used along with historical pedestrian crash count data from police reports to develop predictive models at intersection and midblock segment levels. Results are used to understand the factors associated with intersection and midblock crashes. A specific case study of the city of Austin is also estimated to understand local, affecting factors.

2. Data Description

2.1. Crash Count Data

The Texas Crash Records Inventory System is called CRIS [16], and contains records from police crash reports across Texas’ 254 counties and 268,597 square miles. Crash variables include time and location, persons and vehicles involved, injury severities, and road conditions. Many crashes are never reported to police or are not flagged for CRIS inclusion. These are typically proper-damage-only or no-injury crashes, but drivers and pedestrians will leave the scene for other reasons as well. Police officers who deem a reported crash to be worth less than the USD 1000 minimum crash cost threshold (for recording purposes) often do not record the crash formally.
From January of 2010 through December of 2019, 5.63 million crash incidents were recorded in the TxDOT CRIS database. A total of 78,498 crashes involving a pedestrian (including those caused or contributed to by a pedestrian, such as a driver swerving into a tree to avoid a pedestrian) are analyzed here. These are 1.40% of all reported and then recorded crashes.

2.2. Road Inventory Data

The TxDOT Roadway Inventory database was used to obtain road-specific attributes [17]. The database is available in GIS shapefile and tabular format. Both on-system (under the jurisdiction of TxDOT) and off-system roads (not under TxDOT jurisdiction) are included in the database. The centerline miles show the mileage of a segment, regardless of the number of lanes, while the lane miles include the mileage of all lanes. Important road attributes include highway design and traffic characteristics, such as daily vehicle miles traveled (DVMT), annual average daily traffic (AADT), percentage of truck, shoulder and median types and width, number of lanes, and speed limit.

2.3. Other Data Sources

Other data sources include school, hospital, and transit stops, such as school locations from the Texas Education Agency, hospital locations from the Homeland Infrastructure Foundation, and transit stop locations from Capital Metro Transit Agency. Capital Area Metropolitan Planning Organization (CAMPO) TAZ data were used for population and employment density for household income for the city of Austin. The WMT data are obtained at the individual respondent level, via the 2017 National Household Travel Survey (NHTS) and modeled as a function of respondent-level demographics and local land-use variables (such as population and job density of the respondent’s home census tract), and then scaled up to Public Use Microdata Area demographics, based on methods found in Rahman et al. [12].

3. Geometry Estimation

To facilitate the analysis of pedestrian-related crashes, it is necessary to spatially model crash locations with respect to known roadways, intersections, and traffic signals. This allows for the analysis of crash-prone “hotspots” tied to intersections and roadway segments. This section provides a description of the methodology that was employed to obtain the geometric description and characteristics of the roadway segments and intersections used in this study. Further explanation of the methods and code examples are provided on GitHub: https://github.com/ut-ctr-nmc/ped-crash-techvol/blob/master/doc/intersections.md#attempt-3-using-openstreetmap (accessed on 1 May 2022).

3.1. Midblock Segments and Intersections

To support research analysis efforts, an underlying representation of roadway segments is prepared, and pedestrian-related crashes nearest to these segments are then associated with them. A geographic database of road segments with “multi-line string” geometry found in the TxDOT Roadway Inventory serves as the starting representation for all roadways in Texas. Each of these come labeled with street name, physical roadway characteristics, such as functional class and lane count, estimated daily traffic volume, and maintenance information. In that inventory, each roadway consists of one or more segments. These segments are generally bidirectional except for those that represent one-way streets and divided highways. A challenge in using the TxDOT Roadway Inventory is that individual roadway segments may be extremely short—a minimum of 5 feet—to represent a high rate of changes in inventory values along a roadway, or extremely long—up to 44 miles—for roadways that see few changes. Project activities benefit from the use of fairly consistently spaced segments, necessitating a remapping effort to create derived datasets of mostly uniform segments.
Uniform segments of 1-mile length are selected as an appropriate length for the state-wide analysis. Selecting a shorter length would divide the network into a large number of segments, with multiple segments containing zero crashes. This would affect the performance of the models, since a large number of segments with zero crashes would create a higher unbalanced sample. For the city-level analysis, 0.1-mile segments are used to provide a more detailed analysis of the area. In each set, key criteria of the underlying segments that overlap the most from the TxDOT Roadway Inventory are mapped to these new segments. To create these, an algorithm divides up roadways into a new set of segments targeted at length L. Since these characteristics vary from segment to segment, slicing multiple “original” segments is avoided to preserve the original characteristics at maximum. Therefore, a tolerance level of 25% is established, meaning that some segments are allowed to be ± 0.25   L following these rules:
  • If the original roadway is less than 1.25 L miles, then the derived roadway is represented with one segment of the same length.
  • If the original roadway is less than 2 (1.25 L) miles, then the derived roadway is represented with two segments of equal length.
  • Otherwise, the derived roadway is represented as starting and ending with segments no less than 0.75 L miles on either end, with L-mile segments in-between.
Mapping locations of crashes to nearby intersections is also important for this research to distinguish from midblock crashes. Unfortunately, the TxDOT Roadway Inventory does not offer explicit intersection point geometry. Although one can analyze the Roadway Inventory to evaluate where roadway segments intersect, it is impossible to understand where bridges exist (especially near expressway interchanges), leading to numerous false-positive intersections, especially around expressways.
OpenStreetMap [18] was leveraged to positively map intersection and signal locations and apply them to appropriate locations in the TxDOT Roadway Inventory geometry. In terms of traffic control, the intersection geometry estimation accounts for signalized intersections versus non-signalized ones. Still, it does not include stops or yield sign details as it is challenging to obtain this information at the state level from OpenStreetMap. To estimate intersections, queries to a local instance of the Overpass API [19] were created among approx. 30 × 30-mile tiles to return all candidate intersection seed points throughout Texas (Figure 2 provides a flowchart of the methodology). The initial set came with caveats: many OpenStreetMap intersections on divided roads of all types exist for each direction. In contrast, the intersections needed for the TxDOT Roadway Inventory would be needed per roadway. Other criteria were sought in positively identifying this first set of candidate intersections:
  • It has a signal (tag “highway”: “traffic_signals”). This will also catch signals for midblock crossings. Or;
  • It is met by more than one motorway that has a different type and name combination.
  • Nodes serviced only by motorways and motorway links are labeled as a “junction.”.
  • Nodes that are joined by the ends of just two OpenStreetMap roadways are not counted, as they are likely a continuous stretch of roadway.
Next, to combine together candidate intersections that were closely positioned next to each other, the DBScan clustering algorithm [20] available in the PostGIS/PostgreSQL database [21] was leveraged to combine intersections less than 250 feet in distance from each other. Finally, roadway segments in the 1-mile and 0.1-mile uniform segment sets were associated with the clustered candidate intersection locations through a nearest-proximity search, allowing for candidate intersections to be associated if they are less than 130 feet from the roadway geometry.
This approximation is in support of efforts to perform initial rounds of this research. It had been found that this nearest-neighbor method of matching intersections to geometry by proximity alone still results in erroneous matches, especially around closely positioned urban expressway on- and off-ramps. However, because this research has emphasized urban streets and corridors that do not lie along expressways, the success rate for the nearest-neighbor matching approach has empirically been sufficient. It is anticipated in future work that a map-matching strategy [22] can map valid pathways through the OpenStreetMap roadway network to underlying TxDOT Roadway Inventory geometry, allowing intersections to be more successfully tied with only the roadway segments that are truly connected with those intersections.

3.2. Estimated Geometries: Intersections and Segments

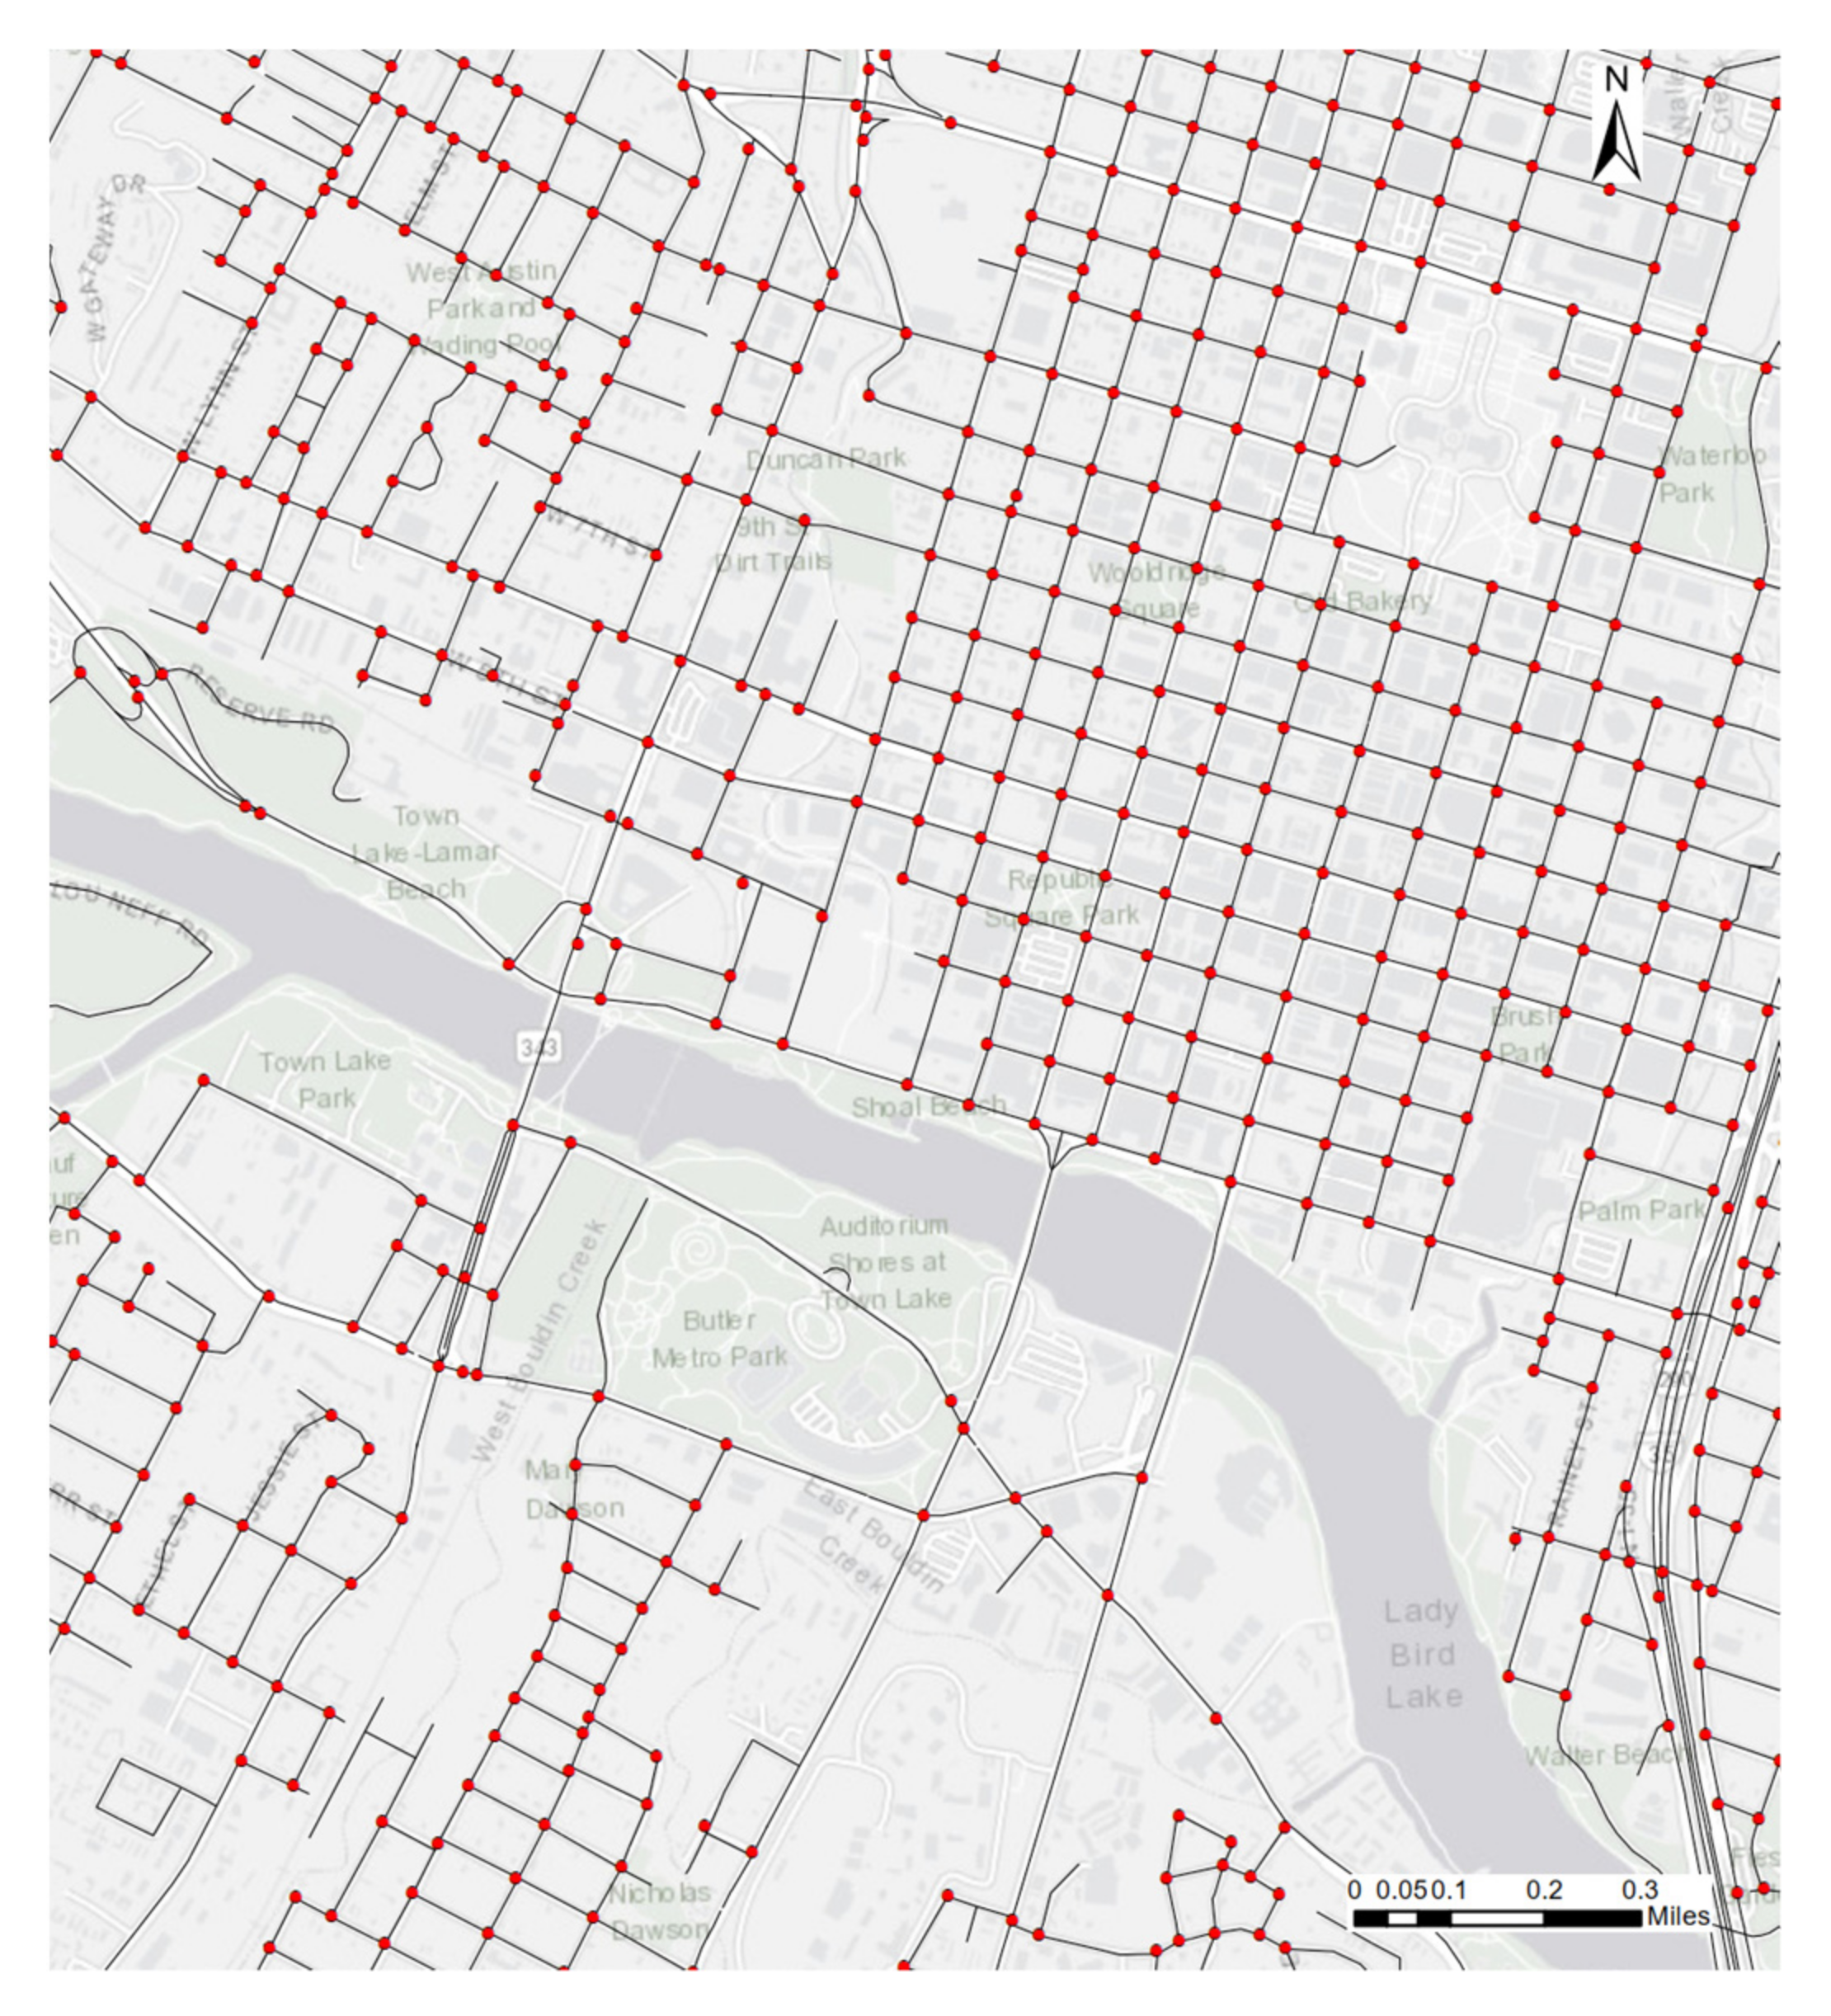
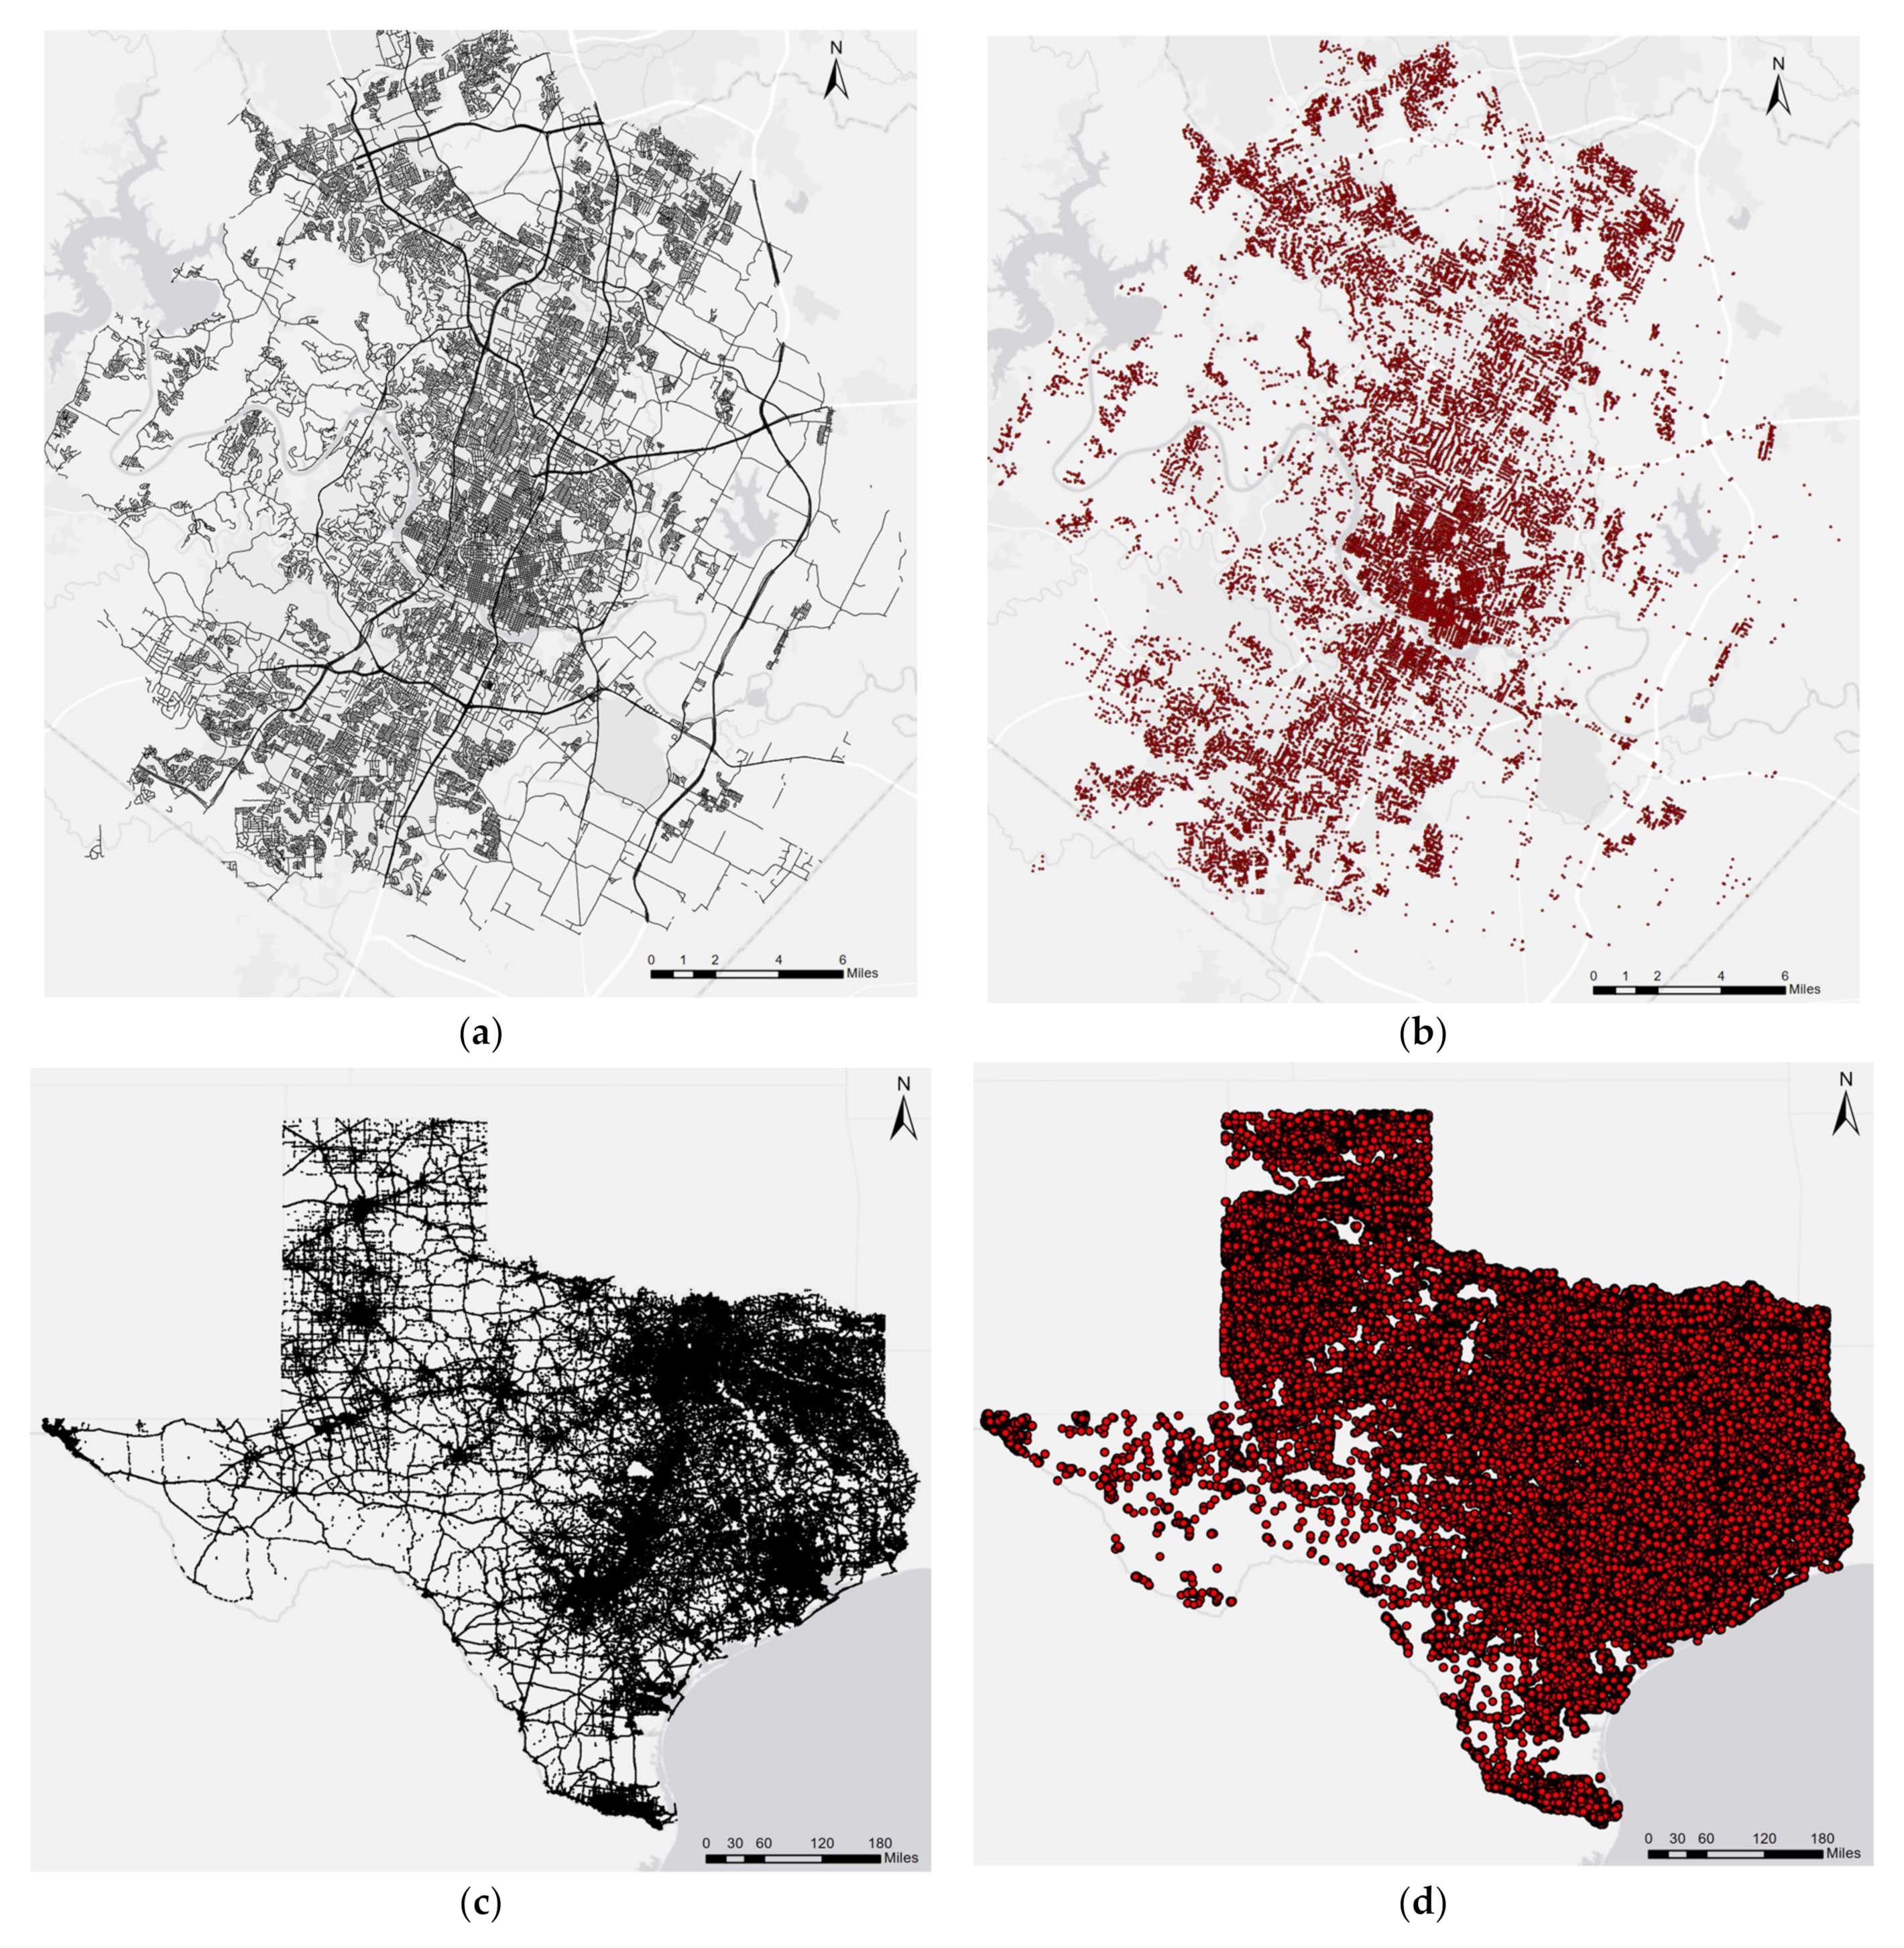
An example of the estimated geometries is shown in Figure 3. The 0.1-mile roadway segments are shown along with the intersections in a close-up of the city of Austin downtown area. The geometry matches the roadway map. Figure 4 shows the total roadway segments and intersections for the city of Austin and for the entire state. A total of 700 thousand (~1-mile uniform) segments drawn from 575 thousand segments are used to describe the state of Texas, while the city of Austin consists of 20 thousand (0.1-mile uniform) segments and 41 thousand intersections.

3.3. Crash Location and Classification

After the geometry estimation, pedestrian crashes are mapped to intersections or midblock segments. Two criteria are considered in determining whether a crash is “midblock.” First, the original police report contains a field that indicates whether the officer categorizes the crash as happening at an intersection. Unfortunately, it is sometimes unclear as to whether that intersection is the center “box” area where public streets typically cross, a right turn yield link, or a roundabout. Second, the geographic crash location analysis against a map may show that the crash occurs far enough away from an intersection that it may be considered a midblock crash.
A detailed description of the final geometries is summarized in Table 2 and Table 3, showing summary statistics of infrastructure characteristics as well as pedestrian crash counts based on the crash type and map matching process.

4. Crash Count Modeling

An NB count model was used for pedestrian crash counts. The expected number of pedestrian crash counts E Y i along the i th intersection or midblock segment is expressed as follows:
E Y i = exp β 0   + k x i k β k + ε i
where:
  • Y i represents the total pedestrian count at intersection i with:
    mean E Y i = μ i
    variance Var Y i = μ i + ρ μ i 2 , where ρ is the dispersion parameter. As the dispersion parameter becomes smaller and smaller, the variance converges to the same value as the mean, and the negative binomial turns into a Poisson distribution. Therefore, ρ = 0 for a Poisson model.
  • β k is the k th covariate (e.g., speed limit, number of lanes, lane width, among others).
  • ε i is a random error term which follows a one-parameter Gamma distribution ε i ~ Gamma γ ,   γ with m e a n = 1 , where γ is the scale parameter.
Additionally, a sensitivity analysis was applied to the NB estimates to understand the covariates’ effects. Specifically, for each covariate, one standard deviation or binary change is applied. The modified variables are passed to the model to calculate the prediction. Then, the difference between the mean of original prediction and permuted prediction is calculated to represent the contribution of that covariate. Because of its appropriateness and suitable fit for modeling count data, this methodology has been applied in other research, including pedestrian crash occurrences at the segment level [12] and e-scooter count models [23].

5. Results and Discussion

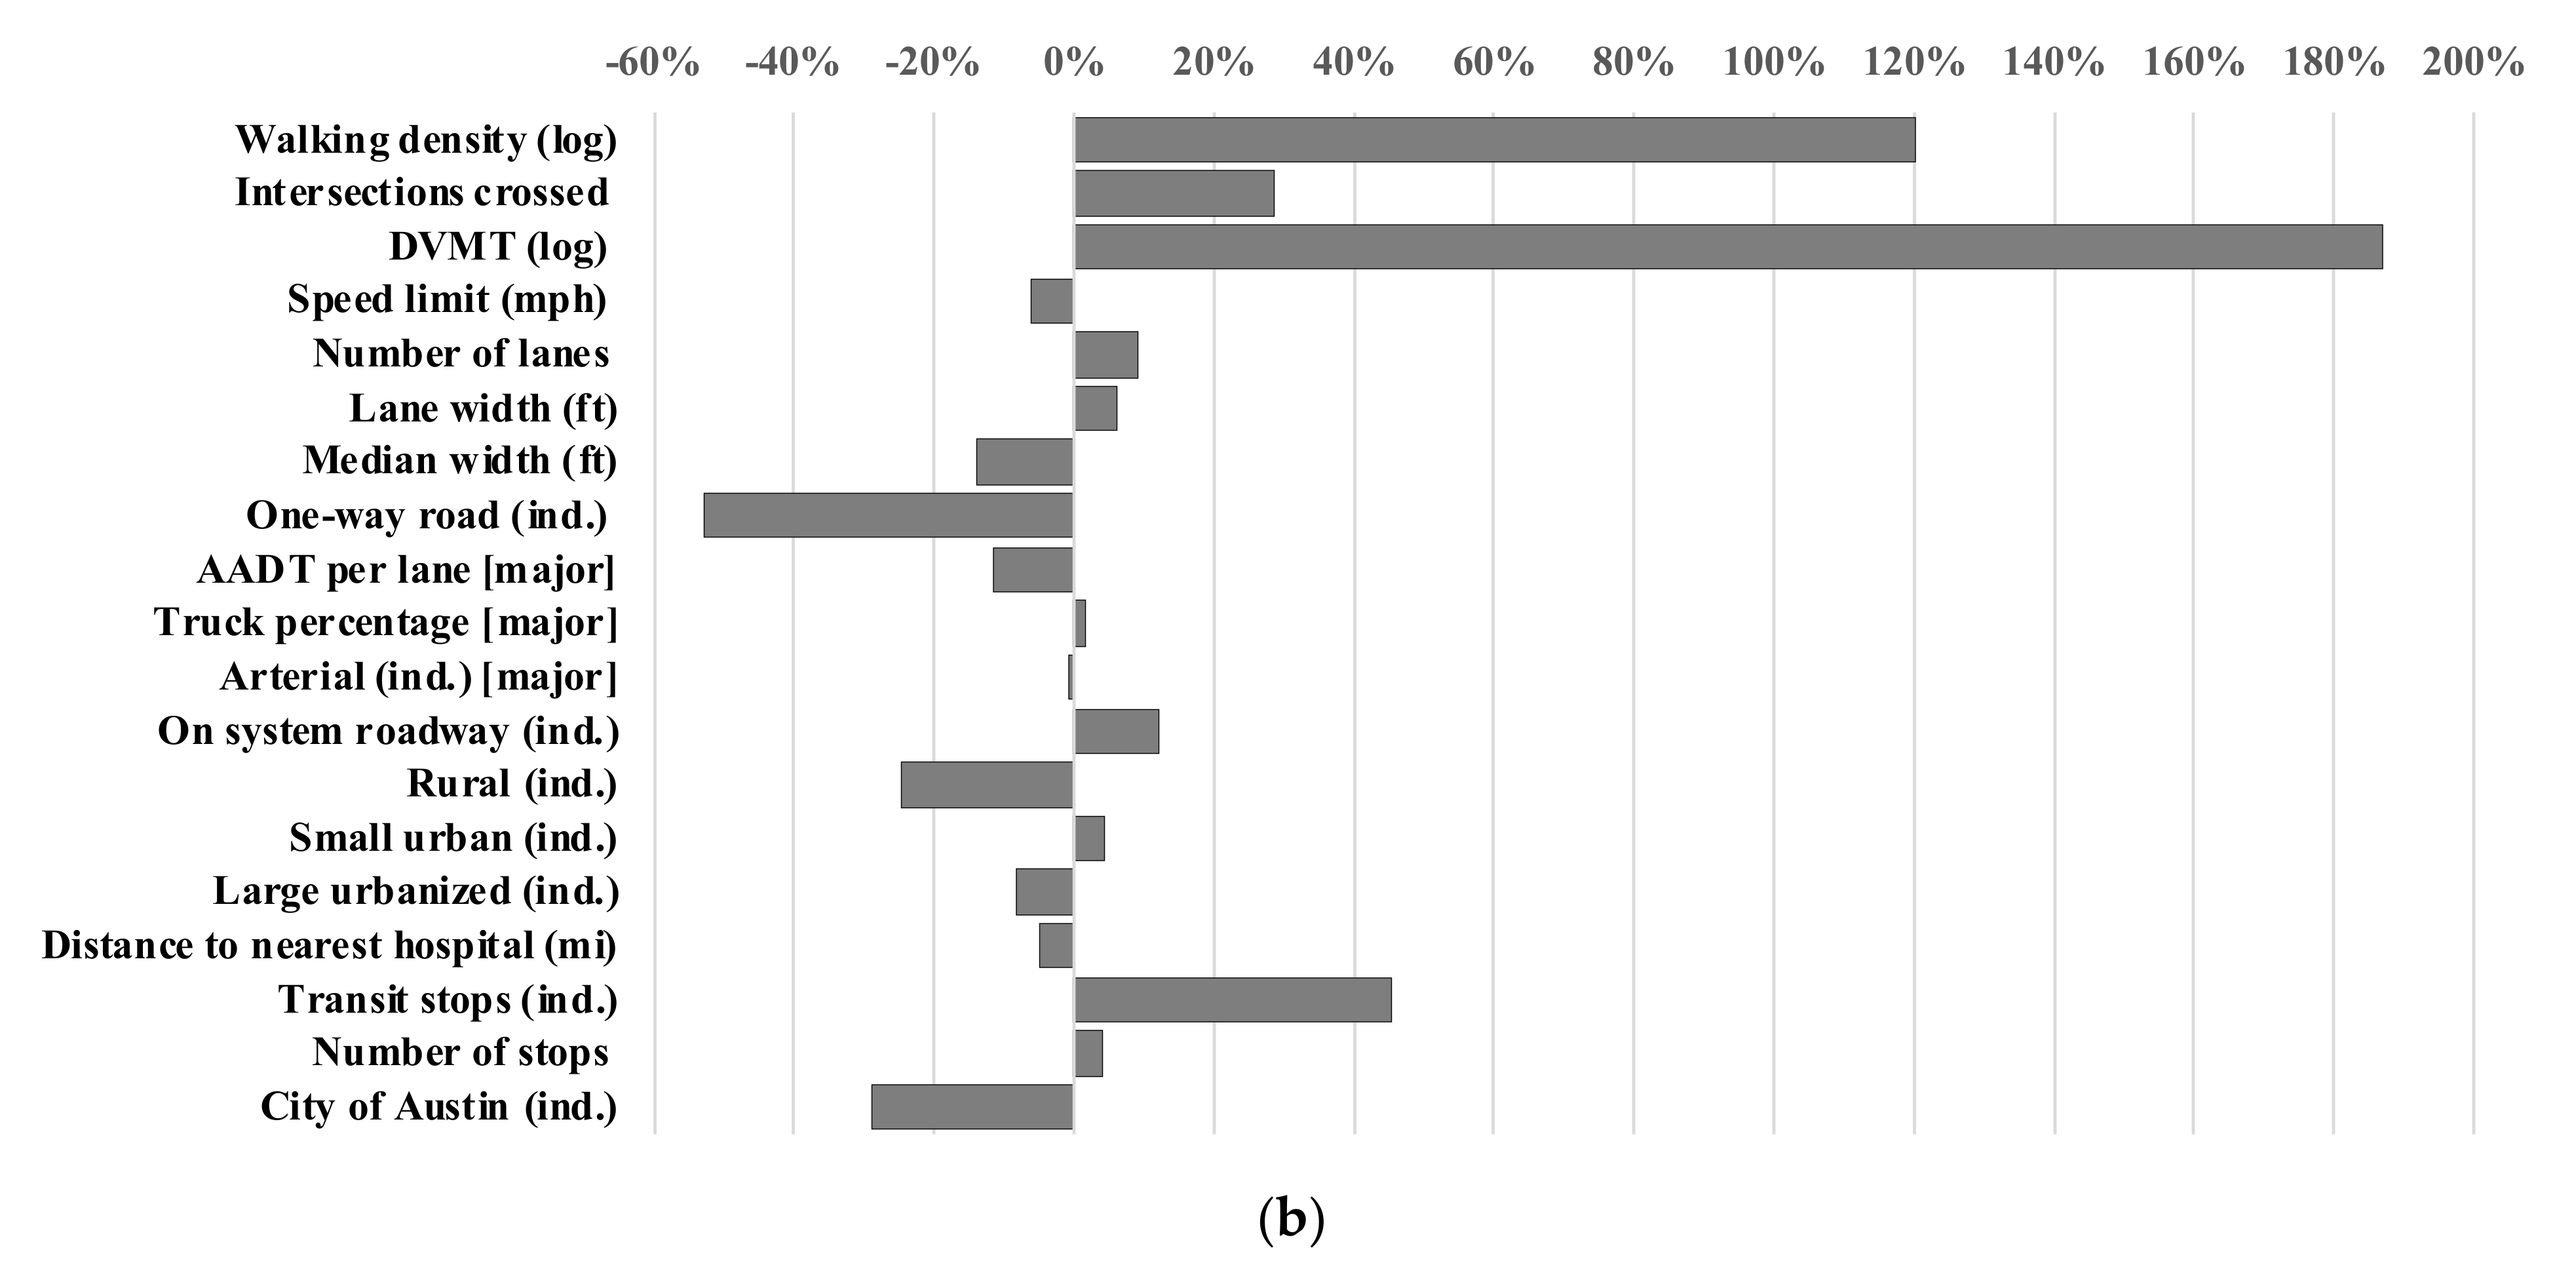
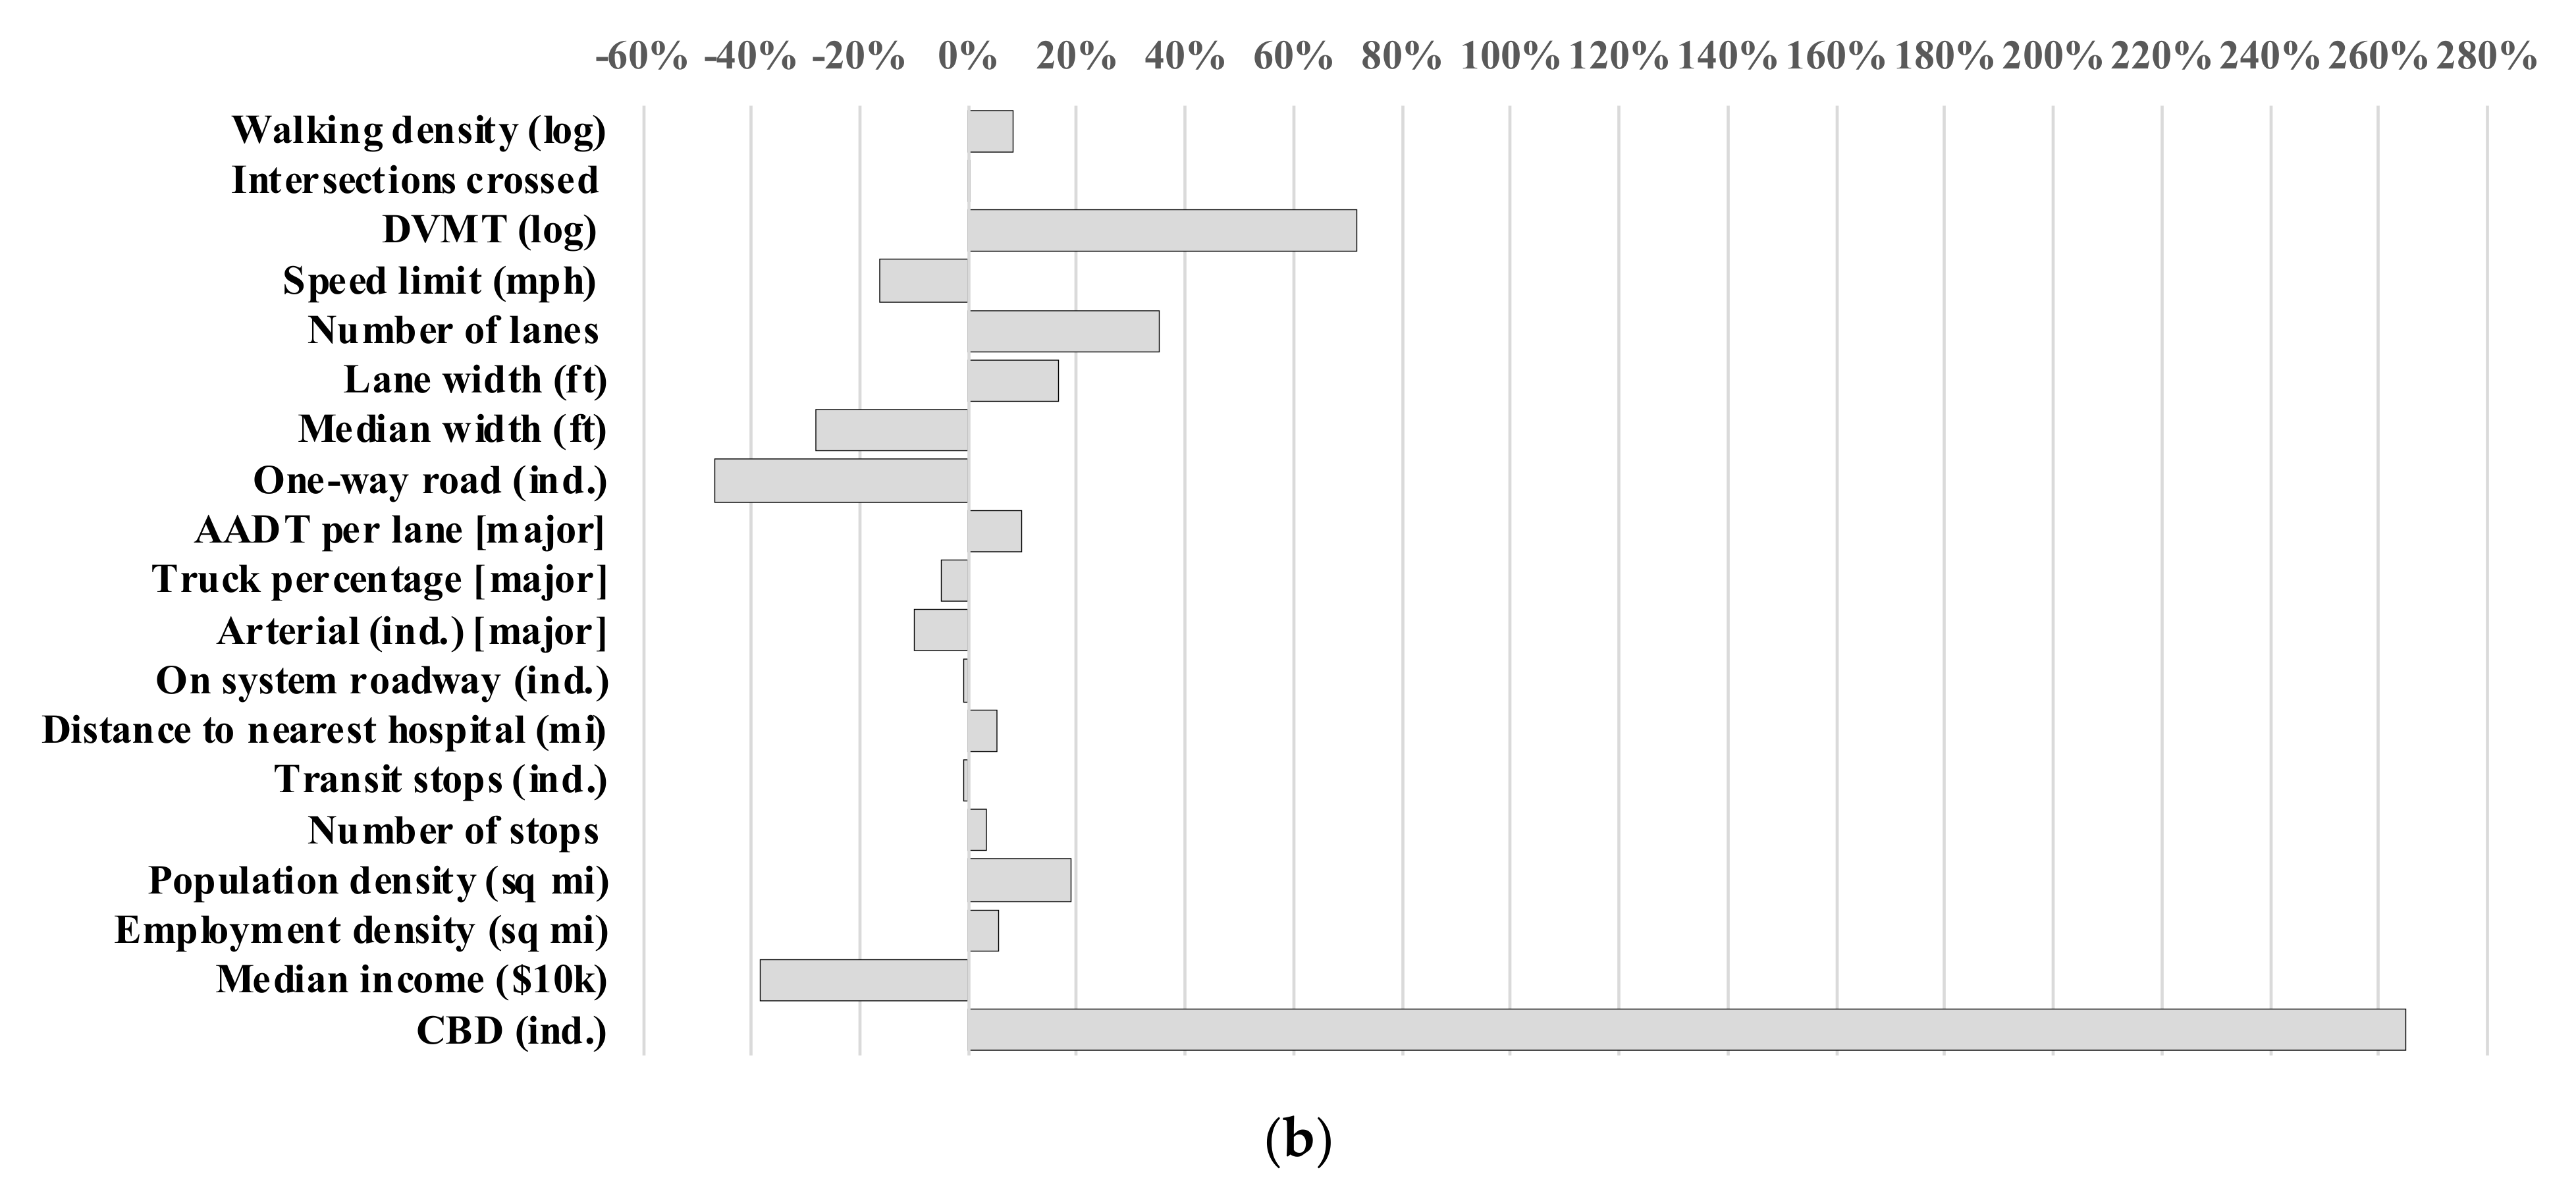
The results from the NB model are summarized in Table 4 (Texas) and Table 5 (Austin). Two models are estimated for each location; an intersection model and midblock-level model are described, along with sensitivity analysis summarized in Figure 5 and Figure 6.
The Texas model (Table 4) shows a positive correlation between the walking density (WMT/area) and the number of pedestrian crashes across intersections and midblock-segment models, likely due to increased exposure levels. However, previous research also found that the relationship between crash exposure and crash rates is non-linear. It has rates falling off dramatically as walk levels rise, presumably due to drivers expecting more pedestrians in high-WMT zones and safer pedestrian environments that encourage walking [24].
The signalized intersection indicator in the intersection model is found to be among the most significant variables in the model. The sensitivity analysis indicates that the number of pedestrian crashes is doubled with signalized intersections when compared with unsignalized intersections, with everything else remaining constant. Although signals are relatively safer than other control types for high pedestrian activity areas, higher usage increases the risk of accidents, as found in previous research [7,9]. Similarly, the number of approaches (intersections) and the number of intersections crossed by the roadway segment show a positive, significant effect on the rate of pedestrian crashes. Specifically, one standard deviation of the number of approaches (0.67) leads to an increase of 31% in pedestrian crashes, while the standard deviation of 2.8 intersections crossed increases the crash rate by 29%. Intersection-level studies also found that the number of approaches shows a positive effect on pedestrian crash counts [8] and that four-leg intersections have a higher frequency of accidents than three-leg intersections [25].
Among the highway design variables, the estimates indicate that higher DVMT significantly increases the number of pedestrian crashes, which is a consistent finding among studies of this type, as seen in [12,13]. Interestingly, the effect of DVMT is more critical for the midblock segments than for the intersection model, as suggested by the sensitivity analysis, where one standard deviation increase caused 52% more crashes at intersections and 187% more crashes at midblock sections. Other variables, such as the number of lanes and lane width, also contribute to higher pedestrian crash rates. Higher posted speed limits and longer median widths, in contrast, tend to coincide with a reduction in crash rates. Roadways with a high speed limit are related to higher risk, and pedestrians tend to avoid these areas as there is limited pedestrian infrastructure [12]. However, research findings indicate that, although the crash frequency is lower, the severity is significantly higher in areas with high speed [12,13,26].
One-way roads are related to fewer crashes at midblock segments, while this variable was not significant for intersections at a 95% confidence level. The effect on midblock crashes is likely due to the reduced exposure on segments (less distance to cross). The intersection model suggests that variables from both major and minor approaches have a similar effect. The minor approach has a slightly lesser (but still significant) impact, except for the number of lanes, which shows no significant effect. However, the one-way road (minor) indicator variable showed statistical significance for the model and as found for midblock segments, the effect is negative, suggesting that one-way roads led to fewer pedestrian crashes at intersections as well.
Traffic attributes, such as AADT and the percentage of trucks, are also highly related to an increase in the crash rate at intersections. The roadway functional class is compared with local and collector roads using the indicator variables for arterials (freeways and highways are not included in the model). The results indicate a positive and significant effect, where arterial roads tend to have a higher number of pedestrian crashes than local and collector roads for both intersections and midblock segments. This effect is consistent in previous research where arterials are categorized as a health problem due to high pedestrian crash frequency, excessive noise and pollution [27]. TxDOT-maintained roads (“on-system roads”) show a negative effect, suggesting that the number of pedestrian crashes is lower on these roads compared to other roadways. However, this finding contrasts a previous research analysis of pedestrian crashes that uses Texas Roadway Inventory geometry [12]. This may be because this study developed an analysis at a smaller scale with separations between intersection crashes and midblock crashes, while previous studies aggregated crashes and analyzed only segment-level variables.
Population is accounted for in the land use variable where urbanized areas (having a population of 50,000–200,000) are compared to rural, small urban, and large urbanized areas (refer to Table 2 for more details). Compared to averaged-sized urbanized areas, large urbanized areas (population greater than 200,000) show a positive coefficient, suggesting a positive effect. In contrast, small urban areas show a negative effect, suggesting that the rate of crashes is lower in these areas. This effect is consistent with expectations, since denser areas have a higher number of pedestrians, and the exposure is higher due to the presence of more vehicles. The distance to the nearest hospital is also analyzed; the coefficient is found to be negative and significant at a confidence level of 95%. This suggests that the number of crashes is lower in areas with hospitals located at a close distance, which is comparable to the finding of higher crashes in denser areas. The sensitivity analysis indicates that one standard deviation of distance (approximately 5 miles) leads to a decrease of 11% (intersections) and 5% (midblock segments) in pedestrian crashes. However, it is important to mention that although the number of crashes is low, the distance to the hospital can be critical for response time and prompt injury treatment.
The presence of public transportation is an indirect measure of pedestrian exposure. In this study, transit information is included in the model through two variables. The first one is an indicator variable of the presence of transit within a buffer of 0.25 miles from the geometry centroid, and the second one is the count of transit stops in this area. As expected, both variables indicate that the number of pedestrian crashes is higher in the presence of transit, with a significant level of 95%. The sensitivity analysis suggests that the crash rate is about 50% higher in areas with transit stops in comparison to areas with the same characteristics without transit stops.
The Texas model includes a variable to indicate the location of the city of Austin and compare crashes with the rest of the state. Interestingly, the number of intersection crashes in Austin is higher than in the rest of Texas, but the number of midblock crashes is lower. Similarly, Figure 1 suggests that the number of intersection crashes in Austin is comparable to the number of midblock crashes, mainly in recent years (after 2017).
The Austin-specific model in Table 5 shows an intersection model that is less sensitive to walking density (WMT/area) and signalized intersections than the Texas model but still shows a significant value. It is likely that pedestrian crashes in non-signalized intersections are more frequent in this area compared to the state of Texas. The number of approaches also shows a positive coefficient. In terms of midblock segments, the number of intersections crossed is not significant, possibly due to the size of the segments. In this case, the segments are 0.1-mile long, and the number of intersections crossed is significantly lower than the case where 1-mile segments were used in the Texas model.
DVMT has a positive significant effect on the number of crashes in the city of Austin. However, the sensitivity analysis suggests that the effect is less than the results obtained from the Texas model. One standard deviation increase in DVMT led to a 40% (intersection) and 72% (midblock) increase in the number of pedestrian crashes. The effect of the speed limit is only significant for the midblock segments and not for the intersections model, and the sensitivity change is comparable to the rest of the state. The number of lanes also has a positive and significant coefficient. Variables, such as lane width, median width, and one-way roads, are not significant at a 95% confidence level for the intersections model (in both cases, major and minor approaches).
In terms of the traffic attributes, AADT is positive and significant for the intersection model (same as Texas). Still, the percentage of trucks is negative in both models (as opposed to the positive effect for intersections in Texas). This suggests that pedestrians in Austin are less likely to be involved in an accident at intersections with a high number of trucks compared to the rest of the state. The functional class indication for arterial roadways is not significant, and no conclusion can be obtained from this variable. In comparison to the Texas model, the city of Austin model also suggests that on-system roads have fewer crashes than other roadways. The distance to hospitals in the Austin model is not relevant, likely due to the small area selected for the model, where multiple hospitals are located across the city. The exposure variable for transit presence is significant (midblock) and suggests a positive correlation with the number of pedestrian crashes. However, the variables related to transit are not as sensitive in this model compared to the Texas model.
Land use variables, such as population density, employment density, and average household income were approximated using the CAMPO data at the TAZ level to analyze the effects on the city’s pedestrian crash rate. Population density has a positive and significant effect, as expected. One standard deviation increase (3.3 thousand individuals per square mile) led to a 15% (intersections) and 21% (midblock) increase in crash rates. The employment density, in contrast, does not have an effect on the intersections model. A significant finding suggests that areas with a higher average household income tend to present fewer pedestrian crashes. An increase of USD 41,000 in average household income led to a reduction of 32% (intersections) and 39% (midblock) in pedestrian crash rates. Finally, an indicator variable of the CBD in the city highlights the importance of this area, with midblock crashes being more sensitive (240%) in this area than intersection crashes (78%), but both models showing a relevant effect.
The models developed in this study provide a micro-level analysis framework that can be used in studies, such as BCAs. For example, the models can be used to provide an estimate for the number of crashes at specific intersections and midblock segments in future years, e.g., by projecting expected DVMT and WMT growth. The expected number of pedestrian crashes can then be used to compare the crashes that can be reduced by applying countermeasure treatments (such as pedestrian refuge islands, raised crosswalks, and leading pedestrian intervals) in each of the crash hot-spot locations. Economic analysis of the cost of the treatments and the reduced number of crashes can then inform BCAs for various uses.

6. Summary and Conclusions

In this research, historical pedestrian crash information from police reports in Texas is used to understand the factors associated with crash rates at intersection and midblock levels. Developing micro-level analysis is challenging due to the lack of geographic information and characterization at a statewide scale. Therefore, one of the main contributions of this study is the development of a methodology to spatially model crash locations with respect to known roadways, intersections, and traffic signals. Geometry estimations at intersection and midblock levels are obtained, and information from the roadway infrastructure inventory and other sources is assigned with the objective of characterizing such geometries. Information, such as traffic control (signalized intersections), highway design variables, traffic attributes, and land use from multiple sources, is combined along with the location of the crashes (separated between intersections and midblock crashes) to provide a comprehensive analysis of the roadway network in the state of Texas.
An NB model is used to identify major factors influencing pedestrian crashes at intersection and midblock levels. Models for the state of Texas are developed along with a case study of the city of Austin, one of the areas with the highest number of crashes in the state, to understand specific factors affecting the city’s crash rate. The main results suggest that signalized intersections present a higher pedestrian crash rate, DVMT increases the likelihood of pedestrian crashes, and midblock segments are more vulnerable, where one standard deviation increase causes an increase in crashes at intersections and midblock sections of 52% and 187%, respectively. Variables, such as the number of lanes and lane width, contribute to higher pedestrian crash rates, while higher posted speed limits and longer median widths tend to coincide with a reduced crash rate. Arterial roads are prone to have a higher number of pedestrian crashes than local and collector roads. Land use variables indicate that areas with a greater population tend to have more crashes. The analysis of the Austin area suggests that the CBD is critical for both models, with midblock crashes being more sensitive (240%) in this area than intersection (78%) crashes. Moreover, a significant inequity was found in the area: an increase of USD 41,000 in average household income leads to a reduction of 32% (intersections) and 39% (midblock) in pedestrian crash rates.
The pedestrian crash data used in this study, obtained from the TxDOT CRIS database, includes only crashes reported to and then reported by police officers, thus missing many of the less injurious and less costly crashes. Other limitations of this study include the approximate map-matching process used to obtain the geometry characteristics for both intersections and midblock segments, based on the TxDOT roadway inventory. However, the developed analysis contains detailed intersection and midblock segment information not used in prior research; to the best of the authors’ knowledge, the most complete set of intersections currently available at the state level is utilized for this type of analysis.

Author Contributions

The authors confirm contribution to the paper as follows: writing—original draft preparation: N.Z.-G., K.A.P.; conceptualization and design: K.M.K., N.Z.-G.; methodology: K.M.K., N.Z.-G.; data assembly and analysis: N.Z.-G., K.A.P.; writing—reviewing and editing: K.M.K., N.Z.-G., K.A.P. All authors have read and agreed to the published version of the manuscript.

Funding

This research was funded by TxDOT Research and Technology Innovation (RTI) Project 0-7048.

Informed Consent Statement

Not Applicable.

Data Availability Statement

The estimated geometry for intersections and midblock segments and their respective characteristics for the state of Texas are made available online to support other studies in the area. Users can access the dataset at https://github.com/ut-ctr-nmc/peds-midblocks-intersections (accessed on 1 July 2021).

Conflicts of Interest

The authors declare no conflict of interest.

References

  1. U.S. Department of Transportation. National Transportation Statistics: U.S. Passenger-Miles. 2019. Available online: https://rosap.ntl.bts.gov/gsearch?collection=dot:35533&type1=mods.title&fedora_terms1=National+Transportation+Statistics (accessed on 16 May 2021).
  2. GHSA. Pedestrian Traffic Fatalities by State, Spotlight in Highway Safety; GHSA: Thomaston, GA, USA, 2020. [Google Scholar]
  3. Siddiqui, C.; Abdel-Aty, M.; Choi, K. Macroscopic spatial analysis of pedestrian and bicycle crashes. Accid. Anal. Prev. 2012, 45, 382–391. [Google Scholar] [CrossRef] [PubMed]
  4. Wier, M.; Weintraub, J.; Humphreys, E.H.; Seto, E.; Bhatia, R. An area-level model of vehicle-pedestrian injury collisions with implications for land use and transportation planning. Accid. Anal. Prev. 2009, 41, 137–145. [Google Scholar] [CrossRef] [PubMed]
  5. Noland, R.B.; Klein, N.J.; Tulach, N.K. Do lower income areas have more pedestrian casualties? Accid. Anal. Prev. 2013, 59, 337–345. [Google Scholar] [CrossRef] [PubMed]
  6. Ukkusuri, S.; Miranda-Moreno, L.F.; Ramadurai, G.; Isa-Tavarez, J. The role of built environment on pedestrian crash frequency. Saf. Sci. First Int. Symp. Mine Saf. Sci. Eng. 2011, 50, 1141–1151. [Google Scholar] [CrossRef]
  7. Xie, S.Q.; Dong, N.; Wong, S.C.; Huang, H.; Xu, P. Bayesian approach to model pedestrian crashes at signalized intersections with measurement errors in exposure. Accid. Anal. Prev. 2018, 121, 285–294. [Google Scholar] [CrossRef] [PubMed]
  8. Pulugurtha, S.S.; Sambhara, V.R. Pedestrian crash estimation models for signalized intersections. Accid. Anal. Prev. 2011, 43, 439–446. [Google Scholar] [CrossRef] [PubMed]
  9. Lee, J.; Abdel-Aty, M.; Shah, I. Evaluation of surrogate measures for pedestrian trips at intersections and crash modeling. Accid. Anal. Prev. Road Saf. Data Consid. 2019, 130, 91–98. [Google Scholar] [CrossRef] [PubMed]
  10. Kwayu, K.M.; Kwigizile, V.; Oh, J.-S. Evaluation of pedestrian crossing-related crashes at undesignated midblock locations using structured crash data and report narratives. J. Transp. Saf. Secur. 2019, 14, 1–23. [Google Scholar] [CrossRef]
  11. Diogenes, M.C.; Lindau, L.A. Evaluation of pedestrian safety at midblock crossings, Porto Alegre, Brazil. Transp. Res. Rec. 2010, 2193, 37–43. [Google Scholar] [CrossRef] [Green Version]
  12. Rahman, M.; Kockelman, K.M.; Perrine, K.A. Predicting pedestrian crash occurrence and injury zeverity In texas. In Proceedings of the 100th Annual Meeting of the Transportation Research Board, Washington, DC, USA, 5–29 January 2021. [Google Scholar]
  13. Zhao, B.; Zuniga-Garcia, N.; Xing, L.; Kockelman, K. Predicting pedestrian crash occurrence and injury severity in texas using tree-based machine learning models. Traffic Inj. Prev. 2021; Under review for publication. [Google Scholar]
  14. Lightstone, A.S.; Dhillon, P.K.; Peek-Asa, C.; Kraus, J.F. A geographic analysis of motor vehicle collisions with child pedestrians in Long Beach, California: Comparing intersection and midblock incident locations. Inj. Prev. 2001, 7, 155–160. [Google Scholar] [CrossRef] [PubMed] [Green Version]
  15. Sandt, L.; Zegeer, C.V. Characteristics related to midblock pedestrian–vehicle crashes and potential treatments. Transp. Res. Rec. 2006, 1, 113–121. [Google Scholar] [CrossRef]
  16. Texas Department of Transportation. Crash Data Analysis and Statistics. 2020. Available online: https://www.txdot.gov/government/enforcement/crash-statistics.html (accessed on 1 July 2021).
  17. Texas Department of Transportation. Texas Roadway Inventory. 2018. Available online: https://www.txdot.gov/inside-txdot/division/transportation-planning/roadway-inventory.html (accessed on 1 July 2021).
  18. OpenStreetMap Contributors. Planet Dump. 2021. Available online: https://www.openstreetmap.org (accessed on 1 July 2021).
  19. OpenStreetMap Contributors. Overpass API. 2021. Available online: https://wiki.openstreetmap.org/wiki/Overpass_API (accessed on 1 July 2021).
  20. Ester, M.; Kriegel, H.-P. A density-based algorithm for discovering clusters in large spatial databases with noise. KDD-96 Proc. 1996, 96, 226–231. [Google Scholar]
  21. PostGIS. 2021. Available online: https://postgis.net/ (accessed on 1 July 2021).
  22. Perrine, K.; Khani, A.; Ruiz-Juri, N. Map-matching algorithm for applications in multimodal transportation network modeling. Transp. Res. Rec. 2015, 2537, 62–70. [Google Scholar] [CrossRef]
  23. Dean, M.D.; Zuniga-Garcia, N. Shared e-scooter trajectory analysis during the COVID-19 pandemic in Austin, Texas. Transp. Res. Rec. 2022, 03611981221083306. [Google Scholar] [CrossRef]
  24. Wang, Y.; Kockelman, K.M. A Poisson-lognormal conditional-autoregressive model for multivariate spatial analysis of pedestrian crash counts across neighborhoods. Accid. Anal. Prev. 2013, 60, 71–84. [Google Scholar] [CrossRef] [PubMed]
  25. Miranda-Moreno, L.F.; Morency, P.; El-Geneidy, A.M. The link between built environment, pedestrian activity and pedestrian–vehicle collision occurrence at signalized intersections. Accid. Anal. Prev. 2011, 43, 1624–1634. [Google Scholar] [CrossRef] [PubMed]
  26. Bernhardt, M.; Kockelman, K. An analysis of pedestrian crash trends and contributing factors in Texas. J. Transp. Health 2021, 22, 101090. [Google Scholar] [CrossRef]
  27. McAndrews, C.; Pollack, K.M.; Berrigan, D.; Dannenberg, A.L.; Christopher, E.J. Understanding and improving arterial roads to support public health and transportation goals. Am. J. Public Health 2017, 107, 1278–1282. [Google Scholar] [CrossRef]
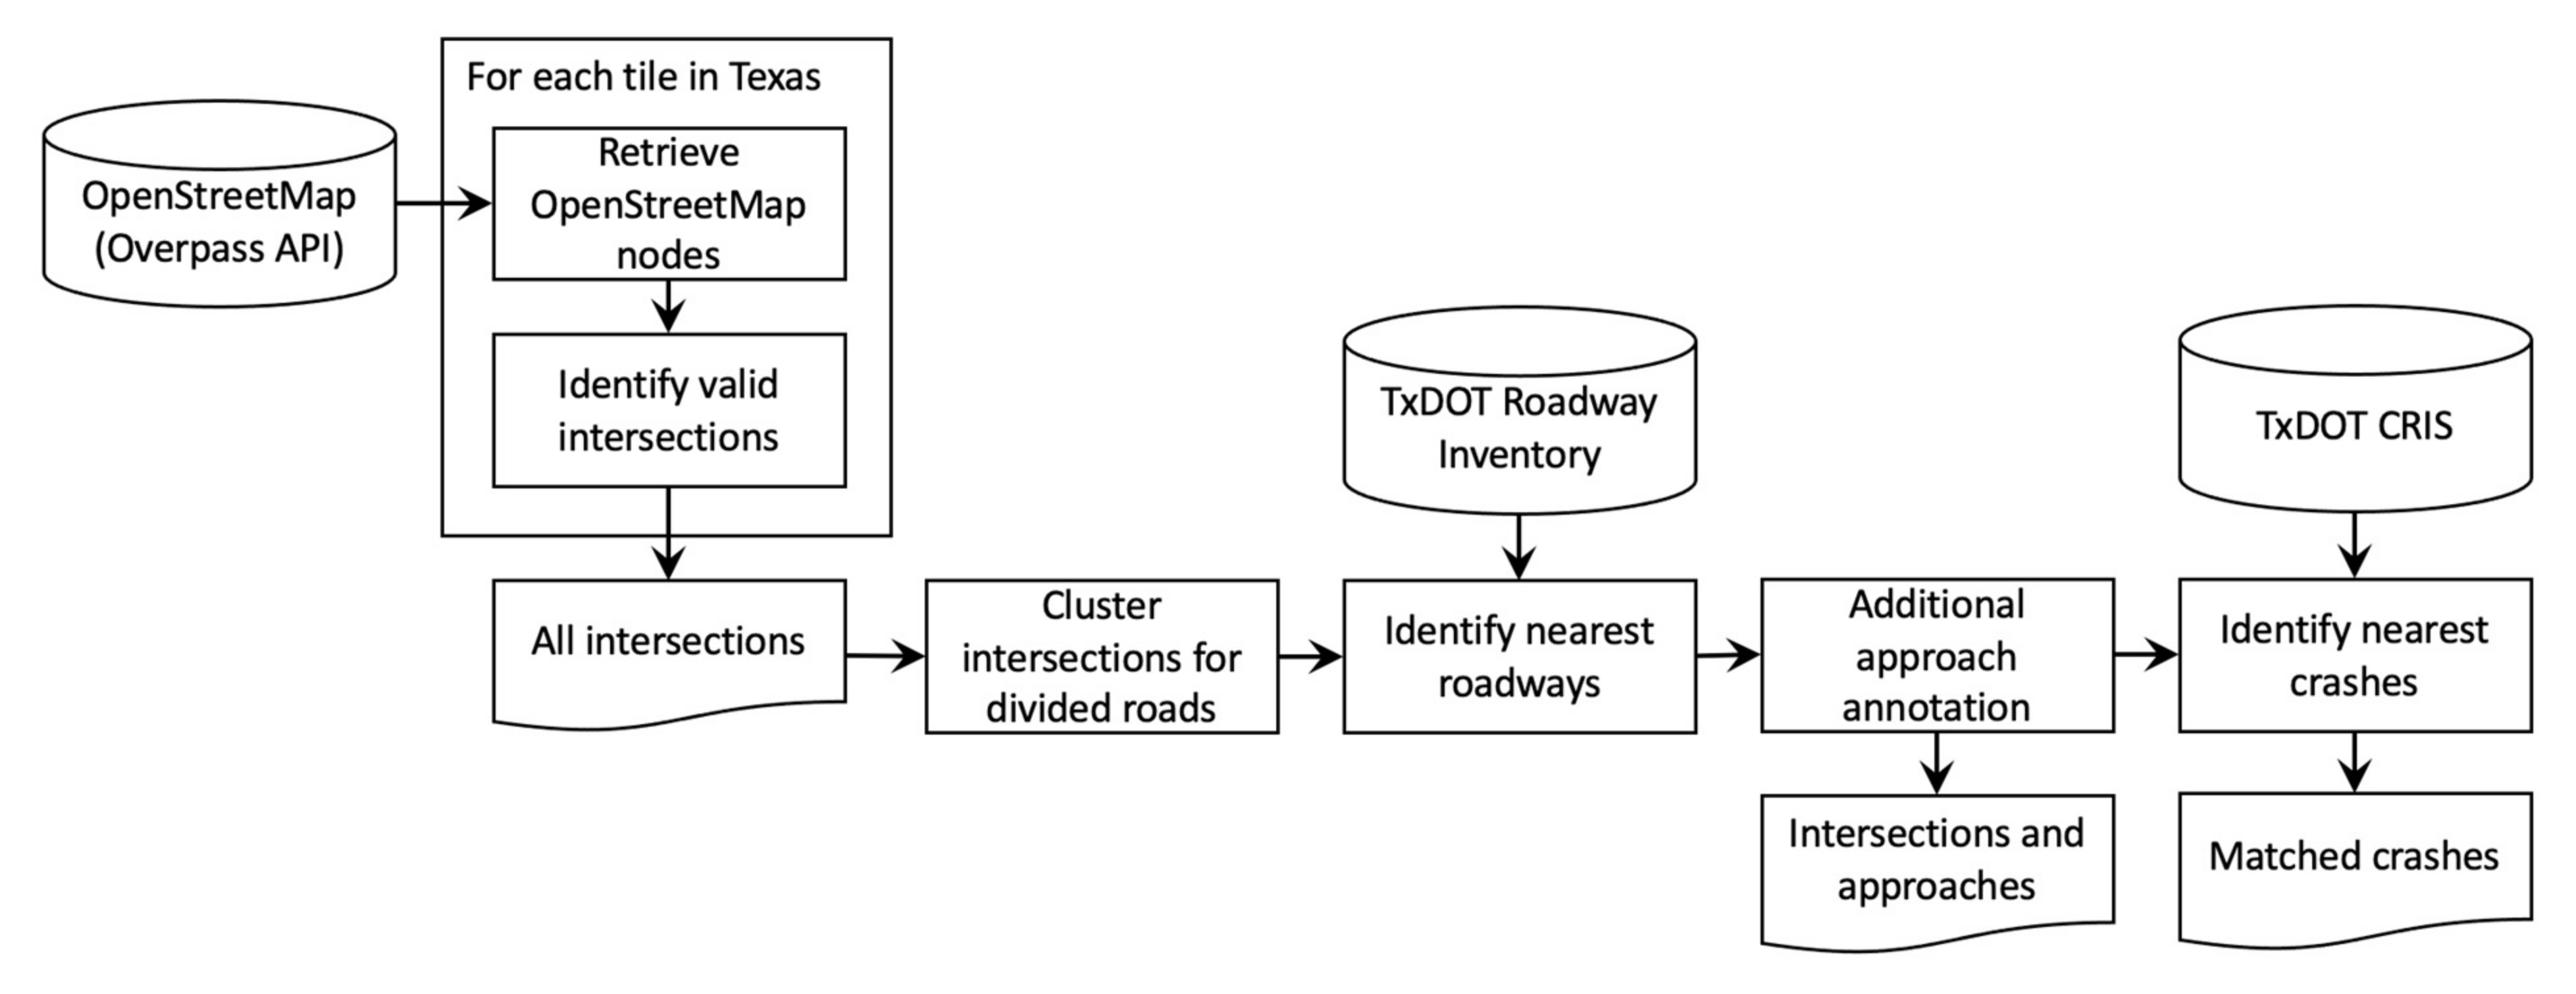
Figure 2. Method for identifying intersections and mapping to crash reports.
Sustainability 14 07164 g002
Figure 3. Roadway segments and intersections in the city of Austin downtown area.
Sustainability 14 07164 g003
Figure 4. Maps of the roadway segments and intersections. (a) Roadway segments city of Austin; (b) Intersections city of Austin; (c) Roadway segments Texas; (d) Intersections Texas.
Sustainability 14 07164 g004
Figure 5. Sensitivity analysis, Texas. (a) Intersections; (b) Midblock segments.
Sustainability 14 07164 g005aSustainability 14 07164 g005b
Figure 6. Sensitivity analysis, city of Austin. (a) Intersections; (b) Midblock segments.
Sustainability 14 07164 g006aSustainability 14 07164 g006b
Table 1. Sample sizes used in past pedestrian crash studies.
ReferenceIntersectionsMidblock Segments
Xie et al. [7]262None
Pulugurtha and Sambhara [8]176None
Diogenes and Lindau [11]None21
Lightstone et al. [14]3125
Zhao et al. [13]None700,000+
Rahman et al. [12]None700,000+
Table 2. Summary statistics of variables, Texas.
VariablesIntersectionsRoadway Segments (1 mi Uniform)
MeanS.D.Min.Max.MeanS.D.Min.Max.
#Pedestrian crashes per year0.0200.2150310.0620.5020.037.0
Signalized intersection indicator0.0210.14301
Number of approaches3.1770.67205
Intersections crossed 2.7812.693025
Walking density [Walk-miles traveled (WMT) per sq. mile]325453015,339244398015,339
Daily vehicle-miles traveled (DVMT)245889000432,194144869350432,194
Speed limit (miles/hour)56.9706.46010755951075
Number of lanes2.2290.713182.0680.401112
Lane width (ft)10.4942.1130489.9151.439048
Median width (ft)0.3646.77105191.34110.6140710
Design: one-way road indicator0.0090.096010.0110.10201
Annual average daily traffic (AADT) per lane95318521142,73352716151100,335
Percentage of trucks4.8035.3280934.9145.964093
Functional class: local0.6770.467010.8140.38901
Functional class: collector0.1780.382010.1100.31301
Functional class: arterial0.1450.352010.0750.26401
On-system roadway indicator0.1500.357010.1370.34301
Rural (pop. < 5000)0.2730.445010.4000.49001
Small urban (pop: 5000–49,999)0.1200.324010.0880.28301
Urbanized (pop: 50,000–199,999)0.1090.312010.0860.28101
Large urbanized (pop: 200,000+)0.4980.500010.4260.49501
Distance to nearest hospital (miles)5.1145.1670196.3835.639019
Transit stops within 0.25-mi buffer (indicator variable)0.0210.144010.0210.14401
Number of stops within 0.25-mi buffer0.0660.6230260.0790.813044
City of Austin indicator0.0270.163010.0230.15101
Note: S.D. = standard deviation, Min. = minimum, Max. = maximum, and the Speed limit, Number of lanes, Lane width, Median width, traffic count, and roadway class variables apply only to the major approach segment at each intersection.
Table 3. Summary statistics of variables, city of Austin.
VariablesIntersectionsRoadway Segments (0.1 mi Uniform)
MeanS.D.Min.Max.MeanS.D.Min.Max.
#Pedestrian crashes per year0.0740.4890130.0420.27409
Signalized intersection indicator0.0420.20101
Number of approaches3.0430.65905
Intersections crossed 0.9942.11305
Walk-miles traveled per pop. dens.7568087818064773678180
Daily vehicle-miles traveled262771820133,254413311,9041133,254
Speed limit (miles/h)56.7375.698106557.3595.0011070
Number of lanes2.2590.731162.2660.73616
Design: one-way road indicator0.0130.114010.0490.21601
Annual average daily traffic lane149927535897,04921234645297,049
Percentage of trucks3.2940.7080203.3981.024020
Functional class: local0.7180.450010.7080.45501
Functional class: collector0.1650.371010.1610.36801
Functional class: arterial0.1170.321010.1310.33701
On system roadway indicator0.0390.194010.1230.32801
Distance to nearest hospital (miles)2.0921.2790102.2581.417010
Transit stops within 0.25-mi buffer0.2200.414010.2110.40801
Number of stops (0.25-mi buffer)1.0222.3910181.0382.562021
Population density (per sq. mile)44433398064,81237753282064,812
Employment density (per sq. mile)234495260419,403219684690419,403
Median household income in the traffic analysis zone (TAZ) (USD 10 k)7.1933.8910257.2284.109025
Central business district indicator0.0110.105010.0080.08901
Note: S.D. = standard deviation, Min. = minimum, Max. = maximum, and the Speed limit, Number of lanes, Lane width, Median width, traffic count, and roadway class variables apply only to the major approach segment at each intersection.
Table 4. Estimation results of NB for pedestrian crashes, Texas.
IntersectionsMidblock Segments
Coeff.Std. Errorp-ValueCoeff.Std. Errorp-Value
(Intercept)−8.6940.2160.000−8.0350.0980.000
Walking density (log WMT/sq mi)0.3350.0130.0000.3050.0070.000
Signalized intersection (ind.)1.4260.0320.000
Number of approaches0.3980.0190.000
Intersections crossed 0.0930.0020.000
DVMT (log) (major)0.1950.0080.0000.5220.0060.000
Speed limit (mph) (major)−0.0200.0020.000−0.0130.0010.000
Number of lanes (major)0.1320.0120.0000.2170.0100.000
Lane width (ft) (major)0.0330.0040.0000.0410.0030.000
Median width (ft) (major)−0.0060.0010.000−0.0140.0010.000
One-way road (ind.) (major)0.0950.0520.068−0.9060.0480.000
DVMT (log) (minor)0.1360.0080.000
Speed limit (mph) (minor)−0.0210.0020.000
Number of lanes (minor)−0.0040.0180.842
Lane width (ft) (minor)0.0400.0050.000
Median width (ft) (minor)−0.0270.0050.000
One-way road (ind.) (minor)−0.2110.0630.000
AADT per lane (major)1.76 × 10−54.53 × 10−60.000−7.67 × 10−54.19 × 10−60.000
Truck percentage (major)0.0200.0030.0000.0030.0020.100
Arterial (ind.) (major)0.4440.0370.0000.1980.0280.000
On system roadway (ind.)−0.2300.0360.0000.2090.0280.000
Rural (ind.)−0.1070.0870.218−0.3390.0410.000
Small urban (ind.)−0.1080.0550.0500.0490.0340.154
Large urbanized (ind.)0.1710.0370.0000.1700.0250.000
Distance to nearest hospital (mi)−0.0230.0060.000−0.0090.0030.002
Transit stops (ind.)0.5250.0470.0000.5260.0330.000
Number of transit stops0.0420.0080.0000.0490.0040.000
City of Austin (ind.)0.3270.0470.000−0.3920.0420.000
No. of observations699,954 574,910
Dispersion Parameter (ρ):0.393 0.575
McFadden’s R2:0.483 0.543
2 × log-likelihood−86,105 −161,539
Note: DVMT = daily vehicles miles traveled, WMT = walk miles traveled, AADT = annual average daily traffic.
Table 5. Estimation results of NB for pedestrian crashes, city of Austin.
IntersectionsMidblock Segments
Coeff.Std. Errorp-ValueCoeff.Std. Errorp-Value
(Intercept)0.3600.0610.000−5.0980.4730.000
Walking density (log WMT/sq mi)1.6710.1030.0000.0680.0430.114
Signalized intersection (ind.)0.1230.0670.067
Number of approaches
Intersections crossed 0.0010.0120.904
DVMT (log) (major)0.1660.0280.0000.2450.0240.000
Speed limit (mph) (major)−0.0070.0060.248−0.0360.0040.000
Number of lanes (major)0.3750.0460.0000.4110.0330.000
Lane width (ft) (major)0.0300.0110.0090.0810.0100.000
Median width (ft) (major)0.0010.0020.726−0.0170.0040.000
One-way road (ind.) (major)0.1590.1750.735−1.4370.1600.000
DVMT (log) (minor)0.1450.0290.000
Speed limit (mph) (minor)−0.0120.0090.177
Number of lanes (minor)0.0570.0630.359
Lane width (ft) (minor)0.0360.0130.006
Median width (ft) (minor)−0.0490.0200.013
One-way road (ind.) (minor)−0.4580.1820.012
AADT per lane (major)4.45 × 10−51.17 × 10−50.0002.02 × 10−59.70 × 10−60.038
Truck percentage (major)−0.0190.0370.610−0.0490.0290.084
Arterial (ind.) (major)0.2290.1410.105−0.1670.0850.049
On system roadway (ind.)−0.2310.1310.077−0.0100.1080.923
Distance to nearest hospital (mi)0.0890.0460.0500.0350.0310.252
Transit stops (ind.)0.3780.1160.0010.6470.0910.000
Number of stops0.0280.0160.0700.0130.0120.275
Population density (sq mi)2.11 × 10−57.41 × 10−60.0055.30 × 10−56.30 × 10−60.000
Employment density (sq mi)−1.59 × 10−61.61 × 10−60.3243.33 × 10−56.82 × 10−60.000
Median income (USD 10k)−0.0990.0150.000−0.1190.0110.000
CBD (ind.)0.7380.1820.0001.4530.1570.000
No. of observations19,194 41,107
Dispersion Parameter (ρ):0.821 0.430
McFadden’s R2:0.616 0.370
2 × log-likelihood−5618 −10,567
Note: DVMT = daily vehicles miles traveled, WMT = walk miles traveled, AADT = annual average daily traffic.
Publisher’s Note: MDPI stays neutral with regard to jurisdictional claims in published maps and institutional affiliations.