Article

Evaluation of the Durability of Bridge Tension Cables Based on Combination Weighting Method-Unascertained Measure Theory

School of Water Conservancy Engineering, Zhengzhou University, Zhengzhou 450001, China
*
Author to whom correspondence should be addressed.
Sustainability 2022, 14(12), 7147; https://doi.org/10.3390/su14127147
Submission received: 17 May 2022 / Revised: 6 June 2022 / Accepted: 8 June 2022 / Published: 10 June 2022
(This article belongs to the Special Issue Engineering Structure Safety and Risk Management of Sustainability)

Abstract

:
Constant use over a period damages the bridge pulling cable structure of pulling sling bridges and reduces their durability. Therefore, a comprehensive and accurate durability evaluation of in-service bridge cable-stayed structures is critical to the safe operation and routine maintenance and repair of pulling sling bridges. In this paper, we first establish a three-layered pulling sling durability evaluation index system and then use the combined IAHP and CRITIC methods to assign weights to these evaluation indexes. The UM theory is applied to calculate a comprehensive multi-index evaluation vector for the durability of the pulling sling, which is evaluated according to the confidence criterion. Taking the Jiahui Bridge tension sling as an example, a durability evaluation was carried out, and the final evaluation result showed the bridge to be at level III, which is in line with the actual situation of the project. Finally, by comparing and analyzing using the SPA and MEE methods, we prove that the durability evaluation results of bridge tension cables using this method are more accurate.

1. Introduction

With economic growth, the research and development of new materials, and the progress of construction technology, bridge construction has entered a period of rapid development. Half-through arch bridges, through arch bridges, and other cable-stayed bridges have become the primary choice for many bridge designs because of their economy and practicality. The bridge deck load of these bridge types is transmitted through the tension sling to the bridge tower or the arch rib and from there to the bridge foundation. As the main load bearing part of the bridge, the tension sling extends from the bridge tower (or the arch rib) to the bridge deck system. It is usually protected by PE plastic wrapping, has small cross sections, and is under high stress over an extended period. Therefore, the pull cable is more sensitive to environmental, climatic, and human-induced durability damage. In current cable-stayed bridges and under-supported arch bridges, the majority of damage occurs in the pulling sling structure. In particular, in medium- and low-bearing arch bridges without rigid ties, the bridge deck crossbeams are only supported by slings. If the slings break, it can cause the bridge to collapse. Since there is no prior indication that a sling might be about to break, there is no way to prevent such an event. In recent years, a number of bridges have had to be replaced due to serious sling damage, resulting in huge economic losses and adverse social impacts. A pulling sling has the characteristics of high tensile strength and light weight per unit strength and is often used in large-span structures. However, the development history of pulling sling structures is relatively short, and engineering designers have not yet thoroughly grasped the bridges’ performance. High-tensile steel wire is commonly used in modern suspension bridges, cable-stayed bridges, and boom arch bridges for pulling slings, which are under high stress for an extended period during operation and are sensitive to natural environmental or manmade hazards. Over years of use, there is damage to the protective structure becomes damaged. For example, the rope body may corrode, the steel wires within it may break, or the anchorage area may be damaged or corroded [1]. Insufficient attention to the problems of pulling slings, overestimation of the expected life of the slings, improper operation and maintenance, car accidents, human accidents, and environmental factors have caused slings to break and bridges to collapse. The current design-based life of highway bridges and municipal bridges in China is generally 100 years, requiring the main components of the bridge to have a service life of 100 years. However, due to corrosion and fatigue damage, it is difficult for high-strength steel cables to last for the design life of the bridge. Therefore, ensuring the durability of in-service bridge pulling slings has become one of the keys to building cost-effective highways and achieving sustainable development, which is a major practical problem facing China’s highway sector.

1.1. Introduction of Research on Durability Damage Mechanism of Pulling Slings

Over the years, scholars at home and abroad have conducted a great deal in research on the durability–damage mechanism of the steel wire of the cable body of in-service bridges. Stallings and Frank [1] used a serial–parallel model to analyze the factors affecting the fatigue life of steel wires. They simulated by turns the effects of steel wire quantity, length, and other parameters on the fatigue life of steel wires by using different distribution models. By analyzing the model and calculating, they concluded that the fatigue life of steel wire is positively correlated with the number of steel wires and negatively correlated with the length of the steel wire. Takena et al. [2] analyzed the fatigue damage of steel wires in two main directions, axial and radial, by conducting fatigue tests on steel wires of different grades and diameters and also analyzed the effect of the size of the wire diameter on the fatigue life. Matteo et al. [3] developed a model to calculate the ultimate load-carrying capacity of pulling suspension cables. The model assumes that the mechanical properties of some of the wires will fail before the ropes reach the ultimate bearing capacity, and the bearing capacity of the remaining wires will no longer increase after damage occurs. Hamilton III et al. [4,5] investigated the effect of filler materials used in pulling sling structures on the durability of steel wires. They conducted relevant experiments, mainly on cement fillers used in early pulling sling structures, comparing the effect of fillers of different compositions and ratios on the corrosion rate of steel wires. Barton et al. [6] investigated the corrosion resistance of galvanized steel wires by accelerated rusting tests on steel wires and showed that the accelerated rusting rate of steel wires is linearly related to time. Mayrbaurl [7] carried out tests related to rusted steel wires according to the classification criteria. In the tests, the tensile strength of the wire decreased significantly after rust appeared on the wire, but the difference between rusted wires of adjacent grades was not significant. Faber and Camo [8] developed a brittle model of steel wire and derived an equation to calculate the load-carrying capacity. The model clarifies that the wire exhibits elastic deformation before a fracture occurs, which masks some plastic deformation and always behaves as elastic before damage. The fiber bundle theory, proposed by Weibull and refined by Daniels et al., has been widely used to calculate the load-carrying capacity of steel ropes as well as fatigue strength [9,10,11]. To investigate the effect of residual stresses on wire cracking under the influence of environmental factors, Atienza et al. [12,13] used a numerical procedure to calculate residual stresses. Luo et al. [14] used an accelerated corrosion test of steel strands to study the mechanical properties of unbonded prestressing steel strands after corrosion. The study showed that the steel strand was more sensitive to rusting compared with ordinary steel bars. Ye et al. [15] studied the influence of the degree of corrosion of galvanized steel wire of bridge cables on the fatigue performance of the wire. The results showed that the more serious the corrosion of the steel wire, the more concentrated the corrosion pit area and the deeper the corrosion pit. In addition, the fatigue strength decreased as the degree of corrosion increased. Using replaced old cable as the test raw material, Wu [16] systematically studied wire corrosion by the damage grading method, tested the remaining fatigue life of the wire, theoretically evaluated its remaining fatigue life, and proposed a new evaluation criterion of wire corrosion grading for diagonal cable containing the index of wire diameter parameter and the index of corrosion pit parameter. Li et al. [17] used a high-strength steel wire of a boom used for more than 10 years and analyzed the effect of corrosion pits on the stress concentration of the wire using a fine finite element calculation model. The results showed that corrosion had had little effect on the tensile strength of the wire but significant effect on the fatigue life of the wire. Chen [18] analyzed the factors causing damage to and degrading the performance of the rope body steel wire of the cable load-bearing system and systematically studied the degradation law of the mechanical properties of corroded steel wire. Wu et al. [19] conducted uniaxial tensile fatigue tests on six steel wire specimens with different corrosion levels. The effects of corrosion degree and stress level on high-strength steel wires were analyzed, and the fatigue performance degradation law of high-strength steel wires of pre-corroded bridge cables was studied. The fatigue surface equation of the high-strength steel wire of pre-corroded bridge cables was established by the test data, and the suggested values of the fatigue strength of the wire under different guarantee rates and weight loss rates were provided. Chien-Chou et al. [20] developed a method with an asymmetric-mode-fitting formula and successfully applied it to pulling sling cables. Marco Bonopera et al. [21] proposed two non-destructive static methods for evaluating the axial load of pulling sling cables and verified the accuracy of the methods through tests. Wen-Hwa Wu et al. [22] proposed a new method to measure cable tension and developed an iterative algorithm based on the finite element model to calculate and predict the cable structure stability. Chen et al. [23] designed and conducted accelerated corrosion experiments on 5.25 mm steel wire to obtain the yield and ultimate loads of corroded wire by mechanical property tests. A model for yield and ultimate load degradation of corroded wire based on normal distribution was developed. Miao et al. [24] investigated the effects of dislocation depth, width, location, and stress amplitude on the fatigue life of steel wires by fatigue tests and established a fatigue life prediction model for corrosion pit steel wires. They analyzed the S–N curves of wires with different corrosion pit sizes and stress ratios. The results show that a small change in stress amplitude will lead to fatigue life several times or even 10 times higher. Yu et al. [25] conducted indoor physical tests on steel strand specimens exposed to the marine tidal environment. Strand corrosion was observed under different exposure times, and a prediction model consisting of stress concentration factors was developed to simulate the corrosion life of the strand. Wang et al. [26] designed a novel test apparatus for simultaneous pulsating fatigue loading of multiple wires. The effects of the concentration, the pH of the corrosion solution, and the shape and size of initial defects on the fatigue corrosion performance of the wires were obtained. Jie et al. [27] examined a large amount of literature data on high-strength steel cables with dents/cracks by the strain energy density (SED) method and discussed estimating the fatigue damage of high-strength wires weakened by corrosion pits and cracks. Zhang et al. [28] investigated the effects of different prestress levels and protective current densities on the corrosion and mechanical behavior of high-strength steel wires in diagonal cables. The degree of corrosion of the wire was characterized qualitatively and quantitatively by observing the macroscopic and microscopic morphology of the corroded specimens and by weight loss measurements.

1.2. Introduction of Existing Durability Evaluation Methods

Many scholars at home and abroad have devoted themselves to research on structural durability evaluation methods, such as the fuzzy evaluation method, the neural network method, cloud theory, and the hierarchical analysis method. Hu et al. [29] used the theory related to fuzzy neural networks to establish a bridge safety and durability evaluation system. Sugimoto et al. [30] examined and tested actual railroad girders to estimate the durability behavior of steel railroad bridges, performing some nonlinear analyses using an analytical model that takes corrosion into account. Chen et al. [31] used hierarchical analysis to establish an evaluation system for durability and safety based on the principle of fuzzy comprehensive evaluation with an adaptive fuzzy inference system based on neural networks as the evaluation engine. Liu et al. [32] proposed a multi-level comprehensive measure for the durability of cable-stayed bridges for the special corrosive environment of these bridges, which includes durability indexes and corresponding assessment methods, construction and quality acceptance standards, necessary preventive measures, and additional preventive measures. Liu et al. [33] combined fuzzy theory and neural network technology to establish a lasso durability evaluation model. On the basis of the hierarchical analysis method, Ma et al. [34] established a comprehensive evaluation model and index system for the durability of semi-permeable concrete arch bridges. Combined with the comprehensive fuzzy evaluation theory, a model evaluation method based on fuzzy proximity was discussed. Zhu et al. [35] investigated the application of random stratified sampling theory in durability evaluation, summarized the graphical procedure used to assess durability, and gave confidence intervals for the component categories of bridge structures. Liu et al. [36] introduced the toposable method based on the material element theory and correlation function into the durability evaluation of rein-forced concrete structures and established a material element model for the durability evaluation of reinforced concrete structures. Zheng et al. [37] divided the overall structure of the bridge into two levels, and according to the dependence function of each factor, a two-level, multi-indicator concrete bridge service durability evaluation model was developed based on fuzzy mathematical theory and using the principle of maximum affiliation to evaluate the durability level of the bridge in practice. Tang et al. [38] analyzed the corrosion risk of the Hong Kong–Zhuhai–Macao Bridge, a bridge-cum-immersed-tube-tunnel system, in terms of design, concrete raw materials, concrete, and construction. The factors affecting the characteristic values of durability indicators and their range of values were further refined. He et al. [39] summarized the evaluation elements of damage performance of large-span arch bridges subjected to blast loads. The damage inflicted on large-span arch bridges subjected to blast loads was evaluated using the fuzzy comprehensive evaluation method. Ren et al. [40] introduced the fuzzy comprehensive evaluation method to evaluate complex cable-stayed bridges and established the statistical method of the affiliation function for comprehensive evaluation. Chen et al. [41] established a durability health evaluation method for port projects using the analytic hierarchy process (AHP) method. Wang et al. [42] proposed a finite-element-based evaluation method to accurately evaluate the durability of the cable and guide the maintenance of the cable. The corrosion of the steel wire of the cable body was summarized; the finite element was used for analysis and simulation to obtain the correlation between the bearing capacity of the steel wire and the degree of corrosion, and the prediction model of the bearing capacity was derived. Zhao et al. [43] used the optimal transfer matrix method to evaluate the safety of cable-stayed bridges by uncertainty-type hierarchical analysis and the optimal transfer matrix method, which made the bridge evaluation results more objective. Lin [44] focused on the key technologies for the construction of a durability evaluation system for reinforced concrete bridges based on neural networks. The principal process of durability evaluation was clarified, and a bridge durability state evaluation method based on fuzzy clustering and a neural network was proposed. To study the durability of concrete bridge structures, Cai et al. [45] established an evaluation index system and a fuzzy comprehensive evaluation factor set based on the known erosion mechanism of chloride ions on concrete structures and the corrosion mechanism of steel reinforcement. Stochastic simulations were performed on concrete members based on Monte Carlo principles. Liu et al. [46] optimized and improved the set-pair analysis theory and ICP algorithm, on the basis of which they integrated the improved entropy power set-pair analysis and vehicle-mounted-laser-scanning technology to propose a highway slope hazard evaluation model that combines overall evaluation and local evaluation. Li et al. [47] addressed the problem of complexity and uncertainty in the content of dam-break environmental impact studies by combining the improved refined set-pair analysis linkage degree function with variable fuzzy set theory to construct and refine the dam-break environmental impact evaluation index system and evaluation level criteria. Liang et al. [48] proposed a spatial risk analysis method based on cloud theory and the ALARP criterion for the durability risk assessment of inclined cables as an example. He et al. [49] established a comprehensive evaluation system for bridge sling structure durability based on the investigation of durability damage of bridge sling structures in China, divided the evaluation criteria, and proposed a gender evaluation method of sling durability based on set-pair analysis, which accurately quantified the durability level of bridge sling structures. Liu et al. [50] established a multilayer evaluation model for the durability of simply supported girder bridges and used the interval number topologic theory instead of the number of points to construct the judgment matrix in the model, which solved the fuzziness and uncertainty of the traditional AHP expert experience judgment. A durability evaluation method for reinforced concrete simply supported girder bridges based on the topologizable interval number theory and the hierarchical analysis method was proposed.

1.3. Introduction to the Proposed Method in this Study

At present, the research on the durability damage mechanism of in-use bridge cables is relatively well established, and there are various levels of damage detection and assessment of the cables. However, the analysis of the overall cable structure is still relatively rare. Most of the research is fuzzy and random and depends on the subjective scoring of experts, which is not conducive to grasping the real situation of pulling sling durability. This paper proposes a combination weighting method-unascertained measure (CWM-UM) theory to evaluate the durability of bridge pulling cables. CWM-UM theory is a durability evaluation method that combines the improved analytic hierarchy process (IAHP) method, the criteria importance though intercriteria correlation (CRITIC) method, and unascertained measure (UM) theory. A comparative analysis is also conducted using the set-pair analysis (SPA) method and the matter element extension (MEE) method to demonstrate the superiority of durability evaluation using the CWM-UM method. Then, the method to improve the durability of bridge cable pulling is derived based on the evaluation results. The goals are to contribute to the construction of resource-saving highways and realize sustainable development.

2. Establishment of the Durability Evaluation Index System for Pulling Sling Structures

2.1. Causes of Damage to the Durability of Pulling Sling Structures

According to the research on cable-stayed bridges and arch bridges, cable damage manifests largely as cracked cable sheaths and rusted steel wires. HDPE is generally used to protect the rope body of the pulling sling. From manufacture to installation, the cable body steel wire is mostly packaged in coils. The process of coiling produces a certain twisting angle, and the rope body steel wire or strand is back-twisted after installation. However, the sheath does not twist with the rope body. If the twisting angle is too large during this recovery process, the pulling sling has a certain degree of impact on the sheath and may even damage the sheath. Exposure to violent dragging during construction and transportation can cause the sheath to crack before it is used. In addition, during the service period, radiation from sunlight will cause the sheath to undergo thermal aging and thus cracking. Environmental factors or human-induced scratches during the service life are also important factors affecting the durability of the sheath.
Damage to the anchorage, the conduit, and shock-absorbing devices is a common issue pulling slings face, and the lower anchor head of the anchoring device is the component most prone to corrosion damage. Damage to the cable body protection and poor sealing of the conduit location are the main causes of rainwater entering the interior of the cable body. Since the interior of the rope body is relatively sealed, water vapor does not easily evaporate. At the same time, under the load the pulling sling produces vibration. The vibration of the cable body causes water droplets to collect in the lower anchorage area along the gap between the sheath and the cable body, causing rust damage to the anchorage [10].
Damage and destruction of the sheath exposes the rope body directly to the service environment, and corrosive ions, such as C l and S O 4 2 , in the environment come in direct contact with the rope body wire or the steel strand. Once the outer protection of the rope body corrodes, the galvanized layer of the rope body steel wire also gradually loses its protective effect, leading to the corrosion of the steel wire body. Damage such as corrosion of the wire can directly reduce the effective cross section of the cable. Under the action of alternating stress coupling, corrosion is accelerated. The plastic properties of the steel wire are reduced, and the brittleness is increased, causing brittle fracture.

2.2. Pulling Sling Durability Evaluation Index System

According to the above analysis, the factors that affect the overall durability of the pulling sling include the PE sheath, the anchorage system, and the cable steel wire. Each factor is composed of different evaluation indexes, and the established evaluation system for the third-level durability of the pulling sling is shown in Table 1 (Figure 1).

2.3. Determine the Durability Evaluation Level of the Pulling Sling Structure

China’s Standards for Technical Condition Evaluation of Highway Bridges [51] divides the evaluation index of pulling sling durability into five levels: I, II, III, IV, and V. Level I durability failure risk is very small and only needs general inspection. Level II durability failure risk is small, needing only strengthened inspection for prevention of failure. Level III durability failure risk is medium, and durability damage can be reduced by adopting some corrective measures. Level IV durability failure risk is high, and it is necessary to take measures to reduce the occurrence of durability damage and undertake local repair of damaged parts. Level V durability failure risk is high and should be given high priority. Repair and reinforcement or replacement are required to avoid accidents. In other words, the higher the value, the greater the risk. Due to the complex force conditions of the pulling sling, it is difficult to provide accurate quantitative descriptions of each evaluation index. For a more accurate durability evaluation of the pulling sling, the evaluation criteria were divided as shown in Table 2.

3. Evaluation Methodology and Process of the CWM-UM Method

3.1. Objective Weight Method

3.1.1. The Theory of MEE Method

The matter–element extension evaluation (MEE) method combines matter–element theory and an extension set with the correlation degree for quantitative evaluation. This model divides the data interval of the evaluated target into several orders and determines their levels. The degree of correlation between each plan and grade is calculated. The larger the correlation degree, the higher the membership extent present. The level of the evaluated target depends on the grade of the data interval with the highest membership degree [52].
(1)
We determine the classical domain, the section domain, and the matrix of elements [52] to be evaluated.
Let the event to be evaluated be Q , and the quantity of indicator B be v . Q has m indicators, denoted as B 1 , B 2 , , B m , and the corresponding quantity values are denoted as v 1 , v 2 , , v m . Then, the matter element matrix is [53]:
R = [ Q B 1 v 1   B 2 v 2     B m v m ] = [ R 1 R 2 R m ]
a. We determine the classical domain:
R k = ( Q k , B j , x j k ) = [ Q k B 1 x 1 k   B 2 x 2 k     B m x m k ] = [ Q k B 1 ( a 1 k , b 1 k )   B 2 ( a 2 k , b 2 k )     B m ( a m k , b m k ) ]
We classify the events to be evaluated into t levels,
R k : The classical domain matter element matrix composed of the characteristic B of the k t h evaluation grade Q k and the value range of the characteristic B ,   k = 1 , 2 , t .
Q k : The k t h evaluation grade divided.
x j k = ( a m k , b m k ) : The range of quantity of the j t h index B j of the k t h evaluation grade Q k
In other words, the range of data taken at each level regarding the corresponding evaluation index is the classical domain.
b. We determine the section domain:
R j = ( P , B j , x j p ) = [ P B 1 x 1 p   B 2 x 2 p     B m x m p ] = [ P B 1 ( a 1 p , b 1 p )   B 2 ( a 2 p , b 2 p )     B m ( a m p , b m p ) ]
where P is something to be evaluated, R j is a matrix of section domain elements consisting of the characteristic B j of the thing to be evaluated ( P ), and all of its evaluation grades and the range of quantitative values of the characteristic B j ; x j p = ( a m p , b m p ) is the range that P measures with respect to B j . That is, the section domain of P ; a m p is the minimum value of the lower limit of the j t h index B j in all evaluations, b m p is the maximum value of the upper limit of the j t h feature B in all evaluations, and x j k x j p .
c. We determine the matter element.
We use the collected statistical data or analysis result as matter element R 0 .
R 0 = ( P 0 , B j , x j ) = [ P 0 B 1 x 1   B 2 x 2     B m x m ]
where P 0 indicates a certain definite evaluation system, and x j is the P 0 of the range of quantitative values of evaluation index B j , which is the specific index data of the object to be evaluated.
(2)
We calculate the correlation.
a
We determine the correlation function for each level of the system to be evaluated.
The correlation function expresses the degree to which something has a certain property, and the concept of distance in the real variable function is extended to “distance” by the formula of the association function [54]. The correlation function built on the basis of distance extends the qualitative description of something that has a certain property to a quantitative description of the degree of a certain property [18]. Specify the distance between a point x on the real axis and a certain interval X 0 = ( a , b ) as ρ ( x , X 0 ) = | x j a + b 2 | 1 2 ( b a ) . The primary correlation function for the j t h indicator value domain belonging to the k t h rank is established as [55]:
K k ( x j ) = { ρ ( x j , x j k ) ρ ( x j , x j p ) ρ ( x j , x j k ) , x j x j k ρ ( x j , x j k ) | x j k | , x j x j k
and
                    ρ ( x j , x j k ) = | x j a j k + b j k 2 | 1 2 ( b j k a j k )
ρ ( x j , x j p ) = | x j a j p + b j p 2 | 1 2 ( b j p a j p )
where x j is the j t h durability evaluation index, x j k = ( a j k , b j k ) is the value domain corresponding to the j t h indicator with rank k , x j p = ( a j p , b j p ) is the range of values specified for the j t h indicator for the whole of the hierarchy of indicators to be evaluated, and | x j k | is the length of interval.
The initial correlation matrix of the object to be evaluated is:
( K j k ) m × t = [ K 11 K 21 K m 1 K 12 K 22 K m 2 K 1 t K 2 t K m t ]
where j = 1 , 2 , , m , and k = 1 , 2 , , t .

3.1.2. CRITIC Method

Diakoulaki et al. proposed the CRITIC method, the basic idea of which is to use two parameters, correlation coefficient and standard deviation, to determine the objective weight of the indicator. Compared with other subjective weighting methods, such as the Delphi method, the CRITIC method takes a purely data-driven approach, and the weight setting is more objective. Compared with other objective weighting methods, such as the entropy weight method (EWM), the CRITIC method considers the conflict and difference of indexes, and the weight settings are more comprehensive. The CRITIC method determines the objective weight from the dimension of data volatility. The standard deviation of the index is used to show the volatility of the data, and the correlation between the indexes is used to show the conflict [56].
Assuming that there are t evaluation levels and m evaluation indicators for each object, the data in the correlation matrix ( K j k ) m × t are normalized to the range [ 0 , 1 ] to create the normalization matrix ( r j k ) m × t . The comparative intensity V j [25] of each evaluation index is [57]:
V j = σ j r ¯ j ( j = 1 , 2 , , m )
where V j is the coefficient of variation of the j t h indicator, also known as the standard deviation coefficient; σ j is the standard deviation of the j t h item; and r ¯ j is the mean of the j t h item:
h j j = k = 1 t ( r j k r ¯ j ) ( r j k r ¯ j ) k = 1 t ( r j k r ¯ j ) 2 k = 1 t ( r j k r ¯ j ) 2
where r j k and r j k are the standardized correlation values of the j t h indicator and the j t h indicator of the k t h evaluation object, respectively, and r ¯ j and r ¯ j are the standardized correlation mean values of the j t h indicator and the j t h indicator in t evaluation levels, respectively.
The conflicting quantitative indicator values for the j t h indicator and the other indicators are:
j = 1 m ( 1 h j j )
We calculate the amount of information of the indicators. The objective weights of each indicator are measured in a combination of contrast intensity and conflict. Let C j denote the amount of information contained in the j t h evaluation index. Then, C j can be expressed as:
C j = V j j = 1 m ( 1 h j j )
The weight values of each durability evaluation index are:
W j = C j j = 1 m C j
The standardized formula is:
r j k = K j k min   K j k max   K j k min   K j k
where K j k is the initial correlation matrix value, r j k is the value of the judgment matrix after the normalization process, and min   K j k and max   K j k are the minimum and maximum values, respectively, of an evaluation index in the initial correlation matrix.

3.1.3. Calculation Steps

(1)
We determined the durability evaluation indexes of the system to be evaluated and the grading criteria of each index.
(2)
We determined the classical domain, the section domain, and the object element matrix of the system to be evaluated.
(3)
We calculated the correlation matrix of the system to be evaluated and normalized the correlation matrix.
(4)
We substituted the judgment matrix obtained from Step (3) into Equations (9)–(13) to obtain the weight value of each durability evaluation index.

3.2. IAHP Method

The analytic hierarchy process (AHP) method is used for multi-factor sequencing and hierarchical weights decision-making analysis [58]. In terms of decomposition, comparison, judgment, and synthesis, it is suitable for decision analysis of complex multi-criteria multi-objective problems. The use of a single method may lead to a relatively low accuracy of the evaluation results, so hierarchical analysis combined with an expert evaluation table is used to evaluate the durability of the pulling cable structure. The AHP can help effectively solve the multi-factor problem in the system by splitting the factors into different levels and establishing a structural hierarchy model on the basis of the interrelationship between the factors. Finally, the weight value of each evaluation factor is obtained. Because of the subjectivity of the assignment process, its evaluation is fuzzy in nature and needs to be considered in the comprehensive evaluation. After determining the durability evaluation index set, a two-by-two comparison is performed, generally using a quantitative method on a nine-point scale, from one to nine.
Due to the subjectivity of the assignment process, there may be large differences from the objective facts. It leads to the judgment matrix not conforming to the consistency test, making multiple corrections necessary, thus increasing the workload. Therefore, this paper proposes the IAHP method and uses the three-scale theory to construct the judgment matrix, which is shown in Table 3. The method reduces the ambiguity in judging the importance of evaluation indexes, simplifies the calculation process, and provides more accurate results. The steps are as follows.
The m evaluation indexes are compared with each other two by two. Then, the comparison judgment matrix A = ( a j j ) m × m can be obtained. Constructing the antisymmetric matrix B of the judgment matrix A :
B = l g A , b j j = b j j
We can construct the optimal transfer matrix C of the antisymmetric matrix B , which is characterized by:
c j j = 1 m g = 1 n ( b j g b j g )
We construct the fitted consistent matrix A * of the judgment matrix A :
a j j * = 10 c j j
We calculate the relative weight values between the factors at each level to normalize the proposed optimal consistent matrix A * by columns:
a ¯ j j * = a j j * j = 1 m a j j *
We obtain the sum vectors by summing the rows:
w j = j = 1 m a ¯ j j *
We normalize the sum vector to obtain the weight vector:
W ¯ j = w j j = 1 m w j
The purpose of consistency checking is to make the evaluation indicators consistent with each other, and the traditional hierarchical analysis method is improved by using the concept of an optimality matrix, which can make the evaluation results automatically meet the consistency requirements.

3.3. The Rationality Test

The combination weighting method is a comprehensive approach that combines subjective empowerment with objective empowerment. To ensure the reasonableness of the portfolio assignment, its consistency needs to be judged. The results of the weights calculated by the two assignment methods for each evaluation index are ranked, where s w ( i ) is the ranked value of s w ( i ) weight value transformation, and o w ( i ) is the ranked value of o w ( i ) weight value transformation. The sorted values are expressed from one to m . The ranking value of the one with the largest evaluation index weight is one and that of the one with the smallest evaluation index weight is m .
The Spearman consistency coefficient reflects the correlation between two sets of variables and is expressed as ρ . In this paper, the Spearman consistency coefficient is used to reflect the consistency between the weights calculated by the IAHP method and the CRITIC method [59]. It is calculated as follows:
ρ = 1 6 m ( m 2 1 ) j = 1 m [ s w ( i ) o w ( i ) ] 2
where ρ takes values in the range of [ 1 , 1 ] . When ρ [ 1 , 0 ) , it indicates that there is no consistency between the weights calculated by the two methods; when ρ = 0 , the correlation between the weights calculated by the two methods is 0; when ρ ( 0 , 1 ] , it indicates that there is consistency between the weights calculated by the two methods, and the combination of the weights can be assigned.

3.4. The Combination Weighting Method

The subjective weight vector is characterized by s w ( i ) , the objective weight vector by o w ( i ) , and the combination weight by c w ( i ) . To ensure that the combination weight values reflect as much subjective and objective evaluation information as possible, based on the principle of minimum discriminative information [60], it should be ensured that the combination weight is as close as possible to the subjective weights and objective weights. We implement the function in Equation (22):
{ min   F = j = 1 m [ c w ( i ) ln c w ( i ) s w ( i ) ] + j = 1 m [ c w ( i ) ln c w ( i ) o w ( i ) ] s . t .   j = 1 m c w ( i ) = 1 ; c w ( i ) > 0
Solving the above problem using the Lagrange multiplier method yields:
c w ( i ) = [ s w ( i ) × o w ( i ) ] 0.5 j = 1 m [ s w ( i ) × o w ( i ) ] 0.5

3.5. UM Theory

3.5.1. Single-Index Measure

Let the domain A 1 , A 2 , , A n consisting of evaluation objects A = { A 1 , A 2 , , A n } become the object space. Any evaluation object A i A ( i = 1 , 2 , , n ) has m evaluation indicators B 1 , B 2 , , B m , and B = { B 1 , B 2 , , B m } . The measurement value of evaluation object A i on evaluation index B j is x i j ( i = 1 , 2 , , n ; j = 1 , 2 , , m ) . Divide x i j into t levels C 1 , C 2 , , C t , where C k is the k ( k = 1 , 2 , , t ) evaluation class, and the effect of class k is better than that of class k + 1 , C k > C k + 1 . Then, we say C = { C 1 , C 2 , , C t } is an ordered partition class of the evaluation space B . If z i j k = z ( x i j C k ) , it means that the measurement x i j belongs to the range of the k t h rank C k and satisfies “non-negative boundedness, normalization, and additivity” of Equations (24)–(26), and z is called an unconfirmed measure, or simply a measure [61]:
0 z ( x i j C k ) 1
    z ( x i j B ) = 1  
z ( x i j l = 1 k C l ) = l = 1 k z ( x i j C l )
The matrix ( z i j k ) m × t is a single-index measure matrix, as shown in Equation (27):
( z i j k ) m × t = [ z i 11 z i 21 z i m 1 z i 12 z i 22 z i m 2 z i 1 t z i 2 t z i m t ]

3.5.2. Multi-Index Measure

If z i k = z ( A i C k ) denotes the degree of affiliation of evaluation object A i to the k t h evaluation level, then we have:
z i k = j = 1 m W j z i j k ( i = 1 , 2 , , n ; k = 1 , 2 , , t )
and z i k satisfies 0 z i k 1 , k = 1 t z i k = 1 . Call z i = [ z i 1 , z i 2 , , z i t ] as the multi-index comprehensive measure evaluation vector of A i [62].

3.6. Durability Evaluation

The confidence criterion was used to analyze the calculated results; λ was set as the confidence level (λ ≥ 0.5) [63], and λ was generally taken as 0.6 or 0.7. If:
k i = min   { k : i = 1 k z i λ , k = 1 , 2 , , t }
then consider that the evaluation object A i belongs to the k 0 t h evaluation level C k 0 .
The process of evaluating the durability of bridge pulling cables is shown in the following Figure 2.

4. Example Application

Jiahui Bridge is located on Shaoxing X107 Yinjiafan–Dalinbu line, bridge center pile number K12+784, across the Hangzhou-Ningbo Canal, with a span arrangement 4 × 20 + 16.6 + 20 + 17.1 + 20 + 4 × 22.5 + 83 + 14.9 + 16 + 3 × 22.5 + 14.9 + 6 × 20 = 560.0 m and the main bridge width of 1.5 m (bollards) + 0.5 m (crash barrier) + 12.0 m (traffic lane) + 0.5 m (crash barrier) + 1.5 m (bollards) + 0.5 m (crash barrier) + 12.0 m (traffic lane) + 0.5 m (crash barrier) + 1.5 m (bollards) = 30.5 m. The flat curve of the main span is a straight line, and the vertical curve is a circular curve with a radius of 3000.0 m and a cross slope of 2% in both directions. The design load standard is as per highway II, the design speed is 60 km/h, there are IV navigation channels under the bridge, and the seismic intensity is of 6 degrees. Figure 3 and Figure 4 show the current situation of Jiahui Bridge.
Through regular inspection, workers found that the bridge part of the sling protection sleeve has local scraping traces, and under the waterproof cover, there is rust corrosion. Part of the sling under the seal anchor end has water seepage calcification and rust corrosion. Although the upper anchor head was corroded by water seepage during construction and dew erosion during use, the anchor cup is basically intact and does not affect normal use. The gas exchange inside and outside the upper conduit is slow, and the condensation in the conduit exposes the anchor, the conduit, and the exposed steel wire in the upper conduit to extended alternating dry and wet periods, which has increased the corrosion rate. The conduit wall has a rust layer, and the exposed steel wire of the sling has thick rust spots. The PE sheath of the pulling sling is not damaged by impact, aging, or cracking, but there are many shallow scratches (Figure 5). There is water vapor intrusion in the PE sheath of the sling and corrosion of the galvanized steel wire. The foam sealant filled with the lower conduit has cracked, and there are gaps between the foam sealant and the lower conduit and between the foam sealant and the PE of the sling, which have failed to prevent rain and water infiltration. The foam sealant has failed to fill the inside of the exposed section of steel wire and could not protect the exposed section of steel wire. The lower conduit steel pipe wall has rusted severely and has more rust pits. The exposed section of the sling wire in the lower conduit has thick rust spots and obvious local rust pits. The wire corrosion is very serious. There are traces of water seepage in the anchor concrete of the lower anchor head, the anchor box is wet and partly waterlogged, and the anchor box and anchor plate are seriously corroded. The sling wire pier head is neatly arranged and well anchored, but it is rusted and corroded.

4.1. Determine the Weight Value of the Durability Index of the Pulling Sling Structure

(1)
We determine the classical domain, the section domain, and the matrix of elements to be evaluated.
The evaluation indexes are divided into levels I to V, where the evaluation criteria are (0.8, 1) for level I, (0.6, 0.8) for level II, (0.4, 0.6) for level III, (0.2, 0.4) for level IV, and (0, 0.2) for level V. The section domains and five classical domains are:
R p = ( P , B j , x p j ) = [ I V B 1 ( 0 , 1 )   B 2 ( 0 , 1 )     B 7 ( 0 , 1 ) ]
R 1 = ( I , B j , x j 1 ) = [ I B 1 ( 0.8 , 1 )   B 2 ( 0.8 , 1 )     B 7 ( 0.8 , 1 ) ]
R 2 = ( II , B j , x j 2 ) = [ II B 1 ( 0.6 , 0.8 )   B 2 ( 0.6 , 0.8 )     B 7 ( 0.6 , 0.8 ) ]
R 3 = ( III , B j , x j 3 ) = [ III B 1 ( 0.4 , 0.6 )   B 2 ( 0.4 , 0.6 )     B 7 ( 0.4 , 0.6 ) ]
R 4 = ( IV , B j , x j 4 ) = [ IV B 1 ( 0.2 , 0.4 )   B 2 ( 0.2 , 0.4 )     B 7 ( 0.2 , 0.4 ) ]
R 5 = ( V , B j , x j 5 ) = [ V B 1 ( 0 , 0.2 )   B 2 ( 0 , 0.2 )     B 7 ( 0 , 0.2 ) ]
After the example analysis, the normalized data of the seven evaluation indicators were obtained with the matter element matrix as:
R 0 = ( P 0 , B j , x j ) = [ P 0 B 1 0.66   B 2 0.61           B 3 B 4 B 5 B 6 B 7 0.55 0.47 0.52 0.45 0.63 ]
(2)
We calculate the correlation.
According to Equations (1)–(8), the correlation degree of each pulling sling durability evaluation index is calculated as follows, taking Index B 1 as an example:
K 11 = K 1 ( x 1 ) = 0.14 0.34 0.14 = 0.29
K 12 = K 2 ( x 1 ) = ( 0.06 ) 0.2 = 0.3
K 13 = K 3 ( x 1 ) = 0.06 0.34 0.06 = 0.15
K 14 = K 4 ( x 1 ) = 0.26 0.34 0.26 = 0.43
K 15 = K 5 ( x 1 ) = 0.46 0.34 0.46 = 0.575
Similarly, the correlations of several other indicators can be obtained, and the correlation matrix of sling durability evaluation indicators is as follows:
[ 0.29 0.33 0.36 0.41 0.37 0.44 0.31 0.3 0.05 0.1 0.22 0.14 0.25 0.15 0.15 0.025 0.25 0.35 0.4 0.25 0.075 0.43 0.35 0.25 0.13 0.2 0.1 0.38 0.575 0.51 0.44 0.36 0.4 0.36 0.54 ]
(3)
We then calculate weights using the CRITIC method.
After normalizing the durability evaluation index correlation matrix obtained in the previous step, the resulting matrix is as follows:
[ 0.32 0.33 0.12 0 0.04 0 0.32 1 1 0.49 0.26 0.32 0.27 1 0.49 0.87 1 1 1 1 0.67 0.16 0.29 0.27 0.37 0.25 0.49 0.22 0 0 0 0.06 0 0.12 0 ]
The obtained judgment matrix is brought into the CRITIC method to calculate Equations (9)–(13), and the value of each indicator layer and the total weight o w ( i ) of the pull sling are obtained as follows:
PE : [ 0.687 , 0.313 ]
Cable   steel   wire : [ 0.354 , 0.646 ]
Anchor   device : [ 0.314 , 0.379 , 0.308 ]
o w ( i ) = [ 0.208 , 0.094 , 0.091 , 0.166 , 0.139 , 0.167 , 0.136 ]

4.2. Calculation Index Weights by the IAHP

According to Table 3, a two-by-two comparison of the seven durability evaluation indexes of the pulling sling [62] was conducted to obtain the judgment matrix, as follows:
A 1 = [ 1 0.5 0.5 2 1 0.5 2 2 1 ]
The PE indicator layer judgment matrix is:
A 2 = [ 1 2 0.5 1 ]
The judgment matrix of the pulling sling body indicator layer is:
A 3 = [ 1 0.5 2 1 ]
The judgment matrix of the anchorage area indicator layer is:
A 4 = [ 1 2 3 0.5 1 0.5 0.33 2 1 ]
The antisymmetric matrix of each judgment matrix is:
B 1 = [ 0 0.30 0.30 0.30 0 10.30 0.30 0.30 0 ]
B 2 = [ 0 0.30 0.30 0 ]
B 3 = [ 0 0.30 0.30 0 ]
B 4 = [ 0 0.30 0.48 0.30 0 0.30 0.48 0.30 0 ]
We solve for the optimal transfer matrix of the antisymmetric matrix:
C 1 = [ 0 0.20 0.40 0.20 0 0.20 0.40 0.20 0 ]
C 2 = [ 0 0.30 0.30 0 ]
C 3 = [ 0 0.30 0.30 0 ]
C 4 = [ 0 0.46 0.32 0.46 0 0.14 0.32 0.14 0 ]
We construct the fitted agreement matrix as follows:
A 1 * = [ 1 0.63 0.40 1.59 1 0.63 2.52 1.59 1 ]
A 2 * = [ 1 2 0.5 1 ]
A 3 * = [ 1 0.5 2 1 ]
A 4 * = [ 1 2.88 2.08 0.35 1 0.72 0.48 1.39 1 ]
According to Equations (18)–(20), the weight vectors of the criterion layer and the indicator layer are calculated as:
[ 0.196 , 0.311 , 0.493 ] , [ 0.667 , 0.333 ] , [ 0.333 , 0.667 ] , [ 0.547 , 0.190 , 0.263 ]
The sw(i) values of guideline layers are listed in Table 4.

4.3. Rationality Test

According to Equation (21), ρ = 0.357 > 0 . The weights obtained by the above two methods meet the consistency requirements, so the combination of the weights can be assigned.
Table 5 shows the ranking results of evaluation index weights.
(4)
We use the combination weighting method.
According to Equation (23), the combined weight value c w ( i ) of each durability evaluation index was obtained after calculation, as shown in Table 6.

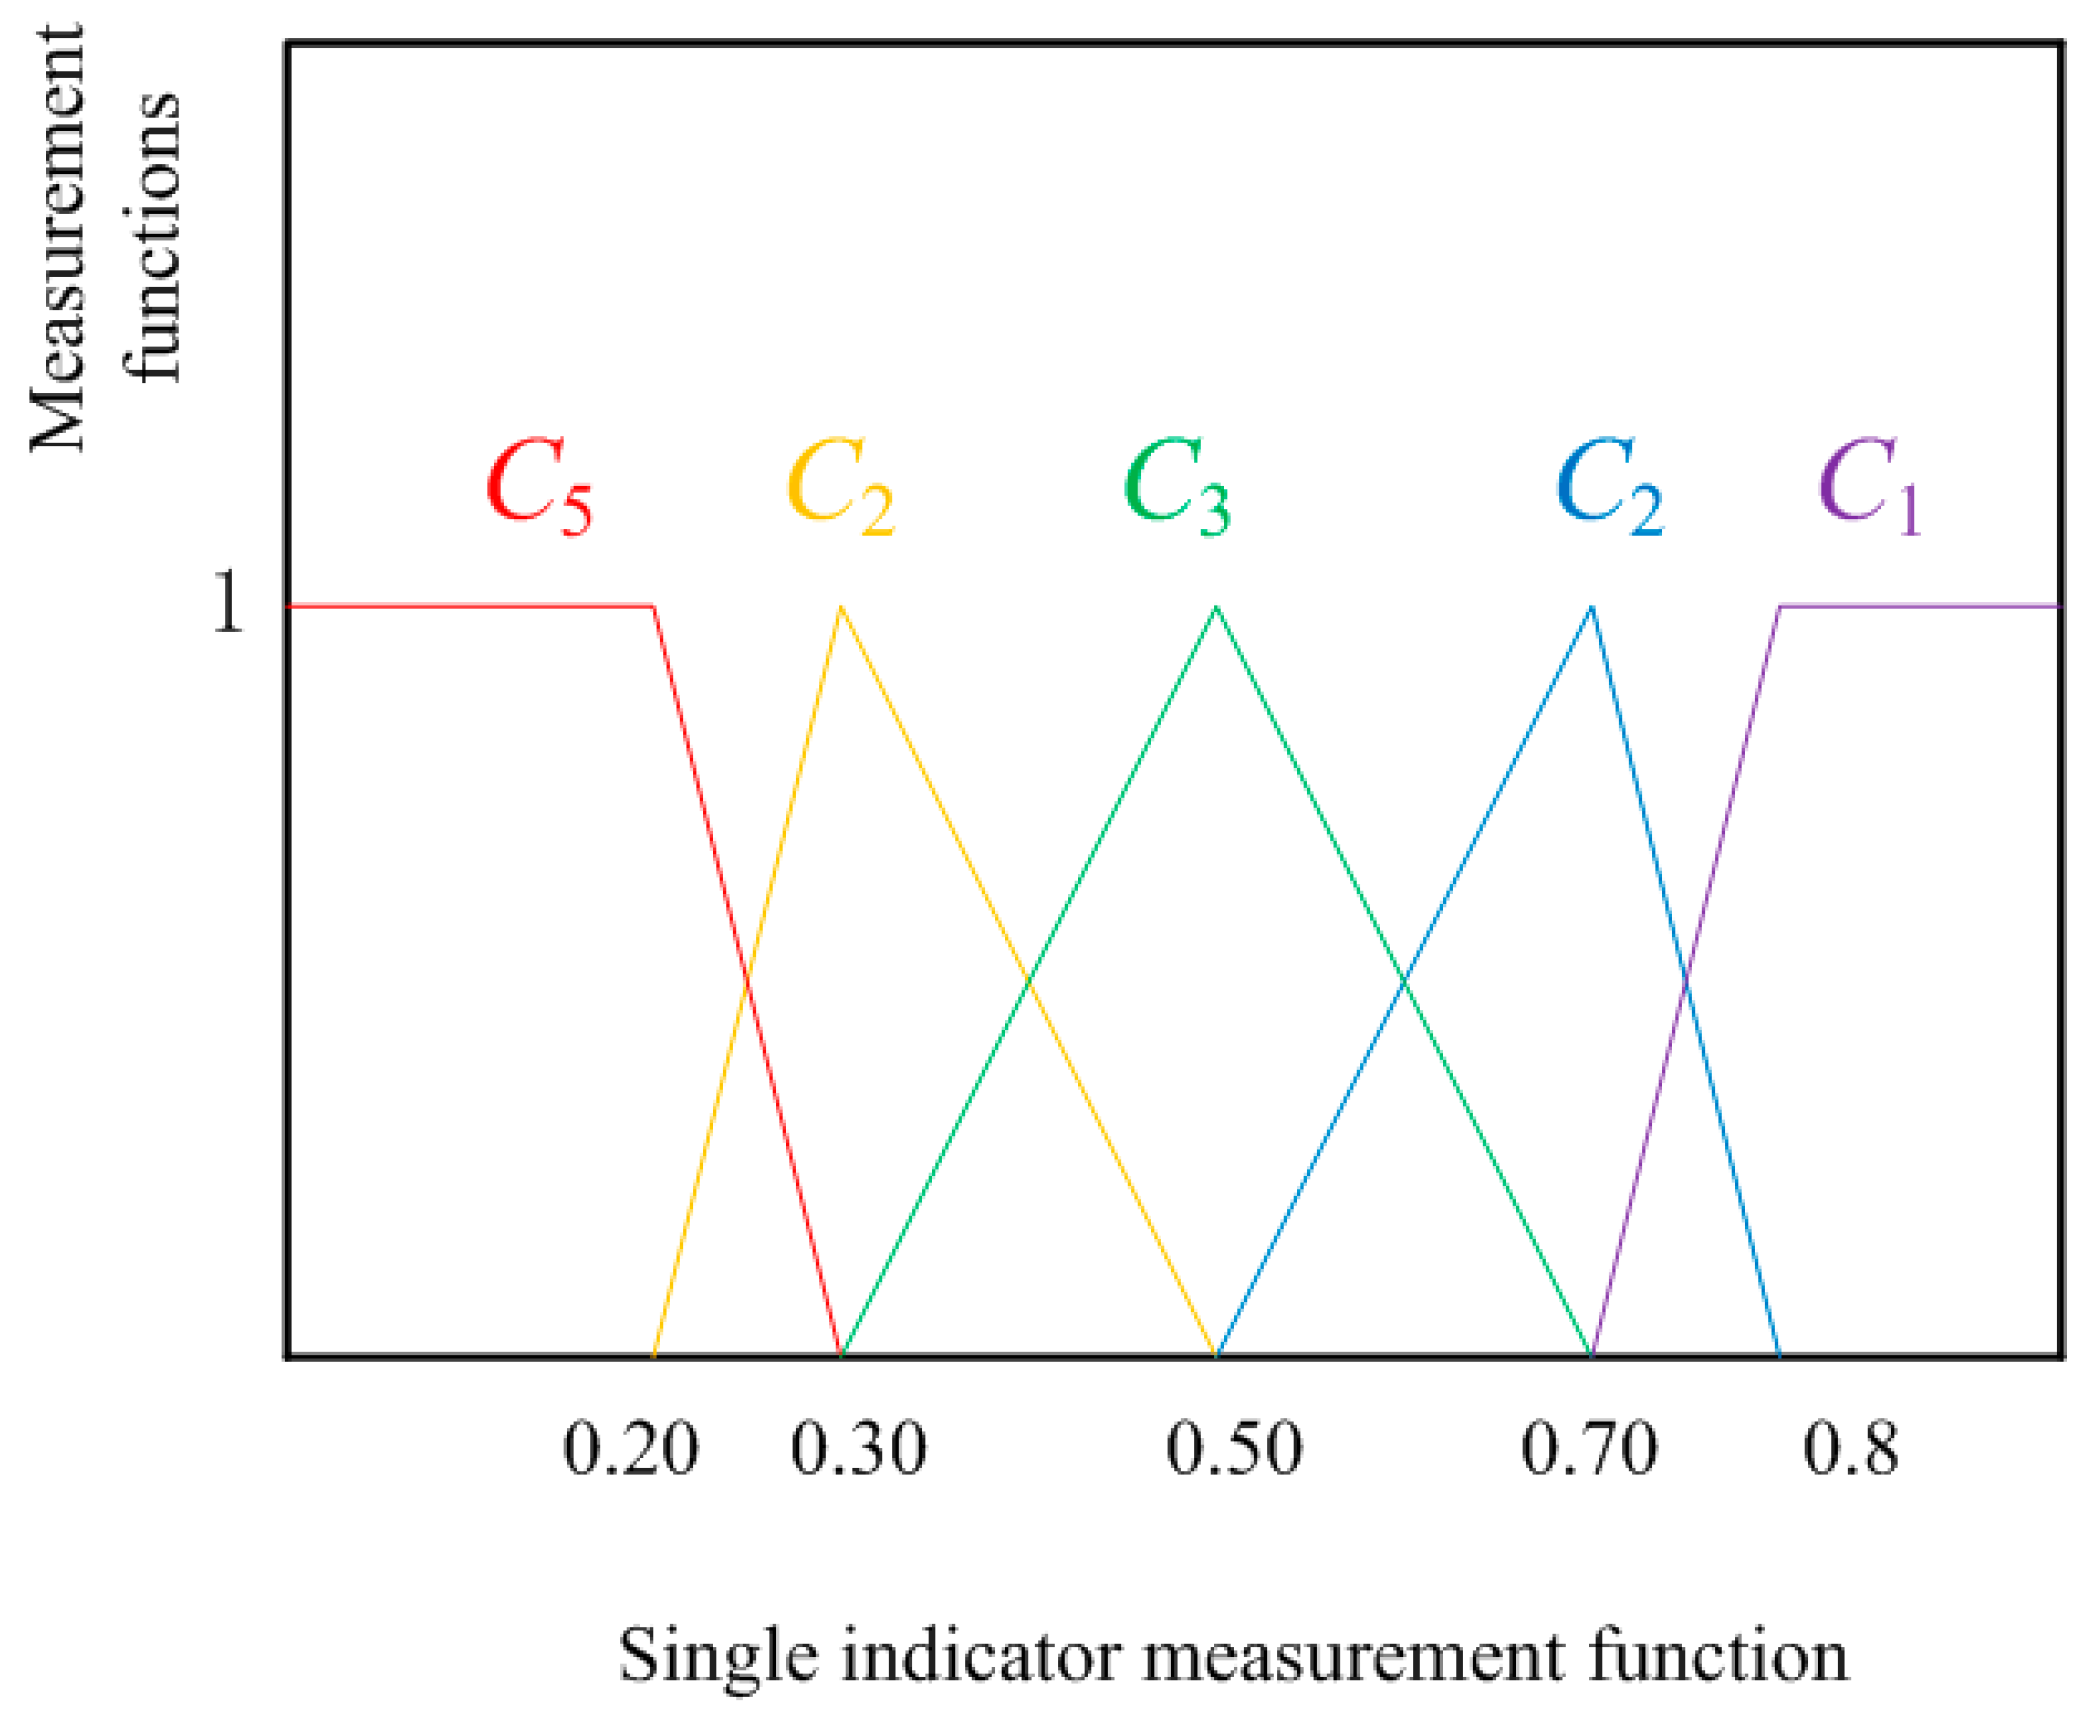
4.4. Determine the Single Indicator Measurement Function and Matrix

Reasonable construction of single-indicator unascertained measure functions is the key to applying unascertained measure theory for durability evaluation. Assuming that the attribute of the evaluation object is e d at the initial stage, the attribute is in state d . When the attribute value changes from e d to e d + 1 , the state of the evaluation object also changes, with the d state tending to weaken and the d + 1 state tending to strengthen. When the evaluation object’s attribute value changes to e d + 1 , the d state of the evaluation object’s attribute disappears completely, i.e., becomes 0, and the d + 1 state of the attribute increases to one. The form of the unascertained measure reflects the change in the state of the evaluation object’s attributes, and the evaluator should construct the corresponding unascertained measure function according to the severity of the state change of the evaluation object [62]. There are four common distributions of unascertained measure functions, linear, parabolic, sinusoidal, and exponential, with linear generally being more widely used [64]. Table 7 shows the graphs and expressions of linear unconfirmed measure functions.
Figure 6 is the graph of single indicator measurement function. The single indicator measure function for the evaluation of the durability of the pulling sling is:
The normalized values of each real measurement are brought into the single indicator measure function to obtain the pull sling single indicator measure matrix as follows:
[ 0 0 0 0 0 0 0 0.8 0.55 0.25 0 0.1 0 0.65 0.2 0.45 0.75 0.85 0.9 0.75 0.35 0 0 0 0.15 0 0.25 0 0 0 0 0 0 0 0 ]

4.5. Determine the Multi-Index Comprehensive Measure Evaluation Vector

On the basis of the single-indicator unascertained measurement matrix and the pulling sling durability evaluation index weight vector obtained in the first three sections, the multi-indicator integrated measurement evaluation vector is calculated by Equation (28) as:
PE : [ 0 , 0.719 , 0.281 , 0 , 0 ]
Cable   steel   wire : [ 0 , 0.086 , 0.816 , 0.098 , 0 ]
Anchor   device : [ 0 , 0.273 , 0.658 , 0.069 , 0 ]
z 1 k = [ 0 , 0.313 , 0.627 , 0.060 , 0 ]

4.6. Durability Evaluation

According to the multi-indicator comprehensive evaluation vector of the pulling sling in the above equation and the confidence identification criterion, such as taking λ = 0.7, the durability evaluation result for each layer and the pulling sling as a whole can be obtained. The results show that the durability level of the pulling sling is level III, which is consistent with the actual situation of the pulling sling of this bridge. It shows that the durability of the bridge’s pulling sling is average, which means there is a moderate degree of damage, and the bridge can still provide normal use functions. For the outer PE sheathing, combined with the results of regular inspection, it is necessary to repair the scratched part to ensure its protective function and prevent water and its harmful substances from entering and corroding the wire of the cable body. The drainage in the anchorage area needs to be stringently addressed to prevent further corrosion. Oil-based anti-corrosion substances can be injected into the internal void of the pulling cable to ensure the normal use of the cable. The evaluation results of pulling sling durability are shown in Table 8.

5. Comparison between Existing and Proposed Method

5.1. SPA Method

SPA is a relatively new comprehensive evaluation method. The essence of set-pair analysis is to analyze the relation and transformation of things from the same, different, and anti-aspects in the definite and uncertain system. One of the equations to calculate the degree of congruence, dissimilarity, and inverse association μ established under the model of the index to be evaluated is as follows [65]:
μ = a + b i + c j = ( N 1 N ) + ( N 2 N ) i + ( N 3 N ) j
In the above equation, N , N 1 ,   N 2 ,   and   N 3 denote the total number of features, the number of common features, the number of neither common nor opposing features, and the number of mutually opposing features, respectively, of the two sets in the set pair, where N = N 1 + N 2 + N 3 , which also requires that a + b + c = 1 . In the equation, a , b ,   and   c are called the homogeneity, difference, and opposition degrees, respectively, of the discussed sets in the specified problem context, reflecting the positive, negative, and uncertain trends of each set in the set pair; i denotes the difference degree coefficient, taking values in the range [–1,1]. Moreover, j is the opposition degree coefficient and j = 1 . The degree of connection is a quantitative description of the certainty and uncertainty of the system, reflecting the uncertainty of the system from the same, different, and opposite aspects of the object to be evaluated. It is also called the ternary connection number.
In the comprehensive evaluation of the system, it is sometimes necessary to divide the evaluation level of the object to be evaluated more carefully, which may be 4, 5, or more levels, and then the t-element linkage number can be used. Its general form is:
μ = a + b 1 i 1 + b 2 i 2 + + b t i t + c j
The steps of the comprehensive evaluation based on SPA are as follows:
(1)
We determine the evaluation index and evaluation level.
With n objects to be evaluated, A 1 , A 2 , , A n form the space A = { A 1 , A 2 , , A n } ; each indicator characterizing the attributes of the object to be evaluated forms the indicator set B = { B 1 , B 2 , , B m } . The evaluation criteria level set is C = { C 1 , C 2 , , C t } , where C 1 , C 2 , , C t constitute an ordered partition of attributes, and C 1 < C 2 < < C t . Then, the evaluation criteria of each index are determined and can be written in the form of evaluation the criteria matrix:
C 1 C 2 C t B 1 B p B m [ a 11 a 12 a 1 t a p 1 a p 2 a p t a m 1 a m 2 a m t ]
In the evaluation matrix, to satisfy a p 1 < a p 2 < < a p t or a p 1 > a p 2 > > a p t , 1 p m .
(2)
We determine the number of t-element links for comprehensive evaluation of each index.
We define the number of t -element links of the comprehensive evaluation of the indicator B p of the object to be evaluated A h ( 1 h n ) as:
μ p = r p 1 + r p 2 i 1 + r p 3 i 2 + r p ( t 1 ) i t 2 + r p t j
The above equation with r p k [ 0 , 1 ]   ( 1 p m , 1 k t ) is the connectedness component of the evaluation index B p relative to the rank C k .
Let the measurement of indicator B p be l p , a p 1 < a p 2 < < a p t . Then:
a. when l p a p 1 :
μ p = 1 + 0 i 1 + 0 i 2 + + 0 i t 2 + 0 j
b. when a p 1 l p a p 2 :
μ p = | l p a p 2 | | a p 1 a p 2 | + | l p a p 1 | | a p 1 a p 2 | i 1 + 0 i 2 + + 0 i t 2 + 0 j
c. when a p s l p a p ( s + 1 ) ( s = 2 , 3 , t 2 ) :
μ p = 0 + + | l p a p ( s + 1 ) | | a p s a p ( s + 1 ) | i s 1 + | l p a p s | | a p s a p ( s + 1 ) | i s + + 0 i t 2 + 0 j
d. when a p ( t 1 ) l p a p t :
μ p = 0 + + 0 i t 3 + | l p a p t | | a p ( t 1 ) a p t | i t 2 + | l p a p ( t 1 ) | | a p ( t 1 ) a p t | j
e. when a p t l p :
μ p = 0 + 0 i 1 + 0 i 2 + + 0 i t 2 + 1 j
In all the above five cases, r p k satisfies k = 1 t r p k = 1 .
(3)
We determine the number of t -element links for the total index.
After solving for the above number of links, the number of t-element links for the comprehensive evaluation of the corresponding total index is:
μ p = r 1 + r 2 i 1 + r 3 i 2 + r t 1 i t 2 + r t j
In the above equation, r k = p = 1 m w p r p k , ( 1 p m , 1 k t ) , and w p is the weight of evaluation index B p in the index system, which satisfies p = 1 m w p = 1 .
The weights in the contrastive analysis are calculated by using the topological theory of physical elements combined with the EWM. The EWM is a commonly used weighting method. The greater the degree of dispersion, the greater the degree of differentiation, and the more the information that can be derived [66]. The steps for determining the entropy weight are as follows:
Assuming that there are t evaluation levels and m evaluation indicators for each object, the data in the correlation matrix ( K j k ) m × t are normalized to the range [ 0 ,   1 ] to create the normalization matrix ( r j k ) m × t . The entropy H j [63] of each evaluation index is as follows:
H j = 1 ln t k = 1 t f j k ln f j k
where f j k indicates the weight of each indicator, and the formula is as follows:
f j k = ( 1 + r j k ) / k = 1 t ( 1 + r j k )
Then, the weights W j of the evaluation indicators are:
W j = ( 1 H j ) / j = 1 m ( 1 H j )
where 0 W j 1 ;   j = 1 m W j = 1 .
The judgment matrix obtained from the aforementioned calculation is brought into the EWM calculation Equations (39)–(41), and the W j of each durability evaluation index is obtained as follows:
W j = [ 0.132 , 0.144 , 0.142 , 0.151 , 0.156 , 0.142 , 0.133 ]
Table 9 shows the value of W j in different layers. And lists the standard split point and measured value for each grage.
According to the weight values of the durability evaluation indexes of the pulling sling calculated in the previous sections and the number of five element links of the secondary indexes of Equations (29)–(38), we have:
μ 1 = 0 + 12 15 i 1 + 3 15 i 2 + 0 i 3 + 0 j = 0 + 0.8 i 1 + 0.2 i 2 + 0 i 3 + 0 j
μ 2 = 5 15 + 10 15 i 1 + 0 i 2 + 0 i 3 + 0 j = 0.333 + 0.667 i 1 + 0 i 2 + 0 i 3 + 0 j
μ 3 = 0 + 5 15 i 1 + 10 15 i 2 + 0 i 3 + 0 j = 0 + 0.333 i 1 + 0.667 i 2 + 0 i 3 + 0 j
μ 4 = 0 + 0 i 1 + 5 15 i 2 + 10 15 i 3 + 0 j = 0 + 0 i 1 + 0.333 i 2 + 0.667 i 3 + 0 j
μ 5 = 0 + 3 15 i 1 + 12 15 i 2 + 0 i 3 + 0 j = 0 + 0.2 i 1 + 0.8 i 2 + 0 i 3 + 0 j
μ 6 = 0 + 0 i 1 + 0 i 2 + 10 15 i 3 + 5 15 j = 0 + 0 i 1 + 0 i 2 + 0.667 i 3 + 0.333 j μ 7 = 10 15 + 5 15 i 1 + 0 i 2 + 0 i 3 + 0 j = 0.667 + 0.333 i 1 + 0 i 2 + 0 i 3 + 0 j
The number of five element links for the total index is:
μ = 0.137 + 0.325 i 1 + 0.296 i 2 + 0.195 i 3 + 0.047 j
According to the above equation, using the confidence identification criterion, taking λ = 0.7 , we can obtain 0.137 + 0.325 + 0.296 = 0.757 > 0.7 , and the durability evaluation level is III.

5.2. The Matter Element Extension (MEE) Method

We calculate the total correlation:
K k ( P 0 ) = j = 1 m W j K k ( x j )
K k ( P 0 ) is the correlation degree of the system to be evaluated P 0 with respect to rank k , where W j is the value of the weight corresponding to its correlation function. The value of W j is taken as the value of the weight calculated using the CRITIC method.
We determine the evaluation level:
K k = max   K k ( P 0 )
Then, the target evaluation level is K k .
According to Equation (42), the total correlation of the pulling sling structure can be calculated as follows:
K k ( P 0 ) = [ 0.359 , 0.019 , 0.134 , 0.264 , 0.456 ]
According to Equation (43), the durability evaluation grade of the pulling sling is level III.

6. Discussion

Table 10 and Table 11 compare weight results and evaluation results, respectively. According to Table 10, rope body wire corrosion and anchor damage take up a larger weight value and have a greater impact on the durability of the pulling sling. This is mainly due to the fact that as the use of the sling increases over the years, moisture gradually invades the interior of the sling and reacts electrochemically with the wire of the sling body. At the same time, due to the vibration of the pulling sling, the condensation formed converges along the rope body steel wire to the anchorage area, causing the anchorage to rust. The effective cross section of the wire is reduced when the wire is corroded. As the corrosion intensifies, the wire fractures, even leading to broken ropes. According to the comparative study in Table 11, the evaluation results of the durability of the pulling cable structure calculated on the basis of CWM-UM theory are the same as those calculated by the SPA method and MEE theory, and they are consistent with the actual situation of the pulling cable of this bridge. The evaluation results obtained by the three methods show the level of the bridge to be III. It means that the bridge has a moderate degree of damage and can still maintain the normal function of use. However, the necessary inspection, maintenance, and reinforcement still need to be performed to prevent further corrosion that may lead to the sling breaking. It also further confirms the accuracy of the CWM-UM-theory-based bridge pulling cable durability evaluation and calculation proposed in this paper. In addition, the evaluation model of the bridge pulling sling using CWM-UM theory can combine the advantages of subjective and objective assignment methods, the calculation process is relatively simple, and the practical application is relatively convenient.

7. Conclusions

Durability evaluation of bridge sling structures is an important link to ensure the normal use of sling bridges, and it is of great significance to propose a reasonable and effective sling durability evaluation method for bridge sling inspection and maintenance. In this paper, on the basis of a large amount of literature, a CWM-UM theory was used to evaluate the durability of in-service bridge pulling cable structures, and the main conclusions are as follows:
(1)
According to the damage mechanism of pulling sling durability, the three-layer durability evaluation index system of the pulling sling structure is established. Seven indexes were selected for the durability evaluation of the pulling sling: PE cracking, PE scratching, corrosion of the rope body, damage to the rope body, damage to the anchorage, damage to the conduit, and damage to the vibration damping device.
(2)
There are uncertainties in the factors affecting the durability of pulling sling structures that are difficult to describe quantitatively. The combined weighting method is applied, combining the advantages of IAHP and CRITIC methods to compensate for the bias of a single assignment method. Through the theory of unascertained measure, the multi-indicator comprehensive evaluation vector of pulling sling is obtained, and the results are analyzed according to the confidence criterion.
(3)
On the basis of combined weighting method-unascertained-measure theory, a complete durability evaluation model of the pulling sling was established. Taking the Shaoxing Jiahui Bridge pulling sling structure as an example, the durability evaluation was carried out, and the evaluation result was calculated to be level III, which basically matches the actual situation of the bridge. It shows the applicability of the model and provides a new method for the durability evaluation of a pulling cable structure.
(4)
Through a comparative study, it was found that the final evaluation results of the three methods are consistent, which proves that the CWM-UM method can make a more accurate evaluation of the durability of the pulling cable structure, and it has the advantages of four theories, the MEE method, the CRITIC method, the IAHP method, and UM theory, with a concise calculation process and more accurate results. It shows the superiority of the CWM-UM method in durability evaluation. In practical application, the method to improve the durability of the cable body can be stated more accurately according to the evaluation results. The proposal and rational use of this method will contribute to the construction of resource-saving highways and the realization of sustainable development.
This paper researched the durability evaluation system and the evaluation method for the pulling cable structure, but limited by the data collection and the knowledge level of the author, there are still some problems that need to be studied and improved upon in the future.
(1)
Since different bridges have different forms of pulling and slinging structures, a more comprehensive durability evaluation system can be established for different forms of pulling and slinging structures to make the evaluation results more reasonable and realistic.
(2)
The durability evaluation indexes established in this paper mainly rely on literature collection and theoretical analysis. In subsequent studies, these can be combined with finite element analysis software to identify the factors affecting the durability of the pulling sling structure through real bridge simulation. We can use this standard to establish the evaluation index.
(3)
Because of the special structural form and material characteristics of the pulling cable structure compared to the concrete structure, the selection of the environmental index and durability index eigenvalues in this paper is preliminary and rough, and further refinement and research are needed to ensure that the calculation of environmental index eigenvalues and durability index eigenvalues is more accurate and comprehensive.

Author Contributions

Conceptualization, Q.L.; methodology, Y.Y.; validation, T.Z.; formal analysis, Q.L.; investigation, Y.Y.; resources, Q.L.; data curation, T.Z.; writing—original draft preparation, Y.Y.; writing—review and editing, T.Z.; supervision, Q.L. All authors have read and agreed to the published version of the manuscript.

Funding

This research received no external funding.

Institutional Review Board Statement

Not applicable.

Informed Consent Statement

Not applicable.

Data Availability Statement

All the data used in this study can be found in the article.

Conflicts of Interest

The authors declare no conflict of interest.

References

  1. Stallings, J.M.; Frank, K.H. Stay-Cable Fatigue Behavior. J. Struct. Eng. 1991, 117, 936–950. [Google Scholar] [CrossRef]
  2. Takena, K.; Miki, C.; Shimokawa, H.; Sakamoto, K. Fatigue Resistance of Large Diameter Cable for Cable Stayed Bridges. J. Struct. Eng. 1992, 118, 701–715. [Google Scholar] [CrossRef]
  3. Matteo, J.; Deodatis, G.; Billington, D.P. Safety Analysis of Suspension-Bridge Cables: Williamsburg Bridge. J. Struct. Eng. 1994, 120, 3197–3211. [Google Scholar] [CrossRef]
  4. Hamilton, I.H.R.; Breen, J.E.; Frank, K.H. Bridge Stay Cable Corrosion Protection. I: Grout Injection and Load Testing. J. Bridg. Eng. 1998, 3, 64–71. [Google Scholar] [CrossRef]
  5. Hamilton, I.H.R.; Breen, J.E.; Frank, K.H. Bridge Stay Cable Corrosion Protection. II: Accelerated Corrosion Tests. J. Bridg. Eng. 1998, 3, 72–81. [Google Scholar] [CrossRef]
  6. Barton, S.C.; Vermaas, G.W.; Duby, P.F.; West, A.C.; Betti, R. Accelerated Corrosion and Embrittlement of High-Strength Bridge Wire. J. Mater. Civ. Eng. 2000, 12, 33–38. [Google Scholar] [CrossRef]
  7. Mayrbaurl, R.M.; Camo, S. Cracking and Fracture of Suspension Bridge Wire. J. Bridg. Eng. 2001, 6, 645–650. [Google Scholar] [CrossRef]
  8. Camo, S. Probabilistic Strength Estimates and Reliability of Damaged Parallel Wire Cables. J. Bridg. Eng. 2003, 8, 297–311. [Google Scholar] [CrossRef]
  9. Haight, R.Q.; Billington, D.P.; Khazem, D. Cable Safety Factors for Four Suspension Bridge. J. Bridg. Eng. 1997, 2, 157–167. [Google Scholar] [CrossRef]
  10. Faber, M.; Engelund, S.; Rackwitz, R. Aspects of parallel wire cable reliability. Struct. Saf. 2003, 25, 201–225. [Google Scholar] [CrossRef]
  11. Cremona, C. Probabilistic approach for cable residual strength assessment. Eng. Struct. 2002, 25, 377–384. [Google Scholar] [CrossRef]
  12. Atienza, J.M.; Ruiz-Hervias, J.; Elices, M. The Role of Residual Stresses in the Performance and Durability of Prestressing Steel Wires. Exp. Mech. 2012, 52, 881–893. [Google Scholar] [CrossRef] [Green Version]
  13. Atienza, J.M.; Elices, M.; Ruiz-Hervias, J.; Caballero, L.; Valiente, A. Residual stresses and durability in cold drawn eutectoid steel wires. Met. Mater. Int. 2007, 13, 139–143. [Google Scholar] [CrossRef]
  14. Luo, X.Y.; Li, Z. Study on mechanical properties of unbonded prestressing strand after rusting. J. China Railw. Soc. 2008, 2, 108–112. [Google Scholar]
  15. Chen, X.-L. Experimental Study on Corrosion Characteristics and Mechanical Properties of Bridge Cable Wires. Master’s Thesis, Southeast University, Nanjing, China, March 2015. [Google Scholar]
  16. Wu, J. Study on the Damage Classification and the Fatigue Life of Cable Wire. Master’s Thesis, Changsha University of Science & Technology, Changsha, China, April 2015. [Google Scholar]
  17. Li, X.Z.; Xie, X.; Pan, X.Y.; Sun, W.Z.; Zhu, H.H. Experimental study on fatigue performance of rusted high-strength steel wire for arch bridge boom. China Civ. Eng. J. 2015, 48, 68–76. [Google Scholar] [CrossRef]
  18. Ye, H.W.; Wang, Y.Q.; Sun, P.P. Fatigue strength test study of corroded galvanized steel wire for bridge cables. World Bridges 2013, 41, 44–49. [Google Scholar]
  19. Wu, C.; Jiang, C.; Jiang, X. Fatigue test of high-strength steel wire for pre-corroded bridge cables. J. Tongji Univ. (Nat. Sci.) 2018, 46, 1622–1627+1695. [Google Scholar]
  20. Chen, C.-C.; Wu, W.-H.; Chen, S.-Y.; Lai, G. A novel tension estimation approach for elastic cables by elimination of complex boundary condition effects employing mode shape functions. Eng. Struct. 2018, 166, 152–166. [Google Scholar] [CrossRef]
  21. Bonopera, M.; Chang, K.-C.; Chen, C.-C.; Lin, T.-K.; Tullini, N. Bending tests for the structural safety assessment of space truss members. Int. J. Space Struct. 2018, 33, 138–149. [Google Scholar] [CrossRef]
  22. Wu, W.-H.; Chen, C.-C.; Chen, Y.-C.; Lai, G.; Huang, C.-M. Tension determination for suspenders of arch bridge based on multiple vibration measurements concentrated at one end. Measurement 2018, 123, 254–269. [Google Scholar] [CrossRef]
  23. Chen, A.; Yang, Y.; Ma, R.; Li, L.; Tian, H.; Pan, Z. Experimental study of corrosion effects on high-strength steel wires considering strain influence. Constr. Build. Mater. 2020, 240, 117910. [Google Scholar] [CrossRef]
  24. Miao, C.; Li, R.; Yu, J. Effects of characteristic parameters of corrosion pits on the fatigue life of the steel wires. J. Constr. Steel Res. 2019, 168, 105879. [Google Scholar] [CrossRef]
  25. Yu, X.; Yao, G.; Gu, L.; Fan, W. Numerical and Experimental Study on the Steel Strands under the Coupling Effect of a Salt Spray Environment and Cyclic Loads. Materials 2020, 13, 736. [Google Scholar] [CrossRef] [Green Version]
  26. Wang, Y.; Zhang, W.; Zheng, Y. Experimental Study on Corrosion Fatigue Performance of High-Strength Steel Wire with Initial Defect for Bridge Cable. Appl. Sci. 2020, 10, 2293. [Google Scholar] [CrossRef] [Green Version]
  27. Jie, Z.; Berto, F.; Susmel, L. Fatigue behaviour of pitted/cracked high-strength steel wires based on the SED approach. Int. J. Fatigue 2020, 135, 105564. [Google Scholar] [CrossRef]
  28. Zhang, L.; Liang, Z.; Li, S. Effect of current density on the cathodic protection efficiency and mechanical properties of pre-stressed high-strength steel wires for stay cable. Constr. Build. Mater. 2021, 314, 125671. [Google Scholar] [CrossRef]
  29. Hu, X.; Ji, X.; Chen, Z.N. Expert system design for safety and durability assessment of cable-stayed bridges. Chin. J. Appl. Mech. 1998, 4, 125–129. [Google Scholar]
  30. Sugimoto, I.; Kobayashi, Y.; Ichikawa, A. Durability Evaluation Based on Buckling Characteristics of Corroded Steel Deck Girders. Q. Rep. RTRI 2006, 47, 150–155. [Google Scholar] [CrossRef] [Green Version]
  31. Chen, W.; Dan, D.H.; Sun, L.M. Safety and durability assessment of cable-supported bridge by using ANFIS. In Proceedings of the International Conference on Health Monitoring of Structure, Nanjing, China, 16–18 October 2007; Volume 1, pp. 725–731. [Google Scholar]
  32. Liu, S.Y.; Yang, Z.Y.; Qu, J.B. Preventive measures to ensure durability of cable-stayed bridges. Eng. Struct. Integr. Res. Dev. Appl. 2007, 1, 1350–1352. [Google Scholar]
  33. Liu, X.Z.; Zhang, C.R.; Chen, S.S. Cables durability evaluation model based on fuzzy neural network. J. East China Jiaotong Univ. 2010, 27, 8–12. [Google Scholar]
  34. Ma, J.-B.; Pu, Q.; Song, D.-W.; Yang, G.-Q. Fuzzy nearness comprehensive assessment of durability of existing half-through and through concrete arch bridges. J. Highw. Transp. Res. Dev. 2007, 25, 79–84. [Google Scholar]
  35. Zhu, P.H.; He, X.; Jin, W.L. Research on the application of random layered sampling theory to evaluating durability of existing concrete bridge structures. Int. J. Struct. Eng. 2010, 1, 188. [Google Scholar] [CrossRef]
  36. Liu, J.Z.; Xu, J.Y.; Bai, E.L.; Gao, Z.G. Durability Evaluation Analysis of Reinforced Concrete Structures Based on Extension Method. Adv. Mater. Res. 2010, 163–167, 3354–3358. [Google Scholar] [CrossRef]
  37. Zheng, F.; Wang, Y.; Zhang, P.Y. The Application of Fuzzy Synthesis Evaluation Method on Assessing Bridge Durability. In Proceedings of the Global Conference on Civil, Structural and Environmental Engineering/3rd International Symposium on Multi-field Coupling Theory of Rock and Soil Media and its Applications, China Three Gorges University, Yichang, China, 20–21 October 2012. [Google Scholar]
  38. Tang, Y.B.; Chen, L.; Wang, S.N.; Fan, Z.H. Evaluation of the Corrosion Risk on the Immersed Tunnel of the Hongkong-Zhuhai-Macao Bridge. Appl. Mech. Mater. 2012, 256–259, 1075–1081. [Google Scholar] [CrossRef]
  39. He, L.; Qian, Y.J. Application of Fuzzy Comprehensive Evaluation Method in Long-Span Arch Bridge Damaged in Wartime. In Proceedings of the 2nd International Conference on Advanced Engineering Materials and Technology (AEMT), Zhuhai, China, 6–8 July 2012. [Google Scholar] [CrossRef]
  40. Ren, Y.; Tang, H.H.; Huang, Q. Research on Fuzzy Comprehensive Evaluation of Cable-Stayed Bridges. Sustain. Cities Dev. Environ. Prot. 2013, 316-363, 1119. [Google Scholar] [CrossRef]
  41. Chen, Z.; Li, X.; Chen, J.Y.; Wei, Y.L.; Xu, F.; Liu, X.; Tao, B.X. Health Evaluation for Durability of Harbor Engineering in South China Based on AHP. Adv. Mater. Res. 2013, 842, 489–493. [Google Scholar] [CrossRef]
  42. Wang, Q.; Xie, F.X.; Hu, X.Y. A method for evaluating the durability of diagonal cables. World Bridges 2015, 43, 79–83. [Google Scholar]
  43. Zhao, L.; Cheng, L. Application of uncertainty-based hierarchical analysis in bridge safety assessment. J. Luoyang Inst. Sci. Technol. (Nat. Sci. Ed.) 2017, 27, 20–23. [Google Scholar]
  44. Lin, L. FNN-Based Reinforced Concrete Bridge Evaluation Model. In Proceedings of the International Conference on Smart Grid and Electrical Automation, Changsha, China, 27–28 May 2017; pp. 477–480. [Google Scholar] [CrossRef]
  45. Cai, J.; Dong, F.; Luo, Z. Durability of Concrete Bridge Structure under Marine Environment. J. Coast. Res. 2018, 83, 429–435. [Google Scholar] [CrossRef]
  46. Liu, Y.Y.; Guo, Z.Z.; Li, Y.Q. Road slope hazard evaluation model based on entropy power set pair analysis and vehicle-mounted laser scanning. Rock Soil Mech. 2018, 39, 131–141+156. [Google Scholar]
  47. Li, Z.K.; Li, W.; Ge, W. Environmental impact assessment of dam failure based on set-pair analysis-variable fuzzy set coupling method. J. Tianjin Univ. Sci. Technol. 2019, 52, 269–276. [Google Scholar]
  48. Liang, L.; Xing, G.H.; Ren, Y.P. Reliability evaluation method of inclined ropes based on cloud theory. J. Northeast. Univ. (Nat. Sci.) 2019, 40, 585–589. [Google Scholar]
  49. He, W.; Sun, X.; Li, C. Research on Durability Evaluation Method of Bridge Slings Based on Set Pair Analysis. In IOP Conference Series Earth and Environmental Science; IOP Publishing: Bristol, UK, 2020; Volume 474. [Google Scholar] [CrossRef]
  50. Liu, F.; Yi, W. Durability Evaluation Method of Reinforced Concrete Beam Bridge Based on Extension Interval Number Theory. In IOP Conference Series Earth and Environmental Science; IOP Publishing: Bristol, UK, 2020; Volume 510. [Google Scholar] [CrossRef]
  51. Chinese Standard JTG/T H21-2011; China’s Standards for Technical Condition Evaluation of Highway Bridges. National Standards of the People’s Republic of China: Beijing, China, 2011.
  52. Liang, G.; Niu, D.; Liang, Y. Core Competitiveness Evaluation of Clean Energy Incubators Based on Matter-Element Extension Combined with TOPSIS and KPCA-NSGA-II-LSSVM. Sustainability 2020, 12, 9570. [Google Scholar] [CrossRef]
  53. Luo, X.; Wang, Z.; Lu, L.; Guan, Y. Supply Chain Flexibility Evaluation Based on Matter-Element Extension. Complexity 2020, 2020, 8057924. [Google Scholar] [CrossRef]
  54. Cai, W. Topology and its applications. Chin. Sci. Bull. 1998, 673–682. Available online: https://kns.cnki.net/kcms/detail/detail.aspx?dbcode=CJFD&dbname=CJFD9899&filename=KXTB199907000&uniplatform=NZKPT&v=q5wWatQV0E66C_n5vjpboWCYMTm8elp7X_y1UyFoKGtPz5-g3UMJljkjR2BgNuFj (accessed on 16 May 2022).
  55. Cai, W. Overview of Topology. Syst. Eng. Theory Pract. 1998, 77–85. Available online: https://kns.cnki.net/kcms/detail/detail.aspx?dbcode=CJFD&dbname=CJFD9899&filename=XTLL801.017&uniplatform=NZKPT&v=sUt7xjfRZbhWCHiXl-iAVvAL3oPrRm5NUQkfBVLHjMOh91vI0eJDebUjA2hYqvT_ (accessed on 16 May 2022).
  56. Hu, Y.-S.; Zhu, C.-L. Credit Evaluation Model of Road Transportation Enterprises Based on the Combination Weighting Method. Math. Probl. Eng. 2021, 2021, 6637164. [Google Scholar] [CrossRef]
  57. Xu, C.; Ke, Y.; Li, Y.; Chu, H.; Wu, Y. Data-driven configuration optimization of an off-grid wind/PV/hydrogen system based on modified NSGA-II and CRITIC-TOPSIS. Energy Convers. Manag. 2020, 215, 112892. [Google Scholar] [CrossRef]
  58. Li, Q.; Zhou, H.; Zhang, H. Durability evaluation of highway tunnel lining structure based on matter element extension-simple correlation function method-cloud model: A case study. Math. Biosci. Eng. 2021, 18, 4027–4054. [Google Scholar] [CrossRef]
  59. Li, X.; Jiangwen, Q.; Tang, J.; Pu, Q.S.; Xia, X.B.; Xu, K. Study on combination weighting method–TOPSIS method-based risk assessment of water in-rush in construction of North Tianshan Mountain Tunnel. Water Resour. Hydropower Eng. 2019, 50, 114–119. [Google Scholar]
  60. Huang, R.; Zhang, F.X. A comprehensive water quality evaluation method based on an optimized set-pair analysis model. J. Yangtze River Sci. Res. Inst. 2016, 33, 6–10+17. [Google Scholar]
  61. Wu, S.; Du, X.; Yang, S. Rock Mass Quality Evaluation Based on Unascertained Measure and Intuitionistic Fuzzy Sets. Complexity 2020, 2020, 5614581. [Google Scholar] [CrossRef]
  62. Zhao, K.; Wang, Q.; Yan, Y.; Wang, J.; Zhao, K.; Cao, S.; Zhang, Y. Geological Structural Surface Evaluation Model Based on Unascertained Measure. Geofluids 2019, 2019, 7. [Google Scholar] [CrossRef]
  63. Li, Y.; Yang, J.; Shi, H.; Li, Y. Assessment of sustainable urban transport development based on entropy and unascertained measure. PLoS ONE 2017, 12, e0186893. [Google Scholar] [CrossRef] [PubMed]
  64. Huang, C.; Tian, S.; Li, Q.; Huang, J. Evaluation of Rock Quality of Tunnel Wall Rock Based on Rough Set Theory and Unascertained Measurement Theory. Math. Probl. Eng. 2018, 2018, 3571028. [Google Scholar] [CrossRef]
  65. Chen, W.; Zhang, G.; Jiao, Y.; Wang, H. Unascertained Measure-Set Pair Analysis Model of Collapse Risk Evaluation in Mountain Tunnels and Its Engineering Application. KSCE J. Civ. Eng. 2020, 25, 451–467. [Google Scholar] [CrossRef]
  66. Zhu, Y.; Tian, D.; Yan, F. Effectiveness of Entropy Weight Method in Decision-Making. Math. Probl. Eng. 2020, 2020, 3564835. [Google Scholar] [CrossRef]
Figure 1. Comprehensive evaluation system for the durability of bridge pulling and lifting cable structures.
Sustainability 14 07147 g001
Figure 2. Flowchart of durability evaluation of pulling sling.
Sustainability 14 07147 g002
Figure 3. Front photo of Jiahui Bridge.
Sustainability 14 07147 g003
Figure 4. Elevation photo of Jiahui Bridge.
Sustainability 14 07147 g004
Figure 5. Pulling sling damage condition diagram.
Sustainability 14 07147 g005
Figure 6. Graph of single indicator measurement function.
Sustainability 14 07147 g006
Table 1. Evaluation of durability damage of pulling sling.
Level 1 Level 2
Comprehensive evaluation of the durability of bridge tension cable structuresPE PE   scratch   B 1
PE   cracking   B 2
Steel wire for cable Corrosion   of   cable   body   B 3
Cable   body   damage   B 4
Anchor device Anchorage   damage   B 5
Catheter   damage   B 6
Damage   to   shock   absorbers   B 7
Table 2. Evaluation classification of durability of pulling sling structure.
Durability LevelPull Sling Structure
Durability Status
Classification
Criteria
IIn good shape, durability failure risk is very small.(0.8,1)
IISlightly damaged, durability failure risk is small.(0.6,0.8)
IIIMedium damaged, durability failure risk is average.(0.4,0.6)
IVSeverely damaged, durability failure risk is high.(0.2,0.4)
VExtremely dangerous, durability failure risk is very high.(0,0.2)
Table 3. Scale of proportions.
ElementAssignmentMeaning
a j j 1In a certain level, indicator j is equally important compared to indicator j
2At a certain level, indicator j is slightly more important compared to indicator j
3At a certain level, indicator j is important compared to indicator j
a j j = 1 / a j j
Table 4. Table of sw(i) values.
Guideline LayerPECable Steel WireAnchor Device s w ( i )
0.1960.3110.493
B 1 0.667 0.131
B 2 0.333 0.065
B 3 0.333 0.104
B 4 0.667 0.207
B 5 0.5470.270
B 6 0.1900.094
B 7 0.2630.130
Table 5. Ranking results of evaluation index weights.
Methods B 1 B 2 B 3 B 4 B 5 B 6 B 7
IAHP3752164
CRITIC1673425
Table 6. Table of c w ( i ) values.
Methods B 1 B 2 B 3 B 4 B 5 B 6 B 7
PE0.6770.323
Cable steel wire 0.3430.657
Anchor Device 0.4290.2770.294
c w ( i ) 0.1690.0800.0990.1900.1980.1280.136
Table 7. Graphs and expressions of linear unconfirmed measure functions.
Distribution FormGraphicsFunction Expressions
Linear
distribution
Sustainability 14 07147 i001 { z d ( x ) = { x e d + 1 e d + e d + 1 e d + 1 e d , e d < x e d + 1 0 , x > e d + 1 z d + 1 ( x ) = { 0 , x e d x e d + 1 e d e d e d + 1 e d , e d < x e d + 1
Table 8. Table of evaluation results of pulling sling durability.
LayerPECable Steel WireAnchor
Device
Pulling
Cable
Actual
Level
Evaluation LevelIIIIIIIIIIIIII
Table 9. Evaluation index system and grade standard division for the durability.
Pulling Sling Structure
Durability
Longevity Evaluation
System and
Index Level Standard
Criteria
Division
Index (Weight)Standard Split Point for Each GradeMeasured Value
IIIIIIIVV
B 1 (0.132)907560503572
B 2 (0.144)907560503580
B 3 (0. 142)907560503565
B 4 (0.151)907560503555
B 5 (0.156)907560503563
B 6 (0.142)907560503545
B 7 (0.133)907560503585
Table 10. Weights of the three weighting methods and the combination weighting method.
Criterion LayerIndexesIAHPCRITICEWMCombined Weight
PECracking0.1310.2080.1320.169
Scratch0.0650.0940.1440.080
Steel wire for
cable
Damage0.1040.0910.1420.099
Corrosion0.2070.1660.1510.190
Anchor deviceAnchorage damage0.2700.1390.1560.198
Catheter damage0.0940.1670.1420.128
Shock absorbers damage0.1300.1360.1330.136
Table 11. Evaluation results of pulling sling durability.
Pulling CableComprehensive Unascertained
Measurement
Evaluation Results
C 1 C 2 C 3 C 4 C 5 CWM
UM
SPAMEEActual Grade
Jiahui00.3130.6270.0600IIIIIIIIIIII
Publisher’s Note: MDPI stays neutral with regard to jurisdictional claims in published maps and institutional affiliations.

