Evaluation of Regional Water Use Efficiency under Green and Sustainable Development Using an Improved Super Slack-Based Measure Model
Abstract
:1. Introduction
2. Methodology and Data
2.1. Conventional Super-SBM without a Set Slack Limit
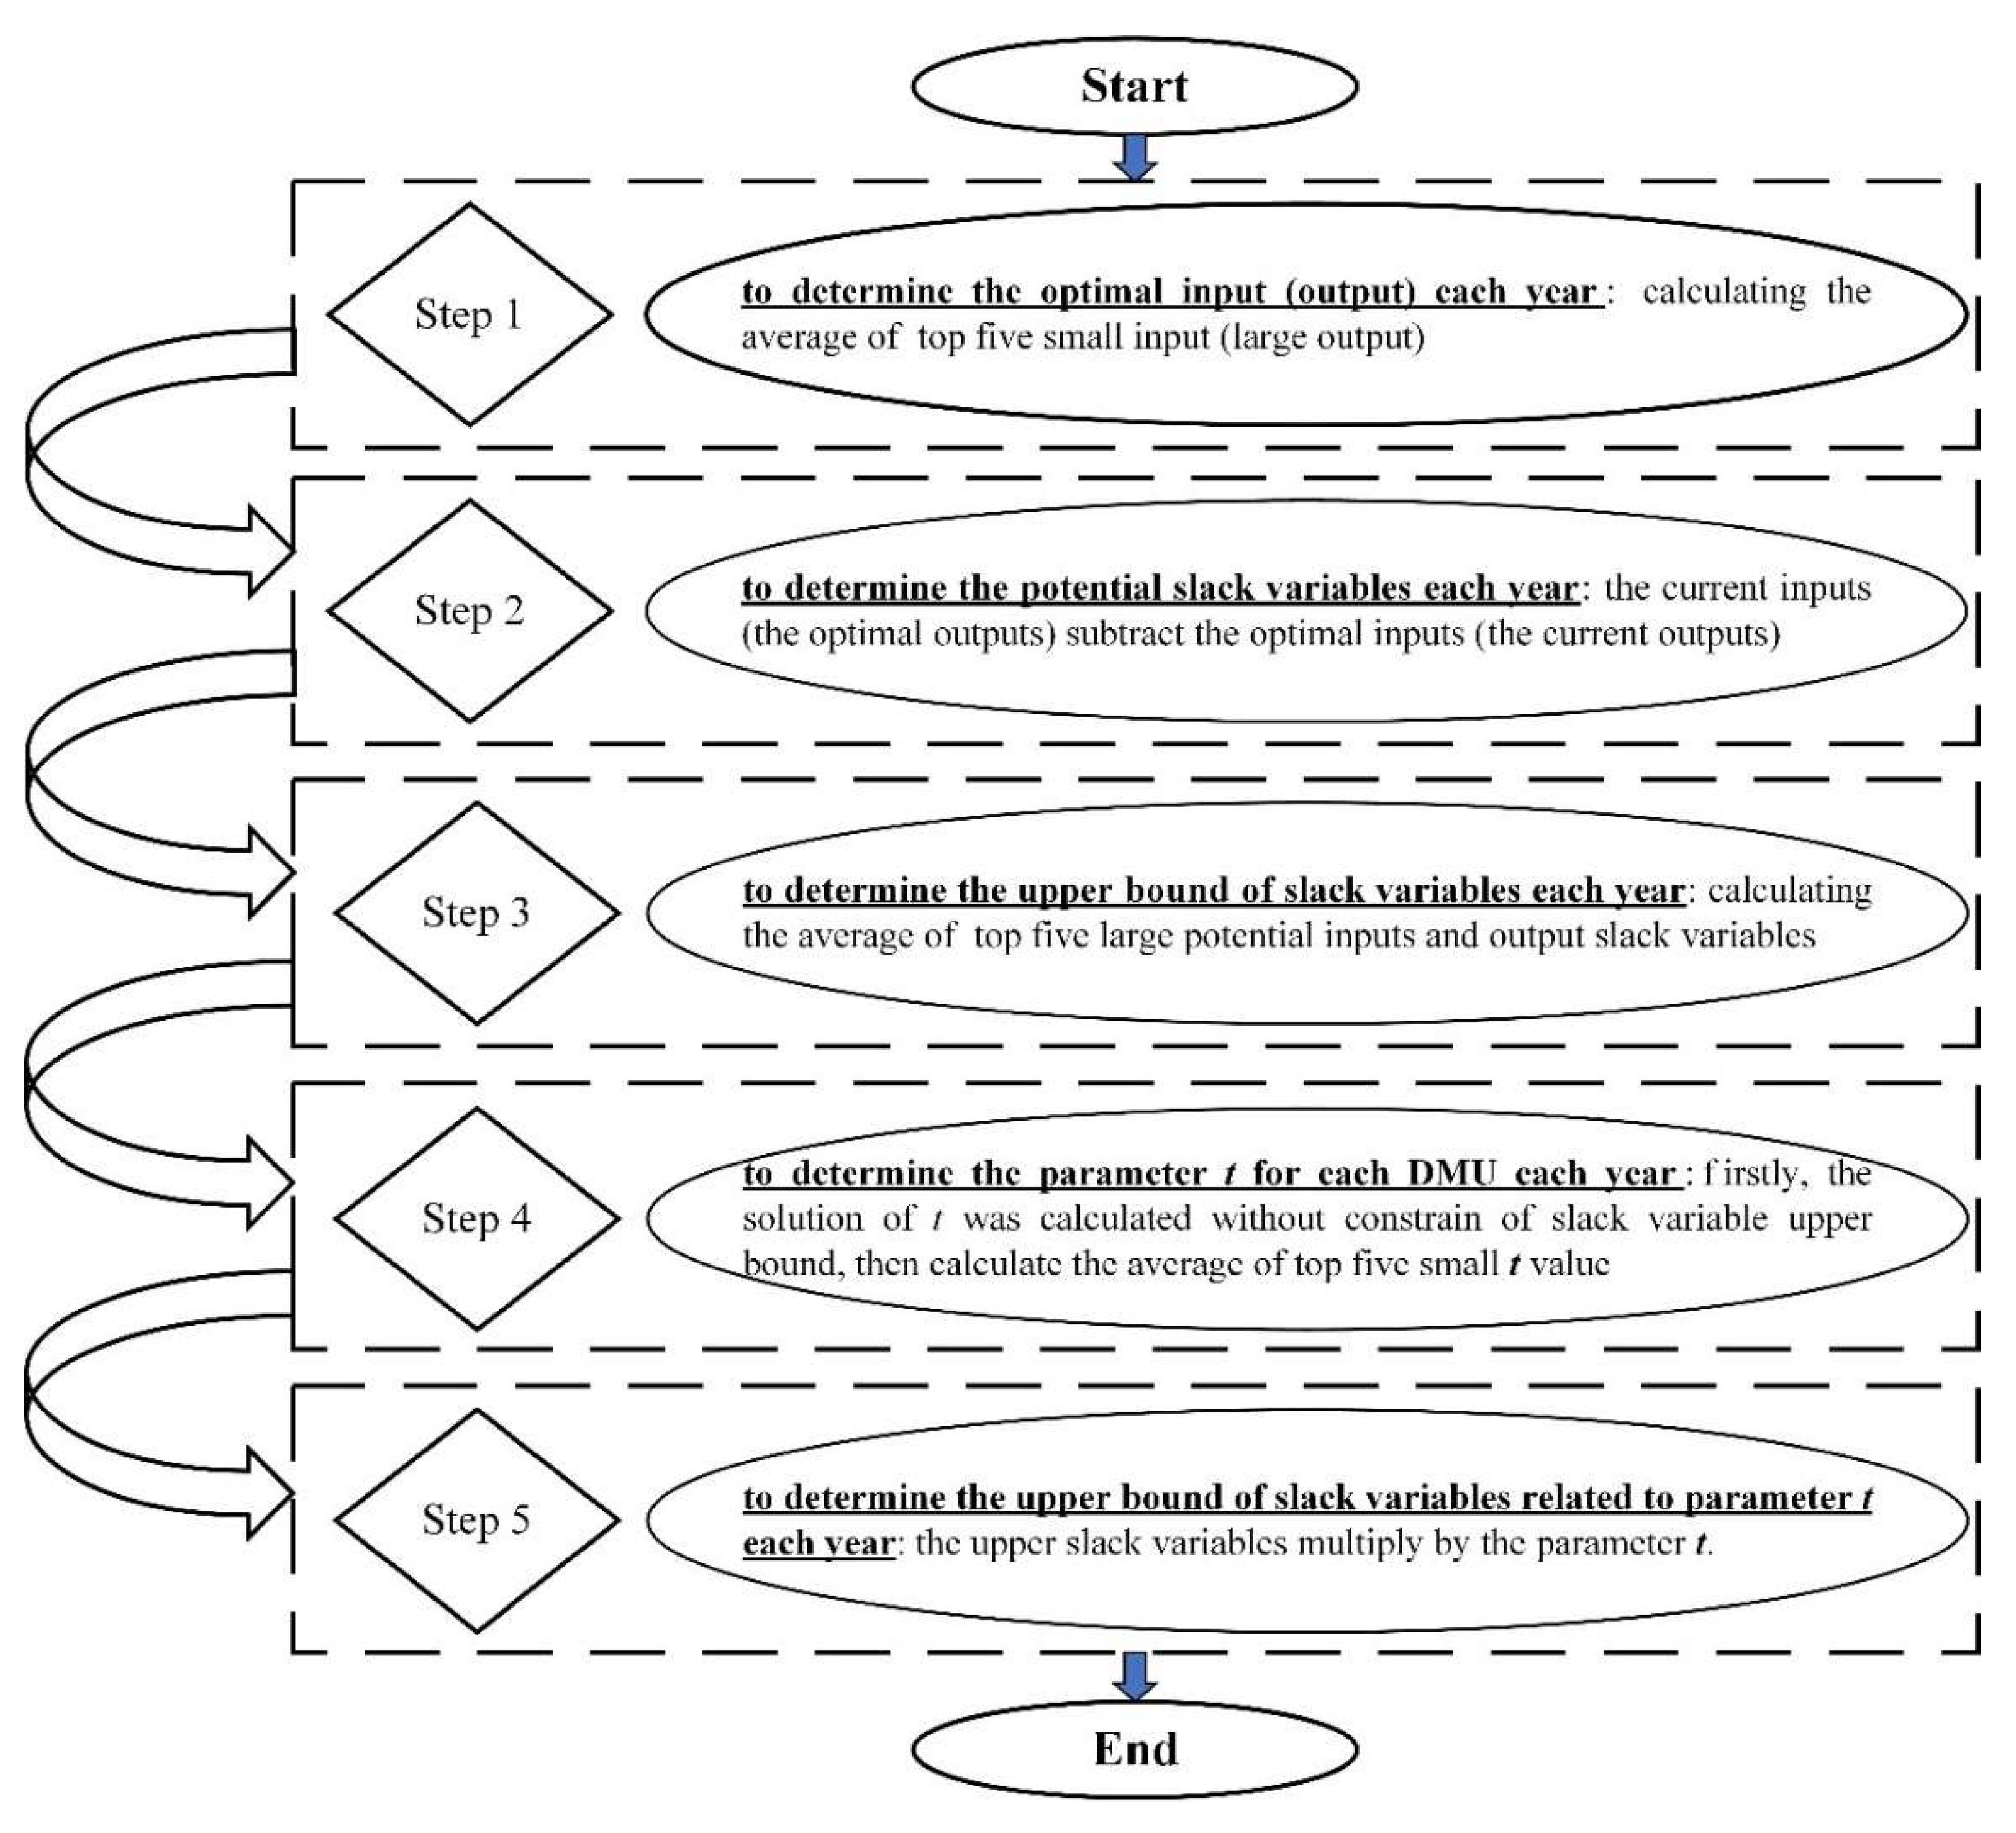
2.2. Improved Super-SBM with Set Slack Limit
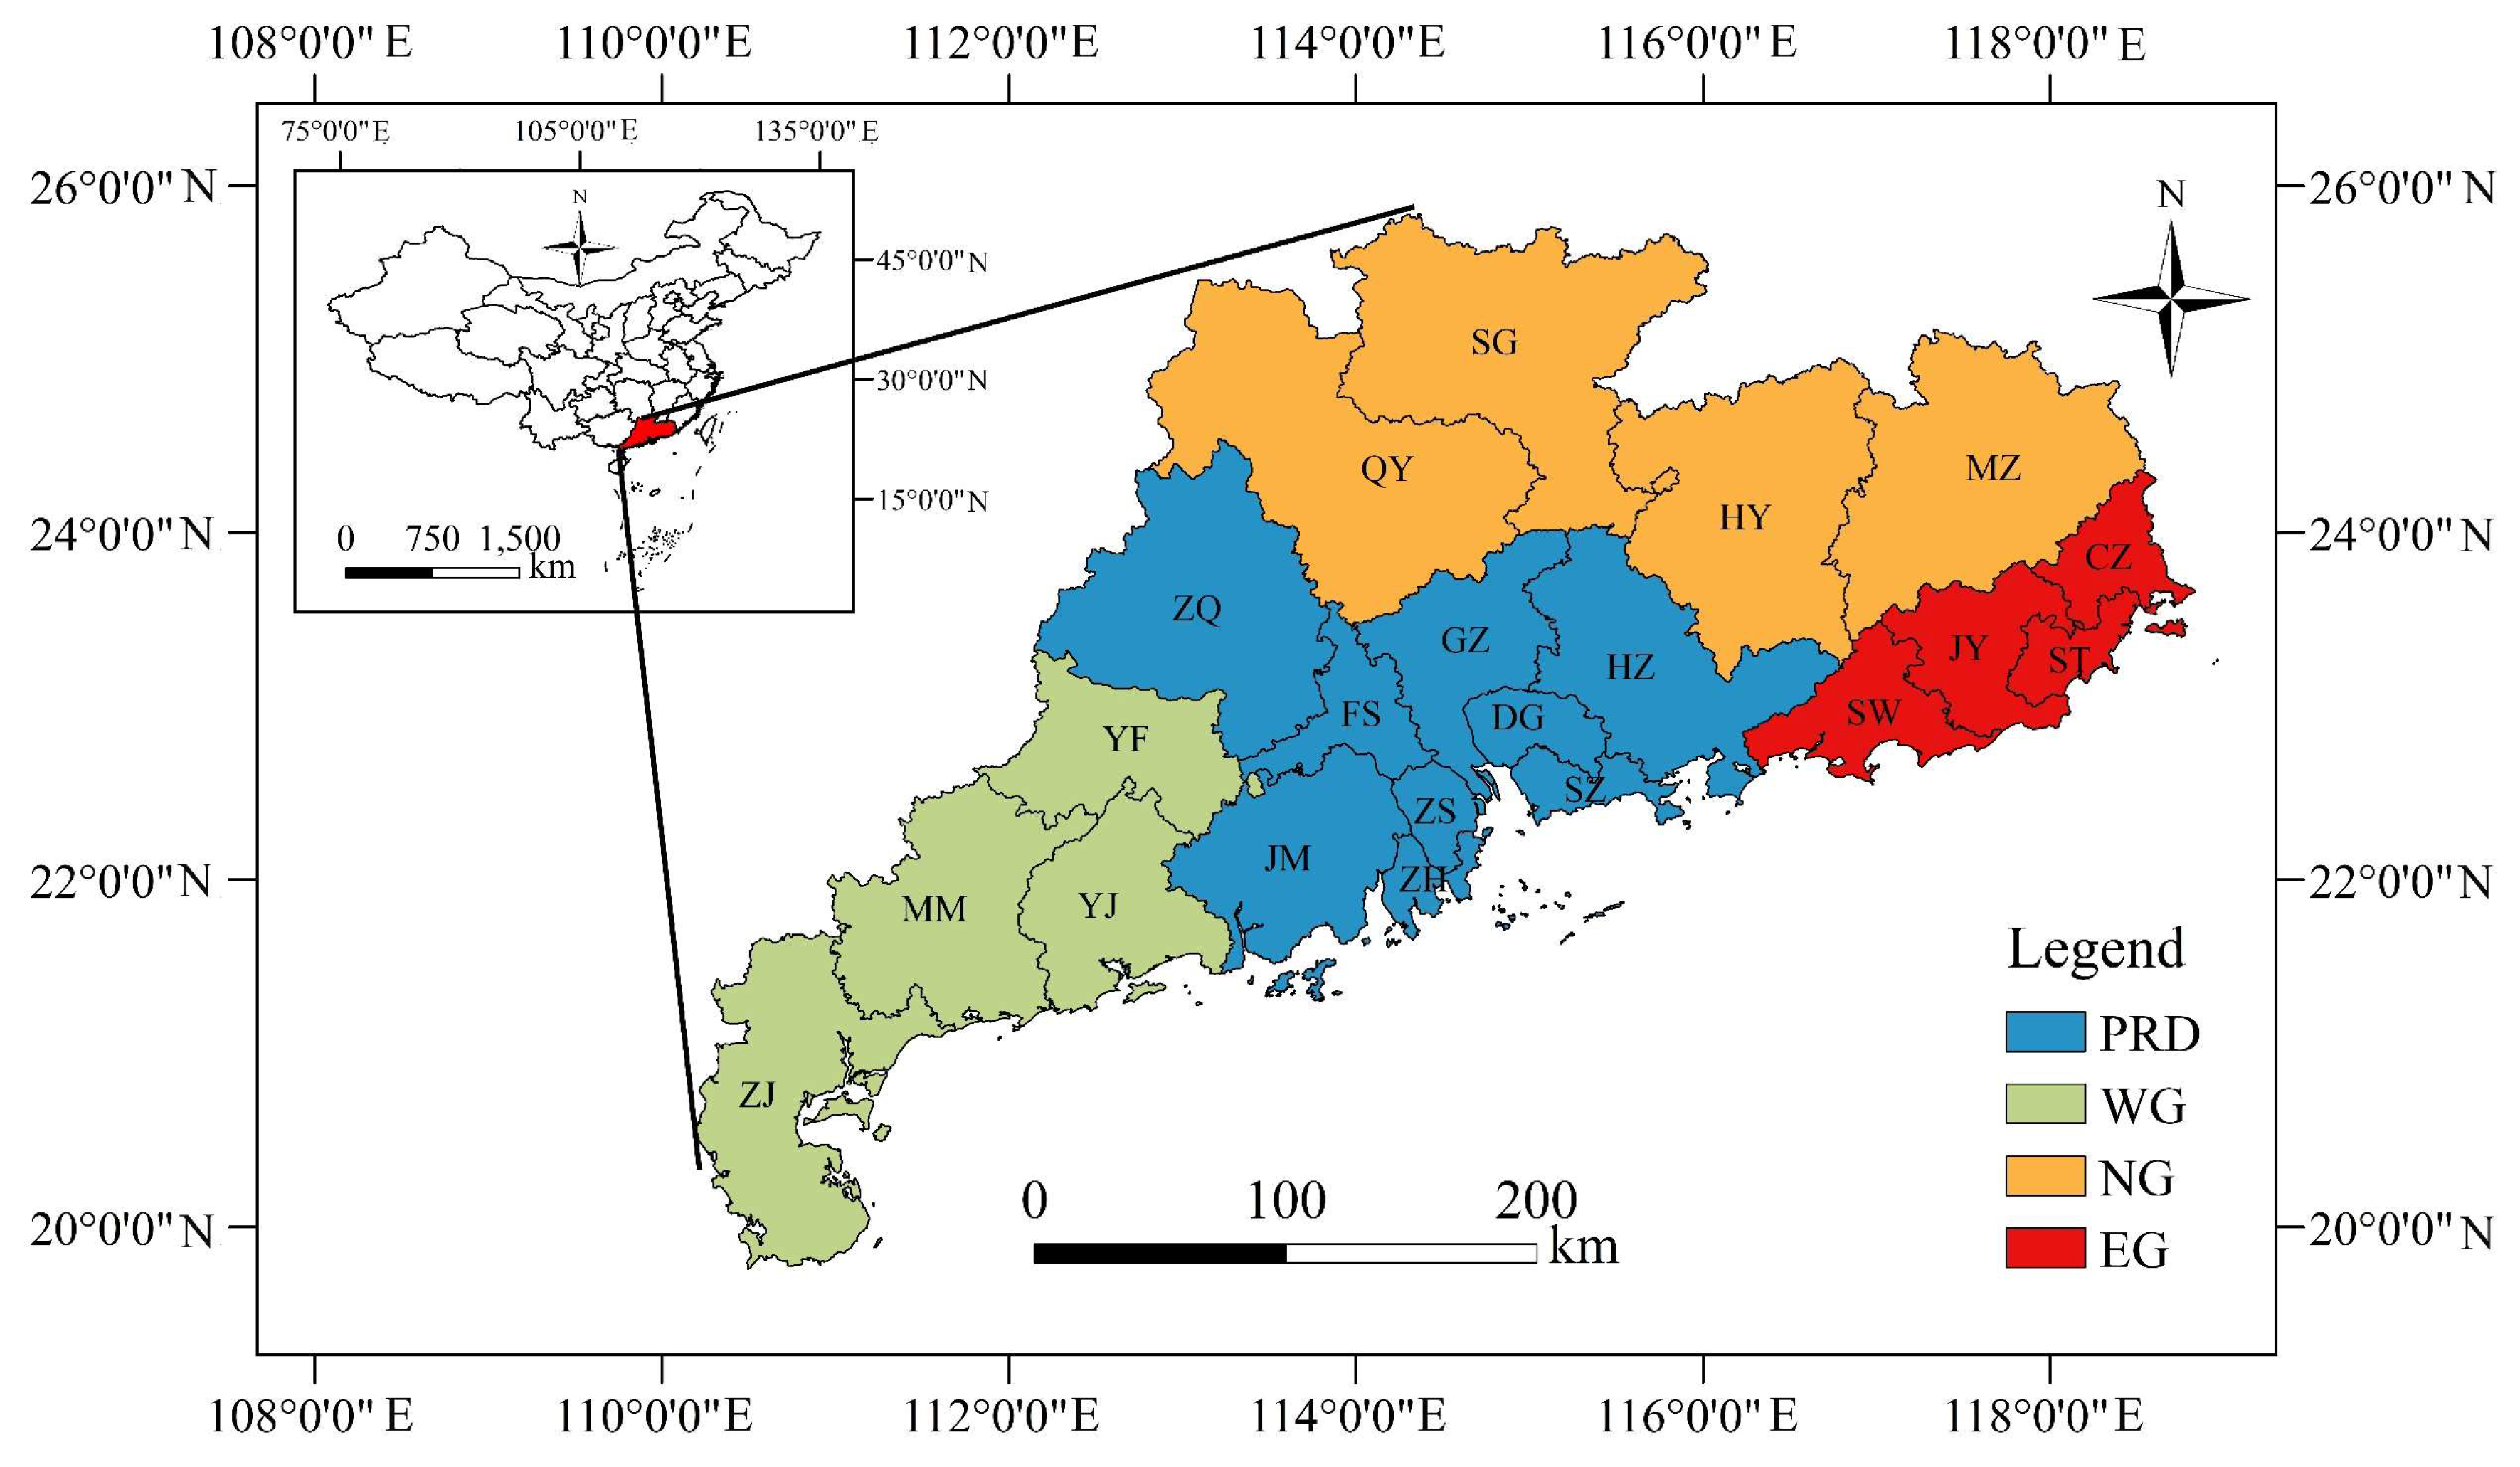
2.3. Study Area
2.4. Data
3. Results
3.1. Estimated WUE Using the Conventional Super-SBM Model
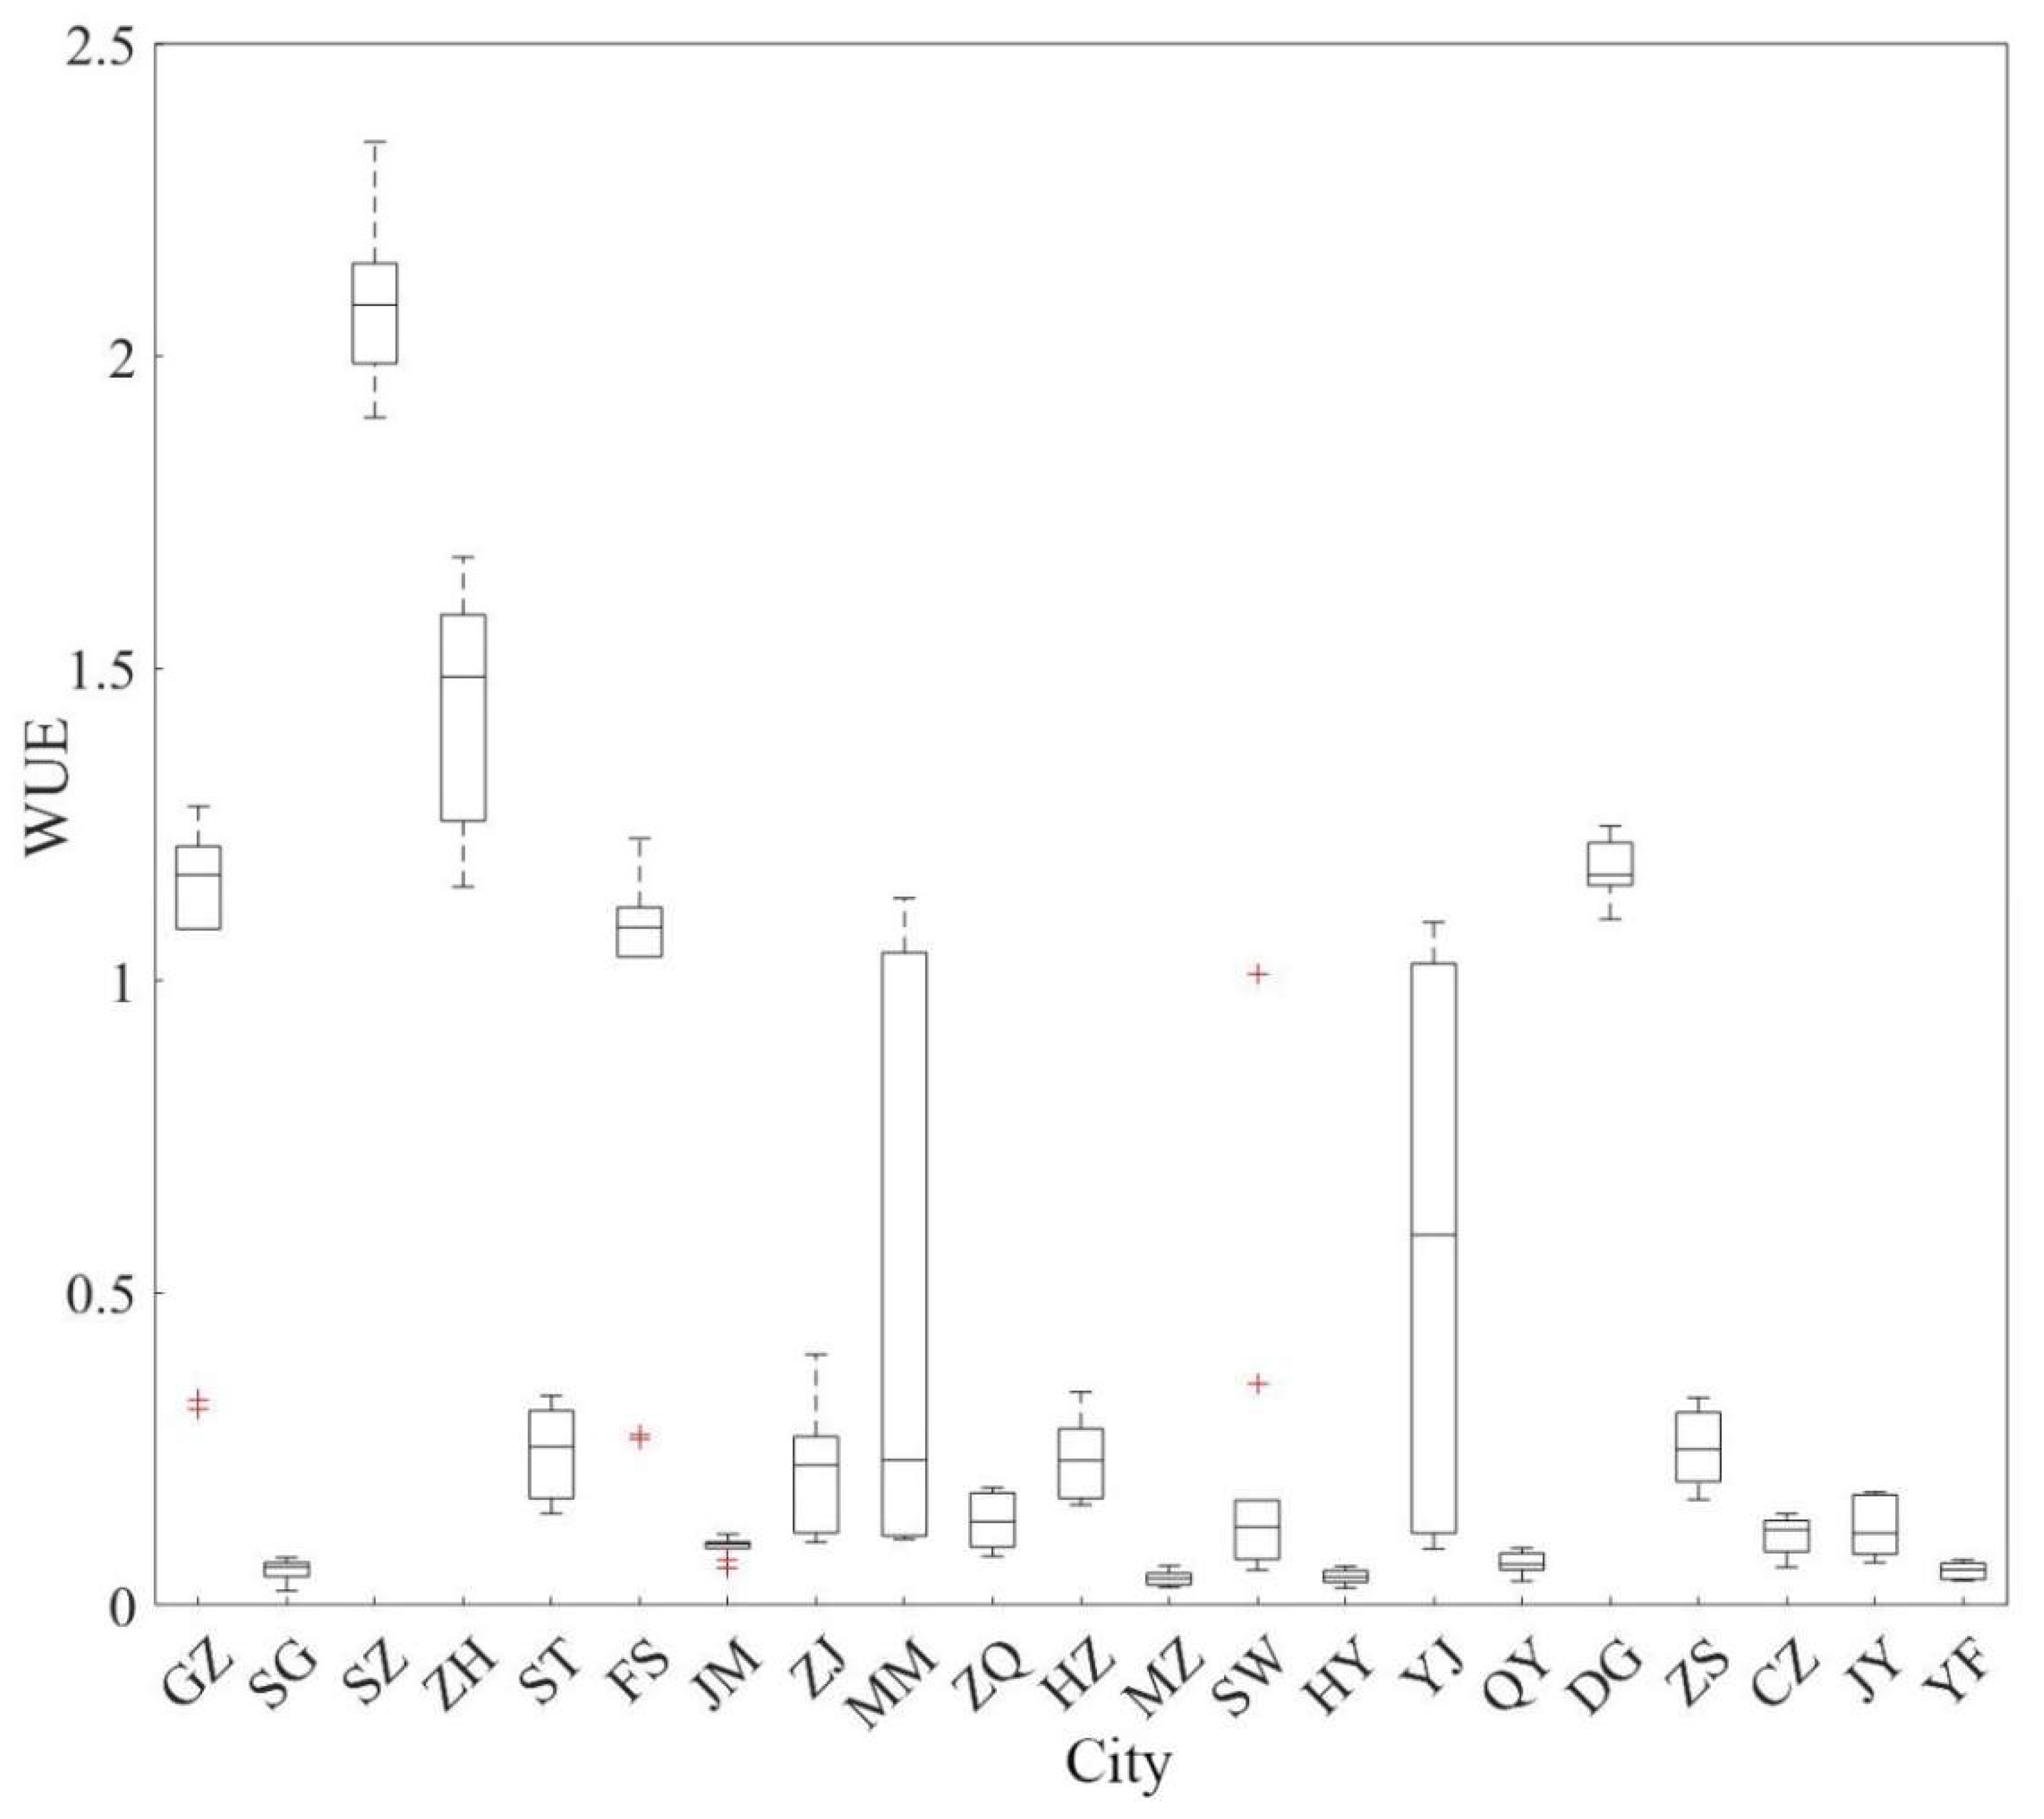
3.2. Estimated WUE Using the Improved Super-SBM Model
3.3. Comparison of CSSBM and ISSBM WUE Estimates
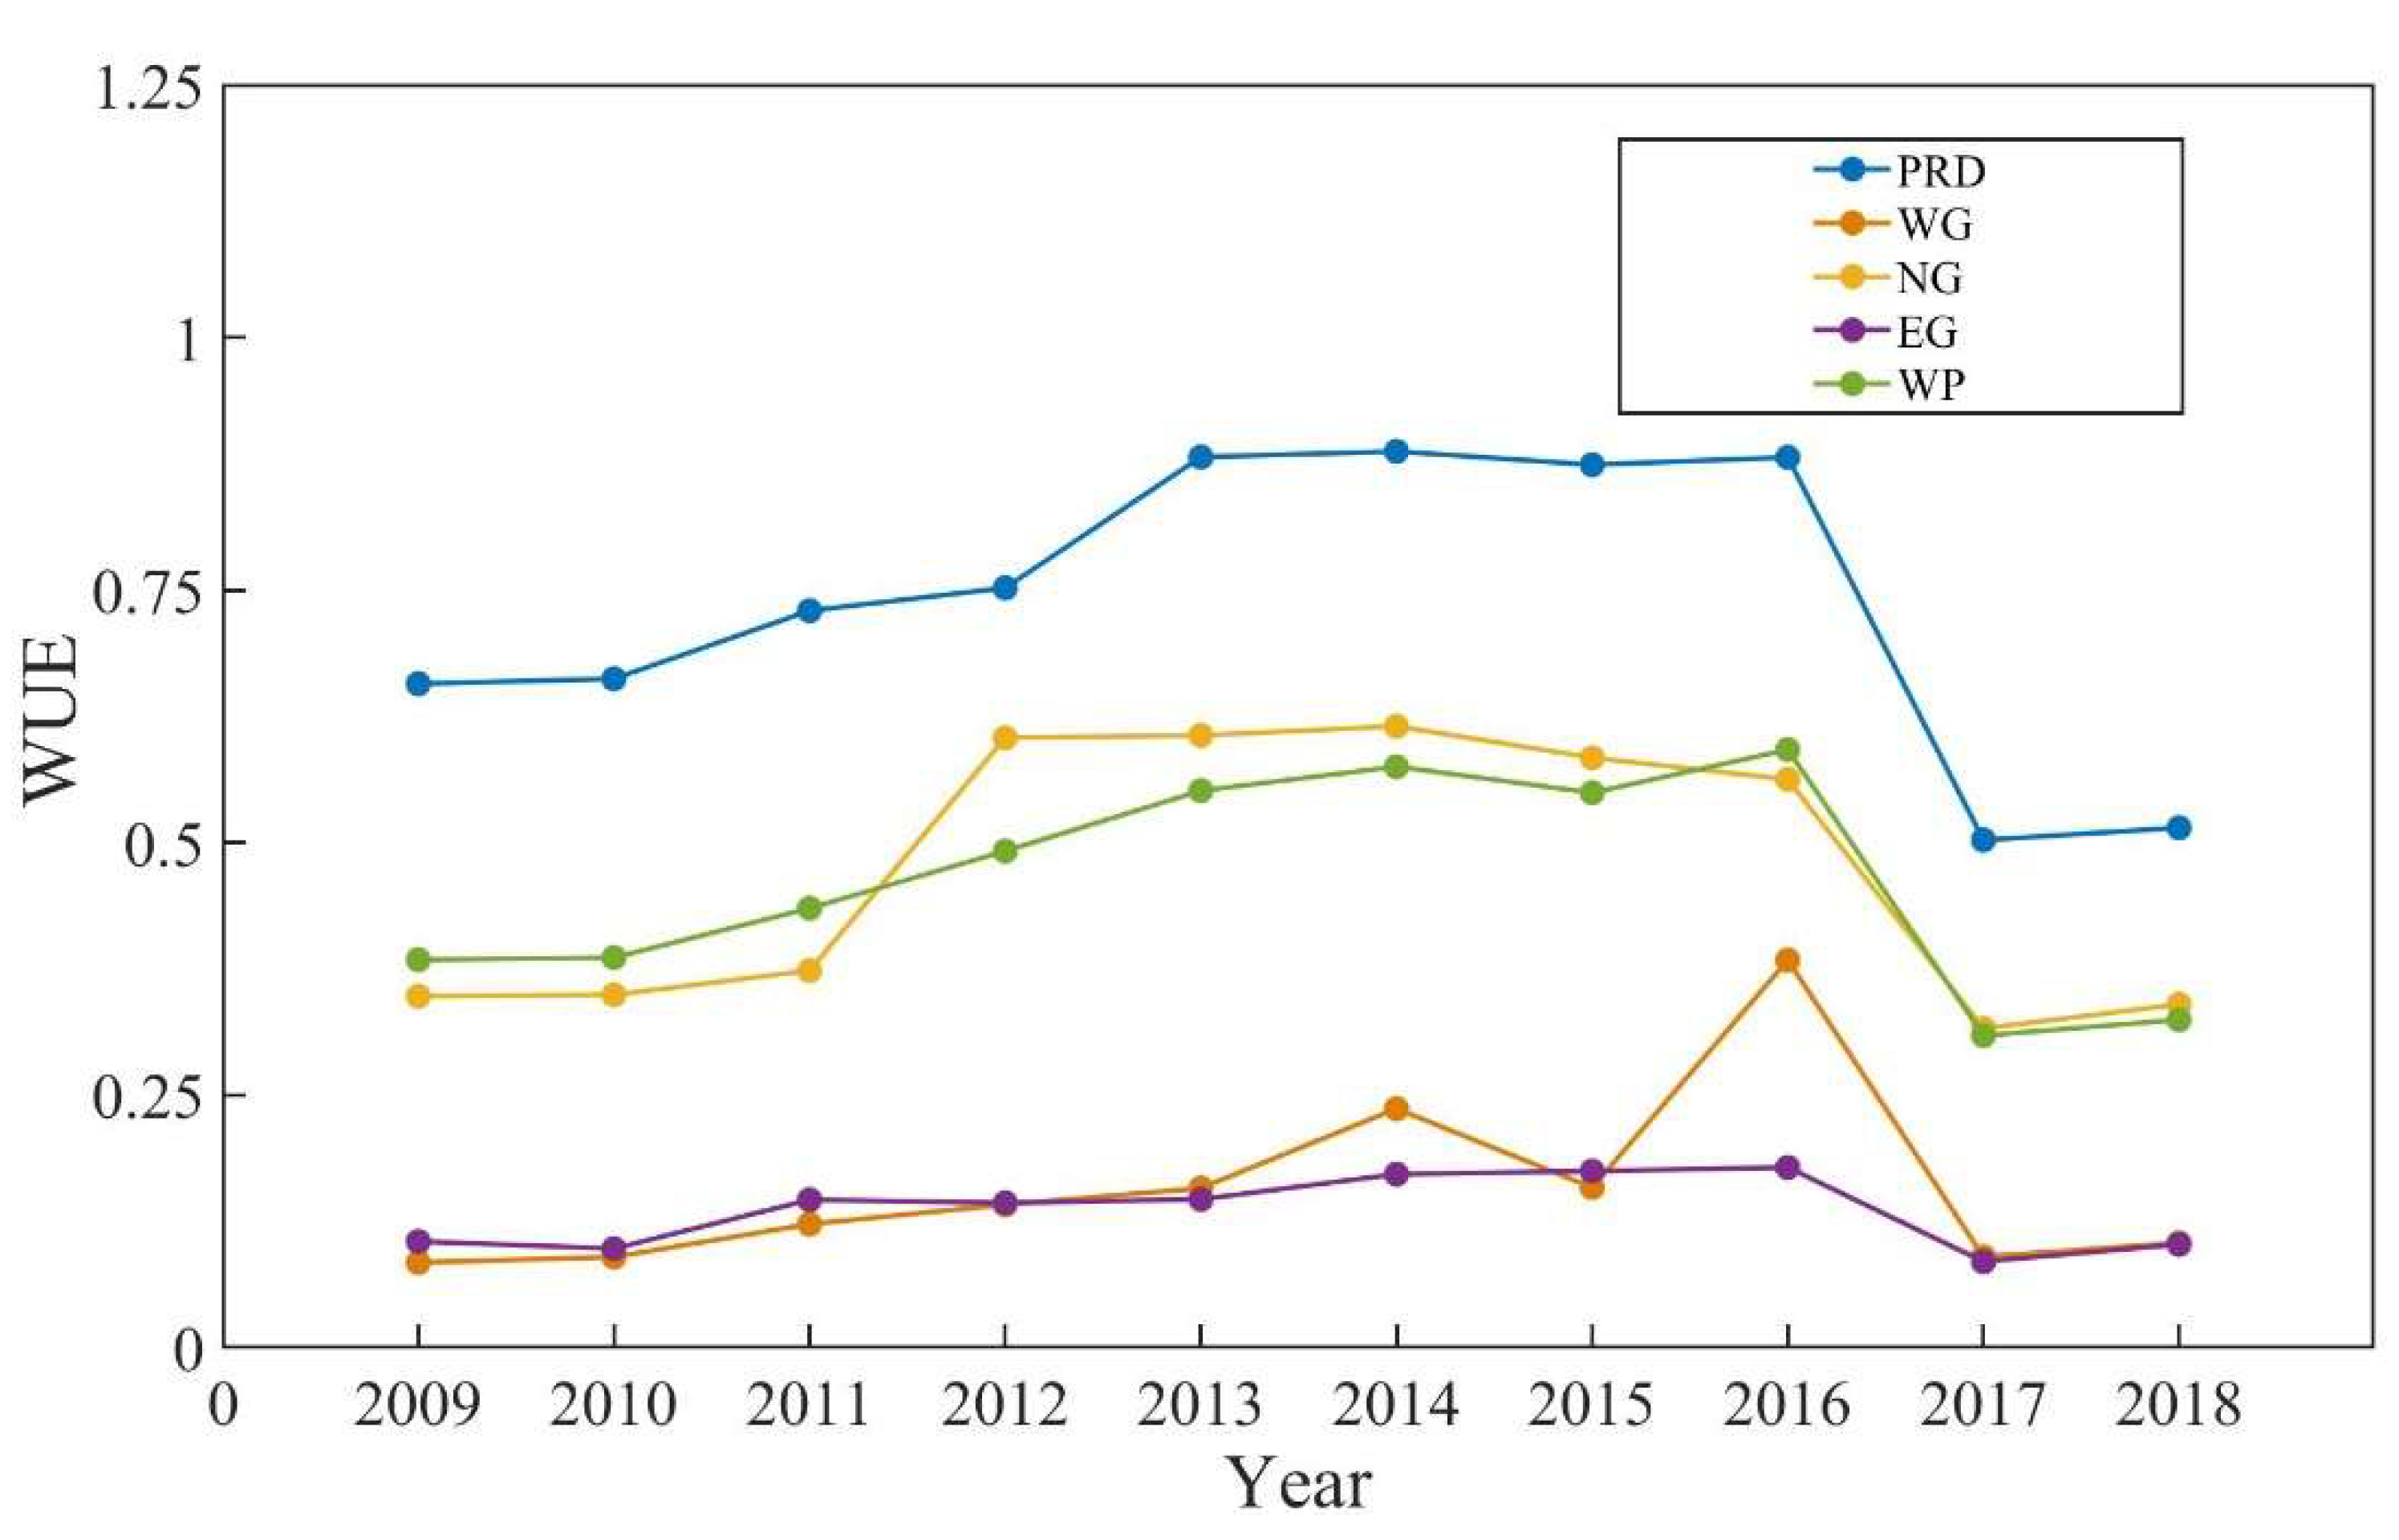
3.4. Spatiotemporal Distribution of WUE in Guangdong Province
4. Discussion
5. Conclusions
- (1)
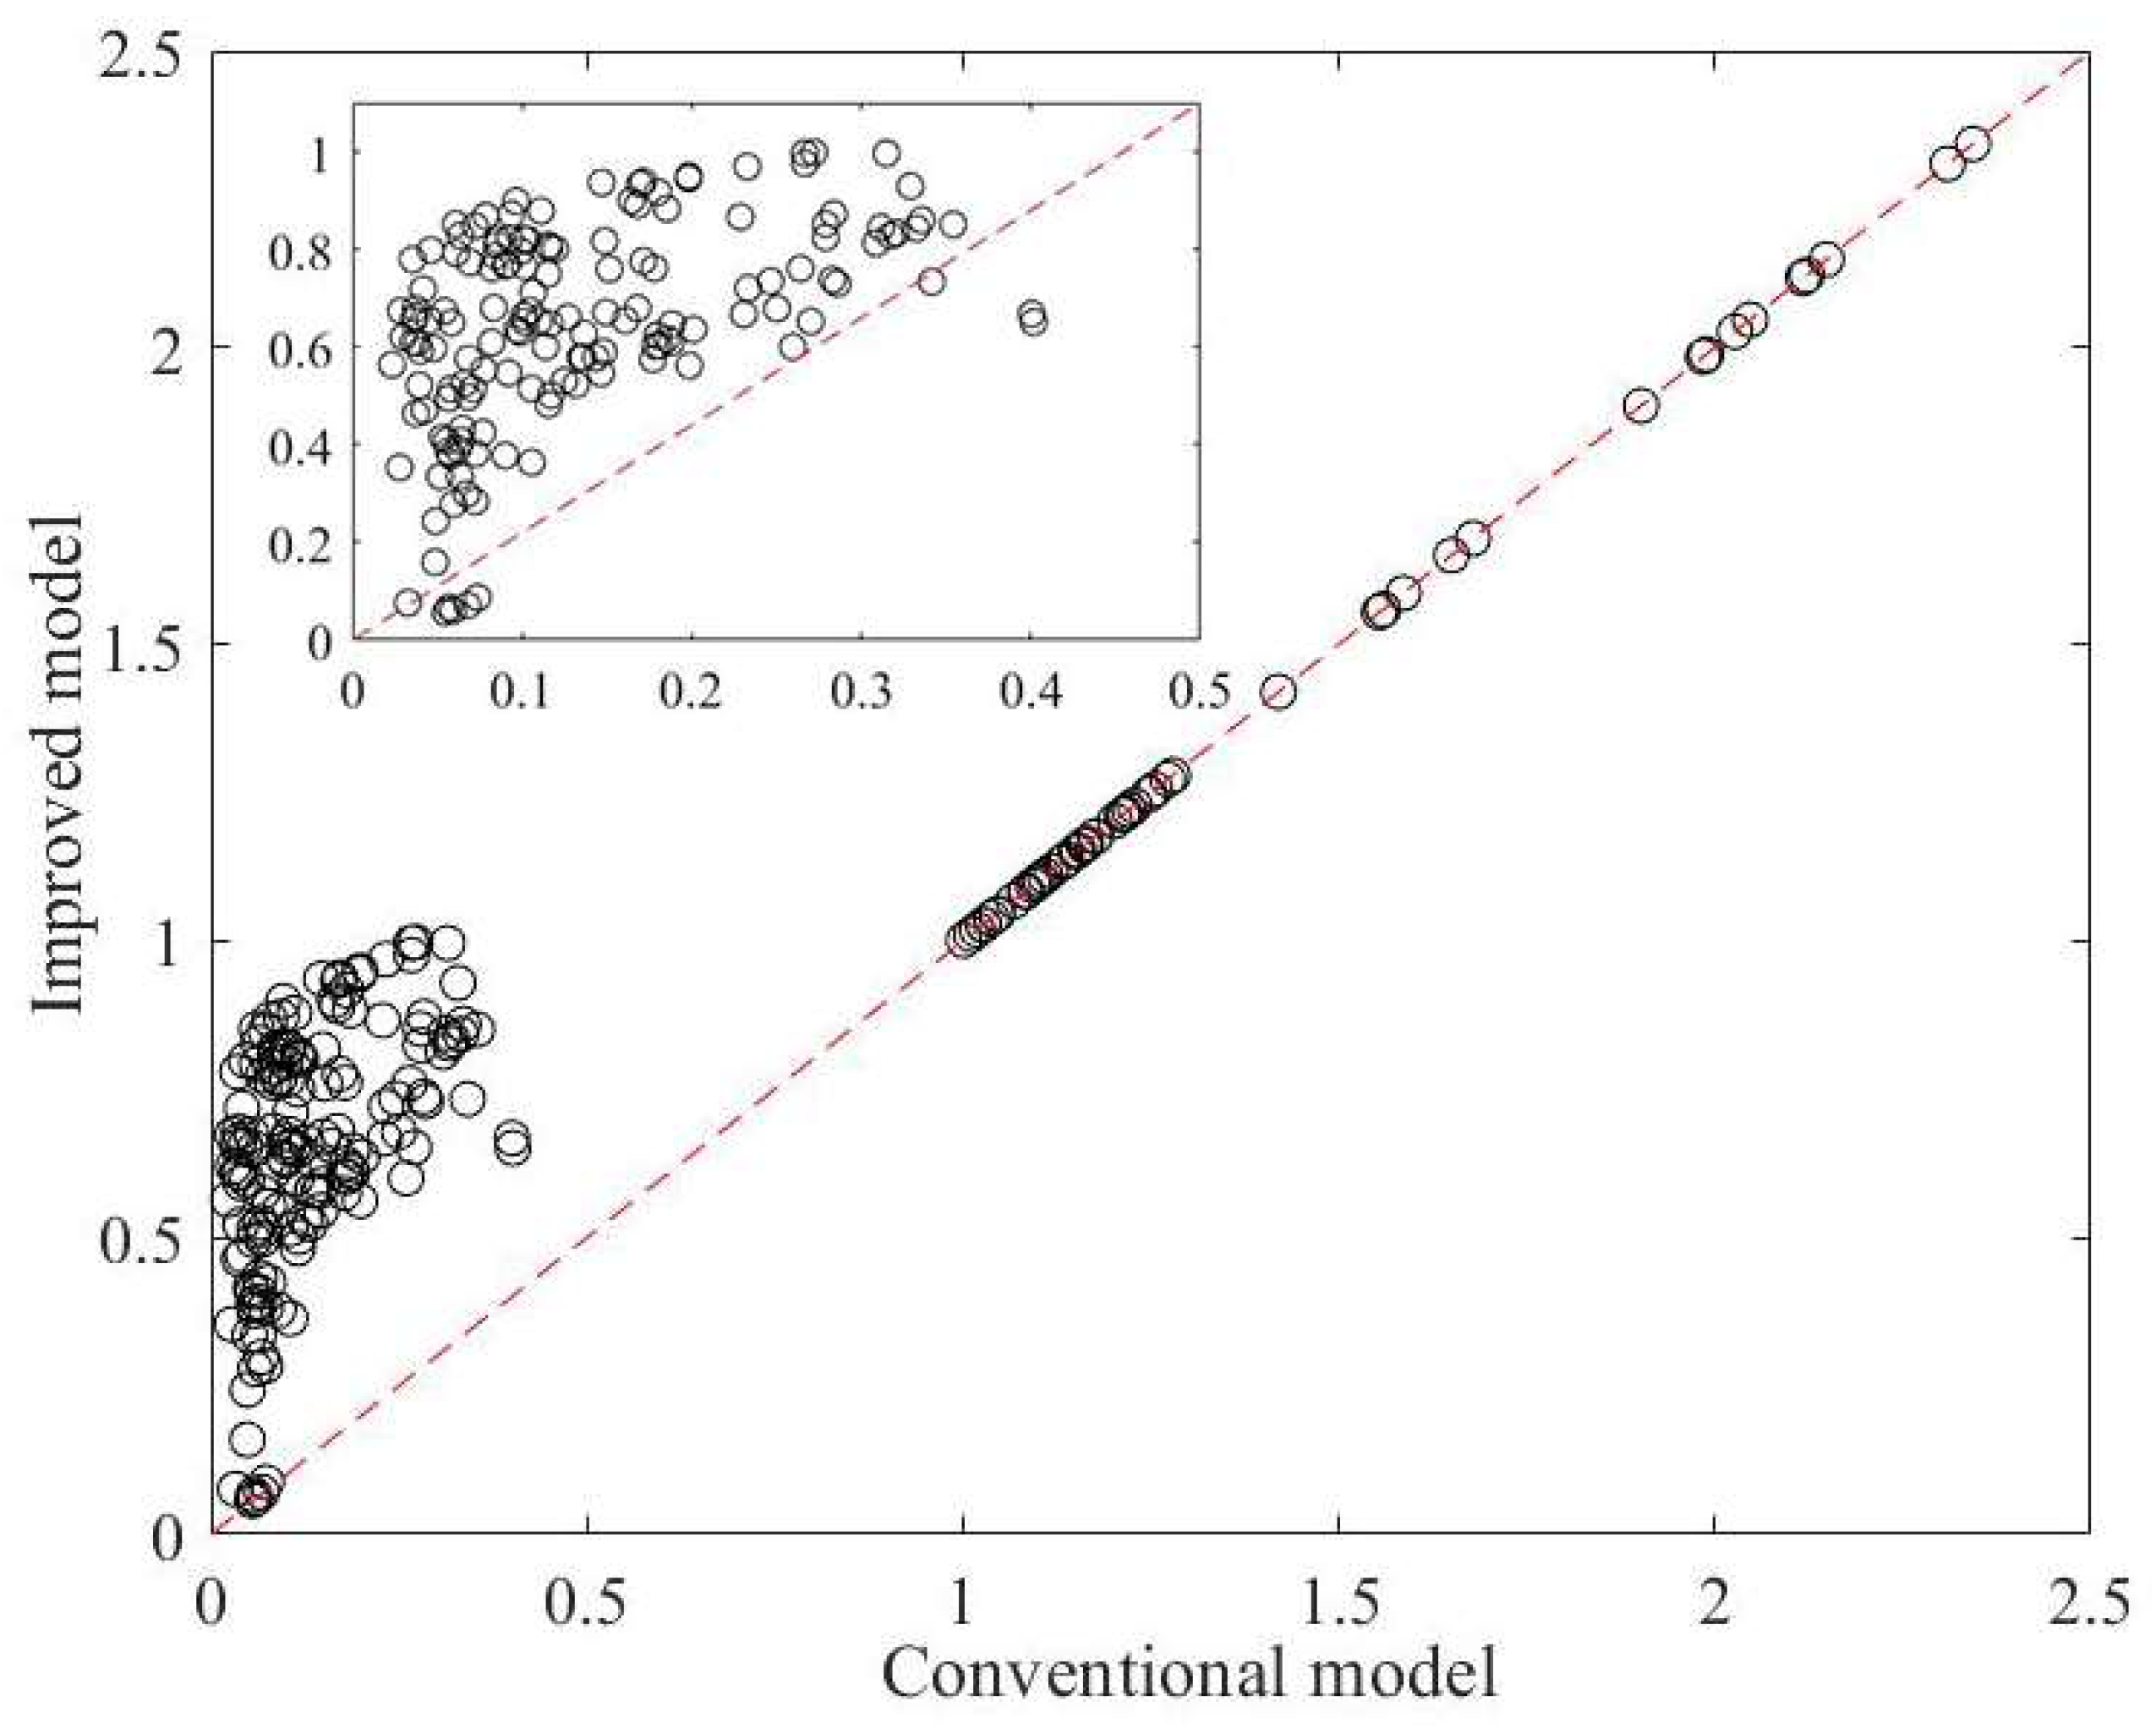
- The ISSBM model is superior to the CSSBM model, as it avoids underestimation of the WUE. This is attributed to the ability of the ISSBM to artificially assign an upper bound to the slack variable, avoiding the excessive slack variables resulting from automatic optimization.
- (2)
- When the ISSBM model employs output indicators related to the economy, society, and the eco-environment, the estimations of WUE exhibit stronger discriminating power than when social equality is not considered as an output indicator.
- (3)
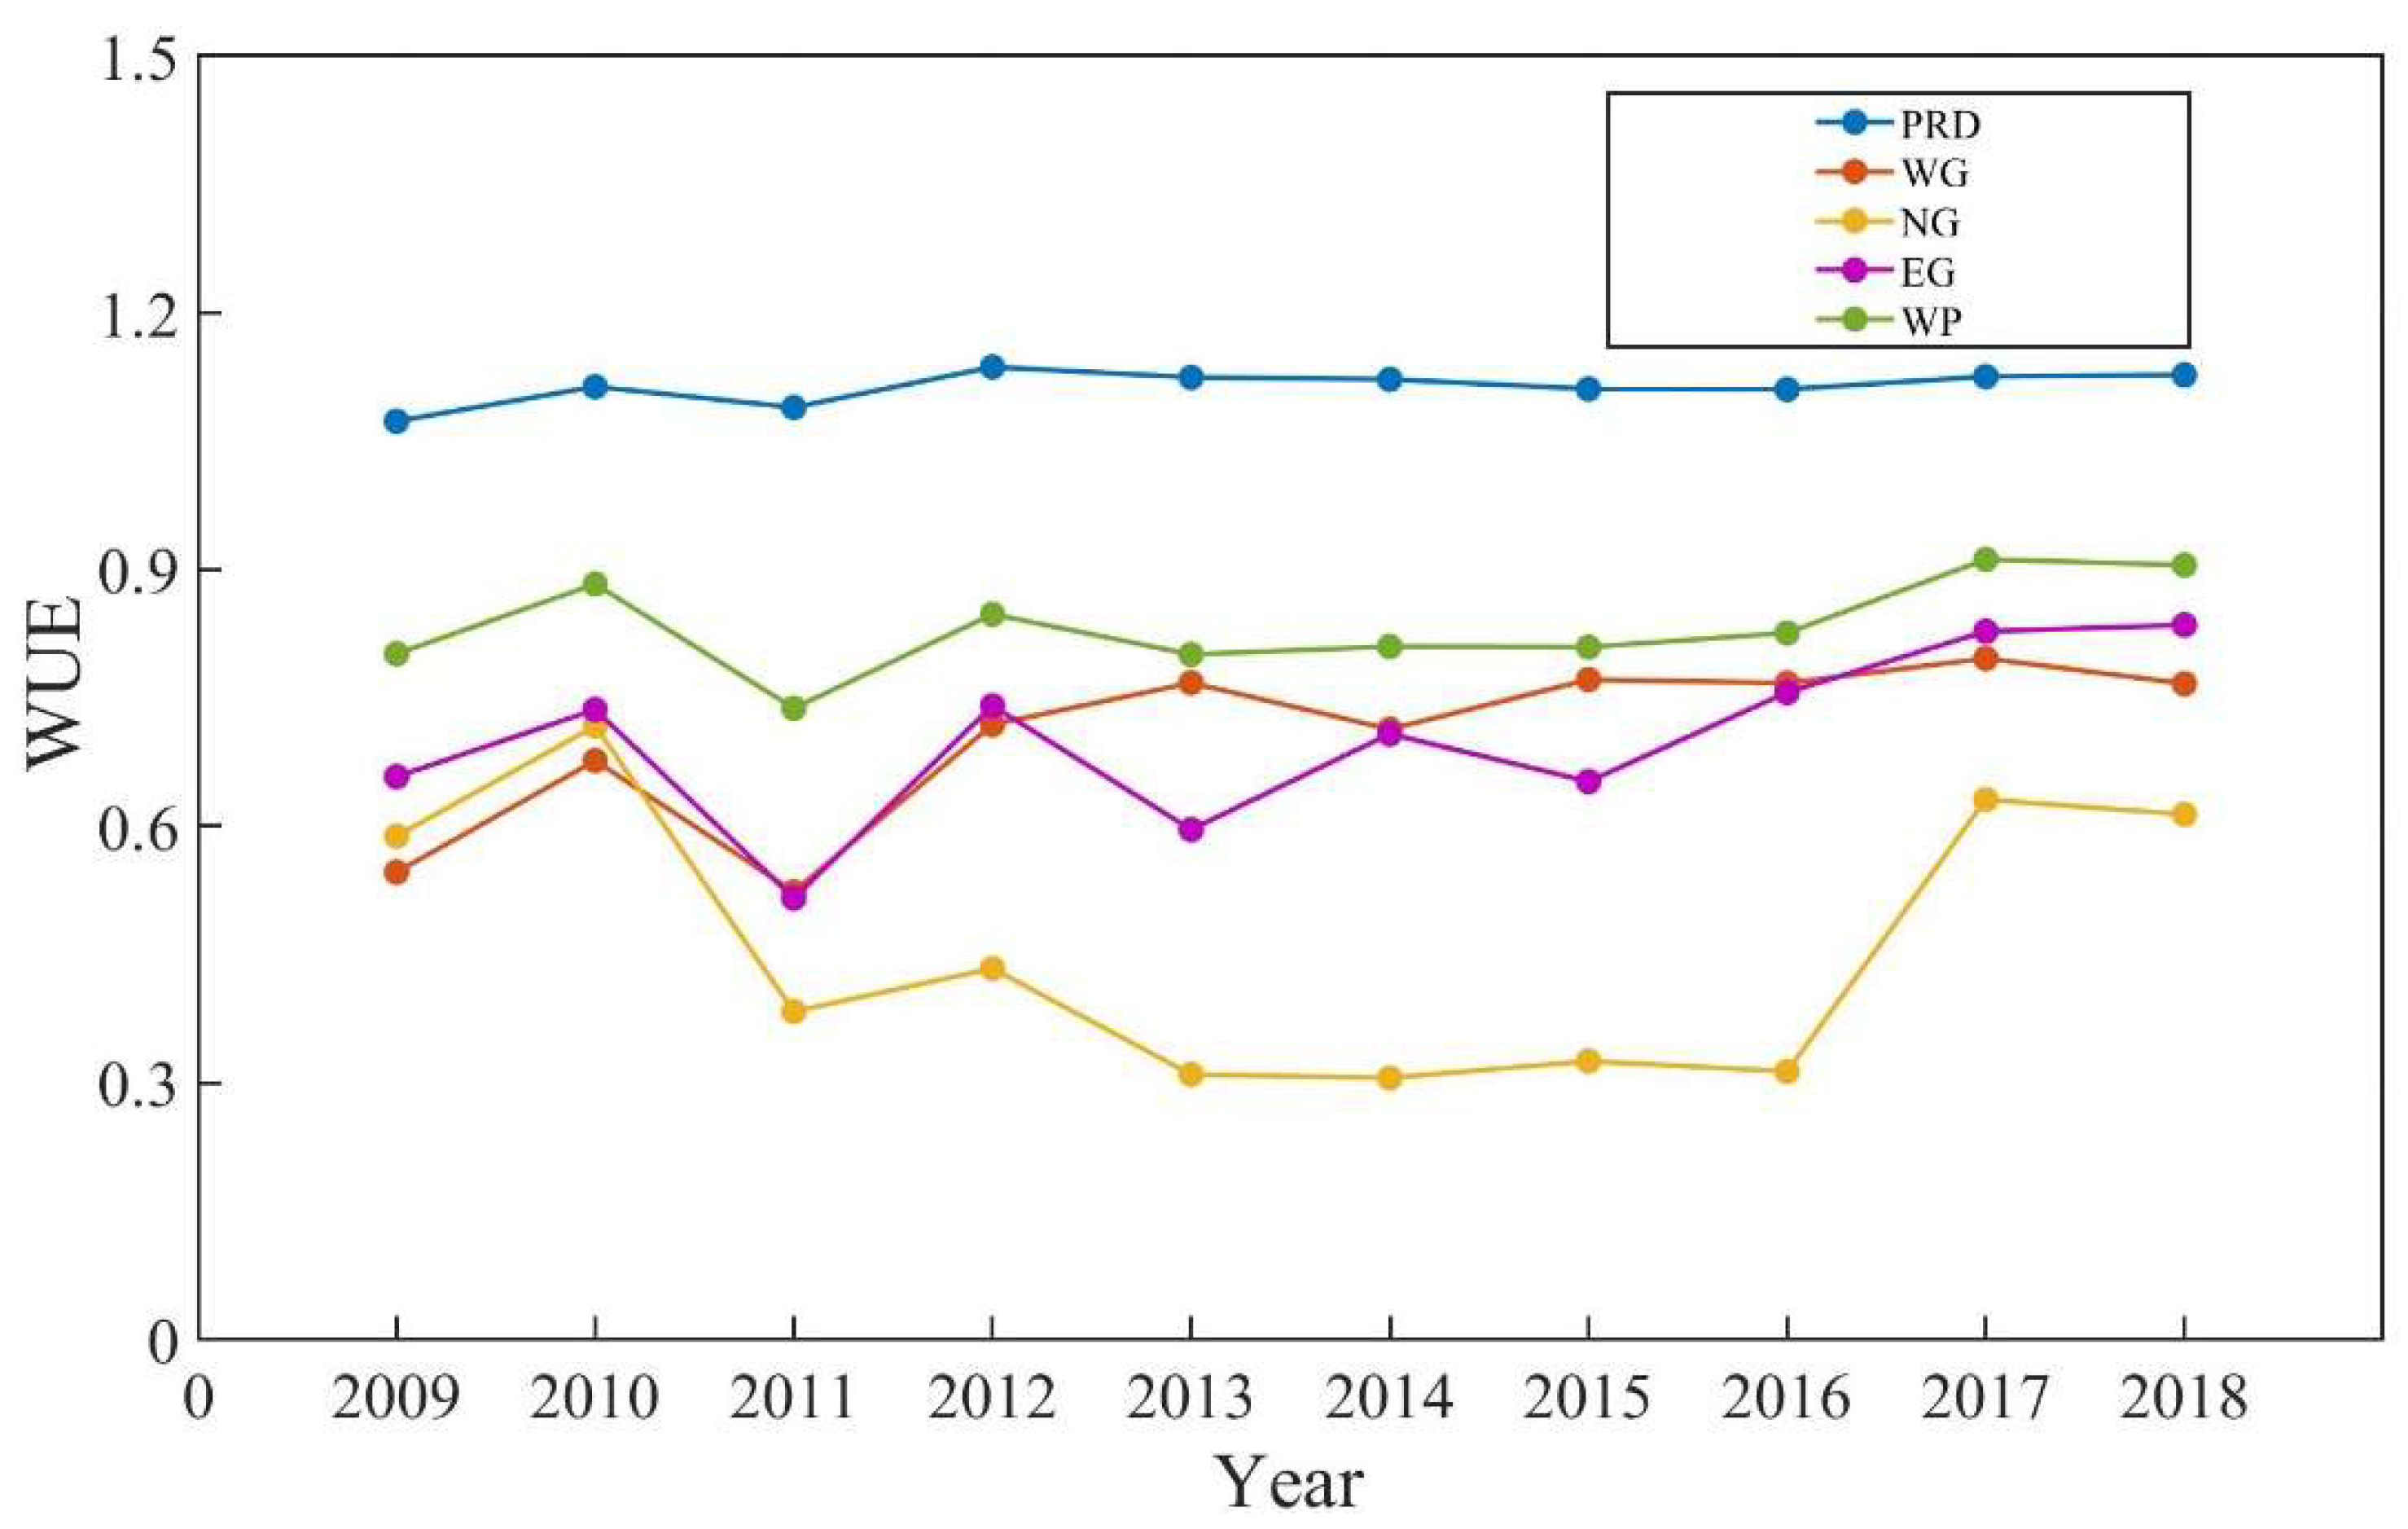
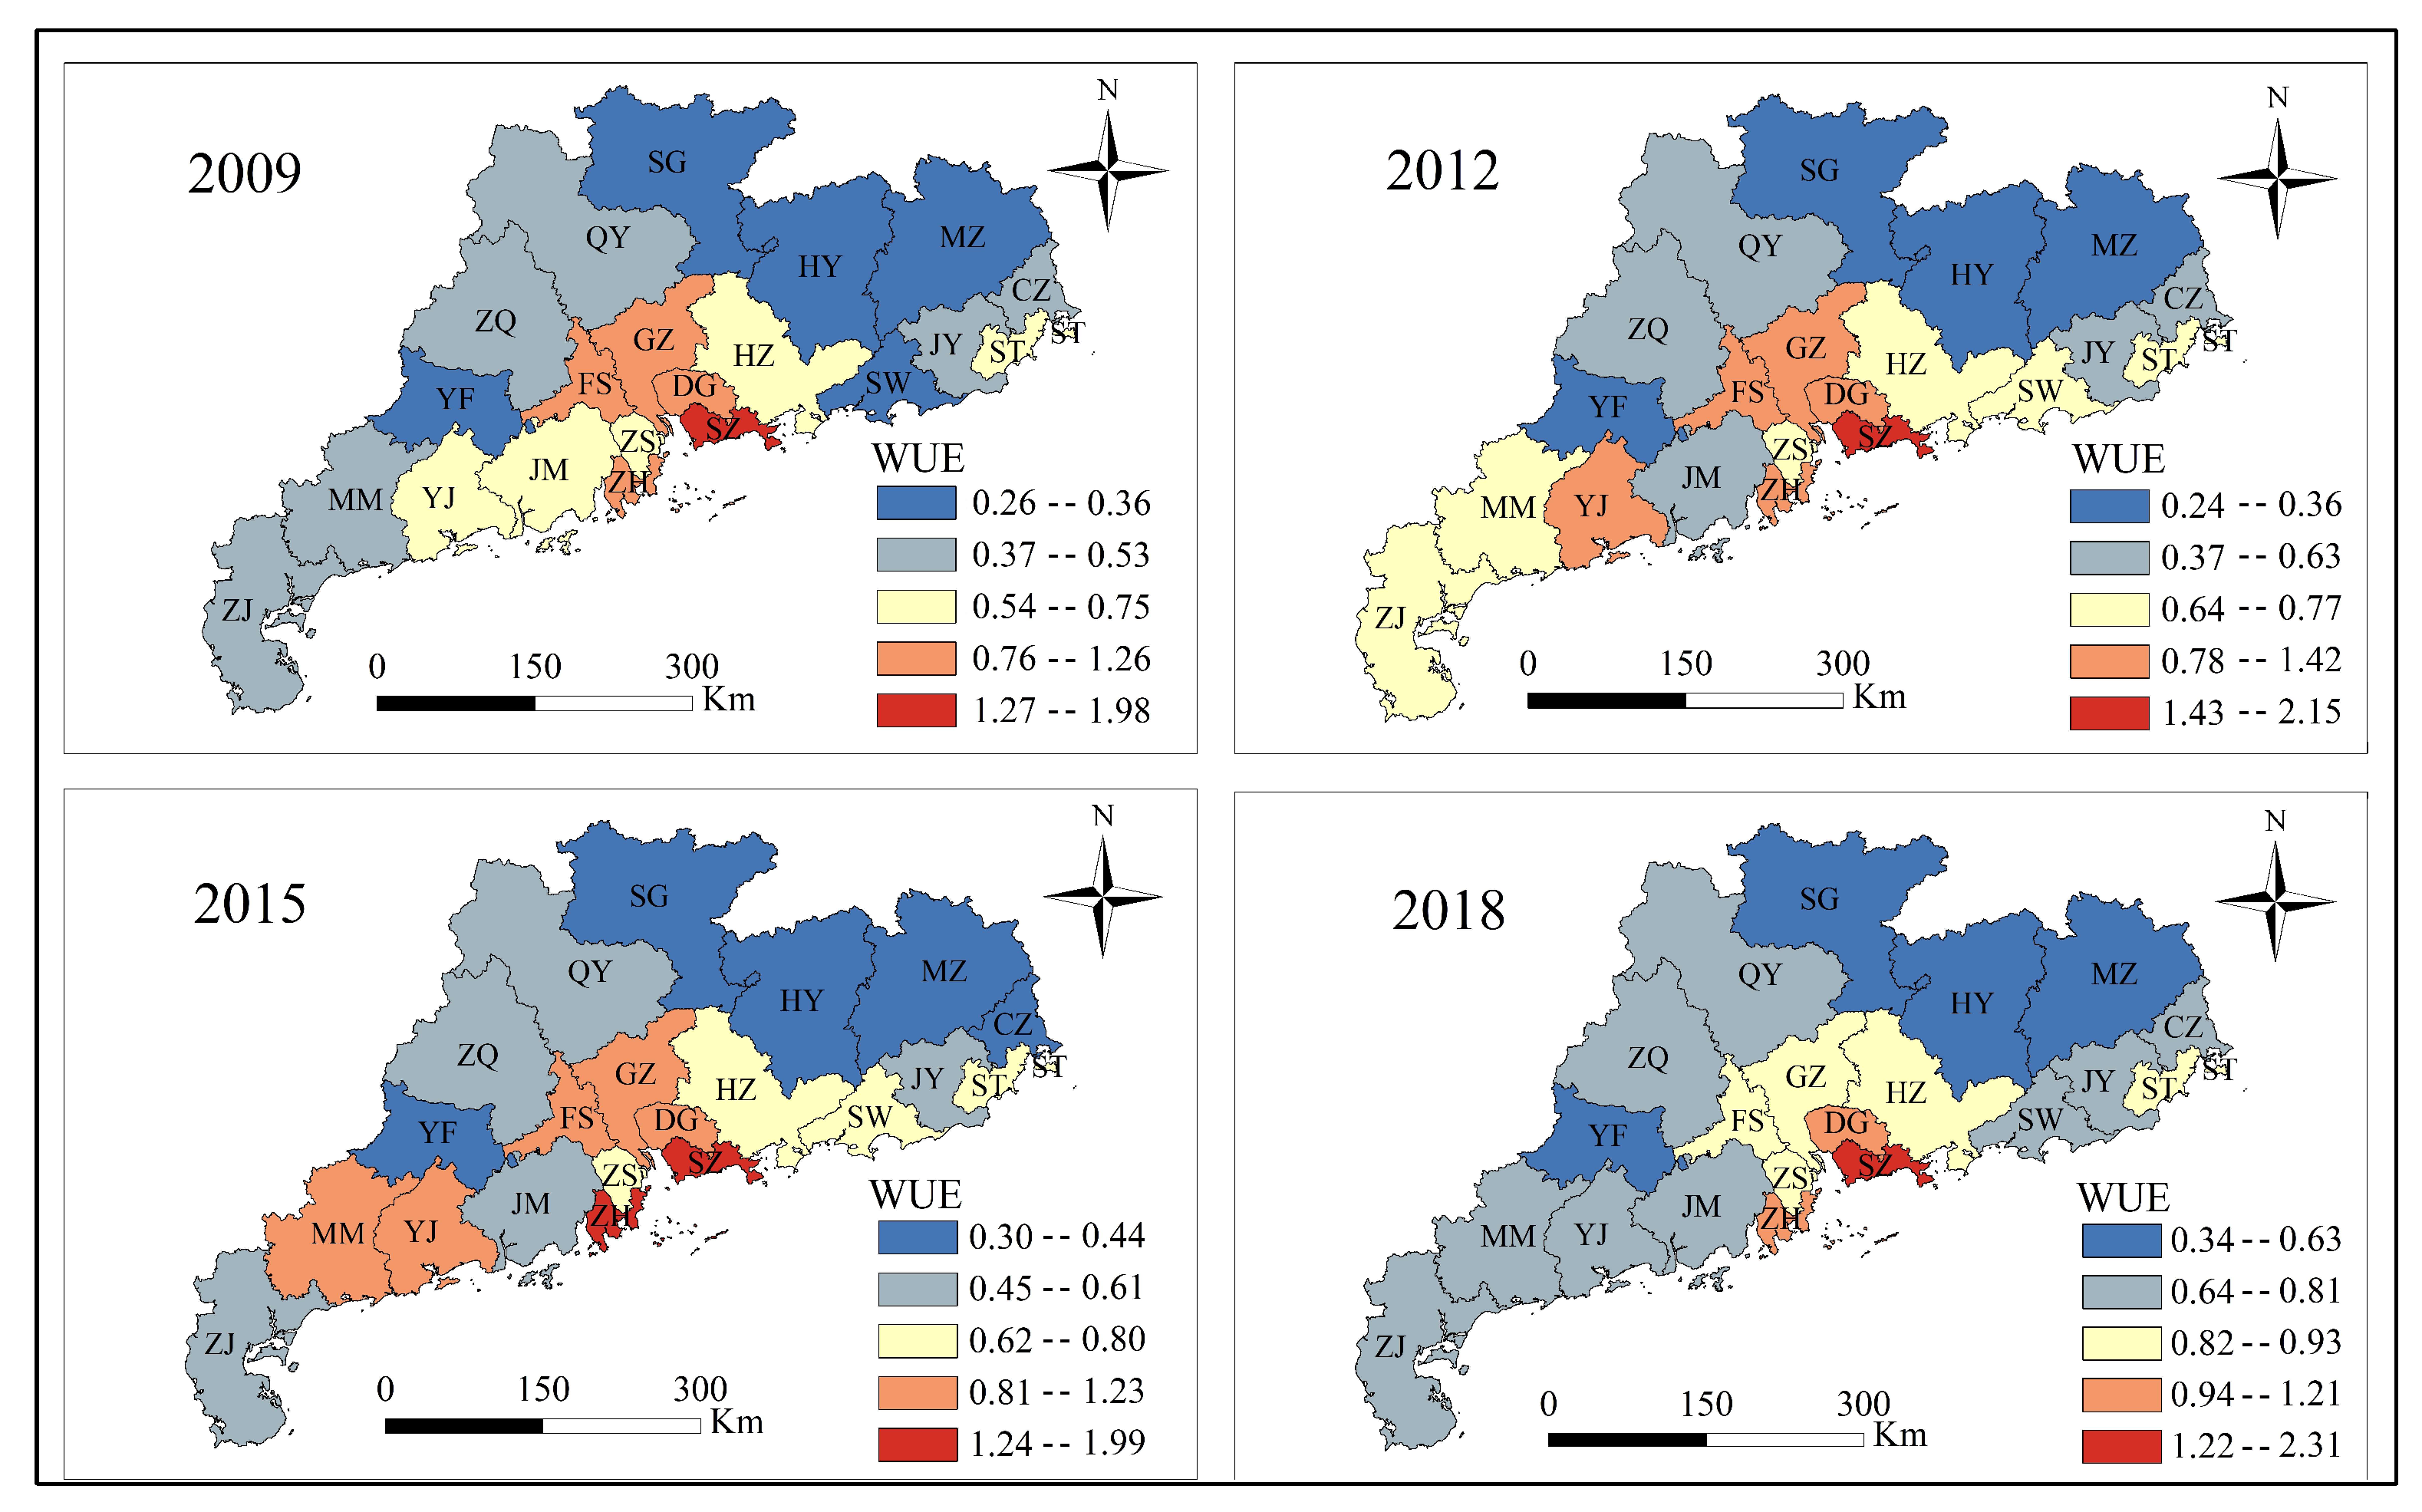
- Using the ISSBM model to estimate the WUE in Guangdong Province revealed that the PRD exhibits the highest WUE, while northern Guangdong exhibits the worst. This indicates the occurrence of a spatial spillover effect with respect to WUE in Guangdong province, which is due to the disparities in geographical location and socioeconomic development.
Author Contributions
Funding
Institutional Review Board Statement
Informed Consent Statement
Data Availability Statement
Conflicts of Interest
References
- Doeffinger, T.; Hall, J.W. Water Stress and Productivity: An Empirical Analysis of Trends and Drivers. Water Resour. Res. 2020, 56, e2019WR025925. [Google Scholar] [CrossRef]
- Li, W.; Xi, Y.; Wu, F.; Masoud, M.; Liu, S. Green development performance of water resources and its economic-related determinants. J. Clean. Prod. 2019, 239, 118048. [Google Scholar] [CrossRef]
- Hoekstra, A.; Chapagain, A.; Van Oel, P. Advancing Water Footprint Assessment Research: Challenges in Monitoring Progress towards Sustainable Development Goal 6. Water 2017, 9, 438. [Google Scholar] [CrossRef] [Green Version]
- Song, J.; Yin, Y.; Xu, H.; Wang, Y.; Wu, P.; Sun, S. Drivers of domestic grain virtual water flow: A study for China. Agric. Water Manag. 2020, 239, 106175. [Google Scholar] [CrossRef]
- Liu, J.; Mooney, H.; Hull, V.; Davis, S.J.; Gaskell, J.; Hertel, T.; Lubchenco, J.; Seto, K.C.; Gleick, P.; Kremen, C.; et al. Systems integration for global sustainability. Science 2015, 347, 1258832. [Google Scholar] [CrossRef] [Green Version]
- Department of Economic and Social Affairs Sustainable Development in Home Page of United Nations. Available online: https://sdgs.un.org/ (accessed on 25 September 2015).
- Hu, J.; Wang, S.; Yeh, F.Y. Total-factor water efficiency of regions in China. Resour. Policy 2006, 31, 217–230. [Google Scholar] [CrossRef]
- Ma, H.; Shi, C.; Chou, N.T. China’s Water Utilization Efficiency: An Analysis with Environmental Considerations. Sustainability 2016, 8, 516. [Google Scholar] [CrossRef] [Green Version]
- Men, B.; Liu, H.; Tian, W.; Liu, H. Evaluation of Sustainable Use of Water Resources in Beijing Based on Rough Set and Fuzzy Theory. Water 2017, 9, 852. [Google Scholar] [CrossRef] [Green Version]
- Geng, Q.; Ren, Q.; Nolan, R.H.; Wu, P.; Yu, Q. Assessing China’s agricultural water use efficiency in a green-blue water perspective: A study based on data envelopment analysis. Ecol. Indic. 2019, 96, 329–335. [Google Scholar] [CrossRef]
- Fall, F.; Akim, A.M.; Wassongma, H. DEA and SFA research on the efficiency of microfinance institutions: A meta-analysis. World Dev. 2018, 107, 176–188. [Google Scholar] [CrossRef] [Green Version]
- Li, M.; Long, K. Direct or Spillover Effect: The Impact of Pure Technical and Scale Efficiencies of Water Use on Water Scarcity in China. Int. J. Environ. Res. Public Health 2019, 16, 3401. [Google Scholar] [CrossRef] [PubMed] [Green Version]
- Charnes, A.; Cooper, W.W.; Rhodes, E. Measuring the efficiency of decision making units. Eur. J. Oper. Res. 1978, 2, 429–444. [Google Scholar] [CrossRef]
- D’Inverno, G.; Carosi, L.; Romano, G.; Guerrini, A. Water pollution in wastewater treatment plants: An efficiency analysis with undesirable output. Eur. J. Oper. Res. 2018, 269, 24–34. [Google Scholar] [CrossRef] [Green Version]
- Lo Storto, C. Measuring the efficiency of the urban integrated water service by parallel network DEA: The case of Italy. J. Clean. Prod. 2020, 276, 123170. [Google Scholar] [CrossRef]
- Morales, M.; Heaney, J. Benchmarking Nonresidential Water Use Efficiency Using Parcel-Level Data. J. Water Resour. Plan. Manag. 2016, 142, 04015064. [Google Scholar] [CrossRef] [Green Version]
- Brettenny, W.; Sharp, G. Efficiency evaluation of urban and rural municipal water service authorities in South Africa: A data envelopment analysis approach. Water SA 2016, 42, 11–19. [Google Scholar] [CrossRef] [Green Version]
- Alsharif, K.; Feroz, E.H.; Klemer, A.; Raab, R. Governance of water supply systems in the Palestinian Territories: A data envelopment analysis approach to the management of water resources. J. Environ. Manag. 2008, 87, 80–94. [Google Scholar] [CrossRef]
- Shi, C.; Zeng, X.; Yu, Q.; Shen, J.; Li, A. Dynamic evaluation and spatiotemporal evolution of China’s industrial water use efficiency considering undesirable output. Environ. Sci. Pollut. Res. Int. 2021, 28, 20839–20853. [Google Scholar] [CrossRef]
- Tian, N.; Tang, S.; Che, A.; Wu, P. Measuring regional transport sustainability using super-efficiency SBM-DEA with weighting preference. J. Clean. Prod. 2020, 242, 118474. [Google Scholar] [CrossRef]
- Jiang, Y. China’s water security: Current status, emerging challenges and future prospects. Environ. Sci. Policy 2015, 54, 106–125. [Google Scholar] [CrossRef]
- Wang, J.; Li, L.; Li, F.; Kharrazi, A.; Bai, Y. Regional footprints and interregional interactions of chemical oxygen demand discharges in China. Resour. Conserv. Recycl. 2018, 132, 386–397. [Google Scholar] [CrossRef]
- Zhang, P.; Zou, Z.; Liu, G.; Feng, C.; Liang, S.; Xu, M. Socioeconomic drivers of water use in China during 2002–2017. Resour. Conserv. Recycl. 2020, 154, 104636. [Google Scholar] [CrossRef]
- The People’s Republic of China. Available online: http://www.gov.cn/zhengce/2020-11/03/content_5556991.htm (accessed on 3 November 2020).
- Fu, J.; Xiao, G.; Guo, L.; Wu, C. Measuring the Dynamic Efficiency of Regional Industrial Green Transformation in China. Sustainability 2018, 10, 628. [Google Scholar] [CrossRef] [Green Version]
- Xian, C.; Fan, Y.; Zhang, J.; Zhang, L. Assessing sustainable water utilization from a holistic view: A case study of Guangdong, China. Sustain. Cities Soc. 2022, 76, 103428. [Google Scholar] [CrossRef]
- Charnes, A.; Cooper, W.W.; Golany, B.; Seiford, L. Foundation of data envelopment analysis and Pareto-Koopmans empirical production functions. J. Econom. 1985, 30, 91–107. [Google Scholar] [CrossRef]
- Pastor, J.T.; Ruiz, J.L.; Sirvent, I. An enhanced DEA Russell graph efficiency measure. Eur. J. Oper. Res. 1999, 115, 596–607. [Google Scholar] [CrossRef]
- Tone, K. A slacks-based measure of efficiency in data envelopment analysis. Eur. J. Oper. Res. 2001, 130, 498–509. [Google Scholar] [CrossRef] [Green Version]
- Tone, K. A slacks-based measure of super-efficiency in data-envelopment-analysis. Eur. J. Oper. Res. 2002, 143, 32–41. [Google Scholar] [CrossRef] [Green Version]
- Tone, K. Dealing with Undesirable Outputs in DEA-A Slacks-Based Measure (SBM) Approach. GRIPS Research Report Series 2003–2005. 2003, pp. 1–16. Available online: https://www.researchgate.net/publication/284047010 (accessed on 3 December 2003).
- Tone, K.; Toloo, M.; Izadikhah, M. A modified slacks-based measure of efficiency in data envelopment analysis. Eur. J. Oper. Res. 2020, 287, 560–571. [Google Scholar] [CrossRef]
- Wang, K.; Wei, Y.-M.; Zhang, X. A comparative analysis of China’s regional energy and emission performance: Which is the better way to deal with undesirable outputs? Energy Policy 2012, 46, 574–584. [Google Scholar] [CrossRef]
- Shi, G.; Bi, J.; Wang, J. Chinese regional industrial energy efficiency evaluation based on a DEA model of fixing non-energy inputs. Energy Policy 2010, 38, 6172–6179. [Google Scholar] [CrossRef]
- Fare, R.; Grosskopf, S.; Pasurkajr, C. Environmental production functions and environmental directional distance functions. Energy 2007, 32, 1055–1066. [Google Scholar] [CrossRef]
- Faere, R.; Grosskopf, S.; Lovell, C.A.K.; Pasurka, C. Multilateral Productivity Comparisons When Some Outputs are Undesirable: A Nonparametric Approach. Rev. Econ. Stat. 1989, 71, 90–98. [Google Scholar] [CrossRef]
- Seiford, L.M.; Zhu, J. Modeling undesirable factors in efficiency evaluation. Eur. J. Oper. Res. 2002, 142, 16–20. [Google Scholar] [CrossRef]
- Liu, J.; Tone, K. A multistage method to measure efficiency and its application to Japanese banking industry. Socio-Econ. Plan. Sci. 2008, 42, 75–91. [Google Scholar] [CrossRef]
- Castellet, L.; Molinos-Senante, M. Efficiency assessment of wastewater treatment plants: A data envelopment analysis approach integrating technical, economic, and environmental issues. J. Environ. Manag. 2016, 167, 160–166. [Google Scholar] [CrossRef]
- Liu, K.; Yang, G.; Yang, D. Investigating industrial water-use efficiency in mainland China: An improved SBM-DEA model. J. Environ. Manag. 2020, 270, 110859. [Google Scholar] [CrossRef]
- Xu, Z.; Chau, S.; Chen, X.; Zhang, J.; Li, Y.; Dietz, T.; Wang, J.; Winkler, J.A.; Fan, F.; Huang, B.; et al. Assessing progress towards sustainable development over space and time. Nature 2020, 577, 74–78. [Google Scholar] [CrossRef]
- Zhou, Q.; Wang, W.; Pang, Y. Temporal and spatial distribution characteristics of water resources in Guangdong Province based on a cloud model. Water Sci. Eng. 2015, 8, 263–272. [Google Scholar] [CrossRef] [Green Version]
- Yuan, Y.; Wu, F. Regional Social Inequalities and Social Deprivation in Guangdong Province, China. Growth Change 2013, 44, 149–167. [Google Scholar] [CrossRef]
- Zhang, Y.; Tong, D.; Liang, X. New perspective on regional inequality: Theory and evidence from Guangdong. J. Urban Plan. Dev. 2018, 144, 04018002. [Google Scholar] [CrossRef]
- Li, J.; Ma, X. Econometric analysis of industrial water use efficiency in China. Environ. Dev. Sustain. 2014, 17, 1209–1226. [Google Scholar] [CrossRef]
- Wang, S.; Zhou, L.; Wang, H.; Li, X. Water Use Efficiency and Its Influencing Factors in China: Based on the Data Envelopment Analysis (DEA)—Tobit Model. Water 2018, 10, 832. [Google Scholar] [CrossRef] [Green Version]
- Zhou, Z.; Wu, H.; Song, P. Measuring the resource and environmental efficiency of industrial water consumption in China: A non-radial directional distance function. J. Clean. Prod. 2019, 240, 118169. [Google Scholar] [CrossRef]
- Golany, B.; Roll, Y. An application procedure for DEA. Omega Int. J. Manag. Sci. 1989, 17, 237–250. [Google Scholar] [CrossRef]
- Norris, G. Defining Urban Deprivation; Urban Deprivation and the Inner City: London, UK, 1979; pp. 17–31. [Google Scholar]
- Pearce, J.R.; Richardson, E.A.; Mitchell, R.J.; Shortt, N.K. Environmental justice and health: A study of multiple environmental deprivation and geographical inequalities in health in New Zealand. Soc. Sci. Med. 2011, 73, 410–420. [Google Scholar] [CrossRef] [Green Version]
- Yuan, Y.; Wu, F. The development of the index of multiple deprivations from small-area population census in the city of Guangzhou, PRC. Habitat Int. 2014, 41, 142–149. [Google Scholar] [CrossRef]
- He, Y.; Wang, Y.; Chen, X. Spatial patterns and regional differences of inequality in water resources exploitation in China. J. Clean. Prod. 2019, 227, 835–848. [Google Scholar] [CrossRef]
- Deng, G.; Li, L.; Song, Y. Provincial water use efficiency measurement and factor analysis in China: Based on SBM-DEA model. Ecol. Indic. 2016, 69, 12–18. [Google Scholar] [CrossRef]
- Bian, Y.; Yan, S.; Xu, H. Effic.iency evaluation for regional urban water use and wastewater decontamination systems in China: A DEA approach. Resour. Conserv. Recycl. 2014, 83, 15–23. [Google Scholar] [CrossRef]
- Suzuki, S.; Nijkamp, P. An evaluation of energy-environment-economic efficiency for EU, APEC and ASEAN countries: Design of a Target-Oriented DFM model with fixed factors in Data Envelopment Analysis. Energy Policy 2016, 88, 100–112. [Google Scholar] [CrossRef]


| Author(s) and Year | Research Content | Contributions |
|---|---|---|
| Charnes et al. (1978) [13] | New definition of efficiency related to multiple inputs and outputs, and derivation of the first proposed CCR model. | Innovative work in the domain of DEA. |
| Charnes et al. (1985) [27] | Construction and analysis of the Pareto-efficient frontier production function. | Development of the additive DEA model to directly deal with input excesses and output shortages without scalar measures. |
| Pastor et al. (1999) [28] | Determination of a solution to the Russell graph measure for interpretative and computational difficulties. | New DEA global efficiency measure. |
| Tone (2001) [29] | Derivation of a slack-based measure (SBM) for DEA efficiency, and comparison with related models. | Proposal of SBM to directly deal with input excesses and output shortfalls with scalar measures. |
| Tone (2002) [30] | Derivation of a super-efficient slack-based measure. | Proposed super-efficient approach effectively discriminates efficient DMUs. |
| Tone (2003) [31] | Derivation of SBM model that simultaneously copes with desirable and undesirable outputs. | Modified SBM model to account for undesirable outputs. |
| Tone et al. (2020) [32] | Derivation of a modified model that combines the SBM and Super-SBM. | Proposed model can simultaneously measure SBM and Super-SBM efficiency scores. |
| Year | Variable | Water Inputs | Non-Water Inputs | Desirable Outputs | Undesirable Output | ||||
|---|---|---|---|---|---|---|---|---|---|
| PIWGDP | SIWGDP | TIWGDP | LGDP | CSGDP | GDPWC | Social Equality | WWEGDP | ||
| 2009 | Mean | 1206.70 | 85.50 | 83.91 | 23.36 | 6053.42 | 90.73 | 0.37 | 22.83 |
| SD | 410.68 | 62.56 | 40.08 | 10.67 | 2479.44 | 110.30 | 0.20 | 6.95 | |
| 2010 | Mean | 1048.33 | 73.31 | 73.22 | 19.77 | 5583.91 | 103.77 | 0.28 | 20.26 |
| SD | 388.52 | 54.78 | 32.88 | 8.26 | 2265.49 | 122.94 | 0.20 | 6.63 | |
| 2011 | Mean | 938.03 | 63.47 | 64.13 | 17.09 | 5140.15 | 120.38 | 0.27 | 16.91 |
| SD | 350.88 | 46.90 | 29.35 | 7.17 | 2060.63 | 141.83 | 0.17 | 4.31 | |
| 2012 | Mean | 853.64 | 54.90 | 57.37 | 15.49 | 4997.75 | 134.71 | 0.53 | 16.74 |
| SD | 337.53 | 43.6 | 24.82 | 6.45 | 2004.21 | 159.82 | 0.20 | 3.88 | |
| 2013 | Mean | 784.06 | 48.87 | 49.48 | 13.65 | 4617.06 | 149.65 | 0.25 | 14.46 |
| SD | 320.57 | 36.27 | 19.89 | 5.58 | 1712.03 | 173.66 | 0.17 | 3.02 | |
| 2014 | Mean | 774.03 | 44.99 | 45.87 | 12.57 | 4462.08 | 161.88 | 0.27 | 13.51 |
| SD | 324.14 | 33.61 | 17.63 | 5.06 | 1651.52 | 186.54 | 0.19 | 3.21 | |
| 2015 | Mean | 726.12 | 40.42 | 42.29 | 11.83 | 4357.56 | 174.01 | 0.24 | 12.67 |
| SD | 302.30 | 28.74 | 16.02 | 4.76 | 1596.15 | 200.13 | 0.17 | 3.07 | |
| 2016 | Mean | 650.18 | 37.54 | 38.32 | 10.99 | 4187.86 | 191.67 | 0.34 | 12.21 |
| SD | 265.77 | 26.69 | 14.51 | 4.35 | 1536.83 | 222.22 | 0.19 | 3.07 | |
| 2017 | Mean | 643.49 | 35.41 | 33.92 | 10.41 | 4073.08 | 211.50 | 0.26 | 11.42 |
| SD | 250.11 | 25.09 | 12.74 | 4.38 | 1544.31 | 255.85 | 0.16 | 3.11 | |
| 2018 | Mean | 589.23 | 30.01 | 30.77 | 9.86 | 3989.06 | 228.05 | 0.36 | 11.03 |
| SD | 218.17 | 21.33 | 10.90 | 4.13 | 1530.36 | 267.04 | 0.18 | 3.17 | |
| Variable | Definition | Unit | Min | Max | Mean | SD |
|---|---|---|---|---|---|---|
| Per capita water resources | m3 | 138.30 | 8524.40 | 2360.30 | 2029.50 | |
| Per capita water consumption | m3 | 163.20 | 826.50 | 463.60 | 160.60 | |
| Urbanization rate | % | 34.40 | 100.00 | 61.90 | 20.10 | |
| Sewage treatment rate | % | 20.80 | 99.10 | 86.30 | 11.20 | |
| Water utilization rate | % | 5.82 | 100.00 | 38.10 | 0.32 | |
| Per capita GDP | CNY | 7637.90 | 141,744.10 | 41,652.40 | 30,611.60 | |
| Water consumption per CNY 10,000 of GDP | m3 | 9.00 | 671.00 | 163.40 | 129.90 | |
| Water consumption per CNY 10,000 value added by industry | m3 | 5.00 | 370.00 | 70.80 | 67.80 | |
| Water consumption per mu of irrigated farmland | m3 | 380.00 | 1004.00 | 728.30 | 128.10 | |
| Waste water emission per CNY 10,000 of GDP | m3 | 5.20 | 47.50 | 17.80 | 7.90 |
| Year | 2009 | 2010 | 2011 | 2012 | 2013 | 2014 | 2015 | 2016 | 2017 | 2018 |
|---|---|---|---|---|---|---|---|---|---|---|
| GDI | 0.35 | 0.32 | 0.44 | 0.42 | 0.48 | 0.48 | 0.45 | 0.46 | 0.36 | 0.36 |
| Non-GDI | 0.49 | 0.48 | 0.42 | 0.40 | 0.27 | 0.26 | 0.27 | 0.33 | 0.26 | 0.26 |
| City | PIWGDP | SIWGDP | TIWGDP | LGDP | CSGDP | ||||||||||
|---|---|---|---|---|---|---|---|---|---|---|---|---|---|---|---|
| OD | SUC | SC | OD | SUC | SC | OD | SUC | SC | OD | SUC | SC | OD | SUC | SC | |
| GZ | 733 | 121 | 121 | 140 | 0 | 0 | 23 | 0 | 0 | 8 | 0 | 0 | 0.73 | 0 | 0 |
| SG | 1663 | 11 | 193 | 168 | 147 | 29 | 70 | 31 | 6 | 24 | 12 | 3 | 0.70 | 0 | 0.11 |
| SZ | 1076 | 0 | 0 | 13 | 11 | 11 | 25 | 16 | 16 | 8 | 1 | 1 | 0.46 | 0.13 | 0.13 |
| ZH | 412 | 199 | 199 | 24 | 0 | 0 | 40 | 0 | 0 | 8 | 0 | 0 | 0.58 | 0 | 0 |
| ST | 1013 | 0 | 174 | 31 | 18 | 0 | 86 | 62 | 13 | 23 | 16 | 4 | 0.94 | 0.51 | 0.10 |
| FS | 1170 | 0 | 0 | 63 | 0 | 0 | 52 | 0 | 0 | 7 | 0 | 0 | 0.32 | 0 | 0 |
| JM | 1909 | 1182 | 178 | 79 | 69 | 7 | 71 | 54 | 6 | 17 | 11 | 1 | 0.68 | 0.37 | 0.07 |
| ZJ | 848 | 0 | 168 | 42 | 31 | 19 | 95 | 75 | 24 | 27 | 20 | 5 | 0.47 | 0.11 | 0.02 |
| MM | 922 | 0 | 176 | 43 | 32 | 16 | 82 | 60 | 10 | 28 | 21 | 5 | 0.66 | 0.26 | 0.13 |
| ZQ | 858 | 0 | 65 | 105 | 94 | 10 | 72 | 51 | 4 | 29 | 23 | 2 | 1.33 | 0.96 | 0.10 |
| HZ | 1422 | 465 | 195 | 69 | 57 | 0 | 62 | 39 | 14 | 17 | 10 | 5 | 0.41 | 0 | 0.04 |
| MZ | 1462 | 1013 | 0 | 220 | 214 | 44 | 128 | 117 | 8 | 42 | 39 | 7 | 0.62 | 0.43 | 0 |
| SW | 1084 | 486 | 116 | 97 | 90 | 14 | 155 | 141 | 27 | 31 | 26 | 5 | 0.25 | 0 | 0.03 |
| HY | 2165 | 1815 | 205 | 238 | 234 | 27 | 146 | 138 | 15 | 32 | 30 | 3 | 0.44 | 0.29 | 0.04 |
| YJ | 923 | 203 | 84 | 22 | 13 | 0 | 96 | 79 | 12 | 31 | 25 | 4 | 0.5 | 0.2 | 0 |
| QY | 1545 | 955 | 229 | 43 | 36 | 0 | 93 | 79 | 20 | 25 | 20 | 6 | 0.61 | 0.36 | 0.13 |
| DG | 960 | 0 | 0 | 53 | 0 | 0 | 45 | 0 | 0 | 11 | 0 | 0 | 0.19 | 0.1 | 0.10 |
| ZS | 1504 | 489 | 60 | 98 | 86 | 4 | 40 | 16 | 0 | 13 | 5 | 0 | 0.53 | 0.09 | 0 |
| CZ | 1105 | 711 | 165 | 78 | 73 | 12 | 101 | 91 | 14 | 29 | 26 | 4 | 0.67 | 0.5 | 0.06 |
| JY | 1181 | 717 | 191 | 42 | 36 | 0 | 117 | 106 | 20 | 32 | 28 | 5 | 0.85 | 0.65 | 0.09 |
| YF | 1375 | 0 | 152 | 119 | 101 | 25 | 155 | 122 | 25 | 39 | 29 | 6 | 0.66 | 0.07 | 0.04 |
Publisher’s Note: MDPI stays neutral with regard to jurisdictional claims in published maps and institutional affiliations. |
© 2022 by the authors. Licensee MDPI, Basel, Switzerland. This article is an open access article distributed under the terms and conditions of the Creative Commons Attribution (CC BY) license (https://creativecommons.org/licenses/by/4.0/).
Share and Cite
Gong, Z.; He, Y.; Chen, X. Evaluation of Regional Water Use Efficiency under Green and Sustainable Development Using an Improved Super Slack-Based Measure Model. Sustainability 2022, 14, 7149. https://doi.org/10.3390/su14127149
Gong Z, He Y, Chen X. Evaluation of Regional Water Use Efficiency under Green and Sustainable Development Using an Improved Super Slack-Based Measure Model. Sustainability. 2022; 14(12):7149. https://doi.org/10.3390/su14127149
Chicago/Turabian StyleGong, Zhenjie, Yanhu He, and Xiaohong Chen. 2022. "Evaluation of Regional Water Use Efficiency under Green and Sustainable Development Using an Improved Super Slack-Based Measure Model" Sustainability 14, no. 12: 7149. https://doi.org/10.3390/su14127149
APA StyleGong, Z., He, Y., & Chen, X. (2022). Evaluation of Regional Water Use Efficiency under Green and Sustainable Development Using an Improved Super Slack-Based Measure Model. Sustainability, 14(12), 7149. https://doi.org/10.3390/su14127149


