
Multilevel Assessment of Seismic Damage and Vulnerability of Masonry Buildings (MUSE-DV) in Historical Centers: Development of a Mobile Android Application


Abstract
1. Introduction
1.1. Survey Forms for the Assessment of Damage and Vulnerability of Masonry Buildings
1.2. Information Technologies for Earthquake-Related Data Collection
1.3. Digitalization
- The accumulation of physical material and data, which must then be reported manually within a digital database; this operation is time consuming and can lead to archiving errors or losses and the consequent slowdown of the following actions;
- Misinterpretations of either the questions (uncertainty in what a field means when the user manual is not available) or the usage of the schedule (e.g., multiple checks when just one is required, see below);
- The need, to complete the survey, of pictures taken onsite which are not directly connected either to the building to which they refer or to a specific component. The reassociation of the pictures to the pertinent elements increases the time needed for the archiving and is similarly affected by possible mistakes;
- Lack of precise geographical positioning.
- Facilitate the surveys through hints and feedbacks;
- Can use portable devices with already mounted acquisition tools (camera, recorder, sketchpad);
- Can store data directly on a centralized database and allow data to be shared;
- Can manage different types of data (e.g., videos, pictures, text notes) and associate them to the correct or building element;
- Simplify the post processing, as the data collected are homogeneous.
2. The MUSE-DV Mobile Application
2.1. Analogical Procedure
2.2. Digital Procedure
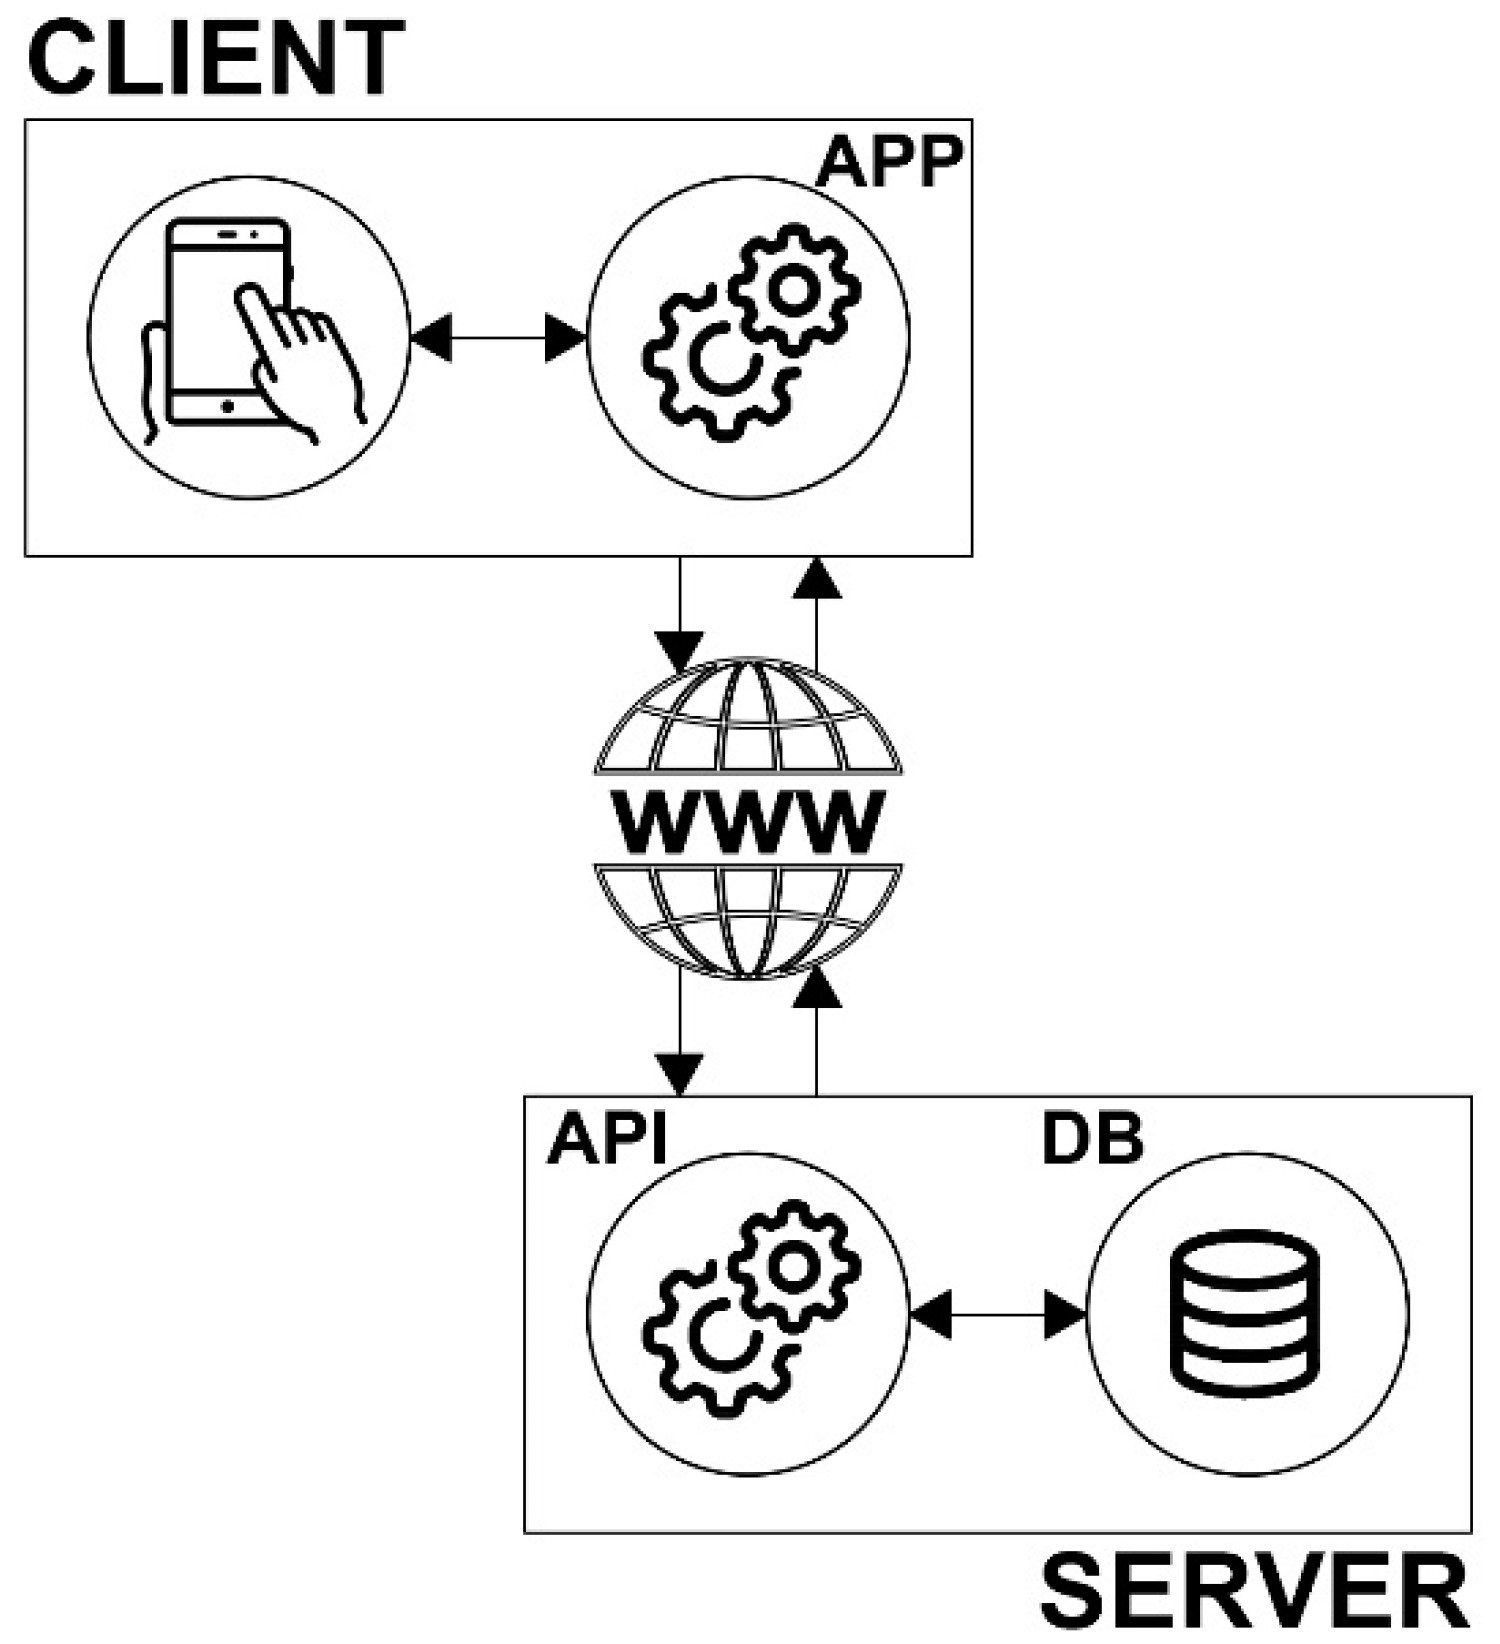
3. App Architecture
- On the server side: (i) the data storage, i.e., a relational database; (ii) the application that queries data and provides the communication between the client and the server (API-REST, i.e., Application Programming Interface-Representational State transfer);
- On the client side: (iii) a sequence of modules framed in graphic interface, i.e., the app that replaces the physical form for data collection; (iv) an application that processes data, i.e., the services.
3.1. Database
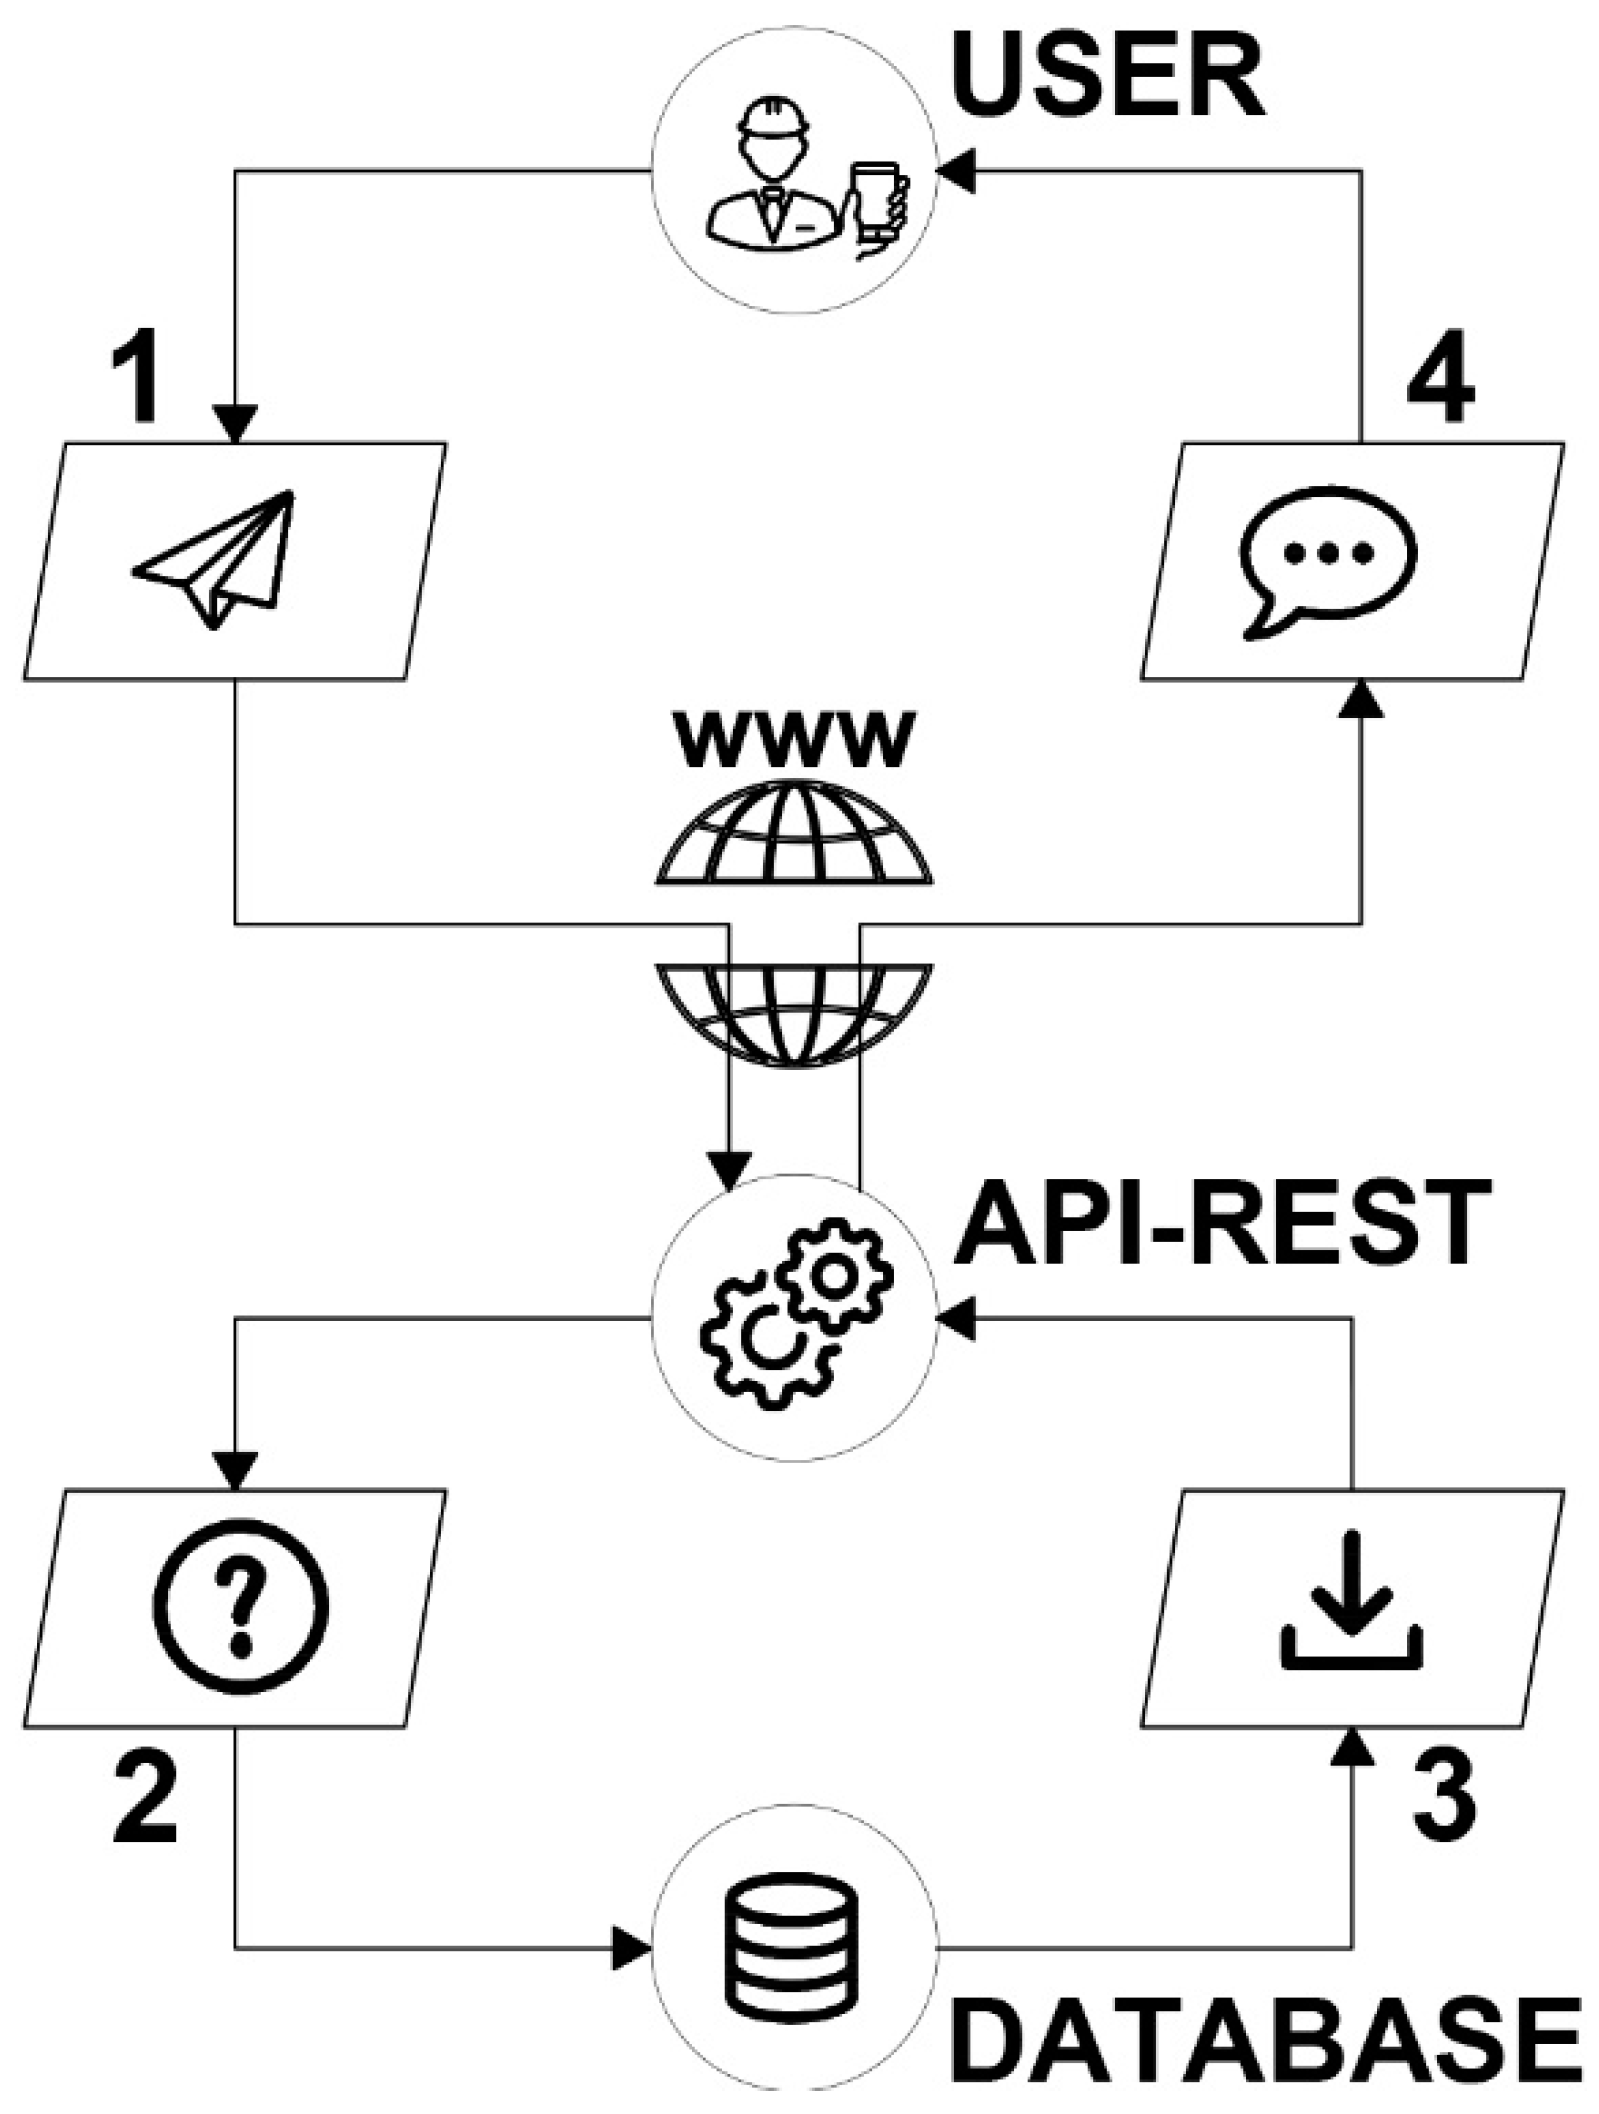
3.2. Data Exchange
- Write data in the database in real time;
- Write data in the database with delay;
- Read data from the database;
- Export data from the database to a file.
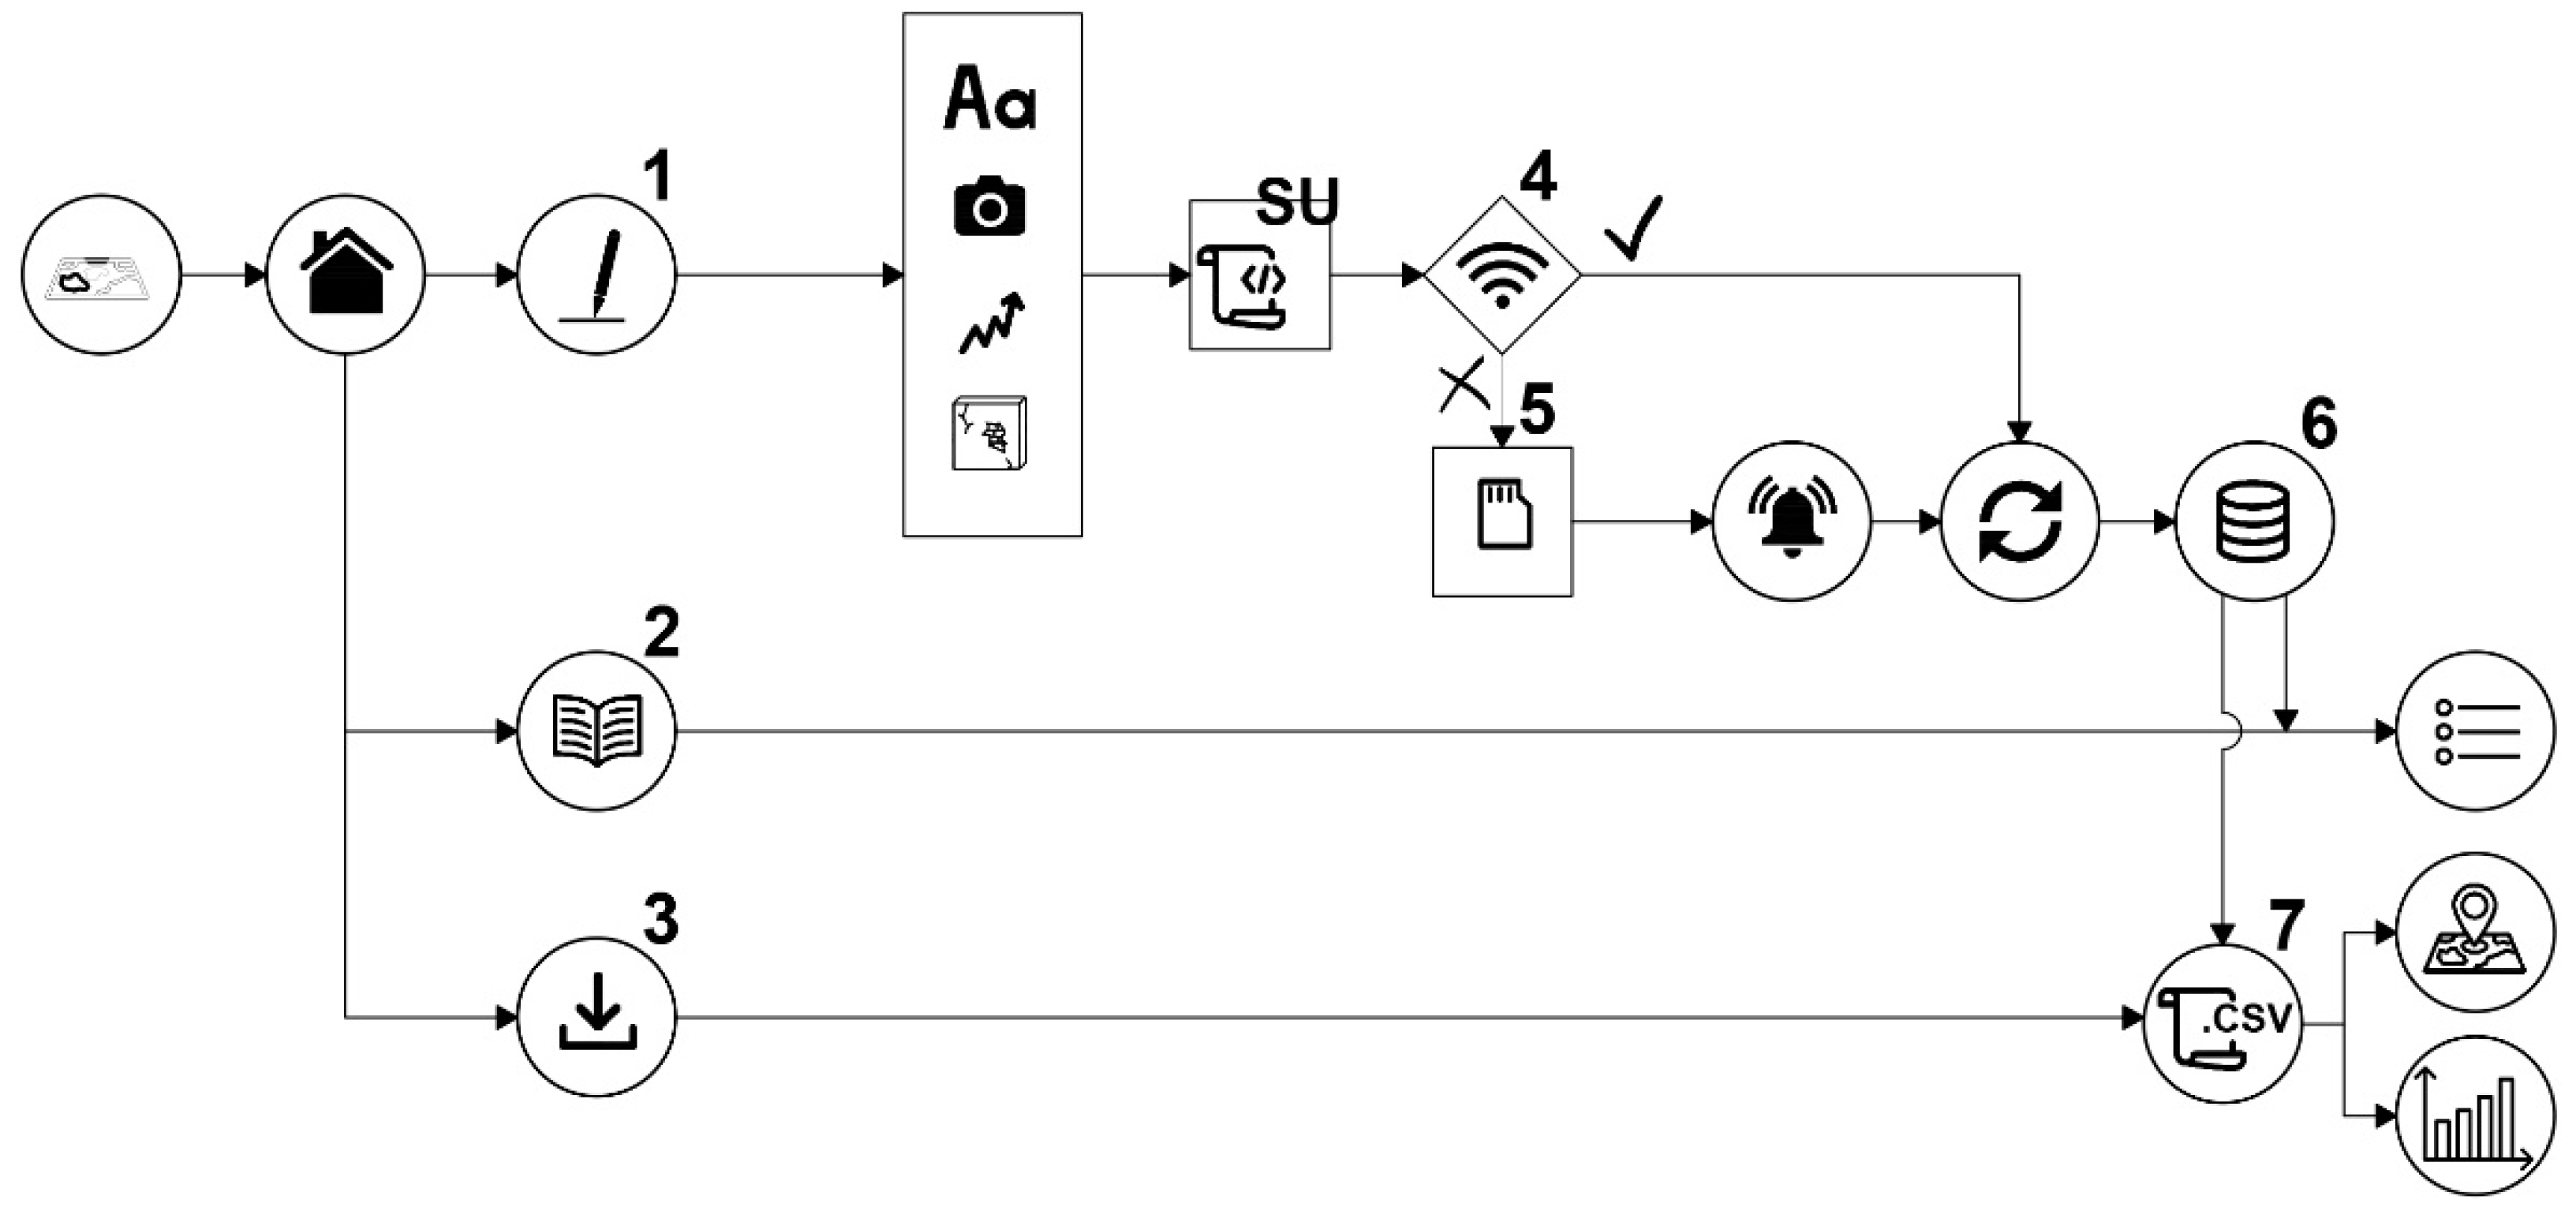
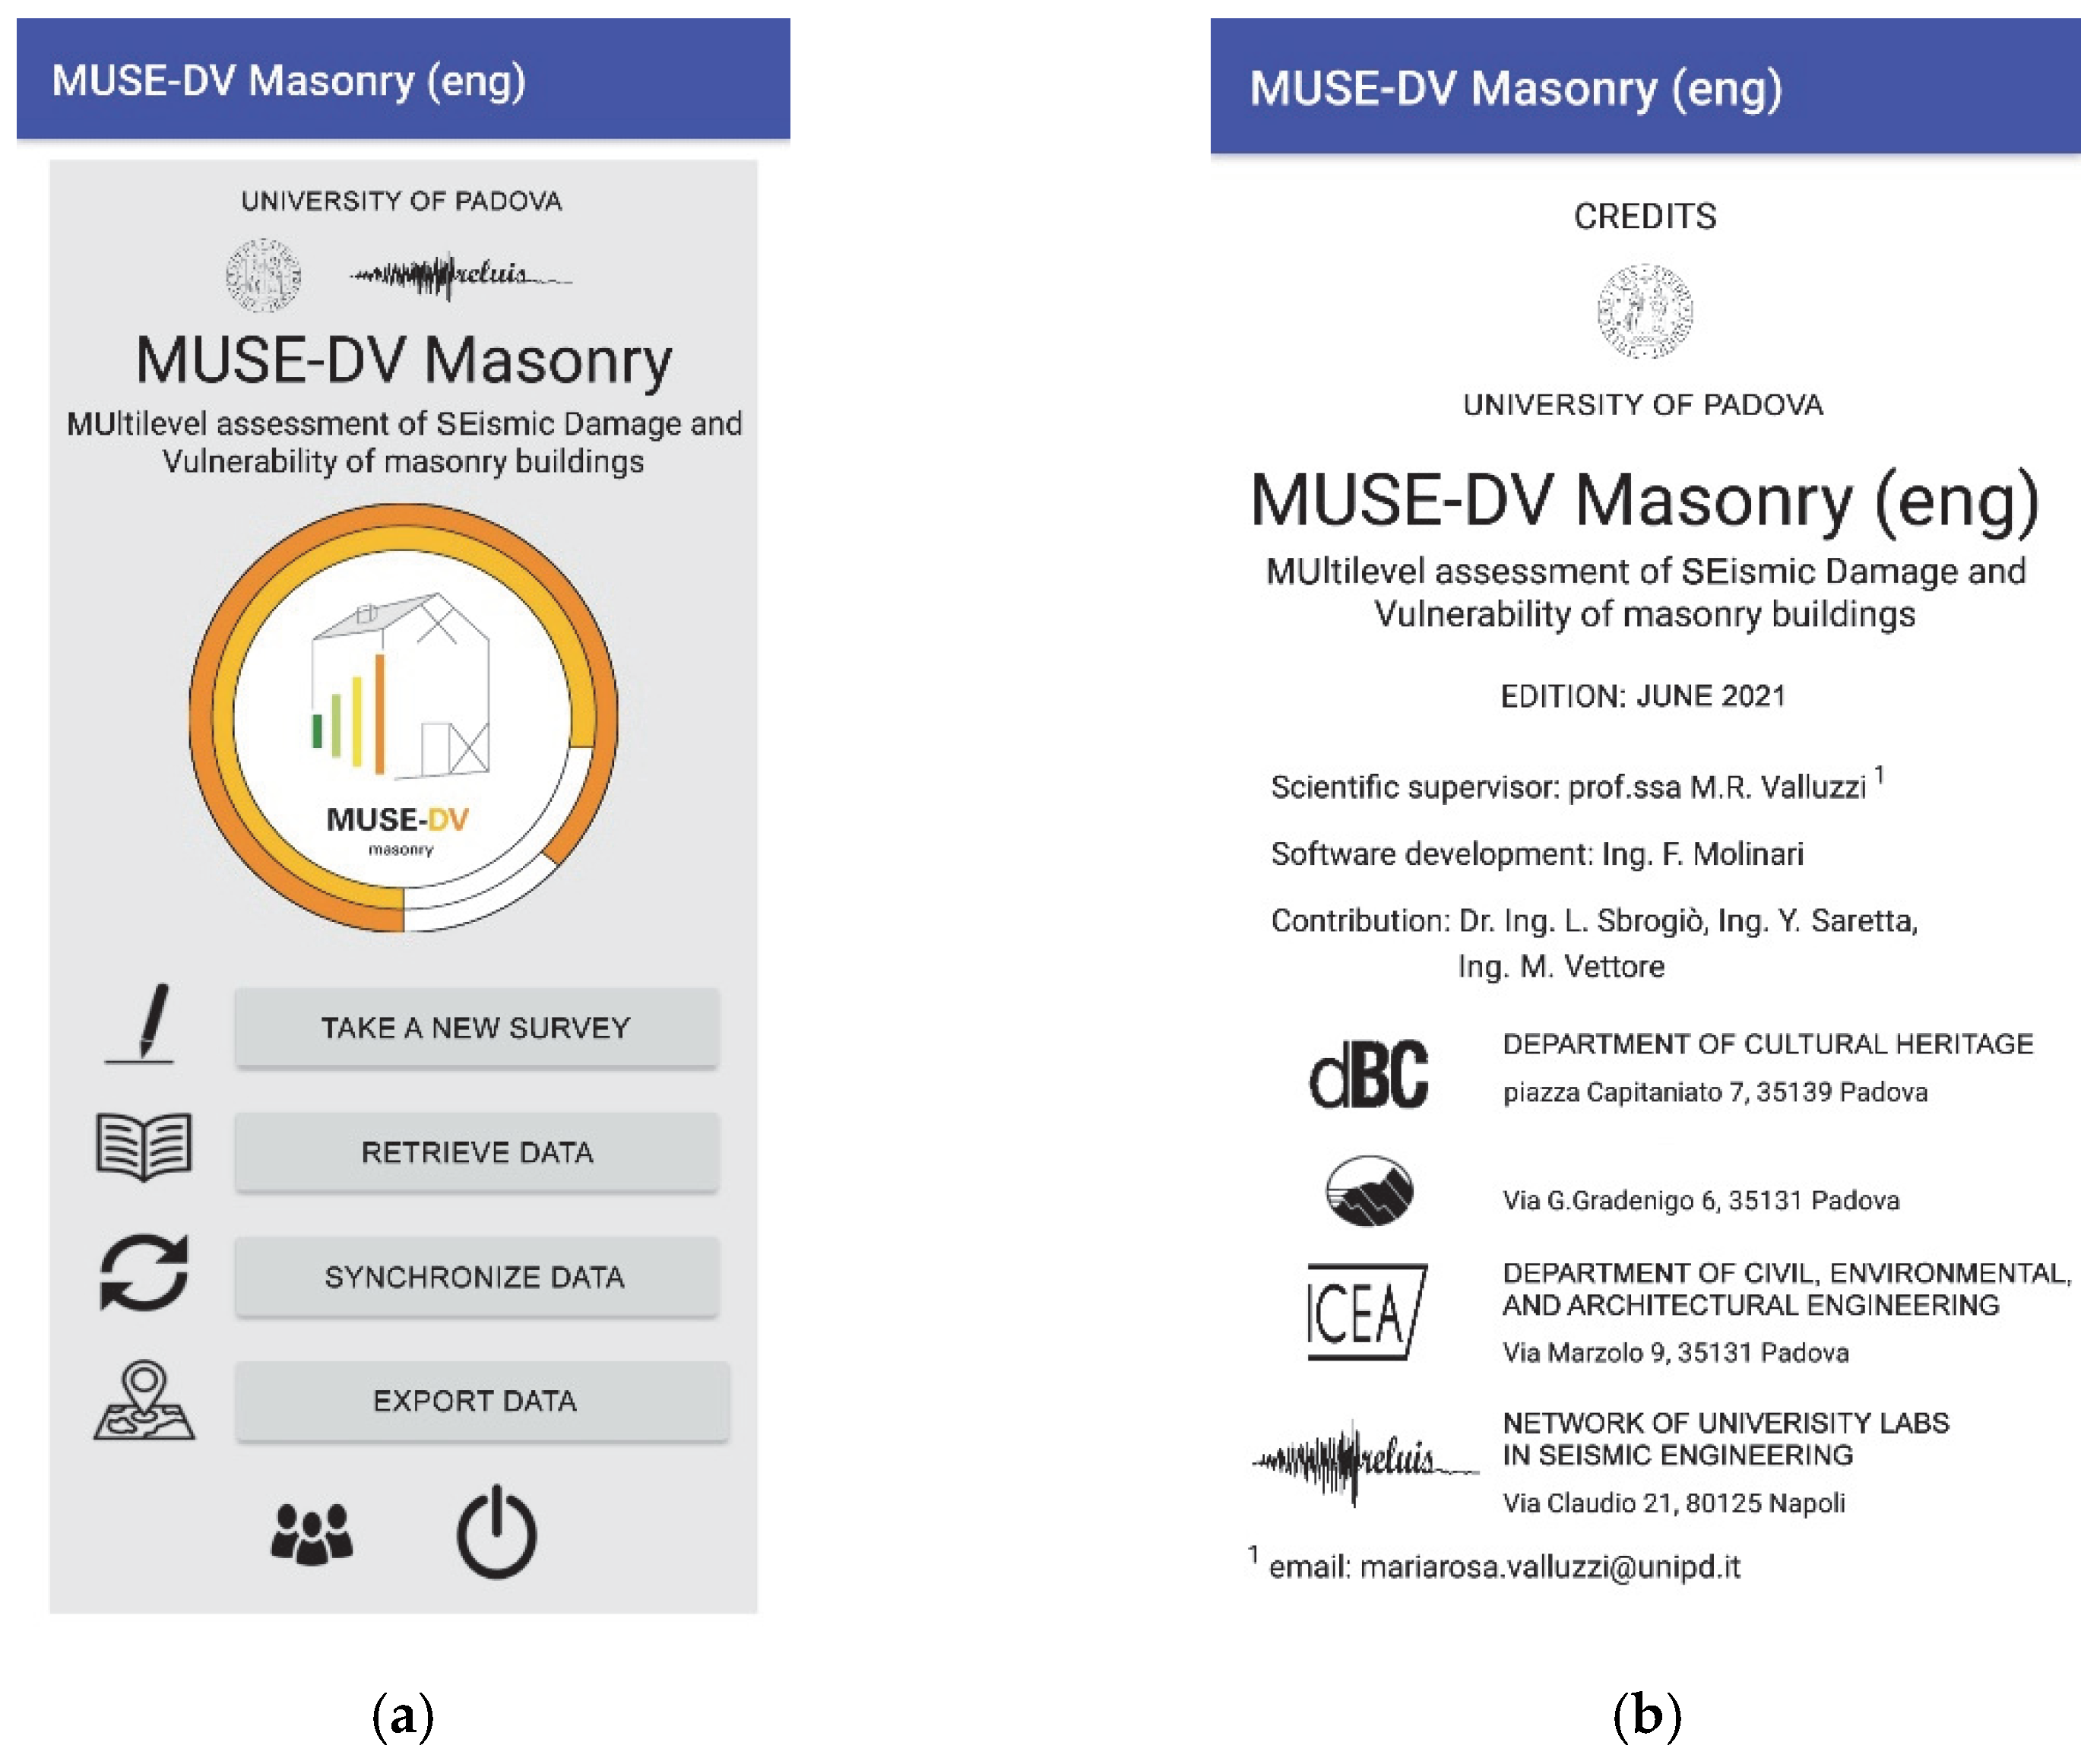
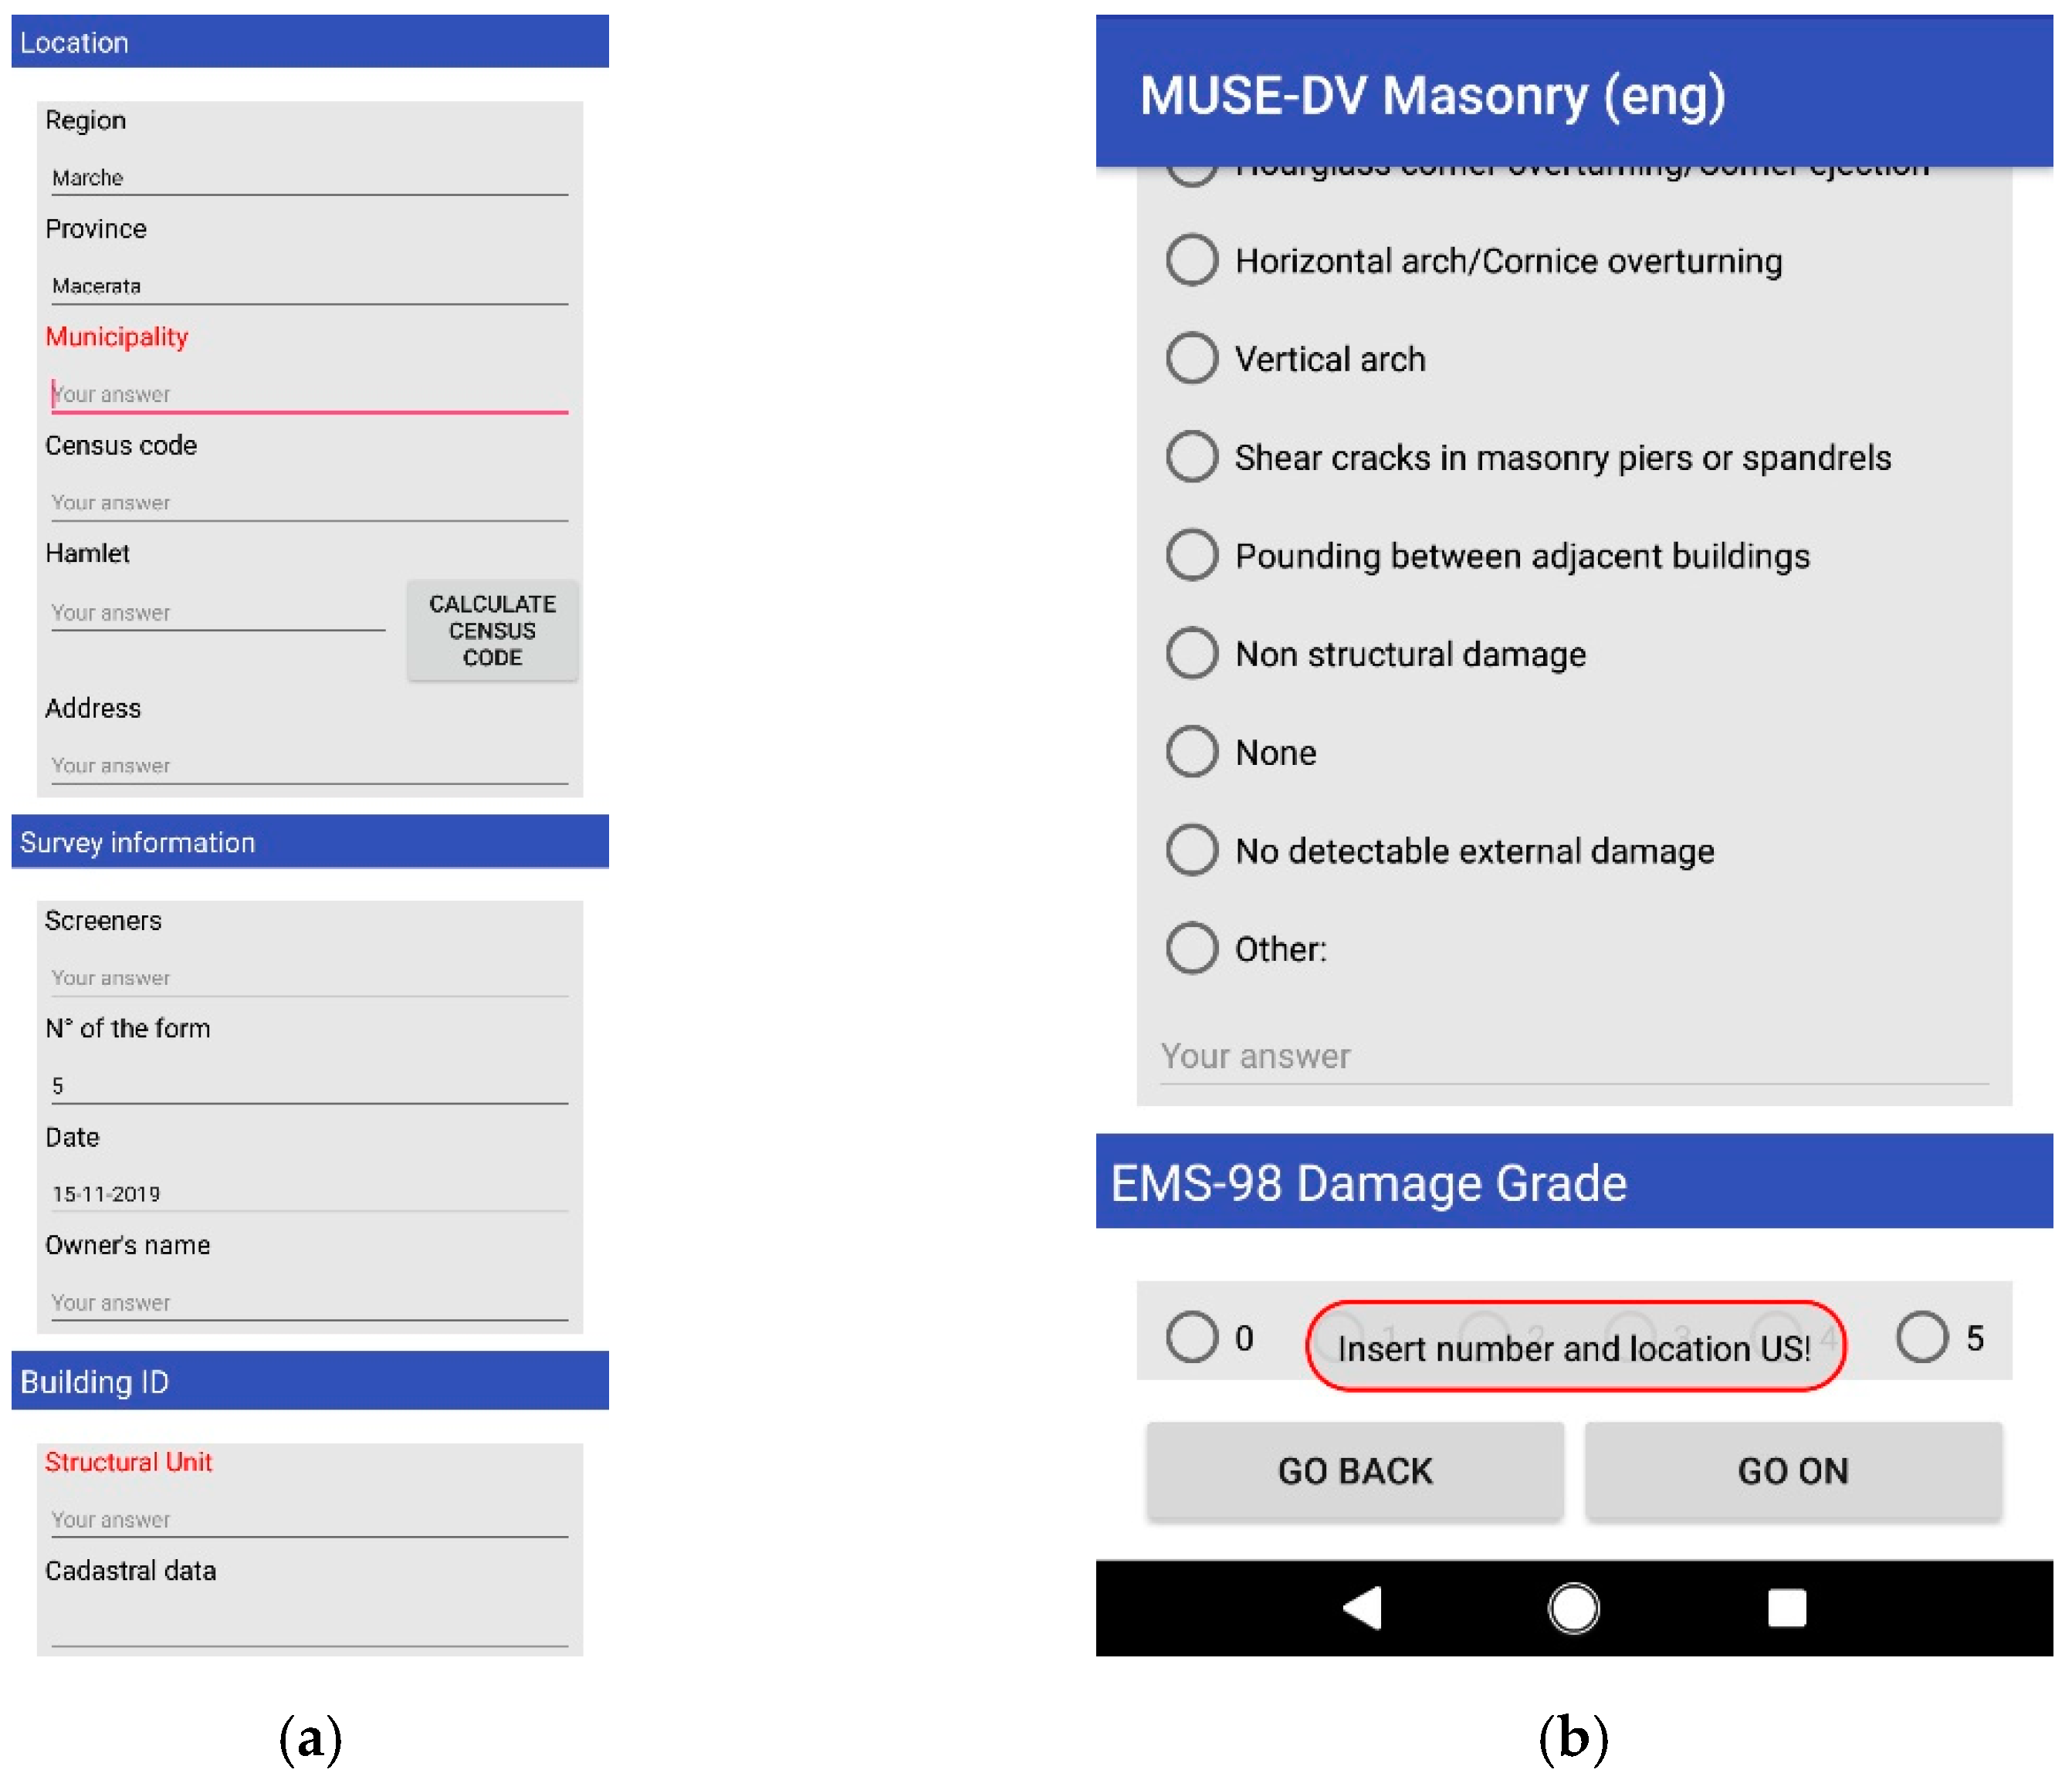
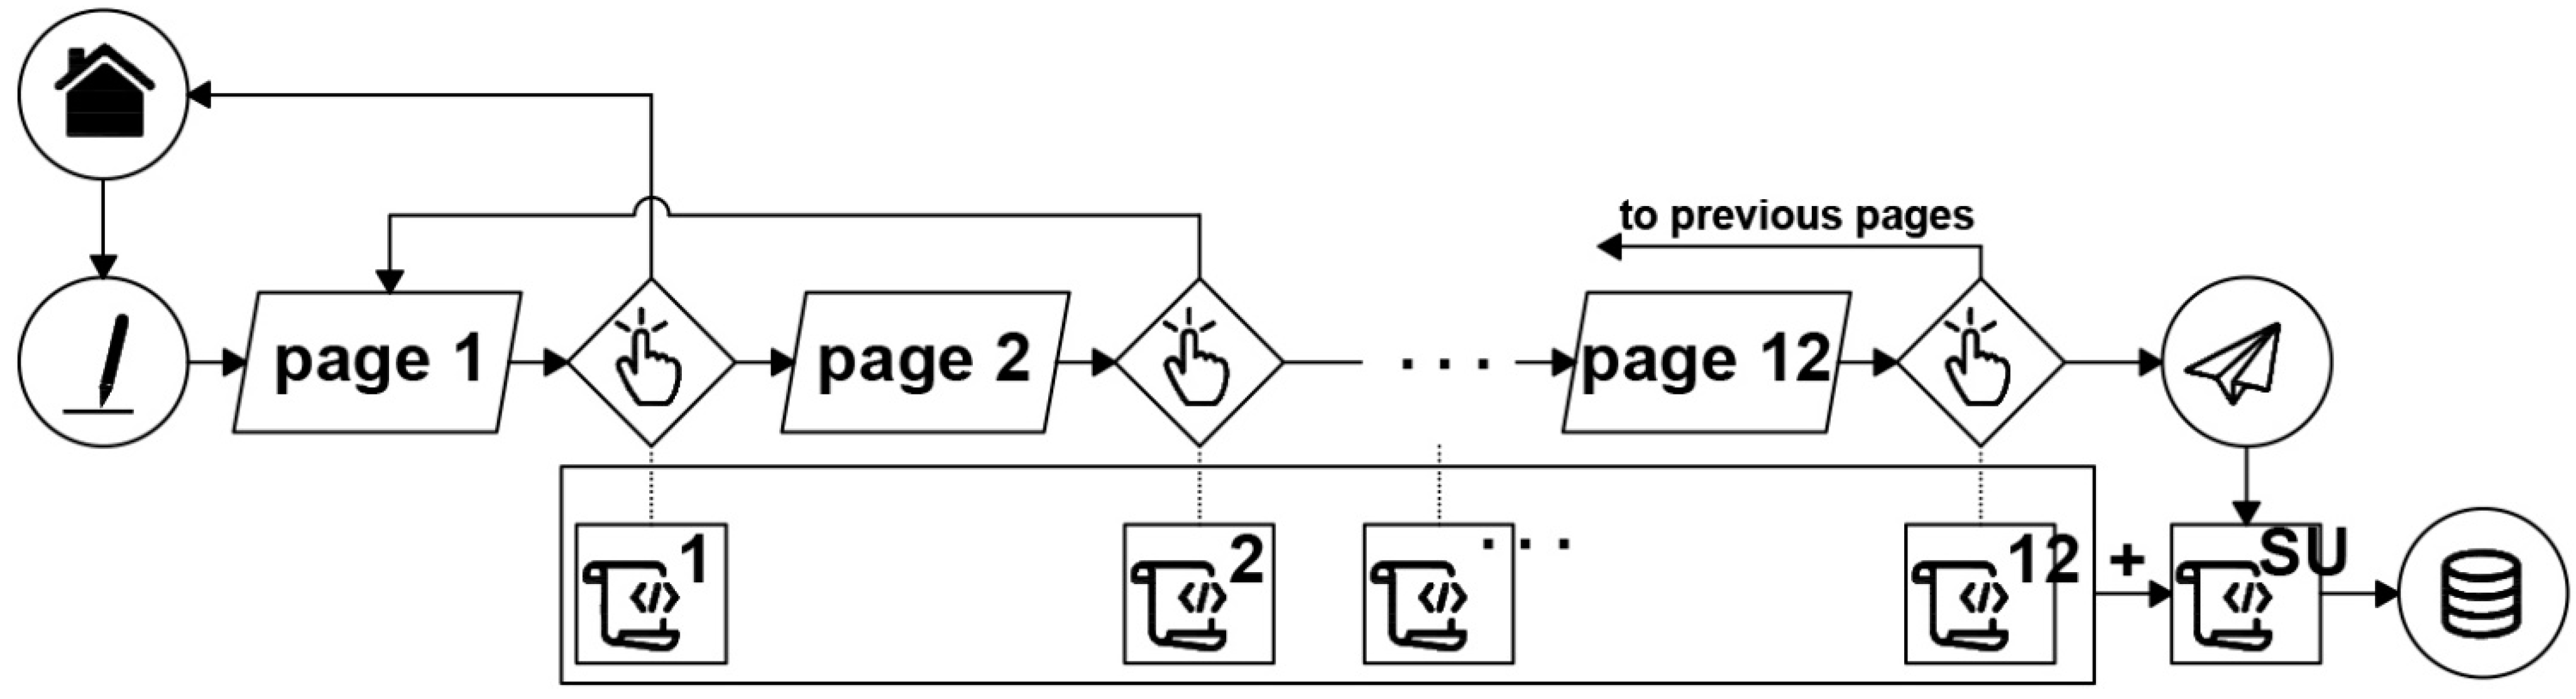
3.3. Graphic Interface
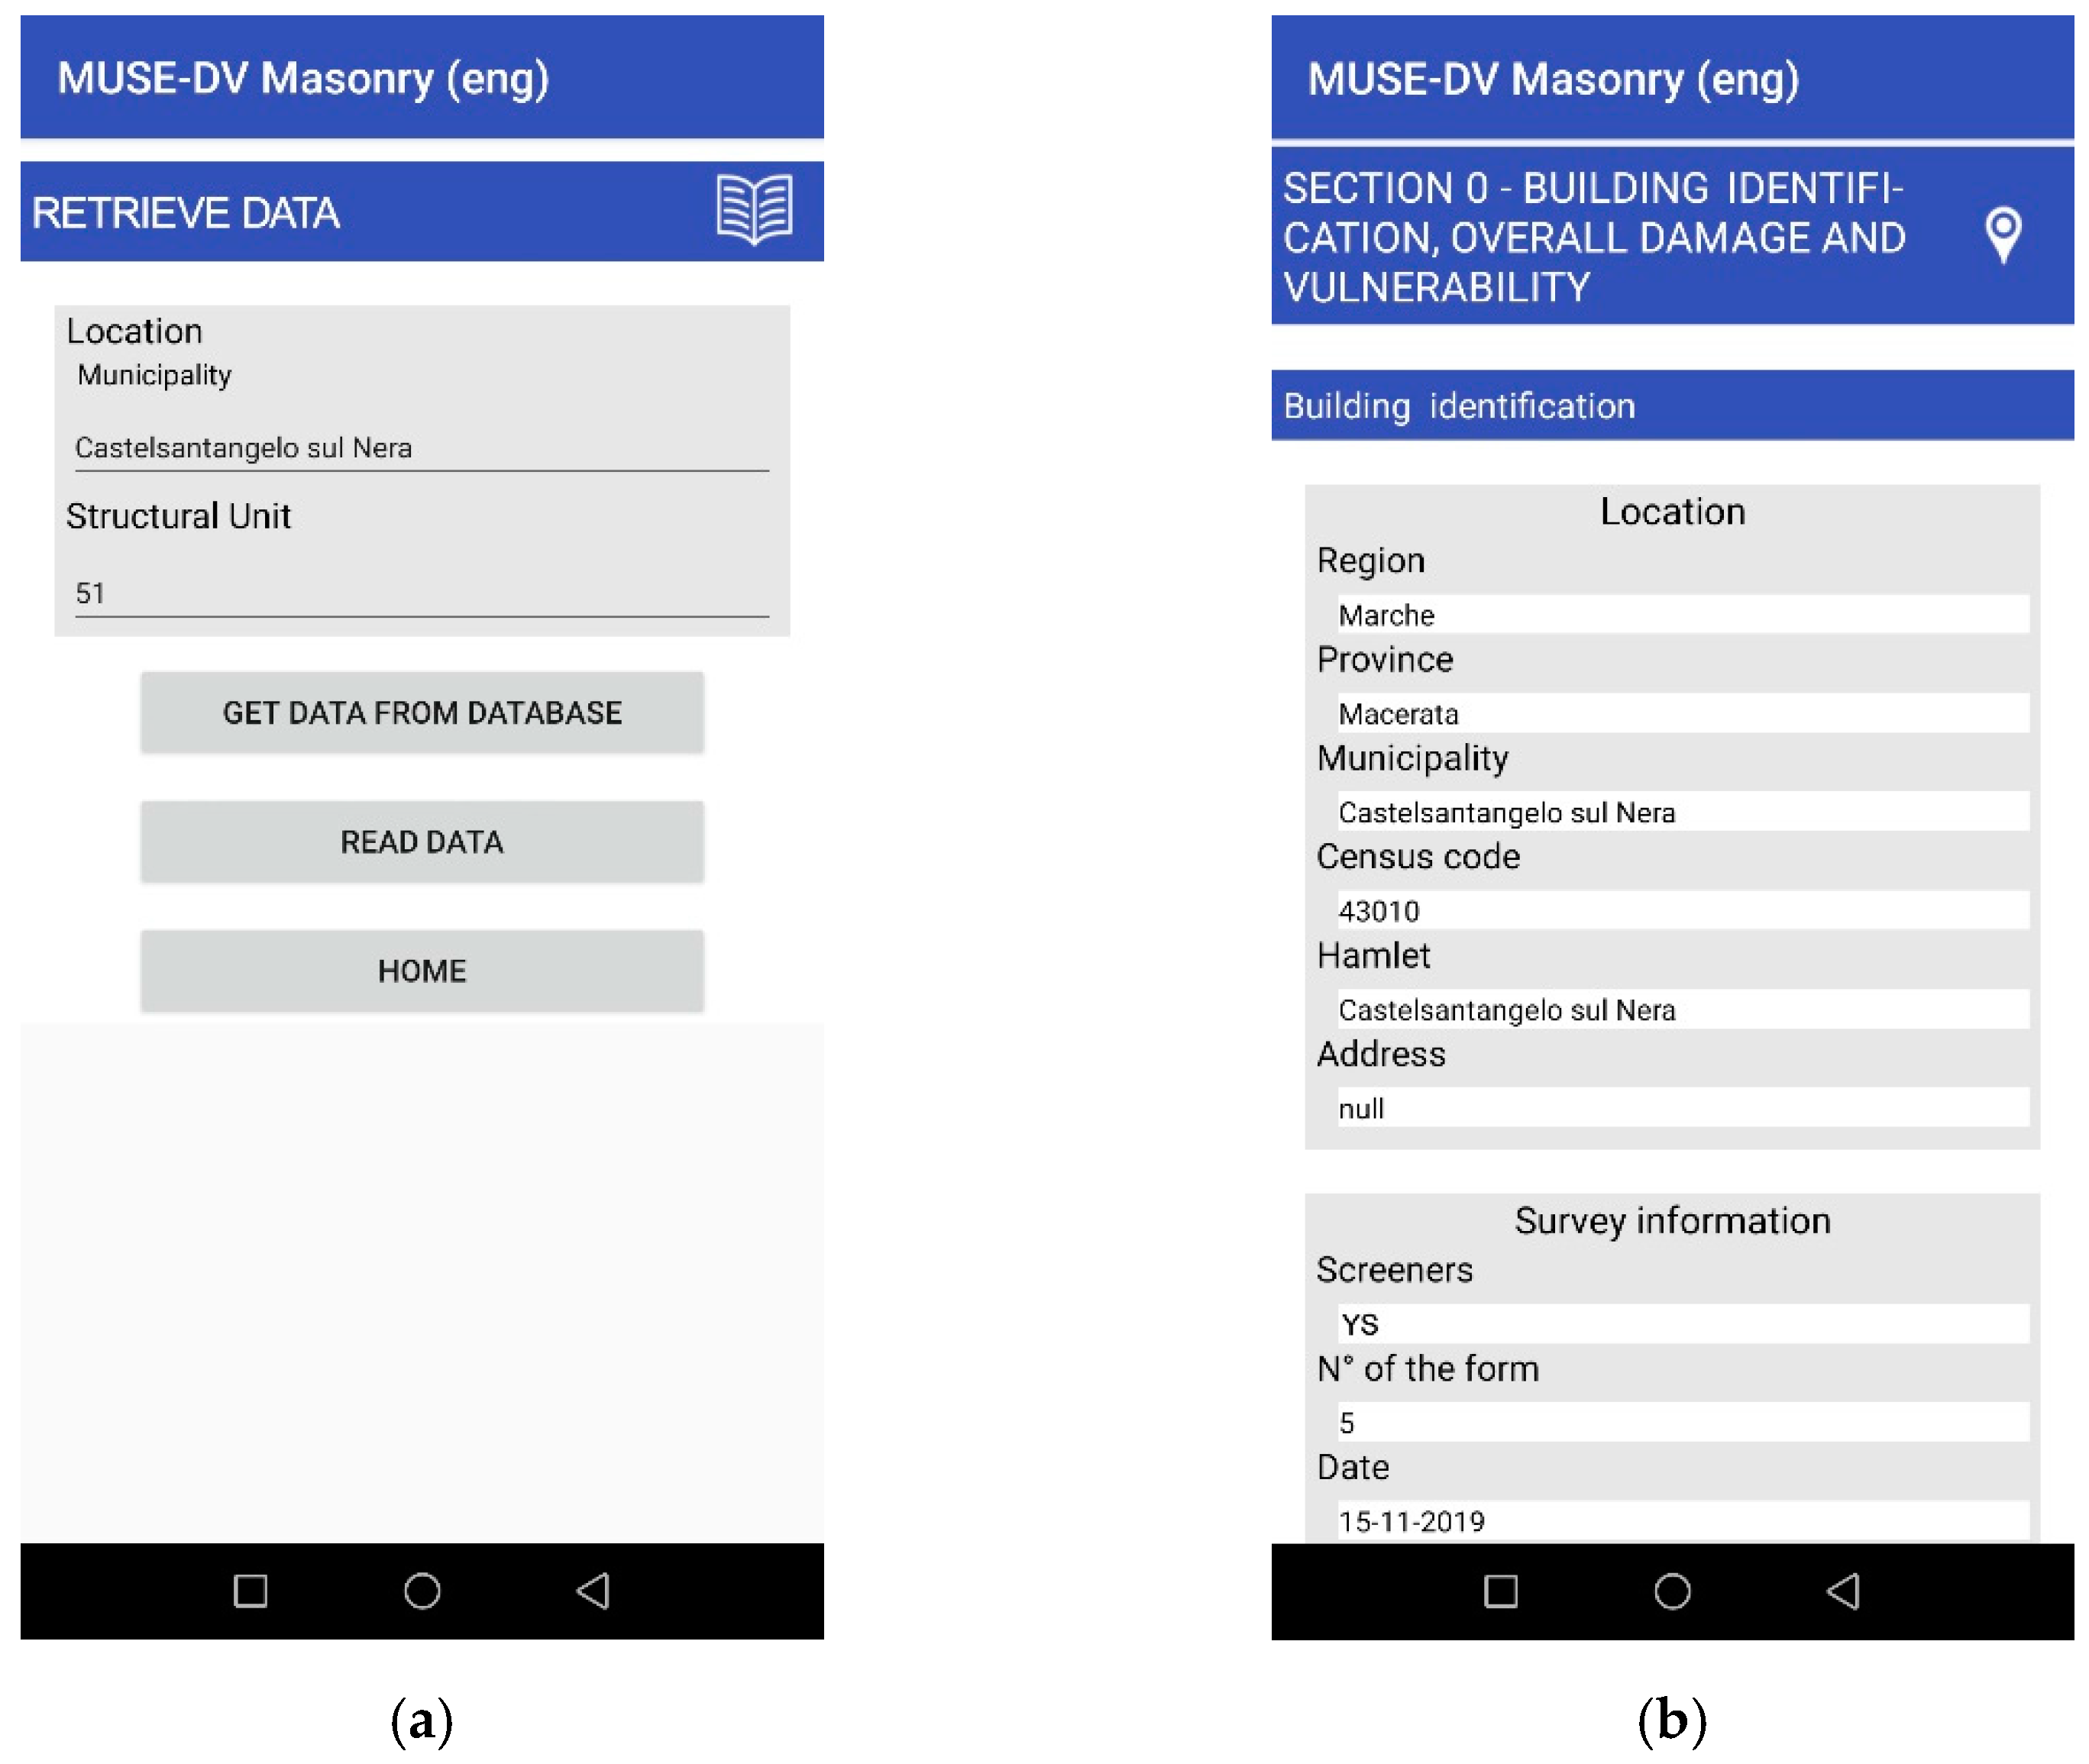
- Create the survey of a new building;
- Retrieve and display the data of a building already archived in the database;
- Synchronize to the database those compiled while offline;
- Export data to a text file.
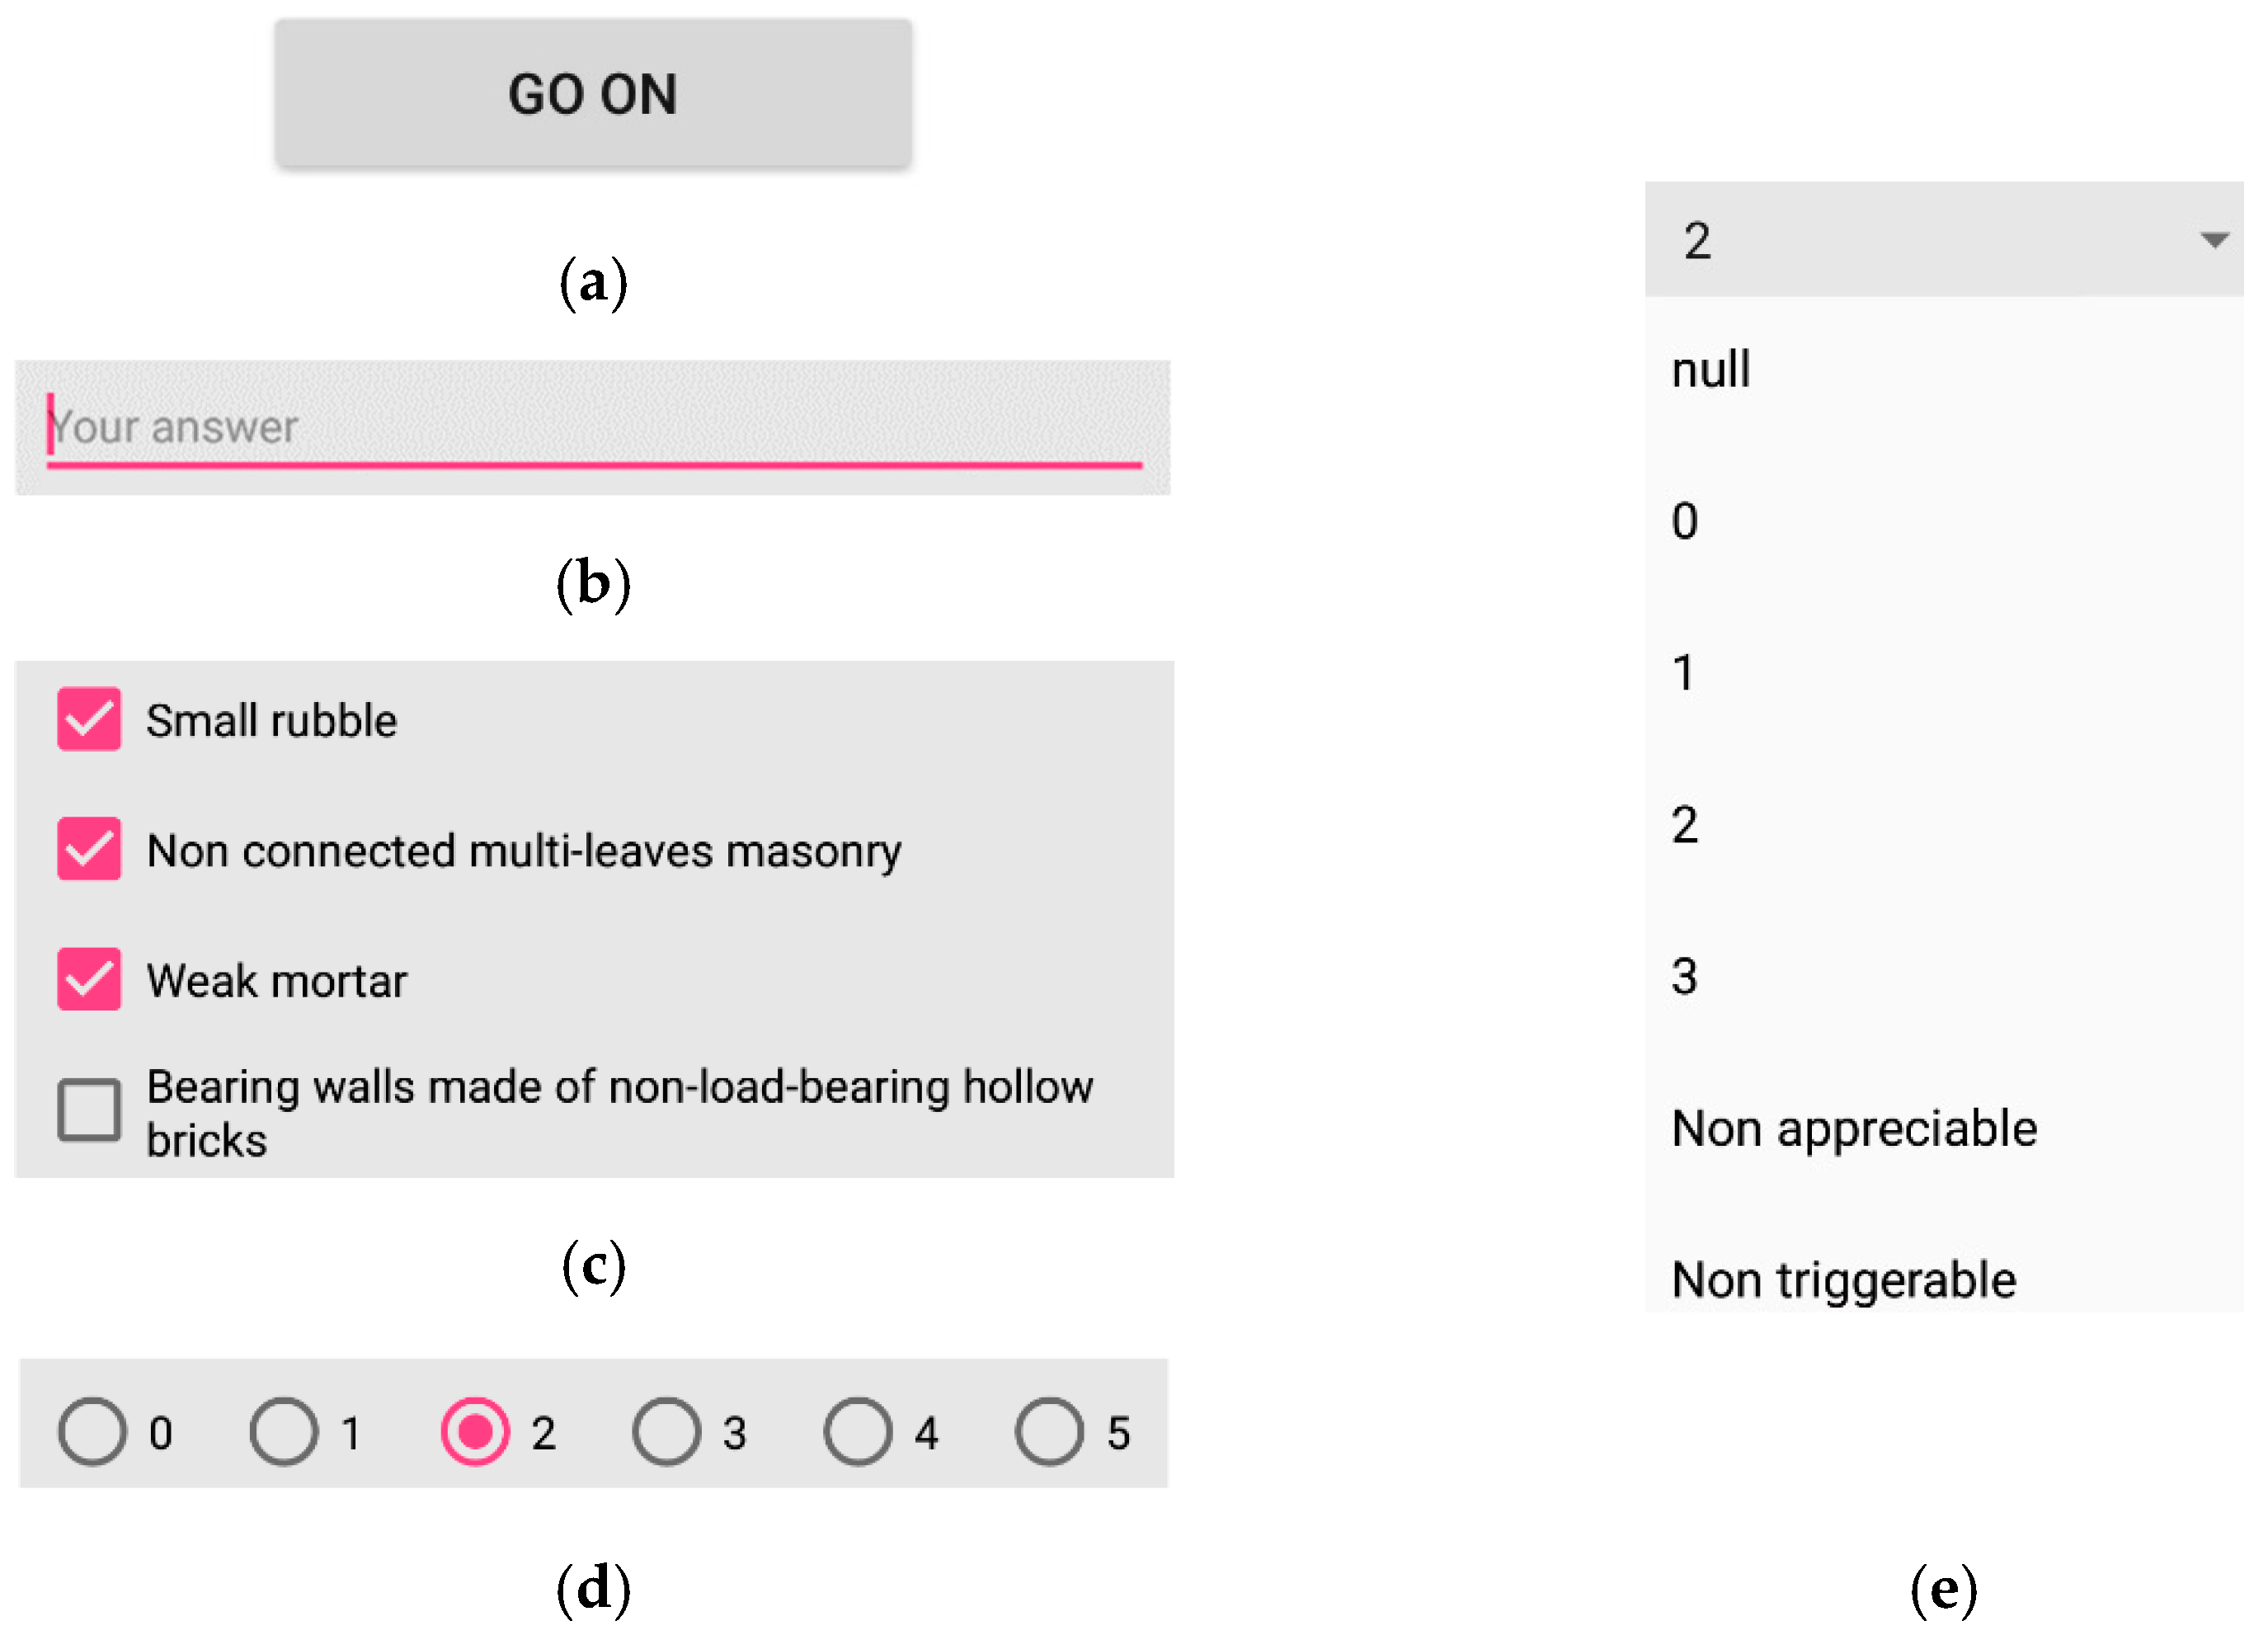
- Event triggering: buttons;
- Selection: radio buttons, checkboxes, spinners;
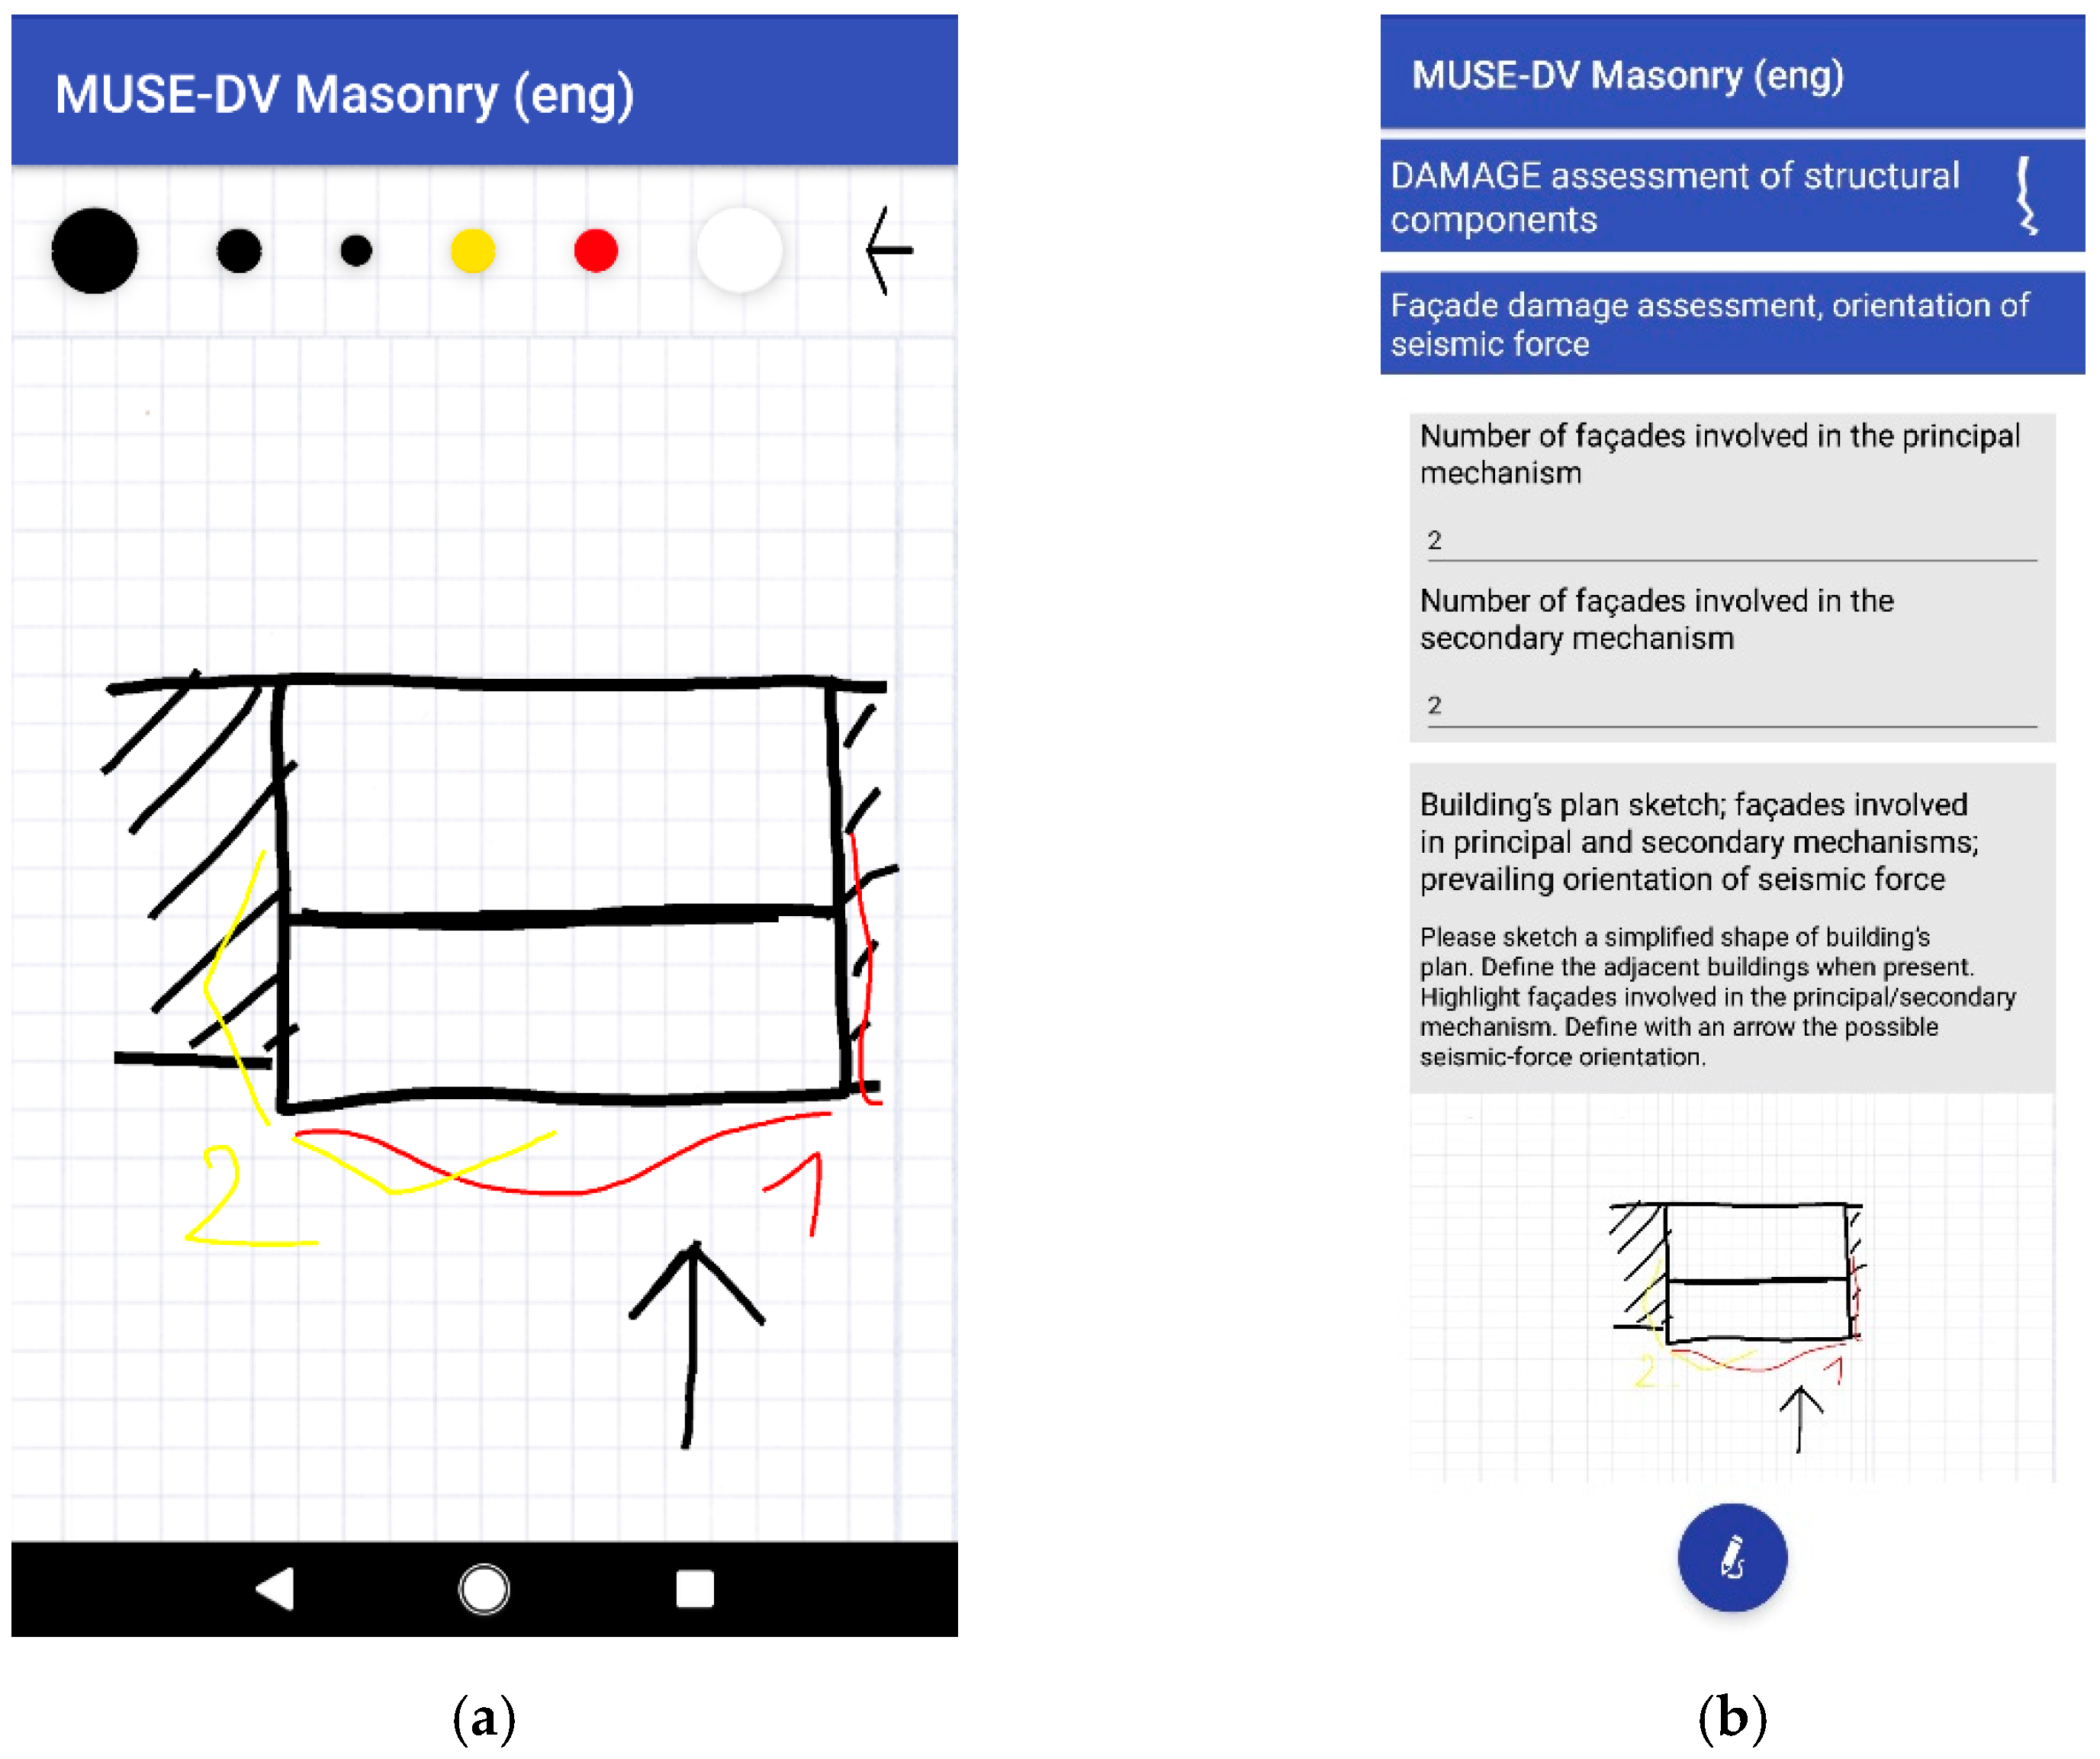
- Value input: text boxes, sketchpad;
- Output: labels and progress bar.
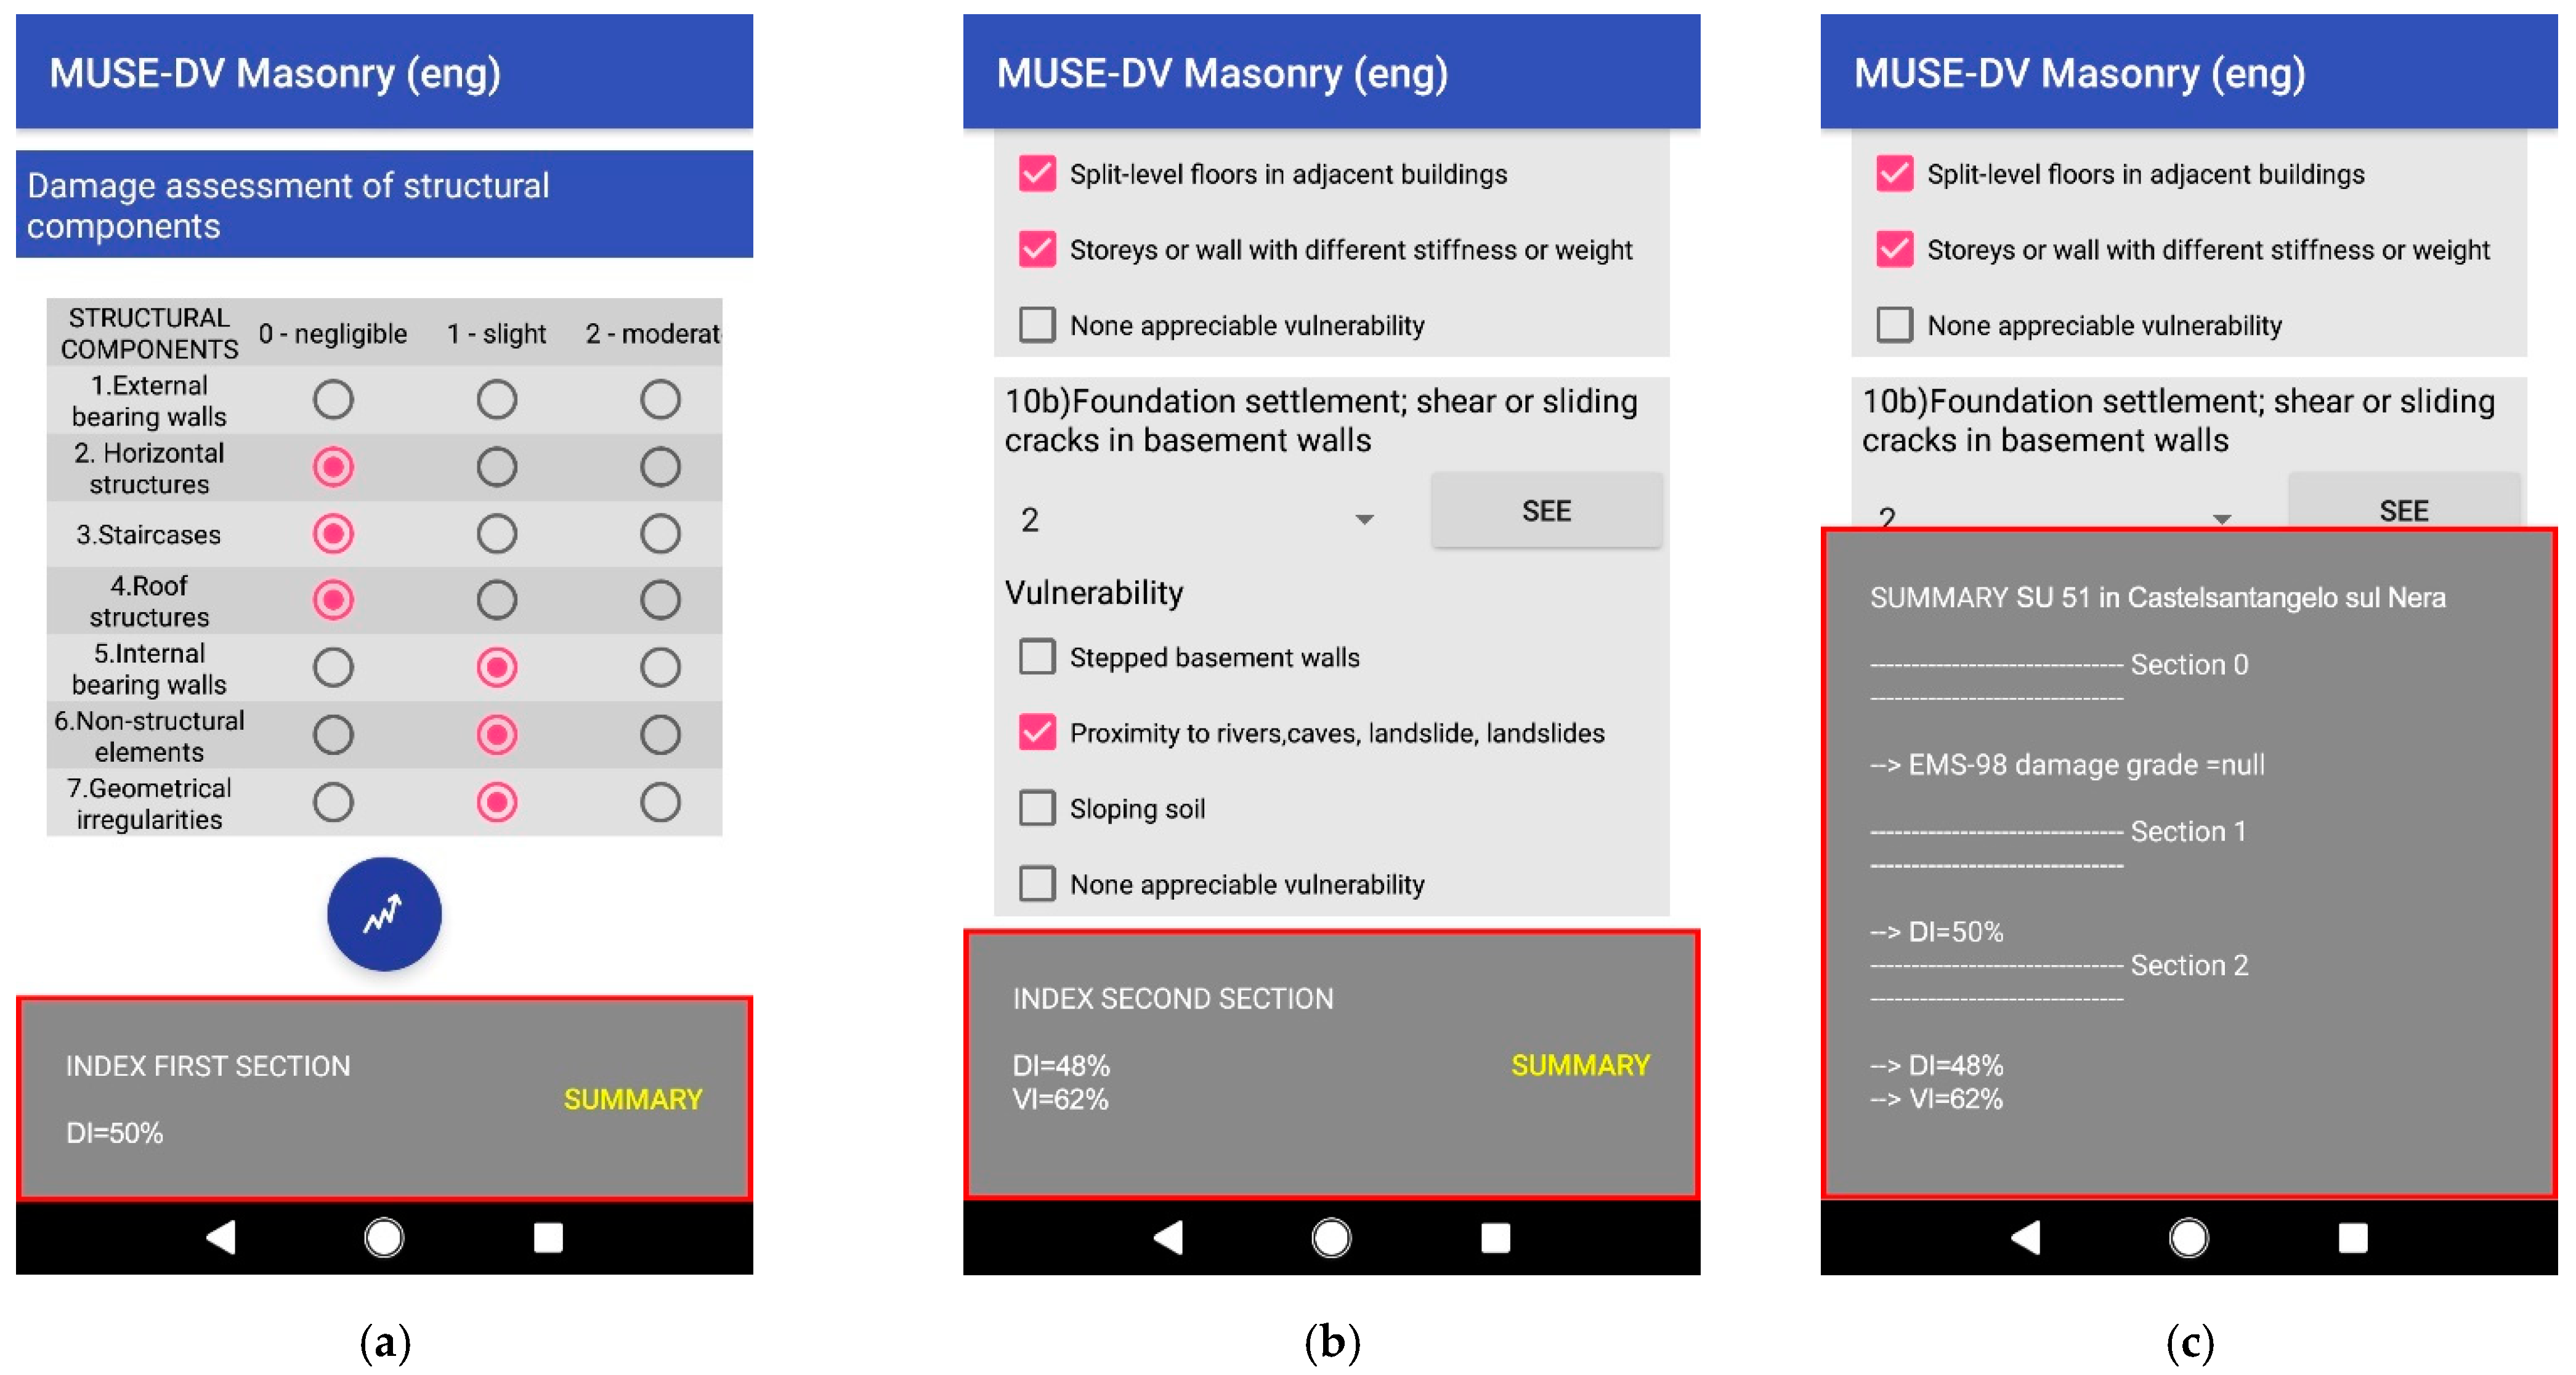
3.4. Damage and Vulnerability Indexes
3.5. Data Export and Interoperability
4. Trial Application
5. Conclusions
Author Contributions
Funding
Institutional Review Board Statement
Informed Consent Statement
Data Availability Statement
Acknowledgments
Conflicts of Interest
Abbreviations
| EMS-98 | European Macroseismic Scale (1998) |
| RVS | Rapid Visual Screening |
| AeDES | Post earthquake damage and usability assessment and emergency countermeasures in ordinary buildings (in Italian Agibilità e Danno nell’Emergenza Sismica) |
| GNDT | National group for the protection against earthquakes (in Italian Gruppo Nazionale per la Difesa dai Terremoti) |
| CLE | Limit condition for the emergency (in Italian Condizione Limite per l’Emergenza) |
| FEMA | Federal Emergency Management Agency |
| CARTIS | Structural and typological characterization of urban areas (in Italian Caratterizzaione Tipologico-Strutturale dei comparti urbani costituiti da edifici ordinari) |
| GIS | Geographic Information System |
| GEM | Global Earthquake Model |
| GPS | Global Positioning System |
| POP3 | Post Office Protocol |
| USGS | United States Geological Survey |
| ROVER | Rapid Observation of Vulnerability and Estimation of Risk |
| RViSITS | Rapid Visual Screening by Institut Teknologi Sepuluh Nopember, Surabaya |
| Urban RAT | Urban Rapid Assessment Tool |
| ML-EHSAPP | Machine Learning Based Earthquake Hazard Safety Assessment of buildings via smartphone App |
| QR code | Quick Response code |
| MUSE-DV | Multilevel assessment of Seismic Damage and Vulnerability of masonry buildings |
| SU | Structural Unit |
| DI | Damage Index |
| VI | Vulnerability Index |
| .xml | Extensible Markup Language |
| .csv | Comma Separated Values |
| CRUD | Create, Read, Update, and Delete |
| SQL | Structured Query Language |
| URL | Uniform Resource Locator |
| API-REST | Application Programming Interface—Representational State Transfer |
| http | Hypertext Transfer Protocol |
| PHP | Personal Home Page |
| JSON | JavaScript Object Notation |
References
- Ministry of Cultural Heritage and Tourism. Directive 23/04/2015, Procedure per La Gestione Delle Attività Di Messa in Sicurezza e Salvaguardia Del Patrimonio Culturale in Caso Di Emergenze Derivanti Da Calamità Naturali. 2015. Available online: https://www.gazzettaufficiale.it/eli/id/2015/07/23/15A05594/sg (accessed on 9 June 2022). (In Italian).
- President of the Council of Ministers. Directive 09/02/2011, Valutazione e Riduzione Del Rischio Sismico Del Patrimonio Culturale Con Riferimento Alle Norme Tecniche per Le Costruzioni Di Cui al D.M. 14/01/2008. 2011. Available online: https://www.gazzettaufficiale.it/eli/id/2011/02/26/11A02374/sg (accessed on 9 June 2022). (In Italian).
- Sieberg, A. Geologie Der Erdbeben. Handb. Geophys. 1930, 2, 552–555. [Google Scholar]
- Grünthal, G.; Tertulliani, A.; Azzaro, R.; Buffarini, G. Scala Macrosismica Europea 1998, EMS-98; European Seismolog-ical Commission, Subcommission on Engineering Seismology, Working Group Macroseismic Scales: Luxembourg, 2019; ISBN 978-99959-0-463-0. [Google Scholar]
- European Macroseismic Scale. 1998: EMS-98. Cahiers du Centre européen de géodynamique et de séismologie, 2nd ed.; Grünthal, G., Ed.; European Seismolog-ical Commission, Subcommission on Engineering Seismology, Working Group Macroseismic Scales: Luxembourg, 1998; ISBN 978-2-87977-008-6. [Google Scholar]
- Azzaro, R.; Barbano, M.S.; D’Amico, S.; Tuvè, T.; Scarfì, L.; Mostaccio, A. The L’Aquila 2009 Earthquake: An Application of the European Macroseismic Scale to the Damage Survey in the Epicentral Area. Bull. Geophys. Oceanogr. 2011, 52, 561–581. [Google Scholar] [CrossRef]
- Rossi, A.; Tertulliani, A.; Azzaro, R.; Graziani, L.; Rovida, A.; Maramai, A.; Pessina, V.; Hailemikael, S.; Buffarini, G.; Bernardini, F.; et al. The 2016–2017 Earthquake Sequence in Central Italy: Macroseismic Survey and Damage Scenario through the EMS-98 Intensity Assessment. Bull Earthq. Eng. 2019, 17, 2407–2431. [Google Scholar] [CrossRef]
- Cimellaro, G.P.; Scura, G.; Renschler, C.S.; Reinhorn, A.M.; Kim, H.U. Rapid Building Damage Assessment System Using Mobile Phone Technology. Earthq. Eng. Eng. Vib. 2014, 13, 519–533. [Google Scholar] [CrossRef]
- Staniscia, S.; Spacone, E.; Fabietti, V. Performance-Based Urban Planning: Framework and L’Aquila Historic City Center Case Study. Int. J. Archit. Herit. 2017, 11, 656–669. [Google Scholar] [CrossRef]
- Aguado, J.L.P.; Ferreira, T.M.; Lourenço, P.B. The Use of a Large-Scale Seismic Vulnerability Assessment Approach for Masonry Façade Walls as an Effective Tool for Evaluating, Managing and Mitigating Seismic Risk in Historical Centers. Int. J. Archit. Herit. 2018, 12, 1259–1275. [Google Scholar] [CrossRef]
- Cara, S.; Aprile, A.; Pelà, L.; Roca, P. Seismic Risk Assessment and Mitigation at Emergency Limit Condition of Historical Buildings along Strategic Urban Roadways. Application to the “Antiga Esquerra de L’Eixample” Neighborhood of Barcelona. Int. J. Archit. Herit. 2018, 12, 1055–1075. [Google Scholar] [CrossRef]
- Carocci, C.F.; Circo, C. Buildings Behavior in the Urban Fabric: The Knowledge Issue in the Post-Earthquake Reconstruction Plans. Key Eng. Mater. 2014, 628, 90–95. [Google Scholar] [CrossRef]
- Brunori, G.; Zampilli, M. RICOSTRUIRE ARQUATA. Studi, Ricerche e Rilievi per La Redazione Dei Piani e Dei Programmi Di Ricostruzione e Recupero Dei Centri Storici Del Comune Di Arquata Del Tronto; Roma TrE-Press: Roma, Italy, 2021; ISBN 979-12-5977-023-3. [Google Scholar]
- Bernardini, A.; Valluzzi, M.R.; Modena, C.; D’Ayala, D.; Speranza, E. Vulnerability Assessment of the Historical Masonry Building Typologies of Vittorio Veneto (NE Italy). Bollettino di Geofisica Teorica ed Applicata 2008, 49, 463–483. [Google Scholar]
- Lamego, P.; Lourenço, P.B.; Sousa, M.L.; Marques, R. Seismic Vulnerability and Risk Analysis of the Old Building Stock at Urban Scale: Application to a Neighbourhood in Lisbon. Bull Earthq. Eng. 2017, 15, 2901–2937. [Google Scholar] [CrossRef]
- Quagliarini, E.; Lucesoli, M.; Bernardini, G. Rapid Tools for Assessing Building Heritage’s Seismic Vulnerability: A Preliminary Reliability Analysis. J. Cult. Herit. 2019, 39, 130–139. [Google Scholar] [CrossRef]
- Basaglia, A.; Aprile, A.; Spacone, E.; Pelà, L. Assessing Community Resilience, Housing Recovery and Impact of Mitigation Strategies at the Urban Scale: A Case Study after the 2012 Northern Italy Earthquake. Bull Earthq. Eng. 2020, 18, 6039–6074. [Google Scholar] [CrossRef]
- Ferrigni, F. Vernacular Architecture: A Paradigm of the Local Seismic Culture. In Seismic retrofitting: Learning from vernacular architecture: Seismic-V: Vernacular Seismic Culture in Portugal research project funded under the National Research Agency FCT; Correia, M., Lourenco, P.B., Varum, H., Eds.; CRC Press: London, UK, 2015; ISBN 978-1-315-64739-5. [Google Scholar]
- Valluzzi, M.R. Challenges and Perspectives for the Protection of Masonry Structures in Historic Centers: The Role of Innovative Materials and Techniques. RILEM Tech. Lett. 2016, 1, 45–49. [Google Scholar] [CrossRef]
- Romis, F.; Caprili, S.; Salvatore, W.; Ferreira, T.M.; Lourenço, P.B. An Improved Seismic Vulnerability Assessment Approach for Historical Urban Centres: The Case Study of Campi Alto Di Norcia, Italy. Appl. Sci. 2021, 11, 849. [Google Scholar] [CrossRef]
- Dolce, M.; Speranza, E.; Giordano, F.; Borzi, B.; Conte, C.; di Meo, A.; Faravelli, M.; Pascale, V. Observed Damage Database of Past Italian Earthquakes:The Da. D.O. WebGIS. Bollettino di Geofisica Teorica ed Applicata 2019, 60, 141–164. [Google Scholar] [CrossRef]
- Jiménez, B.; Pelà, L.; Hurtado, M. Building Survey Forms for Heterogeneous Urban Areas in Seismically Hazardous Zones. Application to the Historical Center of Valparaíso, Chile. Int. J. Archit. Herit. 2018, 12, 1076–1111. [Google Scholar] [CrossRef]
- Vicente, R.; Parodi, S.; Lagomarsino, S.; Varum, H.; Silva, J.A.R.M. Seismic Vulnerability and Risk Assessment: Case Study of the Historic City Centre of Coimbra, Portugal. Bull Earthq. Eng. 2011, 9, 1067–1096. [Google Scholar] [CrossRef]
- Ferreira, T.M.; Mendes, N.; Silva, R. Multiscale Seismic Vulnerability Assessment and Retrofit of Existing Masonry Buildings. Buildings 2019, 9, 91. [Google Scholar] [CrossRef]
- Saretta, Y.; Sbrogiò, L.; Molinari, F.; Vettore, M.; Valluzzi, M.R. Proposta di un nuovo strumento multilivello per la valutazione del danno e della vulnerabilità a scala urbana: La procedura MUSE-DV masonry per la valutazione empirica del comportamento di edifici consolidati. Progett. Sismica 2020, 12, 5–30. [Google Scholar] [CrossRef]
- Bernardini, A. La Vulnerabilità Degli Edifici: Valutazione a Scala Nazionale Della Vulnerabilità Sismica Degli Edifici Ordinari; Bernardini, A., Ed.; CNR-GNDT: Roma, Italy, 2000; pp. 11–31. ISBN 88-900449-1-8. [Google Scholar]
- Baggio, C.; Bernardini, A.; Colozza, R.; Corazza, L.; dalla Bella, M.; Pasquale, G.D.; Dolce, M.; Goretti, A.; Martinelli, A.; Orsini, G.; et al. Field Manual for Post-Earthquake Damageand Safety Assessment and Short Term Countermeasures (AeDES); Pinto, A.V., Taucer, F., Eds.; Rota, M.; Goretti, A., Translators; JRC-DPC: Rome, Italy, 2007. [Google Scholar]
- Dolce, M.; Papa, F.; Pizza, A.G. Manuale per La Compilazione Della Scheda Di 1° Livello Di Rilevamento Danno, Pronto Intervento e Agibilità per Edifici Ordinari Nell’emergenza Post-Sismica (AeDES) II; Dipartimento della Protezione Civile: Roma, Italy, 2014. [Google Scholar]
- Gruppo Nazionale per la Difesa dai Terremoti & Consiglio Nazionale delle Ricerche Istruzioni per La Compilazione Della Scheda Di Rilevamento Esposizione e Vulnerabilità Sismica Degli Edifici; Litografia della Giunta Regionale; CNR: Punakha, Bhutan, 1986.
- Gruppo Nazionale per la Difesa dai Terremoti/Regione Emilia-Romagna/RegioneToscana Scheda Di Esposizione e Vulnerabilità Di Primo Livello e Di Rilevamento Danni; GNDT: Roma, Italy, 1994.
- Zucconi, M.; Ferlito, R.; Sorrentino, L. Simplified Survey Form of Unreinforced Masonry Buildings Calibrated on Data from the 2009 L’Aquila Earthquake. Bull Earthq. Eng. 2018, 16, 2877–2911. [Google Scholar] [CrossRef]
- President of the Council of Ministers. Ministerial Decree 23/01/2001, No. 133, Approvazione Dei Modelli per Il Rilevamento Dei Danni Ai Beni Appartenenti al Patrimonio Culturale . 2001. Available online: https://www.gazzettaufficiale.it/eli/id/2001/05/21/001A5371/sg (accessed on 9 June 2022). (In Italian).
- Papa, S.; Di Pasquale, G. Manuale per La Compilazione Della Scheda per Il Rilievo Del Danno Ai Beni Culturali, Chiese, Modello A-DC; Presidenza del Consiglio dei Ministri-Dipartimento della Protezione Civile; Presidenza del Consiglio dei Ministri-Dipartimento della Protezione Civile (PCM-DPC): Rome, Italy, 2011. [Google Scholar]
- President of the Council of Ministers. Ministerial Decree 23/02/2006, No. 55, Approvazione Dei Modelli per Il Rilevamento Dei Danni, a Seguito Di Eventi Calamitosi, Ai Beni Appartenenti al Patrimonio Culturale. 2006. Available online: https://www.gazzettaufficiale.it/eli/id/2006/03/07/06A02214/sg (accessed on 9 June 2022). (In Italian).
- Bramerini, F.; Castenetto, S. Manuale per l’analisi Della Condizione Limite per l’emergenza (CLE) Dell’insediamento Urbano; CNR-IGAG: Roma, Italy, 2014. [Google Scholar]
- President of the Council of Ministers. Ordinance 29/02/2012, No. 4007, Contributi per Gli Interventi Di Prevenzione Del Rischio Sismico per l’anno 2011; 2012. Available online: https://rischi.protezionecivile.gov.it/it/sismico/attivita/piano-nazionale-la-prevenzione-del-rischio-sismico/annualita-2011 (accessed on 9 June 2022). (In Italian)
- Federal Emergency Management Agency (FEMA). Rapid Visual Screening of Buildings for Potential Seismic Hazards: A Handbook. Disaster Prev. Manag. 2003, 12. [Google Scholar] [CrossRef]
- Federal Emergency Management Agency (FEMA). Rapid Visual Screening of Buildings for Potential Seismic Hazards: A Handbook (FEMA P-154); FEMA: Washington DC, USA, 2015. [Google Scholar]
- Applied Technology Council ATC 20-1. Field Manual: Post Earthquake Safety Evaluation of Building, 2nd ed.; Applied Technology Council: Redwood City, CA, USA, 2005; p. 159. [Google Scholar]
- Benedetti, D.; Petrini, V. Sulla Vulnerabilità Sismica Di Edifici in Muratura: Un Metodo Di Valutazione. L’industria Delle Costr. 1984, 149, 66–74. [Google Scholar]
- Ferrini, M.; Melozzi, A.; Pagliazzi, A.; Scarparolo, S. Valutazione Della Vulnerabilità Sismica per Edifici in Muratura: Modifiche Ed Integrazioni Introdotte Dalla Regione Toscana al Manuale per La Compilazione Della Scheda Di II Livello. In Proceedings of the XI Convegno Nazionale ANIDIS “L’ingegneria sismica in Italia”, Genova, Italy, 25–29 January; 2004. [Google Scholar]
- Formisano, A.; Florio, G.; Landolfo, R.; Mazzolani, F.M. Numerical Calibration of an Easy Method for Seismic Behaviour Assessment on Large Scale of Masonry Building Aggregates. Adv. Eng. Softw. 2015, 80, 116–138. [Google Scholar] [CrossRef]
- Ferreira, T.M.; Maio, R.; Vicente, R. Analysis of the Impact of Large Scale Seismic Retrofitting Strategies through the Application of a Vulnerability-Based Approach on Traditional Masonry Buildings. Earthq. Eng. Eng. Vib. 2017, 16, 329–348. [Google Scholar] [CrossRef]
- Cifani, G.; Lemme, A.; Podestà, S. Beni Monumentali e Terremoto. Dall’emergenza Alla Ricostruzione; DEI Tipografia del Genio Civile: Italy, Rome, 2005. [Google Scholar]
- Civerra, C.; Lemme, A.; Cifani, G. Strumenti per Il Rilievo Del Danno e Della Vulnerabilità Sismica Dei Beni Culturali; Campobasso, Regione Molise, MiBACT-CNR: Campobasso, Italy, 2007. [Google Scholar]
- Zuccaro, G.; De Gregorio, D.; Dolce, M.; Speranza, E.; Moroni, C. La Scheda CARTIS per La Caratterizzazione Tipologico-Strutturale Dei Comparti Urbani Costituiti Da Edifici Ordinari. Valutazione Dell’esposizione in Analisi Di Rischio Sismico. In Proceedings of the XXXIV Convegno Nazionale “Gruppo Nazionale di Geofisica della Terra Solida”, Trieste, Italy, 17–19 November 2015. [Google Scholar]
- Valluzzi, M.R.; Calò, S.; Giacometti, G. Correlation of Vulnerability and Damage between Artistic Assets and Structural Elements: The DataBAES Archive for the Conservation Planning of CH Masonry Buildings in Seismic Areas. Sustainability 2020, 12, 653. [Google Scholar] [CrossRef]
- Van Westen, C.J. 3.10 Remote Sensing and GIS for Natural Hazards Assessment and Disaster Risk Management. In Treatise on Geomorphology-Volume 3, Remote sensing and GIScience in Geomorphology; Bishop, M.P., Ed.; Elsevier: Amsterdam, The Netherlands, 2013; Volume 3, pp. 259–298. ISBN 978-0-08-088522-3. [Google Scholar]
- Vettore, M.; Saretta, Y.; Sbrogiò, L.; Valluzzi, M.R. A New Methodology for the Survey and Evaluation of Seismic Damage and Vulnerability Entailed by Structural Interventions on Masonry Buildings: Validation on the Town of Castelsantangelo Sul Nera (MC), Italy. Int. J. Archit. Herit. 2022, 16, 182–207. [Google Scholar] [CrossRef]
- Global Earthquake Model. Available online: https://www.Globalquakemodel.org/ (accessed on 23 April 2022).
- Federal Emergency Management Agency (FEMA). Hazus-MH 2.1. Technical Manual; FEMA: Washington DC, USA, 2001. [Google Scholar]
- CAPRA Probabilistic Risk Assessment Platform. Available online: https://Ecapra.org/ (accessed on 23 April 2022).
- Giovinazzi, S.; Marchili, C.; Di Pietro, A.; Giordano, L.; Costanzo, A.; La Porta, L.; Pollino, M.; Rosato, V.; Lückerath, D.; Milde, K.; et al. Assessing Earthquake Impacts and Monitoring Resilience of Historic Areas: Methods for GIS Tools. ISPRS Int. J. Geo-Inf. 2021, 10, 461. [Google Scholar] [CrossRef]
- Columbro, C.; Eudave, R.R.; Ferreira, T.M.; Lourenço, P.B.; Fabbrocino, G. On the Use of Web Mapping Platforms to Support the Seismic Vulnerability Assessment of Old Urban Areas. Remote Sens. 2022, 14, 1424. [Google Scholar] [CrossRef]
- SoftCLE. Software per l’archiviazione Dei Dati-Versione 3.0.2. Standard Di Rappresentazione e l’archiviazione Informatica; Analisi Della Condizione Limite per l’Emergenza (CLE); Commissione tecnica per la microzonazione: Roma, Italy, 2015. [Google Scholar]
- Novelli, V.I.; D’Ayala, D. LOG-IDEAH: LOGic Trees for Identification of Damage Due to Earthquakes for Architectural Heritage. Bull Earthq. Eng. 2015, 13, 153–176. [Google Scholar] [CrossRef]
- Sánchez-Silva, M.; García, L. Earthquake Damage Assessment Based on Fuzzy Logic and Neural Networks. Earthq. Spectra 2001, 17, 89–112. [Google Scholar] [CrossRef]
- Allali, S.A.; Abed, M.; Mebarki, A. Post-Earthquake Assessment of Buildings Damage Using Fuzzy Logic. Eng. Struct. 2018, 166, 117–127. [Google Scholar] [CrossRef]
- Croce, V.; Caroti, G.; Piemonte, A. Assessment of Earthquake-Induced Damage Level on Buildings: Analysis of Two Different Survey Methods for a Case Study. Int. Arch. Photogramm. Remote Sens. Spatial Inf. Sci. 2019, XLII-2/W15, 351–358. [Google Scholar] [CrossRef]
- Kaku, K. Satellite Remote Sensing for Disaster Management Support: A Holistic and Staged Approach Based on Case Studies in Sentinel Asia. Int. J. Disaster Risk Reduct. 2019, 33, 417–432. [Google Scholar] [CrossRef]
- Ghorbanzadeh, O.; Blaschke, T.; Gholamnia, K.; Meena, S.; Tiede, D.; Aryal, J. Evaluation of Different Machine Learning Methods and Deep-Learning Convolutional Neural Networks for Landslide Detection. Remote Sens. 2019, 11, 196. [Google Scholar] [CrossRef]
- Soleimani, F.; Hajializadeh, D. Bridge Seismic Hazard Resilience Assessment with Ensemble Machine Learning. Structures 2022, 38, 719–732. [Google Scholar] [CrossRef]
- Harirchian, E.; Lahmer, T. Improved Rapid Visual Earthquake Hazard Safety Evaluation of Existing Buildings Using a Type-2 Fuzzy Logic Model. Appl. Sci. 2020, 10, 2375. [Google Scholar] [CrossRef]
- Ferreira, T.M.; Estêvão, J.; Maio, R.; Vicente, R. The Use of Artificial Neural Networks to Estimate Seismic Damage and Derive Vulnerability Functions for Traditional Masonry. Front. Struct. Civ. Eng. 2020, 14, 609–622. [Google Scholar] [CrossRef]
- Campostrini, G.P.; Taffarel, S.; Bettiol, G.; Valluzzi, M.R.; Da Porto, F.; Modena, C. A Bayesian Approach to Rapid Seismic Vulnerability Assessment at Urban Scale. Int. J. Archit. Herit. 2018, 12, 36–46. [Google Scholar] [CrossRef]
- Aydin, C.; Tarhan, C.; Ozgur, A.S.; Tecim, V. Improving Disaster Resilience Using Mobile Based Disaster Management System. Procedia Technol. 2016, 22, 382–390. [Google Scholar] [CrossRef][Green Version]
- Shan, W.; Feng, J.; Chang, J.; Yang, F.; Li, Z. Collecting Earthquake Disaster Area Information Using Smart Phone. In Proceedings of the 2012 International Conference on System Science and Engineering (ICSSE), Dalian, China, 30 June–2 July 2012; pp. 310–314. [Google Scholar]
- Xu, Z.; Lu, X.; Cheng, Q.; Guan, H.; Deng, L.; Zhang, Z. A Smart Phone-Based System for Post-Earthquake Investigations of Building Damage. Int. J. Disaster Risk Reduct. 2018, 27, 214–222. [Google Scholar] [CrossRef]
- Astarita, V.; Festa, D.C.; Giofrè, V.P.; Guido, G.; Stefano, G. Mobile for Emergencies M4EM: A Cooperative Software Tool for Emergency Management Operations. Procedia Comput. Sci. 2018, 134, 433–438. [Google Scholar] [CrossRef]
- Foresti, G.L.; Farinosi, M.; Vernier, M. Situational Awareness in Smart Environments: Socio-Mobile and Sensor Data Fusion for Emergency Response to Disasters. J. Ambient. Intell. Humaniz. Comput. 2015, 6, 239–257. [Google Scholar] [CrossRef]
- Lwin, K.K.; Murayama, Y. Web-Based GIS System for Real-Time Field Data Collection Using Personal Mobile Phone. J. Geogr. Inf. Syst. 2011, 3, 382–389. [Google Scholar] [CrossRef]
- Merenda, M.; Fedele, R.; Pratico, F.G.; Carotenuto, R.; Della Corte, F.G.; Iero, D. Augmented Information Discovery Using NFC Technology within a Platform for Disaster Monitoring. In Proceedings of the 2020 5th International Conference on Smart and Sustainable Technologies (SpliTech), Split, Croatia, 23 September 2020; pp. 1–6. [Google Scholar]
- Fallou, L.; Bossu, R.; Petersen, L.; Roussel, F. Efficiently Allocating Safety Tips after an Earthquake–Lessons Learned from the Smartphone Application Last Quake. In Proceedings of the 16th ISCRAM Conference–València (Spain), Valencia, Spain, 19–22 May 2019; pp. 263–275, ISBN 978-84-09-10498-7. [Google Scholar]
- Wald, D.J.; Quitoriano, V.; Worden, B.; Hopper, M.; Dewey, J.W. USGS “Did You Feel It?” Internet-Based Macroseismic Intensity Maps. Ann. Geophys. 2012, 54, 5354. [Google Scholar] [CrossRef]
- Kong, Q.; Allen, R.M.; Schreier, L.; Kwon, Y.-W. MyShake: A Smartphone Seismic Network for Earthquake Early Warning and Beyond. Sci. Adv. 2016, 2, e1501055. [Google Scholar] [CrossRef] [PubMed]
- Colombelli, S.; Carotenuto, F.; Elia, L.; Zollo, A. Design and Implementation of a Mobile Device App for Network-Based Earthquake Early Warning Systems (EEWSs): Application to the PRESTo EEWS in Southern Italy. Nat. Hazards Earth Syst. Sci. 2020, 20, 921–931. [Google Scholar] [CrossRef]
- Porter, K.; Hellman, S.; Hortacsu, A. FEMA ROVER Version 2 and ROVER ATC-20, Mobile Earthquake Safety Software. In Proceedings of the Improving the Seismic Performance of Existing Buildings and Other Structures, San Francisco, CA, USA, 10–12 December 2015; American Society of Civil Engineers: San Francisco, CA, USA, 2015; pp. 787–796. [Google Scholar]
- Wahyuni, E.; Iranata, D.; Suswanto, B.; Nurcahyo, C.B. Assessment of Vulnerable Buildings Due to Earthquake Loading Using Rapid Visual Screening Smartphone Application. Int. J. Adv. Sci. Eng. Inf. Technol. 2018, 8, 567–572. [Google Scholar] [CrossRef]
- Riyanto, W.; Irawan, D.; Joko Wahyu Adi, T.; Iranata, D.; Rizki Amalia, A. Earthquake Vulnerability Assessment of High-Rise Buildings in Surabaya Using RViSITS Android Application. IOP Conf. Ser. Mater. Sci. Eng. 2020, 739, 012040. [Google Scholar] [CrossRef]
- Ploeger, S.K.; Sawada, M.; Elsabbagh, A.; Saatcioglu, M.; Nastev, M.; Rosetti, E. Urban RAT: New Tool for Virtual and Site-Specific Mobile Rapid Data Collection for Seismic Risk Assessment. J. Comput. Civ. Eng. 2016, 30, 04015006. [Google Scholar] [CrossRef]
- Harirchian, E.; Jadhav, K.; Kumari, V.; Lahmer, T. ML-EHSAPP: A Prototype for Machine Learning-Based Earthquake Hazard Safety Assessment of Structures by Using a Smartphone App. Eur. J. Environ. Civ. Eng. 2021, 25, 1–21. [Google Scholar] [CrossRef]
- Işık, M.F.; Işık, E.; Bülbül, M.A. Application of IOS/Android Based Assessment and Monitoring System for Building Inventory under Seismic Impact. J. Croat. Assoc. Civ. Eng. 2018, 70, 1043–1056. [Google Scholar] [CrossRef]
- Rosser, J.; Morley, J.; Vicini, A. User Guide: Android Mobile Tool for Field Data Collection; GEM Technical Report; GEM Foundation: Pavia, Italy, 2014. [Google Scholar]
- Valluzzi, M.R.; Sbrogiò, L.; Saretta, Y.; Wenliuhan, H. Seismic Response of Masonry Buildings in Historical Centres Struck by the 2016 Central Italy Earthquake. Impact of Building Features on Damage Evaluation. Int. J. Archit. Herit. 2021, 15, 1–26. [Google Scholar] [CrossRef]
- Sbrogiò, L.; Saretta, Y.; Valluzzi, M.R. Empirical Performance Levels of Strengthened Masonry Buildings Struck by the 2016 Central Italy Earthquake: Proposal of a New Taxonomy. Int. J. Archit. Herit. 2022, 15, 1–26. [Google Scholar] [CrossRef]
- Saretta, Y.; Sbrogiò, L.; Valluzzi, M.R. Seismic Response of Masonry Buildings in Historical Centres Struck by the 2016 Central Italy Earthquake. Calibration of a Vulnerability Model for Strengthened Conditions. Constr. Build. Mater. 2021, 299, 123911. [Google Scholar] [CrossRef]
- Saretta, Y.; Sbrogiò, L.; Valluzzi, M.R. Assigning the Macroseismic Vulnerability Classes to Strengthened Ordinary Masonry Buildings: An Update from Extensive Data of the 2016 Central Italy Earthquake. Int. J. Disaster Risk Reduct. 2021, 62, 102318. [Google Scholar] [CrossRef]
- Binda, L.; Cardani, G.; Saisi, A.; Valluzzi, M.R.; Munari, M.; Modena, C. Multilevel Approach to the Vulnerability Analysis of Historic Buildings in Seismic Areas-Part 1: Detection of Parameters for the Vulnerability Analysis through on Site and Laboratory Investigations. Int. J. Restor. Build. Monum. Internationale Zeitschrift für Bauinstandsetzen und Baudenkmalpflege 2007, 3, 413–426. [Google Scholar]
- Ministry of Infrastructures and Transportations. Ministerial Decree 17/01/2018, Aggiornamento Delle «Norme Tecniche per Le Costruzioni». 2018. Available online: https://www.gazzettaufficiale.it/eli/id/2018/2/20/18A00716/sg (accessed on 9 June 2022). (In Italian).
- Di Pasquale, G.; Goretti, A. Vulnerabilità Funzionale Ed Economica Degli Edifici Residenziali Colpiti Dai Recenti Eventi Sismici Italiani. In Proceedings of the X Congresso Nazionale “L’ingegneria Sismica in Italia”, Potenza-Matera, Italy, 9–13 September 2001. [Google Scholar]
- Valluzzi, M.R.; Munari, M.; Modena, C.; Binda, L.; Cardani, G.; Saisi, A. Multilevel Approach to the Vulnerability Analysis of Historic Buildings in Seismic Areas-Part 2: Analytical Interpretation of Mechanisms for the Vulnerability Analysis and the Structural Improvement. Int. J. Restor. Build. Monum. Internationale Zeitschrift für Bauinstandsetzen und Baudenkmalpflege 2007, 3, 427–441. [Google Scholar]
- D’Ayala, D.; Speranza, E. Definition of Collapse Mechanisms and Seismic Vulnerability of Historic Masonry Buildings. Earthq. Spectra 2003, 19, 479–509. [Google Scholar] [CrossRef]
- Noun Project. Available online: https://thenounproject.com/ (accessed on 23 April 2022).
- Williams, H.E.; Lane, D.H. Applicazioni web database con PHP e MySQL; Hops Tecniche Nuove: Milano, Italy, 2005; ISBN 978-88-481-1722-7. [Google Scholar]
- Sheppard, D. Beginning Progressive Web App Development: Creating a Native App Experience on the Web, 1st ed.; Apress: Berkeley, CA, USA, 2017; ISBN 978-1-4842-3090-9. [Google Scholar]
- Tiwana, A. Platform Architecture. In Platform Ecosystems; Elsevier: Amsterdam, The Netherlands, 2014; pp. 73–116. ISBN 978-0-12-408066-9. [Google Scholar]
- Aiello, P. Manuale Pratico Di Java: La Teoria Integrata Dalla Pratica: Dalle Basi Del Linguaggio Alla Programmazione Distribuita: Un percorso Collaudato Per Apprendere La Tecnologia Java; Hops: Milan, Italy, 2001; ISBN 978-88-8378-039-4. [Google Scholar]
- Kromann, F.M. Beginning PHP and MySQL; Springer: New York, NY, USA, 2018; ISBN 978-1-4302-6043-1. [Google Scholar]
- MySQL. Available online: https://www.Mysql.com (accessed on 23 April 2022).
- PhpMyAdmin. Available online: https://www.Phpmyadmin.net/ (accessed on 23 April 2022).
- Developers-Android Studio. Available online: https://Developer.Android.com/Studio (accessed on 23 April 2022).
- JAVA. Available online: https://www.Java.com/It/ (accessed on 23 April 2022).
- QGIS. Available online: https://www.Qgis.Org/En/Site/ (accessed on 23 April 2022).


| Graphic Element | Type of Answer | |
|---|---|---|
| Analogic Form | Digital Tool | |
| _________________ | _________________ | short answer |
| |__|__|__|__|__|__| | _________________ | short answer |
| ○ | ○ | single choice |
| ▼ | single choice on drop-down list | |
| □ | □ | multiple choice |
| Procedure | Level | Damage | Vulnerability | Structural Features | Usability |
|---|---|---|---|---|---|
| AeDES | 1 | multiple choice, severity, extent (EMS-98) | - | multiple choice | Yes |
| A-DC | 1 | 0÷5 grade damage index | - | - | Yes |
| B-DP | 1 | multiple choice, severity, extent (EMS-98) | - | short answers, extent within the building | Yes |
| CLE | 1 | multiple choice (description) | - | multiple choice | No |
| CARTIS urban area | 1 | - | factors: tick | walls: single choice diaphragms: multiple choice | No |
| FEMA | 1 | - | factors: tick | - | No |
| ATC-20 | 1 | multiple choice (description), severity, extent | - | - | Yes |
| Churches | 2 | 0÷5 grade damage index | factors: tick and 0÷3 grade vulnerability index | multiple choice | Yes |
| GNDT | 2 | - | parameters: A÷D class vulnerability index | (*) | No |
| CARTIS building | 2 | - | factors: tick | walls: single choice diaphragms: multiple choice | No |
| MUSE-DV Masonry: MUltilevel Assessment of SEismic Damage and Vulnerability of Masonry Buildings | |||
|---|---|---|---|
| Subpart | Issue | Type of Answer | Output |
| Part 0—Building identification, overall vulnerability, and damage | |||
| Building identification | Location | _______________ | |
| Survey information | _______________ | ||
| Building ID | _______________ | ||
| Seismic identification | _______________ | ||
| Typological analysis | Building type | ○ | |
| Block shape/position of building inside a block | ○ | ||
| Maintenance state and pre-existing damage | ○ | ||
| Site morphology | ○ | ||
| Geometric data | _______________ | ||
| Damage identification | Prevailing damage mode | ○ | |
| Main mechanism | ○ | ||
| Secondary mechanism | ○ | ||
| EMS-98 damage grade | ○ | ||
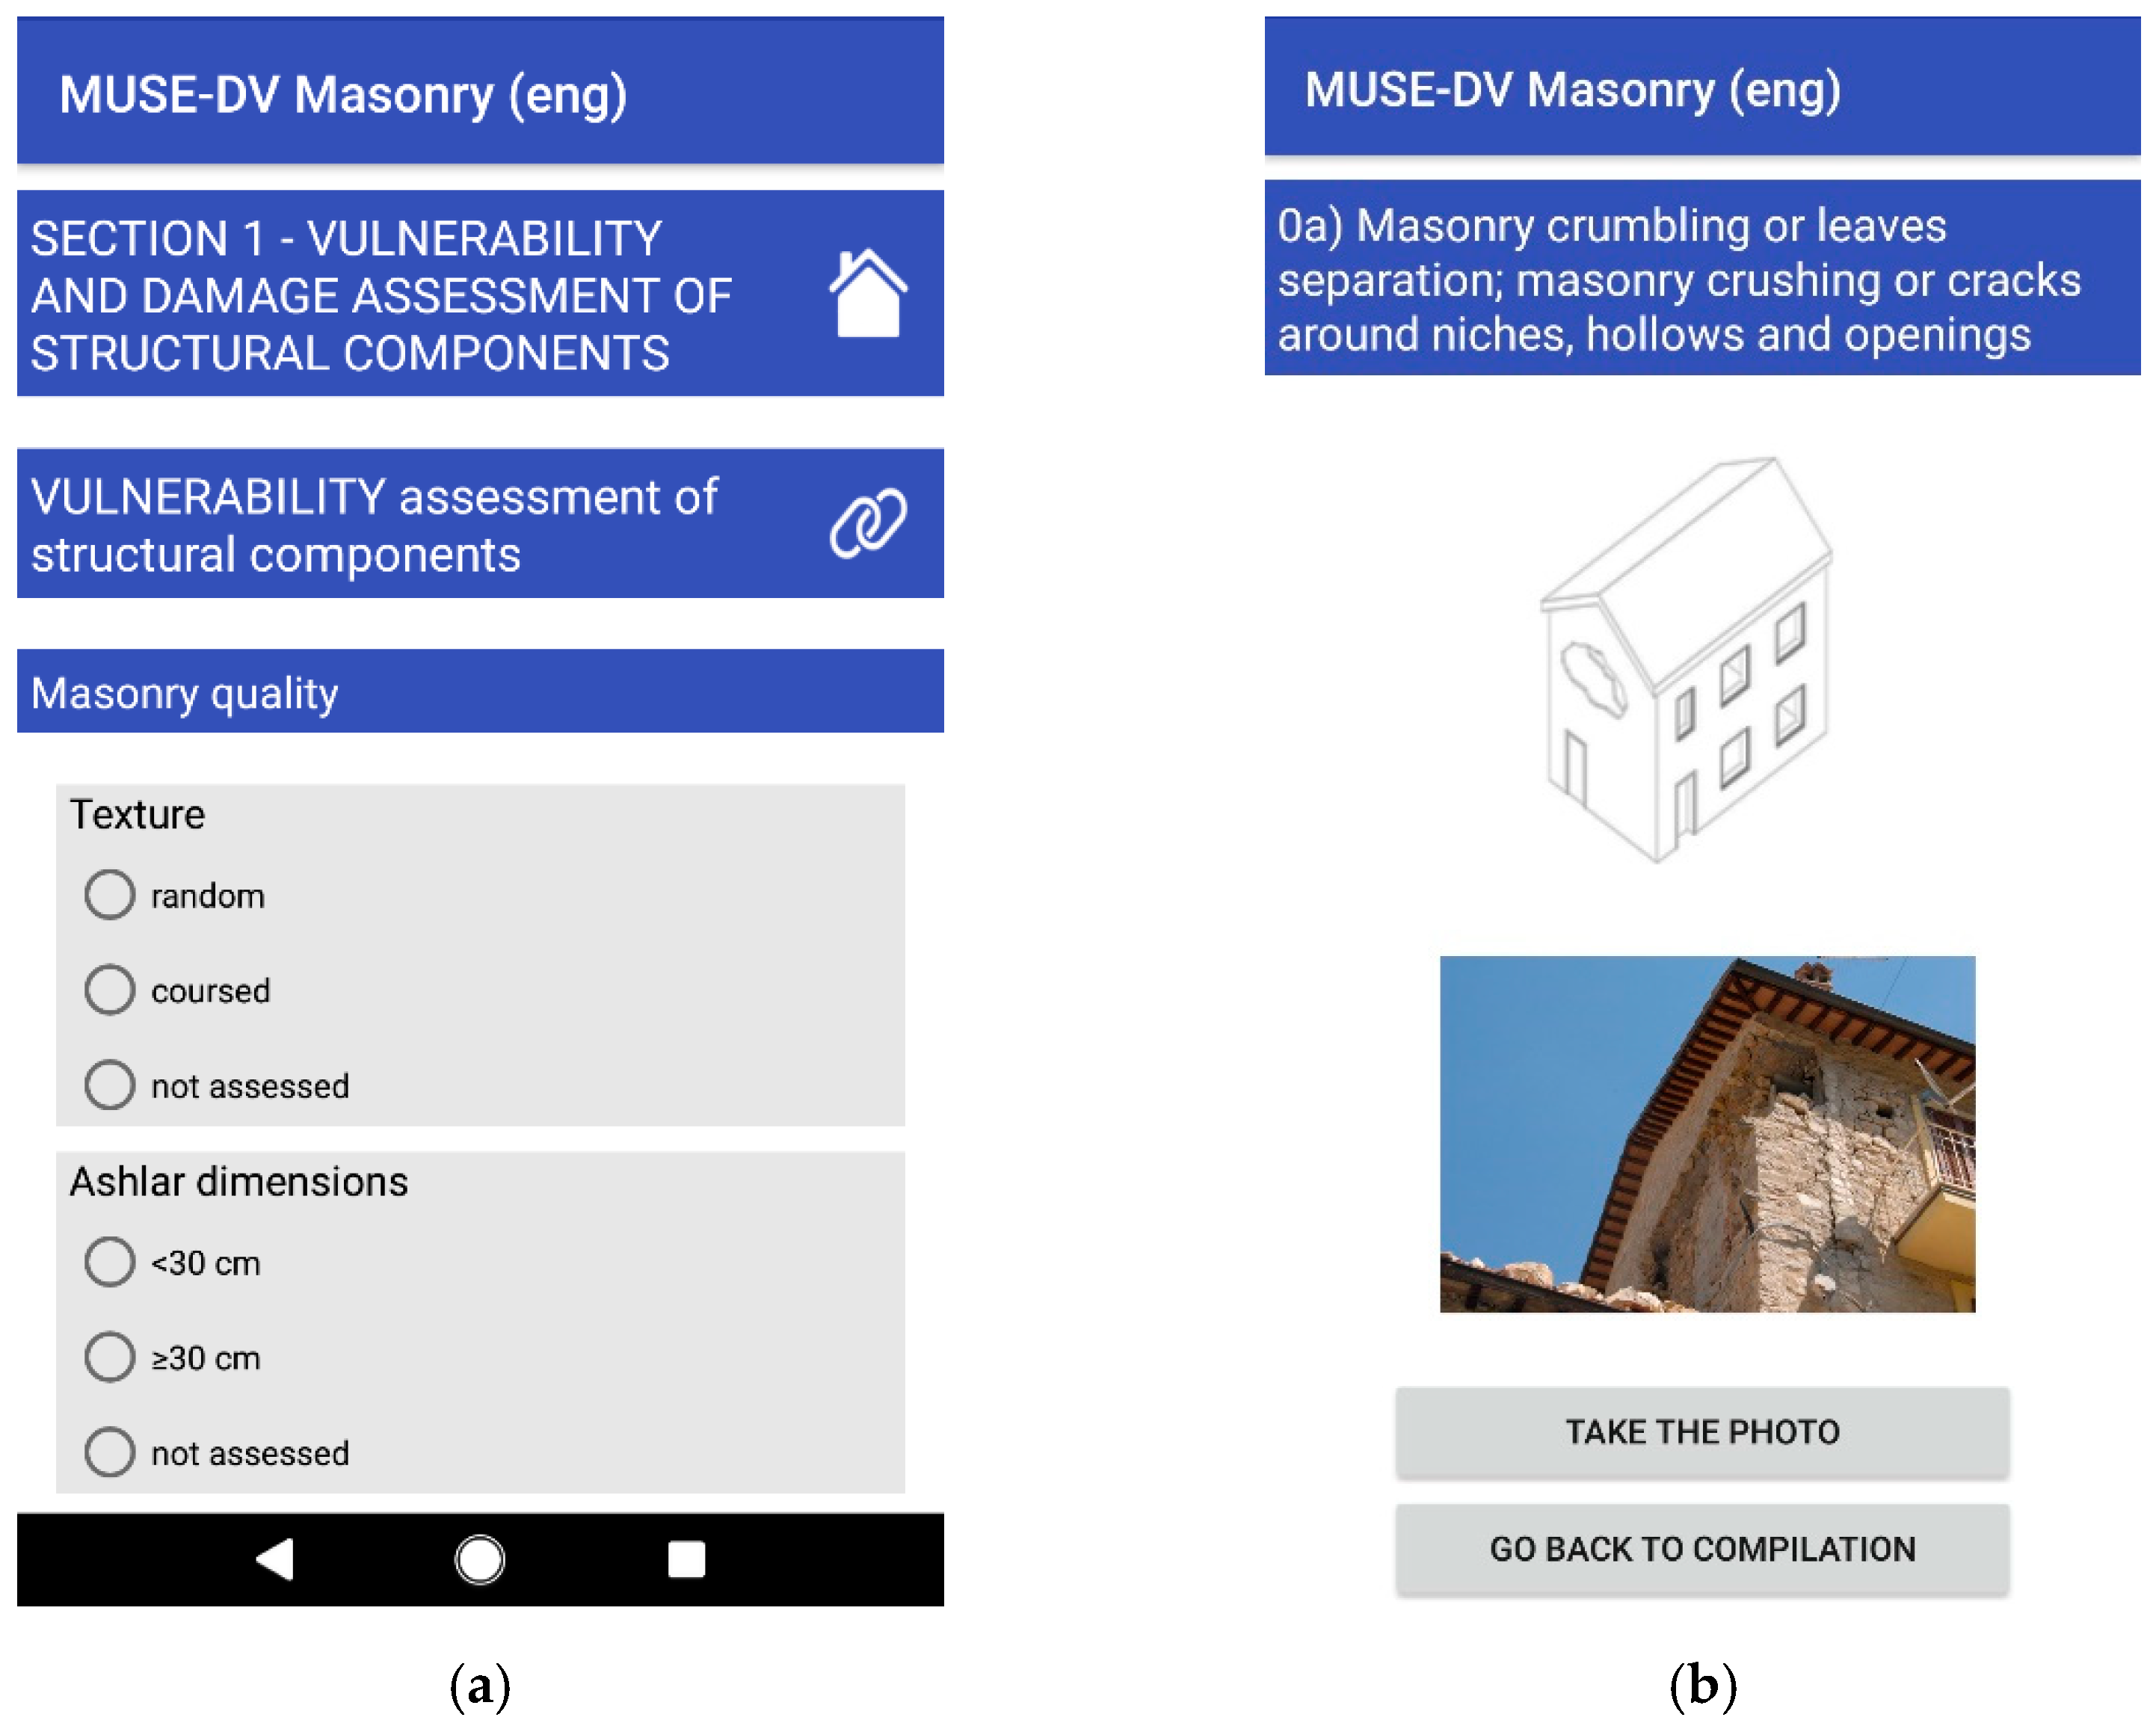
| Part 1—Vulnerability and damage assessment of structural components | |||
| Vulnerability assessment of structural components | Masonry quality | ○ | |
| Connections | ○ | ||
| Load bearing system | ○ | ||
| Structural irregularities (plan or elevation) | ○ | ||
| Damage assessment of structural components | Façade damage, orientation of seismic force | Sketch | |
| Damage assessment of structural components (extent and severity) | ○ | Damage Index DI1 | |
| Usability classification | ○ | ||
| Part 2—Local mechanism analysis | |||
| (1) External bearing walls | Mechanisms due to poor masonry quality | Damage: ▼ Photos | Damage Index DI2 |
| Out-of-plane mechanisms | |||
| In-plane mechanisms | |||
| Damage due to interventions | |||
| (2) Horizontal structures | Damage to loadbearing and non-structural elements | ||
| Damage to structural vaults | |||
| (3) Staircases | Damage to staircases | ||
| (4) Roof structures | Damage to loadbearing and non-structural elements | Vulnerability: □ | Vulnerability Index VI2 |
| (5) Internal bearing walls | Out-of-plane mechanisms on internal bearing walls | ||
| (6) Non-structural elements | Damage to ceilings; internal partitions; chimneys; cornices; roofing tiles; parapets; jambs | ||
| (7) Geometrical irregularities and soil–structure interaction | Interaction among adjacent buildings or between building and soil; mechanisms due to irregularities | ||
| Part 3—Building features | |||
| Masonry quality | Units and mortar | □ | |
| Texture and arrangement | □ | ||
| Cross-section | □ | ||
| Diaphragms | Floors/Vaults | □ | |
| Roofs | □ | ||
| CARTIS type | ○ | ||
| Structural Interventions | Walls | □ | |
| Diaphragms | □ | ||
| Type identification | EMS-98 Vulnerability class | □ | |
| Extent of the survey | ○ | ||
| Datum Type | MySQL Variable Type | Description | Number of Fields |
|---|---|---|---|
| ID | INT | integer number | 1 |
| text | VARCHAR | short string | 42 |
| photograph url | LONGTEXT | long string | 19 |
| single choices | ENUM | set of named values | 126 |
| multiple choices | SET | set of multiple values | 31 |
| date of the survey | TIMESTAMP | time and date | 1 |
| http Methods | CRUD Operations | Description |
|---|---|---|
| POST | CREATE | create a new resource |
| GET | READ | read a resource |
| PUT | UPDATE | update or change the status of a resource |
| DELETE | DELETE | delete a resource |
Publisher’s Note: MDPI stays neutral with regard to jurisdictional claims in published maps and institutional affiliations. |
© 2022 by the authors. Licensee MDPI, Basel, Switzerland. This article is an open access article distributed under the terms and conditions of the Creative Commons Attribution (CC BY) license (https://creativecommons.org/licenses/by/4.0/).
Share and Cite
Sbrogiò, L.; Saretta, Y.; Molinari, F.; Valluzzi, M.R. Multilevel Assessment of Seismic Damage and Vulnerability of Masonry Buildings (MUSE-DV) in Historical Centers: Development of a Mobile Android Application. Sustainability 2022, 14, 7145. https://doi.org/10.3390/su14127145
Sbrogiò L, Saretta Y, Molinari F, Valluzzi MR. Multilevel Assessment of Seismic Damage and Vulnerability of Masonry Buildings (MUSE-DV) in Historical Centers: Development of a Mobile Android Application. Sustainability. 2022; 14(12):7145. https://doi.org/10.3390/su14127145
Chicago/Turabian StyleSbrogiò, Luca, Ylenia Saretta, Francesco Molinari, and Maria Rosa Valluzzi. 2022. "Multilevel Assessment of Seismic Damage and Vulnerability of Masonry Buildings (MUSE-DV) in Historical Centers: Development of a Mobile Android Application" Sustainability 14, no. 12: 7145. https://doi.org/10.3390/su14127145
APA StyleSbrogiò, L., Saretta, Y., Molinari, F., & Valluzzi, M. R. (2022). Multilevel Assessment of Seismic Damage and Vulnerability of Masonry Buildings (MUSE-DV) in Historical Centers: Development of a Mobile Android Application. Sustainability, 14(12), 7145. https://doi.org/10.3390/su14127145