Abstract
The creation of salt-tolerant wheat genotypes can provide a basis for sustainable wheat production in areas that are particularly sensitive to the impacts of climate change on soil salinity. This study aimed to select salt-tolerant wheat genotypes that could serve as a genetic resource in breeding for salinity tolerance. A two-year experiment was established with 27 wheat genotypes, grown in salinity stress and non-stress conditions. Agronomic parameters (plant height, spike weight, number of grains per spike, thousand grain weight, and grain yield/plant) were analyzed in the phenophase of full maturity, while biochemical parameters (DPPH radical scavenging activity and total phenolic content) were tested in four phenophases. Grain yield/plant was the most sensitive parameter to salinity, with a 31.5% reduction in value. Selection based on salt tolerance indices (STI, MP, and GMP) favored the selection of the genotypes Renesansa, Harmonija, Orašanka, Bankut 1205, KG-58, and Jugoslavija. Based on YI (1.30) and stability analysis, the genotype Harmonija stands out as the most desirable genotype for cultivation in saline conditions. The presence of positive correlations between grain yield/plant and biochemical parameters, in all phenophases, enables the selection of genotypes with high antioxidant activity and high yield potential, even in the early stages of plant development.
1. Introduction
Soil salinization has become one of the major environmental issues globally, and it is expected to be further exacerbated by projected climate change [1]. Arid and semi-arid agricultural areas are particularly sensitive to the impacts of climate change on increasing soil salinity [2,3,4]. More than 954 million hectares of the world’s total land area (over 20% of agricultural land) is affected by salinity, especially in arid and semi-arid areas [5,6].
Increased sodium content in soil is one of the most common causes of abiotic stress to which plants are exposed [7]. Cereals Cereals have been characterized as plant species that are moderately tolerant to salinity [8]. Due to its primary presence in human nutrition, wheat is ranked first as the most important among cereals [9,10]. Wheat provides almost 20% of the total calories and protein in the daily diet [11]. Due to the constant increase in human population, the consumption of wheat is increasing globally, in both favorable and unfavorable ecosystems for agricultural production [9,12]. For this reason, creating salt-tolerant genotypes is crucial [13]. However, the creation of genotypes with increased tolerance to salinity stress is a slow process, whose progress is limited by the available genetic variability [14,15,16,17]. In order to select useful genetic variability for more successful wheat cultivation under stress conditions, it is important to study genotypes in given environmental conditions—in situ [18]. Moustafa et al. [16], El-Hendawy et al. [19], and Allel et al. [20] emphasized that the assessment of genotype tolerance to salinity in real environmental conditions is of particular importance in breeding wheat for increased tolerance to salinity. In real environmental conditions, plants are exposed to all other abiotic factors (soil heterogeneity, drought stress, fluctuations in air temperature) present in the given area at the same time as salinity stress. Despite this, little work has been carried out to examine wheat tolerance to salinity stress in real environmental conditions. Many studies have focused on assessing the salt tolerance of wheat genotypes in laboratory conditions, where different salt concentrations have been used as treatments [17,21,22,23,24].
Salinity tolerance is a complex polygenic trait highly influenced by environmental factors [25]. For this reason, it is important to develop methods for assessing salinity tolerance, which would enable sustainable agricultural production in salinity stress conditions.
Wheat responds to salinity stress at the morphological, physiological, and molecular levels [24,26]. In studies on the effects of salinity stress on agronomic traits of wheat, Mansour et al. [13], Hasan et al. [21], Nadeem et al. [22], and Khokhar et al. [27] found that increased salt concentration significantly reduces the values of the grain yield and grain yield components, compared with the values achieved in the control and treatments with low salt concentration. Salinity stress induces osmotic and ionic stress and nutrient imbalance in the plant, where their secondary effects lead to the production of reactive oxygen species (ROS) [28,29]. Accumulation of ROS in the plant leads to degradation of biological macromolecules (lipid peroxidation, protein oxidation, enzyme inhibition, damage to DNA and RNA) and ultimately cell death [28,29,30]. The most important determinant of plant tolerance to abiotic stress is the plant’s ability to scavenge the toxic effects of ROS. Antioxidants are the first line of defense against the damage caused by ROS [31,32].
Phenolic compounds are among the main non-enzymatic antioxidants that have the greatest potential for neutralizing ROS [33,34]. Therefore, the accumulation of phenolic components may be an adaptive cellular mechanism for the removal of ROS during stress [35,36]. Chernane et al. [37], Kumar et al. [38], and Kiani et al. [39] point out that salinity stress significantly increases the phenolic content in wheat. Kiani et al. [39] noticed that, in addition to the increase in the phenolic content in wheat leaf, the ability to neutralize free DPPH radicals under conditions of salinity stress also increased.
Wheat is particularly sensitive to salinity stress in the early stages of development, so it is suggested that the assessment of salinity tolerance be evaluated in the early stages of plant development, which would save invested funds and time [40].
This investigation aimed to: (i) examine the influence of salinity stress on agronomic and biochemical parameters of different wheat genotypes, grown in real environmental conditions, i.e., in situ; (ii) establish the inter-relationships between agronomic and biochemical parameters, tested in different growth stages of plants; and (iii) determine the appropriate selection indices/criteria for assessing the tolerance of a genotype to salinity.
2. Materials and Methods
2.1. Plant Material and Plot Design
The present study was established on two soil types, Solonetz (Kumane, Vojvodina Province, Serbia, 45.522° N 20.195° E) and Chernozem (Rimski Šančevi, Vojvodina Province, Serbia, 45.322° N 19.836° E), during two vegetation seasons (2015/2016 and 2016/2017). The research included 27 genotypes of wheat (Triticum aestivum spp. vulgare), with twenty genotypes (Gružanka, Zastava, Aleksandra, Srbijanka, Kosmajka, Orašanka, Rujna, Šumadija, Harmonija, Ljubičevka, Perfekta, Premija, KG-56, KG-75, KG-58, KG-78, Morava, Lepenica, Šumadinka, and Oplenka) created at the Centre for Small Grains in Kragujevac; four genotypes (Renesansa, NSR-5, Jugoslavija, and Pesma) released by the Institute of Field and Vegetable Crops in Novi Sad; one old Hungarian variety (Bankut 1205), which was cultivated in Banat in the last century; and two local landraces, Banatka, which was cultivated in Banat (Vojvodina Province) in the last century, and Grbljanka, which was cultivated in Montenegro in the last century (Table 1). The local landrace Banatka, the genotype Bankut 1205, and the genotypes created at the Institute of Field and Vegetable Crops were chosen on the basis of previous studies that examined the adaptability of these genotypes to abiotic stress on Solonetz soil, in Kumane locality. In order to increase genotypic variability and identify novel sources of salt tolerance, this research included the local landrace Grbljanka, as well as old and modern varieties from the Centre for Small Grains in Kragujevac.

Table 1.
Wheat genotypes used in this study.
A field trial was conducted according to randomized complete block design (RCBD) with three replications. During the research, the usual agro-technical practices for wheat production were applied. The size of the basic plot was 2 m2. In the first year of research (2015/2016), in Kumane locality (Solonetz soil type), sowing was performed on 8 October, while in Rimski Šančevi locality (Chernozem soil type), sowing was carried out on 29 October. Due to higher rainfall during October in the second year of research (2016/2017), sowing was delayed in both localities, and it was performed on 24 October in Rimski Šančevi locality and on 8 November in Kumane locality. In both soil types, the examined genotypes were sown by continuous sowing, where the row spacing was 10 cm, and the distance between plots was 25 cm. In both vegetation seasons, the harvest was performed at the optimal time (last week of June), when the grain moisture was below 14%.
2.2. Soil Conditions
Solonetz is an alkalized soil, with more than 15% adsorbed Na+ ions in the adsorptive complex. It is characterized by unfavorable physical and chemical properties, which are caused primarily by the high content of clay and the presence of adsorbed Na. High biological activity in the surface horizon, at the depth from 0 to 13 cm, influences the high content of organic matter (6.05%). However, the strong decrease in the content of organic matter (<1.7%) at the depth below 13 cm indicates the low biological activity of this layer. Below the relatively shallow humus-accumulative and eluvial horizon, which contains 20.24 mg/100 g of absorbed Na, there is an argiluvian (Bt, Na) horizon, which has the highest Na content (309.35 mg/100 g) at the depth from 58 to 85 cm and pH 8.21 (Table S1). In the dry state, this soil is compacted and hard, with pronounced cracks, and in the wet state it absorbs a lot of water, swells, and does not leak water and air. Also, with the increase in the sum of exchangeable cations in the Bt horizon, the content of clay and exchangeable Na increases, as well as the alkalinity (pH > 9) [41,42].
Chernozem is a soil from a semi-arid steppe area with a very favorable, clayey, mechanical composition [43]. It is characterized by a sufficient content of organic matter (3.75%), labile phosphorus (12.0 mg/100 g), and exchangeable potassium (28.3 mg/100 g) at a depth from 0 to 30 cm (surface horizon). Also, it is characterized by a good crumbly structure, stable aggregates, good water permeability, and favorable water–air and heat regime. Chernozem is distinguished by a neutral to slightly alkaline pH(6.80 to 7.59), powerful humus-accumulative horizon, clayey mechanical composition, and good structure (Table S2).
2.3. Agronomic Traits
Agronomic parameters were analyzed on a sample of 30 plants per genotype, in the phase of full maturity of wheat. The analyzed parameters were plant height (cm), spike weight (g), number of grains per spike, thousand grain weight (g), and grain yield/plant (g).
2.4. Stress Resistance Indicators
Salt resistance indicators for each genotype were calculated using the following formulas:
Stress susceptibility index (SSI) [44]:
SSI = 1 − (Ys/Ych)/1 − (Ȳs/Ȳch)
Mean productivity (MP) [45]:
MP = (Ych + Ys)/2
Tolerance (TOL) [45]:
TOL = Ych − Ys
Stress tolerance index (STI) [46]:
STI = (Ych + Yp)/Ȳ2ch
Geometric mean productivity (GMP) [46]:
GMP = (Ych × Ys)0.5
Yield index (YI) [47]:
YI = Ys/Ȳs
Yield stability index (YSI) [48]:
where Ys and Ych are the yields of genotypes achieved on Solonetz (salinity stress) and Chernozem (non-stress), and Ȳs and Ȳch are the mean yields of all genotypes evaluated under salinity stress and non-stress conditions, respectively.
YSI = Ys/Ych
2.5. Biochemical Parameters
Biochemical parameters were analyzed in dry plant material of wheat leaves, sampled in four phenophases (tillering, stem elongation, heading, and full maturity). The dry plant material was macerated and extracted in an amount of 0.2 g with 10 mL of 70% acetone for 24 h in a dark place. After extraction, the macerate was filtered through filter paper. The filtered extracts were stored in a refrigerator at 4 °C, until further analysis.
The measurement of the DPPH radical scavenging activity was performed according to the methodology described by Lee et al. [49]. The plant extract (40 μL) was mixed with stable DPPH reagent (2 mL). In the presence of the extract as a hydrogen donor, stable DPPH is transformed into a reduced form, DPPH-H. The change in color (from deep violet to light yellow) was read after 30 min at 517 nm using a UV/VIS spectrophotometer (Thermo Scientific Evolution 220, Waltham, MA, USA). The activity of the removed DPPH radical is expressed in milligrams of trolox equivalent (TE) per gram of dry plant material (mg TE g−1 d.m.). All measurements were performed in triplicate.
Phenolic content in wheat extracts was determined by the Folin–Ciocalteu method according to Hagerman et al. [50]. The plant extract (20 μL) was mixed with 1.8 mL of deionized water, 0.2 mL of 20% sodium carbonate, and 0.1 mL of Folin–Ciocalteu reagent, previously diluted with distilled water at a ratio of 1:2. After incubation for 30 min at room temperature, the absorbance of the reaction mixture was determined at 720 nm using a UV/VIS spectrophotometer (Thermo Scientific Evolution 220, Waltham, MA, USA). The total phenolic content is expressed in milligrams of gallic acid equivalent (GAE) per gram of dry plant mass (mg GAE g−1 d.m.). All measurements were performed in triplicate.
2.6. Meteorological Conditions
The data on meteorological conditions were obtained from the website of the Republic Hydrometeorological Institute of Serbia [51] (Table 2, Figure 1). The weather conditions of the 2015/2016 vegetation season were more favorable for wheat production compared with the weather conditions of the 2016/2017 season, in both localities. The difference between these two vegetation seasons was especially reflected in terms of the amount of precipitation, which was higher in the 2015/2016 season.
Table 2.
Mean monthly temperatures and sum of precipitation in the examined agro-ecological environments, during the two vegetation seasons.
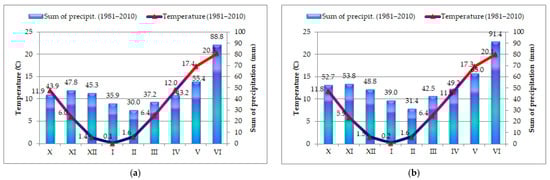
Figure 1.
Multy-year (1981–2010) average of mean monthly temperatures and sum of precipitation in Kumane locality (a) and Rimski Šančevi locality (b).
In the 2015/2016 vegetation season, October was characterized by favorable agro-meteorological conditions in both localities, which enabled adequate germination of wheat. A low sum of precipitation and higher temperatures in relation to the multi-year average characterized December in both localities. In February, the average monthly temperature, in both localities, was 6 °C higher in relation to the multi-year average, which led to an earlier start of vegetation. Favorable temperature conditions, with above average precipitation, characterized March in both localities, which enabled an earlier transition of wheat into the phenophase of stem elongation. In April, the average monthly temperature in both examined localities was about 2 °C higher in relation to the multi-year average. In the last 10 days of May, temperatures were rising in both localities, which enabled flowering and the beginning of wheat ripening. Warmer weather conditions with abundant rainfall (143 mm in Rimski Šančevi and 182.7 mm in Kumane) in June enabled a good grain filling (Table 2).
In the 2016/2017 vegetation season, October was characterized by a slightly lower average monthly temperature and a significantly higher sum of precipitation compared with the multi-year average (Table 2, Figure 1). Abundant precipitation continued until the first half of November, while the second half of the month was warmer and drier. The surface layer of the soil was of appropriate heat and moisture, which enabled appropriate plant development and the transition of wheat into the phenophase of tillering. February was marked by a lack of precipitation. The average monthly temperature was 2.5 °C higher in relation to the multi-year average, which influenced the earlier start of vegetation. The period of extremely warm weather continued in March, when the average monthly temperature in the examined localities was 3.5 °C higher compared with the multi-year average. April was characterized by good temperature conditions, which were close to the multi-year average for this month. The amount of precipitation, in both localities, was higher in relation to the multi-year average (57.0 mm in Rimski Šančevi locality and 52.5 mm in Kumane locality), which affected the intensive growth of the plants. In May, the amount of precipitation was low in Kumane locality and high in Rimski Šančevi locality. In June, higher temperatures and lower precipitation were recorded in both localities, which accelerated the ripening of wheat and the harvest (Table 2).
2.7. Statistical Analysis
Analysis of the phenotypic variability of agronomic parameters was performed using analysis of variance (ANOVA). Multiple comparison of mean values of factor variants was performed using the LSD test at two levels of statistical significance (1% and 5%). This analysis was performed using the program IBM SPSS Statistics, Trial Version 22.0 [52].
Hierarchical cluster analysis was performed for each stress resistance indicator, using the program IBM SPSS Statistics, Trial Version 22.0 [52]. The analysis was implemented according to the Ward method, where the distances between the two clusters are expressed as squared Euclidean distances. The significance of the distance between the clusters was tested by t-test. Cluster groups were identified using a dendrogram, where K-means analysis was performed with a predetermined number of clusters. After the abovementioned calculations, the ranking of cluster groups was performed for each stress resistance indicator.
Additive main effects and multiplicative interaction (AMMI) analysis was applied, according to Zobel et al. [53], in order to determine the stability of genotypes in different ecological environments. This analysis was performed using the program GenStat, Trial Version 18.1.0.17005 [54].
Heatmap analysis of Pearson moment correlation coefficients and correlation matrix analysis by the principal components method (PCA) were performed in order to express the inter-relationships between agronomic and biochemical parameters using the R Project for Statistical Computing, Version 4.2.0, 2022-04-22 ucrt [55].
3. Results
3.1. Agronomic Parameters
The analyzed factors (genotype, soil type, and year) significantly influenced the variability of the examined agronomic traits (Table 3). In the phenotypic expression of plant height, soil type and genotype had almost equal effects (41.75% and 38.68%, respectively), while the smallest contribution to the total variation of this parameter was from the year (4.48%). In the variation of spike weight, number of grains per spike, and grain yield/plant, soil type had the dominant influence (31.51%, 51.67%, and 31.42%, respectively), followed by year (22.06%, 13.01%, and 24.29%, respectively), while genotype had the smallest share in the variation of the abovementioned traits (8.54%, 8.24%, and 9.38%, respectively). The phenotypic variability of thousand grain weight differed from the phenotypic variability of the other studied traits. Genotype had the largest share in the variability of this parameter (21.64%), followed by year (19.36%), while soil type had the smallest contribution to the variation (0.57%) (Table 3).
Table 3.
Analysis of variance for agronomic parameters of 27 wheat genotypes grown on Solonetz and Chernozem soil types during two vegetation seasons.
The highest average values of plant height were found in local landraces Grbljanka (119.2 cm) and Banatka (114.6 cm), while the lowest value was for the genotype Srbijanka (80.7 cm). Also, the genotype Srbijanka had the lowest value of plant height on Solonetz (67.6 cm), while on Chernozem the lowest value was measured in the genotype Orašanka (90.4 cm). The highest average values of spike weight (2.3 and 2.1 g) and number of grains per spike (36.9 and 37.4) were for the genotypes Harmonija and Renesansa, respectively, while the highest value of grain yield/plant was recorded in the genotype Renesansa (5.7 g) (Table 4).
Table 4.
Phenotypic variation of agronomic parameters in 27 wheat genotypes, grown on Solonetz and Chernozem soil (mean of pool data for two years).
On Solonetz soil, the genotype Harmonija achieved the highest values of spike weight (2.1 g), number of grains per spike (33.2), and grain yield/plant (4.8 g). On the Chernozem soil type, the genotype Morava had the highest value of spike weight (2.9 g), genotypes Bankut 1205 and Renesansa achieved the highest average values of number of grains per spike (46.7 and 45.0, respectively), while genotypes Jugoslavija and Renesansa had the highest average values of grain yield/plant (6.8 and 6.7 g, respectively). The highest values of thousand grain weight were measured in KG-56 (41.4 g), Orašanka (41.3 g), Renesansa (41.2 g), and KG-58 (41.1 g). The genotype Morava achieved the highest value of thousand grain weight on the Solonetz soil type (41.4 g), while genotypes KG-56 and Orašanka had the highest values of this trait on Chernozem (43.6 and 43.2, respectively). On average for both soil types, the genotype Šumadija had the lowest values of spike weight (1.6 g), thousand grain weight (33.5 g), and grain yield/plant (3.7 g). Also, this genotype had the lowest values of the abovementioned traits on the Chernozem soil type. On Solonetz, the local landrace Banatka had the lowest value of spike weight, while the lowest values of thousand grain weight and grain yield/plant were found in the genotype NSR-5. The genotype Banatka had the lowest value of number of grains per spike (29.2), on average for both soil types. Also, this genotype had the lowest value of this trait on Solonetz, while on Chernozem the lowest value was measured in the genotype Kosmajka (Table 4).
Salinity stress affected the decrease in all agronomic parameters, where the largest decrease was recorded in grain yield/plant (31.48%), then in the number of grains per spike (27.27%), plant height (19.69%), and the smallest in thousand grain weight (1.55%) (Table 4).
3.2. Stress Resistance Indicators
The calculated indicators of stress resistance are shown in Table 5. According to the value of stress sensitivity index (SSI), the genotype Šumadija was singled out in cluster group A as the least sensitive genotype. Genotypes classified in cluster group B (Rujna and Premija) are also characterized by low sensitivity to stress. However, these genotypes had a low average value of grain yield/plant (mean productivity, MP). Genotypes NSR-5, Pesma, Zastava, and Jugoslavija were considered genotypes with high salt susceptibility (cluster group E). Among these genotypes, the genotype Jugoslavija had a high value of MP (cluster group A), while the other genotypes had a poor grain yield/plant.
Table 5.
Stress resistance indicators for 27 wheat genotypes grown under stress and non-stress environments during two vegetation seasons.
The tolerance index (TOL) indicates the difference between the grain yield/plant observed in favorable environmental conditions (Chernozem) and the grain yield/plant achieved under stress conditions (Solonetz). The genotypes Šumadija and Rujna were separated into cluster group A, according to the values of TOL. A negative value of TOL (−0.15) showed that genotype Šumadija was characterized by higher grain yield/plant under stress conditions compared with the yield under favorable environmental conditions. Genotypes classified into cluster group B (KG-78, Oplenka, Harmonija, Ljubičevka, and Premija), according to the values of TOL, exhibited a small difference in grain yield/plant achieved on the analyzed soil types. On the other hand, the genotypes Bankut 1205, Zastava, Jugoslavija, NSR-5, Perfekta, and Pesma, grouped in cluster group D, achieved large differences in grain yield/plant under different agro-ecological environments. Similar results were found for the yield stability index (YSI), which represents the quotient of the yield achieved on saline soil and the yield achieved on control. The genotype Šumadija had the highest value of YSI and was grouped into cluster group A, while genotypes Zastava, Jugoslavija, NSR-5, and Pesma, with the greatest decrease in grain yield/plant, were grouped into cluster E.
The stress tolerance index (STI), mean productivity (MP), and geometric mean productivity (GMP) take into account the values of grain yield/plant obtained on both types of soil. The highest STI and GMP values were in genotypes characterized by high average values of grain yield/plant (MP). According to the values of the abovementioned three indicators, genotypes Harmonija, Renesansa, Orašanka, Bankut 1205, Jugoslavija, and KG-58 are classified into cluster groups A and B. On the other hand, the genotypes Kosmajka, Šumadija, and Rujna are grouped in cluster groups D and E, as low-yielding genotypes.
Yield index (YI) represents the ratio of a genotype grain yield/plant achieved under stress conditions and the average grain yield/plant of all genotypes under stress conditions. Thus, this indicator is suitable for the determination of genotypes that had a high yield potential in stressful conditions. The highest YI values were calculated for genotypes Harmonija and Renesansa (cluster group A), indicating that these genotypes had higher grain yield/plant values in relation to the average grain yield/plant of all genotypes under stressful conditions. Genotypes Kosmajka, NSR-5, and Pesma (cluster group E) had the lowest YI values (Table 5).
3.3. Stability Performance of Analyzed Genotypes
The stability performance of the analyzed genotypes in terms of grain yield/plant was examined by creating an AMMI1 and AMMI2 biplot (Figure 2). On the AMMI1 biplot (Figure 2a), mean values of grain yield/plant are presented on the x-axis and the IPCA1 (first interaction principal component axis) scores on the y-axis. Considering AMMI1, it was noticed that the wheat genotypes differ in both the additive and the multivariate effect of the variation. The genotypes NSR-5, Srbijanka, Lepenica, Ljubičevka, Šumadinka, KG-56, Zastava, Gružanka, Morava, KG-58, Orašanka, Renesansa, and Harmonija showed high stability, i.e., low IPCA1 values. Thus, the differences between these genotypes were the result of an additive effect, not a multivariate one. The genotypes Renesansa, Harmonija, Orašanka, and Perfekta, in addition to a low IPCA1 value, are also characterized by a high mean value of grain yield/plant. In addition to high stability, the genotype Kosmajka was characterized by a low value of grain yield/plant. The genotype Jugoslavija had a high value of grain yield and high interaction with the environment. On the other hand, the genotypes Šumadija and Rujna had the lowest values of grain yield/plant and pronounced instability. The highest instability and the highest value of grain yield/plant were observed in the environment Chernozem 2016, while the environment Solonetz 2017 was characterized by high stability and the lowest average value of grain yield/plant. The Solonetz 2016 and Chernozem 2017 environments did not differ significantly in the multivariate and additive effects of variation.
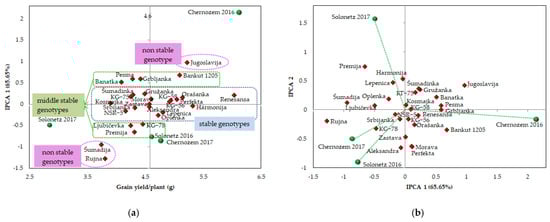
Figure 2.
AMMI1 (mean value vs. IPCA1) (a) and AMMI2 (IPCA1 vs. IPCA2) (b) for assessing the stability of 27 wheat genotypes, in terms of grain yield/plant, grown on two soil types (Solonetz and Chernozem) during two growing seasons (2015/2016 and 2016/2017).
An AMMI2 biplot (IPCA1 × IPCA2) was created, which explains an additional 21.86% of the G×E interaction (Figure 2b). The genotypes with low values of both IPCA axes, Kosmajka, KG-56, KG-58, Renesansa, NSR-5, and Srbijanka, are positioned close to the origin and exhibit a high stability reaction in all environments. The least interaction with genotypes was found for the environments Chernozem 2017 and Solonetz 2016. The vectors of the abovementioned environments are located in the same quadrant of the biplot, where they formed a sharp angle with each other and provided conditions for equal ranking of genotypes. Genotypes Aleksandra, Zastava, KG-78, and Rujna achieved a positive interaction with the Solonetz 2016 and Chernozem 2017 environments. The environments Chernozem 2016 and Solonetz 2017 are characterized by high values of IPCA1 and/or IPCA2. Genotypes Bankut 1205, Grbljanka, and Pesma, with high IPCA1 values, reacted well to the favorable conditions of the Chernozem 2016 environment. Genotypes Harmonija, Lepenica, and Premija with high IPCA2 values, had a positive reaction to the stress conditions of the Solonetz 2017 environment.
3.4. Biochemical Parameters
Two biochemical parameters were analyzed: DPPH• scavenging activity and total phenolic content (TPC), which are indicators of plant antioxidant activity (Figure 3). The values of the given parameters are expressed according to cluster groups for average grain yield/plant (cluster groups for the MP indicator, Table 5). Genotypes classified in cluster group A, which are characterized by the highest grain yield/plant (Table 4), were found to have the highest DPPH• scavenging activity (6.40 mg TE g−1 d.m.) and TPC (8.34 mg GAE g−1 d.m.). In contrast to the values of the MP indicator, cluster group C is characterized by the lowest DPPH• scavenging activity (4.34 mg TE g−1 d.m.) and TPC (5.20 mg GAE g−1 d.m.). Significantly higher values of DPPH• scavenging activity and TPC were achieved under stress conditions (6.03 mg TE g−1 d.m. and 6.96 mg GAE g−1 d.m.) in relation to values measured in favorable conditions (4.38 mg TE g−1 d.m. and 6.20 mg GAE g−1 d.m.) (Figure 3a,b). On the Solonetz soil type, the highest values of DPPH• scavenging activity and TPC were measured in the phenophase of stem elongation, while on the Chernozem soil type, the highest values of both examined biochemical parameters were found in the phenophase of heading. On both analyzed soil types, the lowest values of biochemical parameters were measured in the phenophase of full maturity (Figure 3a,b).
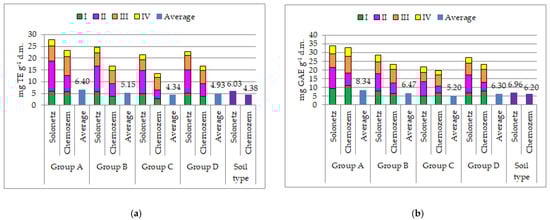
Figure 3.
DPPH• scavenging activity (a) and total phenolic content (TPC) (b) in four phenophases (I—tillering, II—stem elongation, III—heading, and IV—full maturity) of wheat genotypes grown in saline (Solonetz) and non-saline (Chernozem) environments. Note: Cluster groups were formed according to the cluster groups for the MP indicator presented in Table 5.
3.5. Inter-Relationships among Analyzed Parameters
The association between all agronomic and biochemical parameters was estimated through correlation matrix analysis by the principal components method and Pearson moment correlation coefficients (Figure 4 and Figure 5). The first two PCAs were used to construct the biplots, where the largest share of the total variability was explained. The parameters represented by vectors that form an acute angle (<90°) with each other are positively correlated, while those that form an obtuse angle (>90°) achieve a significant negative correlation.
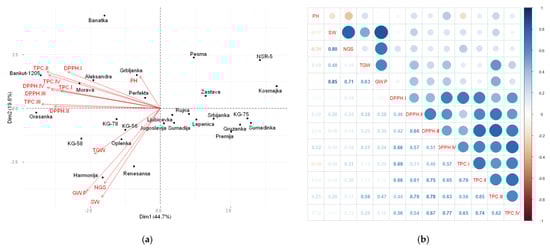
Figure 4.
Principal components analysis (PCA) (a) and heatmap of Pearson moment correlation coefficients (b) for agronomic and biochemical parameters of 27 wheat genotypes grown on Solonetz soil, during two vegetation seasons. PH—plant height, SW—spike weight, NGS—number of grains per spike, TGW—thousand grain weight, GY/P—grain yield/plant, DPPH—DPPH• scavenging activity, and TPC—total phenolic content, in the phenophases of I—tillering, II—stem elongation, III—heading, and IV—full maturity.
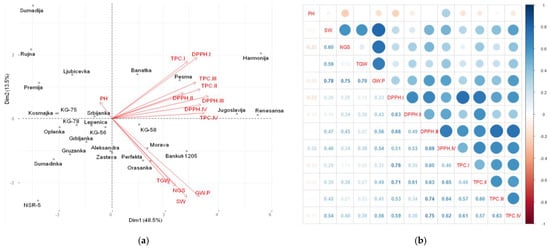
Figure 5.
Principal components analysis (PCA) (a) and heatmap of Pearson moment correlation coefficients (b) for agronomic and biochemical parameters of 27 wheat genotypes grown on Chernozem soil, during two vegetation seasons. PH—plant height, SW—spike weight, NGS—number of grains per spike, TGW—thousand grain weight, GY/P—grain yield/plant, DPPH—DPPH• scavenging activity, and TPC—total phenolic content, in the phenophases of I—tillering, II—stem elongation, III—heading, and IV—full maturity.
Figure 4a,b shows the results of the inter-relationships between the examined parameters for genotypes grown on Solonetz. The analyzed parameters are divided into three groups. The first group consists of agronomic parameters, namely, spike weight, number of grains per spike, thousand grain weight, and grain yield/plant, with an acute angle between their vectors (Figure 4a). The heatmap of Pearson moment correlation coefficients shows significant and positive correlations between the abovementioned parameters (Figure 4b). The second group comprises biochemical parameters analyzed in four phenophases, whose vectors overlap with each other to form an acute angle (Figure 4a). Biochemical parameters in all analyzed phenophases showed positive correlations with plant height and thousand grain weight. The DPPH• scavenging activity in the phenophases of stem elongation and heading showed a positive correlation with grain yield/plant (Figure 4b). The third group consists of only plant height, whose vector formed an angle less than 90° with the vectors of biochemical parameters in all analyzed phenophases, a straight angle with the vector of thousand grain weight, and an angle greater than 90° with the vectors of grain yield/plant, number of grains per spike, and spike weight (Figure 4a).
The relationships between the parameters analyzed in wheat genotypes grown on Chernozem are shown in Figure 5a,b. It was noticed that the vectors of some agronomic parameters, namely, number of grains per spike, spike weight, thousand grain weight, and grain yield/plant, formed an acute angle between each other (Figure 5a). A statistically highly significant (p < 0.01) and positive correlation was found between the abovementioned parameters (Figure 5b). The plant height was singled out into a separate group, with an angle of 180° between the vector of this parameter and the vectors of all other agronomic parameters, and an angle greater than 90° with the vectors of biochemical parameters. The heatmap of Pearson correlations shows that plant height is negatively correlated with agronomic and biochemical parameters (Figure 5b). The vectors of biochemical parameters analyzed in different phenophases formed acute angles with each other and with the vectors of agronomic parameters. Highly significant (p < 0.01) and positive correlations were found between biochemical parameters in all phenophases (Figure 5b).
4. Discussion
The conversion of significant areas of arable and fertile land into industrial zones and residential buildings leads to a need for less fertile land to be cultivated and used for agricultural production. This opens up space for the development of breeding programs aimed at creating genotypes with high adaptability to unfavorable environmental conditions. After drought, increased soil salinity is one of the main factors limiting agricultural production. Halomorphic soils are spread all over the world, especially in arid and semi-arid areas, as well as in irrigated areas [5,6]. These areas are particularly sensitive to the impacts of climate change on soil salinity [2,3,4]. Therefore, the creation of genotypes that can produce a high and stable yield in the given environmental conditions, by their improved tolerance to salinity, is one of the most important ways of sustainably producing crops under salinity stress conditions. Accordingly, it is of particular importance that the assessment of genotype tolerance takes place in real environmental conditions—in situ—where plants are exposed to other abiotic factors [16,18,19,20]. Thus, the evaluation of genotypes under natural saline field conditions allows the identification of genotypes suitable for cultivation under salinity stress conditions, as well as potential parents that can be integrated into breeding programs for salt tolerance [13].
The development of salt-tolerant wheat genotypes requires the existence of broad genetic variability. However, the genetic base of wheat breeding for salt tolerance is narrow [56,57]. In the current study, twenty-seven divergent wheat genotypes were studied, including local landraces and old and modern commercial varieties. This is a vital approach because wheat landraces and old varieties could be valuable genetic resources for diversity and specific adaptation to salinity stress conditions, as well as appropriate parental material in breeding programs [57].
Wheat responds to salinity stress at the morphological, physiological, biochemical, and molecular levels [24,26]. Thus, a better understanding of wheat plants’ behavior in response to salinity stress has essential implications for developing salt-tolerant varieties.
In this study, soil type was the dominant factor in the phenotypic expression of most agronomic parameters, which differed from each other in their response to stress. Conditions of increased soil salinity most affected the decrease in grain yield/plant (by 31.48%), then the number of grains per spike (29.85%), spike weight (27.27%), and plant height (19.69%), and finally least affected the reduction in thousand grain weight (1.55%). Similar decreases in the values of the abovementioned traits under the influence of salinity stress were found by Mansour et al. [13], Hasan et al. [21], Nadeem et al. [22], Khokhar et al. [27], and Dimitrijević et al. [58]. Under the influence of increased salinity, the plant height was reduced by 19.69%, which is in accordance with the results of Kalhoro et al. [59], Otu et al. [60], and Nassar et al. [61]. By studying the phenotypic variability of the thousand grain weight, it was found that genotype had the largest share in the variation of this parameter. This indicates that thousand grain weight is a varietal characteristic [62]. Due to the small share of soil type in the phenotypic variation of thousand grain weight, this parameter cannot be considered an adequate marker of salinity tolerance. In contrast, all other agronomic parameters may be considered appropriate phenotypic markers of salinity tolerance. Moreover, Mansour et al. [13] and Moustafa et al. [16] point out that grain yield and its components are valuable criteria for selecting salinity-tolerant wheat genotypes.
In this research, a multi-dimensional evaluation of wheat response to salt stress was performed. Similar approaches in the identification of salt-tolerant wheat genotypes have been used by Mansour et al. [13], Oyiga et al. [15], and Dadashini et al. [63].
As grain yield/plant was the most sensitive parameter to the influence of salinity stress, the calculation of stress resistance indicators was performed based on the value of this parameter. Stress resistance indicators provide useful information for assessing genotypes’ tolerance to stress and their classification [13,21,64,65]. The indicators STI, MP, and GMP take into account the values of grain yield/plant obtained on both soil types. Selection based on these three indicators favors high-yielding genotypes (Harmonija, Renesansa, Orašanka, Bankut 1205, Jugoslavija, and KG-58) and excludes low-yielding genotypes (Šumadija, Kosmajka, and Rujna). Similar rankings of the genotypes for MP, GMP, and STI indicators were established by Mansour [13], suggesting that these three indices are comparable for selecting genotypes. Furthermore, Hamam and Negin [64] stated that STI, MP, and GMP identify genotypes that are characterized by high grain yield in both stressful and non-stressful conditions. However, these parameters did not identify genotypes with good tolerance to stress despite having a low grain yield. The STI indicator showed small variability among genotypes in relation to the GMP indicator, which makes it less suitable for the determination of salt-tolerant genotypes. Stress susceptibility index (SSI) may be an appropriate sectional index for the selection of salinity-resistant genotypes. The results showed that selection based on the SSI indicator resulted in the selection of low-yielding genotypes (Šumadija, Rujna, and Premija) characterized by small differences in values of grain yield achieved under stress and non-stress conditions. Despite being characterized by low yields, these genotypes have low sensitivity to stress and can serve as parents in breeding for salt tolerance. Similar rankings of genotypes were given by the TOL and YSI indicators, which represent the differences, i.e., the ratio of the yield achieved on Chernozem to the yield achieved on Solonetz. Selection based on the abovementioned parameters resulted in the selection of genotypes that have a low grain yield in both localities (Rujna, Šumadija, and Premija), making it difficult to identify the most productive genotypes. Similar results were obtained by Hamam and Negin [64], where they observed that selection based on TOL led to a reduction in wheat grain yield for the control, failing to identify the best genotypes. Therefore, these parameters are suitable for negative selection, i.e., excluding the genotypes NSR-5, Zastava, and Pesma, which had low average grain yield and large differences in values of grain yield on different soil types.
The YI parameter takes into account the yield achieved under stressful environmental conditions, and it is therefore suitable for the selection of stress-tolerant genotypes. High values of this parameter favored the genotypes Harmonija and Renesansa, which had the highest values of grain yield/plant in salinity stress conditions. Mansour et al. [13] concluded that cluster analysis based on YI was effective in the selection of salt-tolerant genotypes.
The most stable genotypes with high values of grain yield/plant were Renesansa, Harmonija, Orašanka, and Perfekta. These genotypes are suitable for growing in different environmental conditions. The greatest interaction with the environments, i.e., the greatest instability, was found in the genotypes Rujna and Šumadija, which had the lowest values of grain yield. By comparison with the IPCA2 axis, which explains an additional 21.86% of the interaction, it was noticed that the genotype Harmonija responded well to the unfavorable conditions of the Solonetz environment in the 2016/2017 vegetation season.
A lack of precise characterization of wheat traits related to salinity stress at different growth stages is one of the main reasons for limited success in breeding salt-tolerant wheat varieties [63]. In this study, analysis of biochemical parameters was performed in four phenophases of wheat, during two growing seasons. Since the test was performed under in situ conditions, it provides a better insight into the impact of abiotic stress caused by increased salinity of the soil solution than would be obtained in laboratory conditions. El-Hendawy et al. [19] and Allel et al. [20] state that the assessment of genotypes’ tolerance to salinity in real environmental conditions is of special importance when it comes to breeding for increased tolerance to salinity. Wheat genotypes exhibited significantly higher values of DPPH• scavenging activity and TPC when grown in salinity stress conditions. This is in accordance with previous studies that confirm that stress caused by elevated concentrations of Na+ ions significantly increases the content of TPC in wheat [37,38,66]. In addition to the increase in TPC, it was found that salinity stress also increased the ability of wheat to neutralize free DPPH radicals [39,67,68].
The highest values of analyzed biochemical parameters were found in the genotypes classified in cluster group A, which had the highest grain yield/plant. These results are in line with the obtained positive correlations between grain yield/plant and biochemical parameters on both soil types. Moreover, biochemical parameters were in positive correlations throughout all phenophases. Based on the given results, it can be concluded that biochemical parameters may be good selection criteria, even in the early stages of plant development. Positive correlations between parameters of tolerance to salinity measured in the early growth stages and those measured at full maturity were reported by El-Hendawy et al. [19] and Turki et al. [69]. Furthermore, Dugasa et al. [70] and Hussain et al. [71] reported that a reduction in wheat grain yield (phenophase of full maturity) was associated with a decrease in morphological parameters measured in the tillering phenophase.
5. Conclusions
Stress conditions of increased soil salinity caused decreases in all agronomic parameters, where grain yield/plant was the most sensitive parameter. Selection based on the STI, MP, and GMP indicators favored genotypes that were characterized by the highest grain yield/plant on both types of soil, such as Harmonija, Renesansa, Orašanka, Bankut 1205, and Jugoslavija. According to SSI, YSI, and TOL, the genotypes Šumadija, Rujna, and Premija were characterized as tolerant genotypes, despite their low grain yield/plant and high instability. The YI parameter is an appropriate selection index for the selection of genotypes suitable for cultivation under stress conditions, where the genotypes Harmonija and Renesansa were particularly distinguished. According to AMMI analysis, the genotype Harmonija was characterized by a good adaptive response to the agro-ecological environment of Solonetz in the 2016/2017 vegetation season. A significant positive association was found between grain yield/plant and biochemical parameters tested in different phenophases, in both soil types. Therefore, biochemical parameters, such as DPPH• scavenging activity and TPC, may be suitable selection criteria for the selection of salinity-tolerant and high-yielding genotypes, even in the early stages of plant development.
Supplementary Materials
The following supporting information can be downloaded at: https://www.mdpi.com/article/10.3390/su14126973/s1, Table S1: Main chemical properties of Solonetz soil type and adsorbed cations content; Table S2: Main chemical properties of Chernozem soil type.
Author Contributions
Conceptualization, M.M.S. and S.P.; methodology, M.M.S., S.P. and B.B.; software, M.M.S. and B.B.; validation, V.Z., D.K. and S.R.N.; formal analysis, M.M.S., S.R.N. and H.M.; investigation, M.M.S., S.P. and B.B.; resources, D.K., V.Z. and R.Đ.; data curation, M.M.S. and S.P.; writing—original draft preparation, M.M.S., S.P. and B.B.; writing—review and editing, M.M.S., V.Z. and S.R.N.; visualization, S.R.N., H.M. and R.Đ.; supervision, S.P. and D.K.; project administration, D.K.; funding acquisition, D.K. All authors have read and agreed to the published version of the manuscript.
Funding
This research was funded by the Ministry of Education, Science and Technological Development, Serbia, grant numbers TR 31092, 451-03-68/2022-14/200189, and 451-03-68/2022-14/200216.
Institutional Review Board Statement
Not applicable.
Informed Consent Statement
Not applicable.
Data Availability Statement
Not applicable.
Acknowledgments
Ministry of Education, Science and Technological Development, Serbia (TR 31092, 451-03-68/2022-14/200189, and 451-03-68/2022-14/200216).
Conflicts of Interest
The authors declare no conflict of interest.
References
- Hassani, A.; Azapagic, A.; Shokri, N. Global predictions of primary soil salinization under changing climate in the 21st century. Nat. Commun. 2021, 12, 6663. [Google Scholar] [CrossRef] [PubMed]
- Okur, B.; Örçen, N. Soil salinization and climate change. In Climate Change and Soil Interactions; Narasimha, M., Prasad, V., Pietrzykowski, M., Eds.; Elsevier: Amsterdam, The Netherlands, 2020; pp. 331–350. [Google Scholar]
- Corwin, D.L. Climate change impacts on soil salinity in agricultural areas. Eur. J. Soil Sci. 2021, 72, 842–862. [Google Scholar] [CrossRef]
- Mukhopadhyay, R.; Jat Sarkar, H.; Sharma Chander, P.; Bolan, N.S. Soil salinity under climate change: Challenges for sustainable agriculture and food security. J. Environ. Manag. 2021, 280, 111736. [Google Scholar] [CrossRef] [PubMed]
- Shahid, S.A.; Zaman, M.; Heng, L. Soil salinity: Historical perspectives and a world overview of the problem. In Guideline for Salinity Assessment, Mitigation and Adaptation Using Nuclear and Related Techniques; Springer: Cham, Switzerland, 2018; pp. 43–53. [Google Scholar]
- Liu, X.; Chen, D.; Yang, T.; Huang, F.; Fu, S.; Li, L. Changes in soil labile and recalcitrant carbon pools after land-use change in a semi-arid agro-pastoral ecotone in Central Asia. Ecol. Indic. 2020, 110, 105925. [Google Scholar] [CrossRef]
- Munns, R.; Tester, M. Mechanisms of salinity tolerance. Annu. Rev. Plant Biol. 2008, 59, 651–681. [Google Scholar] [CrossRef] [Green Version]
- Lin, J.; Li, X.; Zhang, Z.; Yu, X.; Gao, Z.; Wang, Y.; Wang, J.; Li, Z.; Mu, C. Salinity-alkalinity tolerance in wheat: Seed germination, early seedling growth, ion relations and solute accumulation. Afr. J. Agric. Res. 2012, 7, 467–474. [Google Scholar]
- Giraldo, P.; Benavente, E.; Manzano-Agugliaro, F.; Gimenez, E. Worldwide research trends on wheat and barley: A bibliometric comparative analysis. Agronomy 2019, 9, 352. [Google Scholar] [CrossRef] [Green Version]
- Iqbal, M.A.; Rahim, J.; Naeem, W.; Hassan, S.; Khattab, Y.; El-Sabagh, A. Rainfed winter wheat (Triticum aestivum L.) cultivars respond differently to integrated fertilization in Pakistan. Fresenius Environ. Bull. 2021, 30, 3115–3121. [Google Scholar]
- Shiferaw, B.; Smale, M.; Braun, H.J.; Duveiller, E.; Reynolds, M.; Mauricho, G. Crops that feed the world 10. Past scuccesses and future challenges to the role played by wheat in global food security. Food Secur. 2013, 5, 291–317. [Google Scholar] [CrossRef] [Green Version]
- Shewry, P.R.; Hey, S.J. The contribution of wheat to human diet and health. Food Energy Secur. 2015, 4, 178–202. [Google Scholar] [CrossRef]
- Mansour, E.; Moustafa, E.S.; Desoky, E.S.M.; Ali, M.; Yasin, M.A.; Attia, A.; Alsuhaibani, N.; Tahir, M.U.; El-Hendawy, S. Multidimensional evaluation for detecting salt tolerance of bread wheat genotypes under actual saline field growing conditions. Plants 2020, 9, 1324. [Google Scholar] [CrossRef] [PubMed]
- Crouch, J.H.; Payne, T.S.; Dreisigacker, S.; Wu, H.; Braun, H.J. Improved discovery and utilization of new traits for breeding. In Wheat Facts and Futures; Dixon, J., Braun, H.J., Kosina, P., Crouch, J., Eds.; CIMMYT: Mexico City, Mexico, 2009; pp. 42–51. [Google Scholar]
- Oyiga, B.C.; Sharma, R.; Shen, J.; Baum, M.; Ogbonnaya, F.; Leon, J.; Ballvora, A. Identification and characterization of salt tolerance of wheat germplasm using a multivariable screening approach. J. Agron. Crop Sci. 2016, 202, 472–485. [Google Scholar] [CrossRef]
- Moustafa, E.S.A.; Ali, M.M.A.; Kamara, M.M.; Awad, M.F.; Hassanin, A.A.; Mansour, E. Field sreening of wheat advanced lines for salinity tolerance. Agronomy 2021, 11, 281. [Google Scholar] [CrossRef]
- Saddiq, M.S.; Iqbal, S.; Hafeez, M.B.; Ibrahim, A.M.; Raza, A.; Fatima, E.M.; Baloch, H.; Woodrow, P.; Ciarmiello, L.F. Effect of salinity stress on physiological changes in winter and spring wheat. Agronomy 2021, 11, 1193. [Google Scholar] [CrossRef]
- Dimitrijević, M.; Petrović, S.; Banjac, B. Variation of phenotypic markers of wheat yield on alkalized soil. Sel. I Semen. 2013, 19, 1–9. (In Serbian) [Google Scholar]
- El-Hendawy, S.E.; Hassan, W.M.; Al-Suhaibani, N.A.; Refay, Y.; Abdella, K.A. Comparative performance of multivariable agro-physiological parameters for detecting salt tolerance of wheat cultivars under simulated saline field growing conditions. Front. Plant Sci. 2017, 8, 435. [Google Scholar] [CrossRef] [Green Version]
- Allel, D.; BenAmar, A.; Badri, M.; Abdelly, C. Evaluation of salinity tolerance indices in North African barley accessions at reproductive stage. Czech J. Genet. Plant Breed. 2019, 55, 61–69. [Google Scholar] [CrossRef] [Green Version]
- Hasan, A.; Hafiz, H.R.; Siddiqui, N.; Khatun, M.; Islam, R.; Al-Mamun, A. Evaluation on wheat genotypes for salt tolerance based on some physiological traits. J. Crop Sci. Biotech. 2015, 18, 333–340. [Google Scholar] [CrossRef]
- Nadeem, M.; Tariq, M.N.; Amjad, M.; Sajjad, M.; Akram, M.; Imran, M.; Shariati, M.A.; Gondal, T.A.; Kenijz, N.; Kulikov, D. Salinity-induced changes in the nutritional quality of bread wheat (Triticum aestivum L.) genotypes. Agrivita J. Agric. Sci. 2020, 42, 1–12. [Google Scholar] [CrossRef] [Green Version]
- Al-Ashkar, I.; Alderfasi, A.; Romdhane, W.B.; Seleiman, M.F.; El-Said, R.A.; Al-Doss, A. Morphological and genetic diversity within salt tolerance detection in eighteen wheat genotypes. Plants 2020, 9, 287. [Google Scholar] [CrossRef] [Green Version]
- Zeeshan, M.; Lu, M.; Sehar, S.; Holford, P.; Wu, F. Comparison of biochemical, anatomical, morphological, and physiological responses to salinity stress in wheat and barley genotypes deferring in salinity tolerance. Agronomy 2020, 10, 127. [Google Scholar] [CrossRef] [Green Version]
- Arzani, A.; Ashraf, M. Smart engineering of genetic resources for enhanced salinity tolerance in crop plants. Crit. Rev. Plant Sci. 2016, 35, 146–189. [Google Scholar] [CrossRef]
- El-Sabagh, A.; Islam, M.S.; Skalicky, M.; Ali Raza, M.; Singh, K.; Anwar Hossain, M.; Hossain, A.; Mahboob, W.; Iqbal, M.A.; Ratnasekera, D.; et al. Salinity stress in wheat (Triticum aestivum L.) in the shanging climatte: Adaptation and management strategies. Front. Agron. 2021, 3, 661932. [Google Scholar] [CrossRef]
- Khokhar, M.I.; Hussain, M.; Anwar, J.; Zulkiffal, M.; Iqbal, M.M.; Khan, S.B.; Khan, A.; Qayyum, A.; Sabir, W.; Mehmood, S. Correlation and path analysis for yield and yield contributing characters in wheat (Triticum aestivum L.). Acta Agric. Serb. 2017, 15, 19–24. [Google Scholar]
- Munns, R.; James, R.A.; Läuchli, A. Approaches to increasing the salt tolerance of wheat and other cereals. J. Exp. Bot. 2006, 57, 1025–1043. [Google Scholar] [CrossRef] [PubMed] [Green Version]
- Hasanuzzaman, M.; Raihan, M.R.H.; Masud, A.A.C.; Rahman, K.; Nowroz, F.; Rahman, M.; Nahar, K.; Fujita, M. Regulation of Reactive Oxygen Species and Antioxidant Defense in Plants under Salinity. Int. J. Mol. Sci. 2021, 22, 9326. [Google Scholar] [CrossRef]
- Rajput, V.D.; Singh, R.K.; Verma, K.K.; Sharma, L.; Quiroz-Figueroa, F.R.; Meena, M.; Gour, V.S.; Minkina, T.; Sushkova, S.; Mandzhieva, S. Recent developments in enzymatic antioxidant defence mechanism in plants with special reference to abiotic stress. Biology 2021, 10, 267. [Google Scholar] [CrossRef]
- Hasanuzzaman, M.; Bhuyan, M.H.M.; Parvin, K.; Bhuiyan, T.F.; Anee, T.I.; Nahar, K.; Hossen, M.; Zulfiqar, F.; Alam, M.; Fujita, M. Regulation of ROS metabolism in plants under environmental stress: A review of recent experimental evidence. Int. J. Mol. Sci. 2020, 21, 8695. [Google Scholar] [CrossRef]
- Sachdev, S.; Ansari, S.A.; Ansari, M.I.; Fujita, M.; Hasanuzzaman, M. Abiotic stress and reactive oxygen species: Generation, signaling, and defense mechanisms. Antioxidants 2021, 10, 277. [Google Scholar] [CrossRef]
- Caverzan, A.; Casassola, A.; Patussi Brammer, S. Antioxidant responses of wheat plants under stress. Genet. Mol. Biol. 2016, 39, 1–6. [Google Scholar] [CrossRef] [Green Version]
- Bistgani, Z.E.; Hashemi, M.; da Costa, M.; Craker, L.; Maggi, F.; Morshedloo, M.R. Effect of salinity stress on the physiological characteristics, phenolic compounds and antioxidant activity of Thymus vulgaris L. and Thymus daenensis Celak. Ind. Crop. Prod. 2019, 135, 311–320. [Google Scholar] [CrossRef]
- Mohamed, A.A.; Aly, A.A. Alternations of some secondary metabolites and enzymes activity by using exogenous antioxidant compound in onion plants grown under seawater salt stress. Am.-Eurasian J. Sci. Res. 2008, 3, 139–146. [Google Scholar]
- Sytar, O.; Mbarki, S.; Zivčak, M.; Brestić, M. The involvement of different secondary metabolites in salinity tolerance of crops. In Salinity Responses and Tolerance in Plants; Kumar, V., Wani, S., Suprasanna, P., Tran, L.S., Eds.; Springer: Cham, Switzerland, 2018; Volume 2, pp. 21–48. [Google Scholar]
- Chernane, H.; Latique, S.; Mansori, M.; El-Kaoua, M. Salt stress tolerance and antioxidative mechanisms in wheat plants (Triticum durum L.) by seaweed extracts application. J. Agric. Vet. Sci. 2015, 8, 36–44. [Google Scholar]
- Kumar, S.; Beena, A.S.; Awana, M.; Singh, A. Physiological, biochemical, epigenetic and molecular analyses of wheat (Triticum aestivum) genotypes with contrasting salt tolerance. Front. Plant Sci. 2017, 8, 1151. [Google Scholar] [CrossRef] [Green Version]
- Kiani, R.; Arzani, A.; Mirmohammady Maibody, S.A.M. Polyphenols, flavonoids, and antioxidant activity involved in salt tolerance in wheat, Aegilops sylandrica and their amphidiploids. Front. Plant Sci. 2021, 12, 646221. [Google Scholar] [CrossRef]
- El-Hendawy, S.E.; Hu, Y.; Sakagami, J.I.; Schimidhalter, U. Screening Egyptian wheat genotypes for salt tolerance at early growth stages. Int. J. Plant Prod. 2011, 5, 1735–8043. [Google Scholar]
- Belić, M.; Nešić, L.; Dimitrijević, M.; Petrović, S.; Ćirić, V.; Pekeč, S.; Vasić, J. Impact of reclamation practices on the content and qualitative composition of exchangeable base cations of the solonetz soil. Aust. J. Crop Sci. 2012, 6, 1471–1480. [Google Scholar]
- Belić, M.; Nešić, L.; Ćirić, V. Types of halomorphic soils. In Reclamation of Halomorphic Soils; Manojlović, M., Ed.; University of Novi Sad, Faculty of Agriculture: Novi Sad, Serbia, 2014; pp. 12–37. [Google Scholar]
- Miljković, N.S. Fundamentals of Pedology; Faculty of Natural Science, Institute of Geography: Novi Sad, Serbia, 1996; p. 274. [Google Scholar]
- Fischer, R.A.; Maurer, R. Drought resistance in spring wheat cultivars. I. Grain yield response. Aust. J. Agric. Res. 1978, 29, 897–907. [Google Scholar] [CrossRef]
- Hossain, A.B.S.; Sears, A.G.; Cox, T.S.; Paulsen, G.M. Desiccation tolerance and its relationship to assimilate partitioning in winter wheat. Crop Sci. 1990, 30, 622–627. [Google Scholar] [CrossRef]
- Fernandez, G.C.J. Effective selection criteria for assessing stress tolerance. In Adaptation of Food Crops to Temperature and Water Stress; Kuo, C.G., Ed.; Asian Vegetable Research and Development Center: Shanhua, Taiwan, 1992; pp. 257–270. [Google Scholar]
- Gavuzzi, P.; Rizza, F.; Palumbo, M.; Campaline, R.G.; Ricciardi, G.L.; Borghi, B. Evaluation of field and laboratory predictors of drought and heat tolerance in winter cereals. Can. J. Plant Sci. 1997, 77, 523–531. [Google Scholar] [CrossRef]
- Bouslama, M.; Schapaugh, W.T. Stress tolerance in soybean. Part. 1: Evaluation of three screening techniques for heat and drought tolerance. Crop Sci. 1984, 24, 933–937. [Google Scholar] [CrossRef]
- Lee, S.; Mbwambo, Z.; Chung, H.; Luyengi, L.; Gamez, E.; Mehta, R.; Kinghorn, A.; Pezzuto, J. Evaluation of the antioxidant potential of natural products. Comb. Chem. High Throughput Screen. 1998, 1, 35–46. [Google Scholar] [CrossRef] [PubMed]
- Hagerman, A.; Harvey-Mueller, I.; Makkar, H.P.S. Quantification of Tannins in Tree Foliage—A Laboratory Manual; FAO/IAEA: Vienna, Austria, 2000; pp. 1–26. [Google Scholar]
- Republic Hydrometeorological Institute of Serbia. Available online: http://www.hidmet.gov.rs/ (accessed on 15 July 2021).
- IBM SPSS Statistics, Trial Version 22.0. Available online: https://www.ibm.com/ (accessed on 31 January 2021).
- Zobel, R.W.; Wright, M.J.; Gauch, H.G. Statistical analysis of a yield trial. Agron. J. 1988, 80, 388–393. [Google Scholar] [CrossRef]
- GenStat, Trial Version 18.1.0.17005. Available online: https://www.vsni.co.uk/ (accessed on 17 February 2021).
- R Project for Statistical Computing, Version 4.2.0 (2022-04-22 ucrt); R Foundation for Statistical Computing: Vienna, Austria, 2022. Available online: https://www.R-project.org/ (accessed on 18 May 2022).
- Genc, Y.; Taylor, J.; Lyons, G.H.; Li, Y.; Cheong, J.; Appelbee, M.; Oldach, K.; Sutton, T. Bread wheat with high salinity and sodicity tolerance. Front. Plant Sci. 2019, 10, 1280. [Google Scholar] [CrossRef] [Green Version]
- Gharib, M.; Qabil, N.; Salem, A.; Ali, M.; Awaad, H.; Mansour, E. Characterization of wheat landraces and commercial cultivars based on morpho-phenological and agronomic traits. Cereal Res. Commun. 2020, 49, 149–159. [Google Scholar] [CrossRef]
- Dimitrijević, M.; Petrović, S.; Banjac, B. Wheat breeding in abiotic stress conditions of solonetz. Genetika 2012, 44, 91–100. [Google Scholar] [CrossRef]
- Kalhoro, N.A.; Rajpar, I.; Kalhoro, S.A.; Ali, A.; Raza, S.; Ahmed, M.; Kalhoto, F.A.; Ramazan, M.; Wahid, F. Effect of salts stress on the growth and yield of wheat. Am. J. Plant Sci. 2016, 7, 2257–2271. [Google Scholar] [CrossRef] [Green Version]
- Otu, H.; Celiktas, V.; Duzenli, S.; Hossain, A.; El Sabagh, A. Germination and early seedling growth of five durum wheat cultivars (Triticum durum Desf.) is affected by different levels of salinity. Fresenius Environ. Bull. 2018, 27, 7746–7757. [Google Scholar]
- Nassar, R.; Kamel, H.A.; Ghoniem, A.E.; Alacon, J.J.; Sekara, A.; Ulrich, C.; Abdelhamid, M.T. Physiological and anatomical mechanisms in wheat to cope with salt stress induced by seawater. Plants 2020, 9, 237. [Google Scholar] [CrossRef] [Green Version]
- Mladenov, N.; Hristov, N.; Malešević, M.; Mladenović, G.; Kovačević, N. Dragana: New winter wheat cultivar. Zb. Inst. Ratar. I Povrt. 2001, 45, 5–14. [Google Scholar]
- Dadshani, S.; Sharma, R.C.; Baum, M.; Ogbonnaya, F.C.; Léon, J.; Ballvora, A. Multi-dimensional evaluation of response to salt stress in wheat. PLoS ONE 2019, 14, e0222659. [Google Scholar] [CrossRef] [PubMed]
- Hammam, K.A.; Negim, O. Evaluation of wheat genotypes and some soil properties under saline water irrigation. Ann. Agric. Sci. 2014, 59, 165–176. [Google Scholar] [CrossRef] [Green Version]
- Singh, S.; Sengar, R.S.; Kulshreshtha, N.; Datta, D.; Tomar, R.S.; Rao, V.P.; Garg, D.; Ojha, A. Assessment of multiple tolerance indices for salinity stress in bread wheat (Triticum aestivum L.). J. Agric. Sci. 2015, 7, 49–57. [Google Scholar] [CrossRef]
- El-Sayed, M.D.; Abdel-Rahman, M.M. Improving the salinity tolerance in wheat plants using salicylic and ascorbic acids. J. Agric. Sci. 2015, 7, 203–217. [Google Scholar]
- Kaur, G.; Asthir, B.; Bains, N.S. Modulation of proline metabolism under drought and salt stress conditions in wheat seedlings. Indian J. Biochem. Biop. 2018, 55, 114–124. [Google Scholar]
- Sadak, M.S.; Talaat, I.M. Attenuation of negative effects of saline stress in wheat plant by chitosan and calcium carbonate. Bull. Natl. Res. Cent. 2021, 45, 136. [Google Scholar] [CrossRef]
- Turki, N.; Harrabi, M.; Kazutoshi, O. Effect of salinity on grain yield and quality of wheat and genetic relationships among durum and common wheat. J. Arid Land Stud. 2012, 22, 311–314. [Google Scholar]
- Dugasa, T.; Bebie, B.; Tomer, R.; Barnabas, J. Efect of seed priming on salt tolerance of bread wheat (Triticum aestivum L.) varieties. J. Sci. Islamic Repub. Iran 2016, 6, 139–153. [Google Scholar]
- Hussain, N.; Ghafar, A.; Zafar, Z.U.; Javed, M.; Hussain Shah, K.; Noreen, S.; Manzoor, H.; Iqbal, M.; Zaky Hassan, F.; Bano, H.; et al. Identifcation of novel source of salt tolerance in local bread wheat germplasm using morpho-physiological and biochemical attributes. Sci. Rep. 2021, 11, 10854. [Google Scholar] [CrossRef]
Publisher’s Note: MDPI stays neutral with regard to jurisdictional claims in published maps and institutional affiliations. |
© 2022 by the authors. Licensee MDPI, Basel, Switzerland. This article is an open access article distributed under the terms and conditions of the Creative Commons Attribution (CC BY) license (https://creativecommons.org/licenses/by/4.0/).