Abstract
Thermoluminescence characteristics of natural rhyolite have been studied. Dose response at a wide dose range of 0.5–2000 Gy has been determined. Minimum detectable dose and thermal fading rate are evaluated. Glow curve deconvolution is conducted after determining the best read-out conditions. The repeated initial rise (RIR) method is used to detect the overlapping peaks, and a glow curve deconvolution procedure is used to extract the thermoluminescence parameters of rhyolite. According to the findings, rhyolite glow curves show five interfering peaks corresponding to five electron trap levels at 142, 176, 221, 298, and 355 °C, respectively, at a heating rate of 3 °C/s. The obtained kinetic order for the deconvoluted peaks showed mixed-order kinetic. The reported results might be useful to introduce rhyolite as a natural sustainable material for radiation dosimetry applications.
1. Introduction
Thermoluminescence dosimetry (TLD) is a proper method for assessing ionizing radiation dosage. TLD materials come in a broad range of physical shapes, allowing for evaluating various radiation characteristics at dosage levels ranging from micro to kilo Gray. The tiny physical size of TL dosimeters and the point that no cables or additional equipment are required during dose measurement are significant benefits. As a result, they are well-suited to many dosimetric applications [1,2,3].
Sustainable materials are those that can be obtained in enough amounts without exhausting the non-renewable resources or altering the environment natural resources.
These materials can range from bio-based polymers derived from polysaccharides to highly recyclable materials, such as glass, which can be reused indefinitely without the need for additional mineral resources. Recyclable materials, such as waste composites, are used in many industrial applications, such as in stabilization and solidification of radioactive waste [4]. Reuse of cement kiln dust and polystyrene waste could contribute to environmental protection [5]. Cement can be used as a shielding material with modification by using various additives, such as cellulosic waste [6,7], bitumen [8,9], glass [10], polymers [4,11,12], nanomaterials [13,14], and cement wastes [5,15].
Natural minerals are used for a large variety of purposes in modern science and technology, which enhances human life. Quartz is a typical natural mineral with several benefits in a variety of TL dosimetry applications, such as for determining a substance’s radiological history [16,17], monitoring of nuclear accidence [18], and food irradiation control [19]. Thermoluminescence characteristics of gamma irradiated sandstone showed that its linear dose-response covers the range of 1–50 Gy followed by sub-linearity at a high dose level [20]. Based on radiation induced free radicals, Egyptian limestone was used as an effective and low-cost electron paramagnetic resonance (EPR) gamma dosimeter [21]. Thermoluminescence characteristics of sedimentary natural calcite in Gebel El Galala, Egypt, revealed an average TL sensitivity of 322.356 Gy−1 mg−1 with minimum detectable dosage of 976.221 µGy and a wide range of linearity, from 1.1 to 330 Gy in response to beta particle irradiation [22]. For the sake of retrospective dosimetry, thermoluminescence properties of natural tuff were investigated in the dose range 0.5–5 Gy, where linear dose-response is obtained [23].
Rhyolite is an igneous rock that extrudes and has a high silica content. It is generally pink or grey in appearance, with tiny grains that are difficult to notice without a hand lens. Rhyolite is made up of quartz, plagioclase, and sanidine, with some hornblende and biotite thrown in [24]. Thermoluminescence emission of rhyolite was recently studied without in-depth investigation of the its full dosimetric properties and kinetic parameters involved [25].
A thorough understanding of the kinetic parameters is required for reliable research of thermoluminescent materials for usage in diverse nuclear applications.
The kinetic parameters, on the other hand, are a crucial aspect in describing the physical characteristics of TL materials. This may be done by looking at the thermoluminescence curve of the TL materials after they have been exposed to ionizing radiation. When electrons are liberated from the traps during heating, they recombine with trapped holes, causing light to be emitted. A collection of glow peaks is formed based on the amount of trapping bands in the material, which serves as a fingerprint for each substance. The kind of incident radiation and its energy, as well as the geological origin of minerals, chemical forms, kinds of impurities, and flaws, all influence the glow peaks [26].
The current study aims to investigate the capability of using rhyolite as a natural thermoluminescent dosimeter material. Thermoluminescence characterization, as well as its structural and compositional analysis, will also be investigated.
2. Material and Methods
Rhyolite rock was obtained from the Makkah area, Kingdom of Saudi Arabia, around 190 km southeast of Taif, in the mountainous region, at 20.64° N longitude and 42.12° E latitude. This rock sample was crushed into 100 µm granules and then washed with distilled water to remove organic contaminants. Magnetic separation was used to remove magnetic particles from the sample after it was dried. The powder was annealed at 400 °C in a muffle furnace for 2 h to eliminate any past radiation exposure, then quickly cooled to room temperature.
At room temperature, a Bruker S8 TIGER XRF spectrometer was used to identify the elemental composition of rhyolite samples while a Rigaku Ultima 4 XRD was used for crystallographic phase identification. An Optica FT-IR Spectrometer was used to measure Fourier transformation infra-red (FTIR) absorption spectra of prepared samples in the spectral range 400–4000 cm−1. According to a qualitative XRF examination of the natural rhyolite sample, silicon was the predominant ingredient (53%), with lesser amounts of aluminum (15.8%), potassium (15.2%), calcium (2.5%), and a variety of other elements as impurities.
For the sake of shaping and forming small rigid disks, 25 mg average weight suitable for the TLD reader samples are compressed at 3 tons using a hydraulic press. The obtained small rhyolite disks of 2 mm diameter and 1 mm thickness are shown in Figure 1.
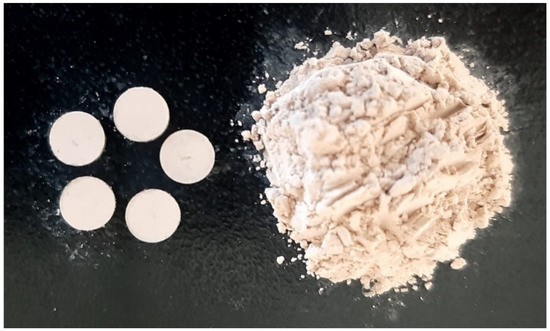
Figure 1.
Rhyolite compressed disks at 3 tons.
A Harshaw TL-reader model 3500 (Harshaw, WI, USA) was used for the thermoluminescence measurements. The temperature range for the recorded TL glow curves was 50–400 °C, with the heating rate of 3–25 °C/s.
The 60Co irradiation source (GC220), factory-made by the Canadian Atomic Energy Authority, was utilized to gamma irradiate the samples at 0.3 Gy/s. The source is provided by the Egyptian National Center for Radiation Research and Technology.
3. Results and Discussions
3.1. Structural Analysis (XRD and FTIR)
The X-ray diffraction pattern (XRD) for natural rhyolite is shown in Figure 2. Crystallographic phase identification and line profile analysis were performed using the Maud computer program by Luca Lutterotti [27]. Sodium aluminum silicate (42.193 ± 0 wt. %), potassium aluminum silicate (32.826 ± 1.079 wt. %) and silicon oxide (24.982 ± 0.671 wt. %) are three identified phases corresponding to three minerals: albite—low, microcline—intermediate, and quartz—low, respectively. The obtained peaks are matched to the assigned peaks regarding the forementioned three phases, which were obtained from the crystal structure database of the American Mineralogist [28,29,30].
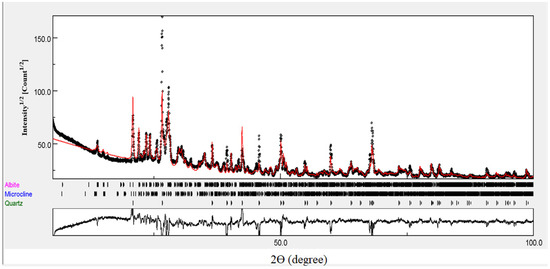
Figure 2.
The x-ray diffraction pattern (XRD) for natural rhyolite.
The line profile fitting estimates that the sodium aluminum silicate phase has triclinic structure with crystallite size of 73 nm and the lattice parameters, a, b, c, α, β, and γ of 8.14, 12.79, 7.16 Å, 94.26, 116.62, and 87.80°, respectively. The potassium aluminum silicate phase also has triclinic structure with crystallite size of 73 nm and the lattice parameters, a, b, c, α, β, and γ to be 8.60, 13.00, 7.20 Å, 89.98, 115.93, and 89.43°, respectively. Silicon oxide phase has trigonal structure with crystallite size of 73 nm and the lattice parameters, a and b of 4.92 and 5.41 Å, respectively.
Figure 3 shows the FTIR transmission spectrum of the natural rhyolite under investigation. The observed absorption peak at 3435.91 cm−1 can be attributed to the OH group’s stretching and bending vibrations [31,32], while the those observed at 1093 cm−1 and 661 cm−1 are attributed to the stretching and bending vibrations of the Si-O in quartz, respectively. The most intense bands recorded at around 1100 cm−1 and 460 cm−1, are associated with the asymmetric stretching vibrations Si-O(Si) and bending vibrations O-Si-O present in silicate tetrahedra, respectively. The doublet 800–780 cm−1 is related to the symmetric stretching vibrations of Si-O-Si bridges [33]. This doublet is found in low-temperature quartz and is utilized as the analytical band for determining the phase’s quantitative properties [34]. The Al-O-Si vibration in aluminum silicate is shown by the absorption band at 1384.16 cm−1 [35].
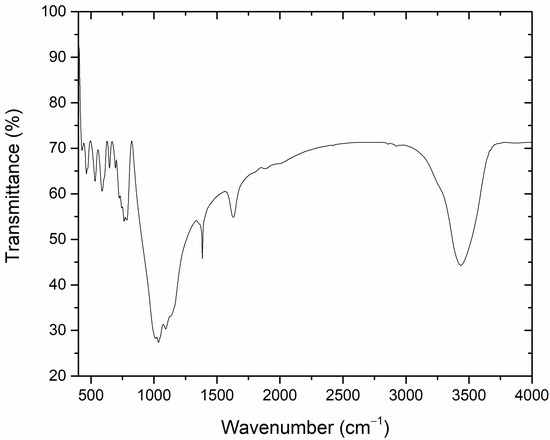
Figure 3.
The FTIR transmission spectrum of the investigated natural rhyolite.
Metal cation vibrations, such as Na+ and Al+, are responsible for the bands detected at 588.41, 532.27, 463.94, and 428.08 cm−1 [36,37,38]. These findings are matched with those obtained with XRD study.
3.2. Glow Curves
The recorded glow curves of 50 Gy gamma irradiated natural rhyolite disks at 3 °C/s heating rate display one intensified TL peak around 135 °C, as shown in Figure 4.
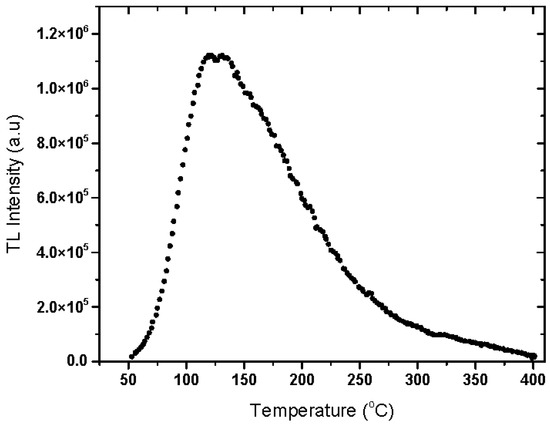
Figure 4.
Thermoluminescence glow curve of 50 Gy gamma irradiated natural rhyolite disk heated at 3 °C/s heating rate.
The dosimetric properties, such as the effect of heating rate, dose-response, minimum detectable dose, reproducibility of the obtained response, and thermal fading, will be studied as follows.
3.3. The Effect of Heating Rate
The impact of various heating rates on natural rhyolite disks irradiated with 50 Gy gamma radiation is shown in Figure 5. The acquired findings verified that as the heating rate was increased, the dosimetric peak was pushed to a higher temperature.
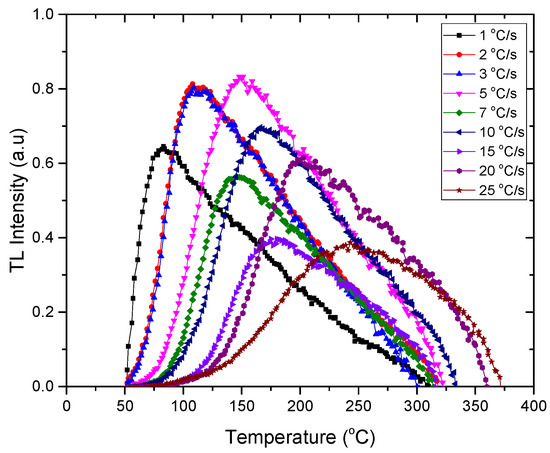
Figure 5.
The effect of heating rate on the thermoluminescence glow curve of 50 Gy gamma irradiated natural rhyolite.
Due to increased interfering of sub-peaks at higher heating rates, the width of all dosimetric peaks at its half maximum increases [39]. This is due to a temperature discrepancy between the TL reading tray (planchet) and the sample’s real recorded temperature at high heating rates. As a result, the peak seems to be at a greater temperature than it actually is. Slow heating rates, on the other hand, do not cause this because heat is more homogenously distributed in the sample, as a result of which there is no change in the peak temperature [40]. Figure 6 shows the results of TL response at various heating rates from 1 to 25 °C/s, where the maximum value was recorded at the 3 °C/s heating rate.
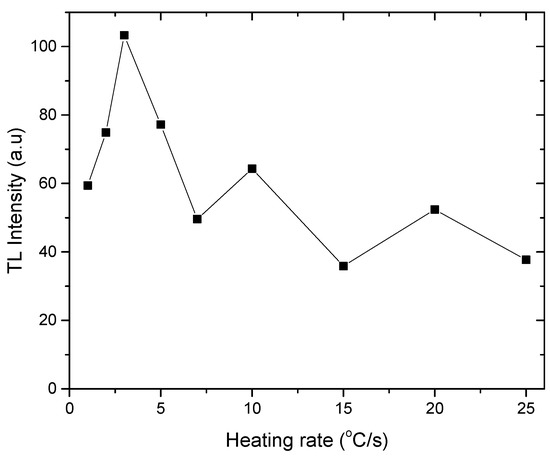
Figure 6.
Gamma dose response of natural rhyolite at various heating rates.
3.4. Dose Response
As shown in Figure 7, the variation of the induced TL with gamma dose over the range 1–20 Gy displays a linear fitting (R2 = 0.999) described by the formula I = (1.011 ± 0.026) D; followed by a supralinearity behavior up to 2000 Gy described by the formula I = (202.35 ± 20.98) D1.28±0.02, where I refers to the intensity of the TL signal and D is the irradiation dose. The strong value of R2 suggested that the studied material possesses a homogeneous delivery of deep electron traps, providing a linear dose-response across the irradiation dosage range studied. The following formula can be used to compute the linearity index f(D) at a given dosage D [41]:
where S0, S(D), D1, and S(D1) denote the TL response at zero dose, S(D), dosage in the linear area; and S(D1) denotes the TL response corresponding to dose D1; respectively. The value of f(D) equals one for linear behavior, higher than 1 for supralinearity, and lower than 1 for sublinearity.
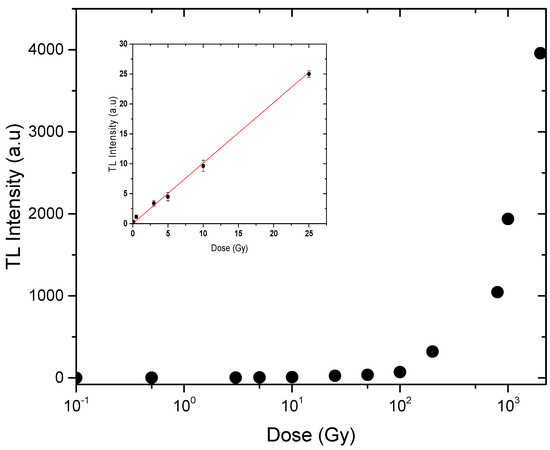
Figure 7.
Dose response of natural rhyolite disks in the range of 0.5–2000 Gy.
The calculated f(D) versus irradiation dose from 0.5 to 2000 Gy confirmed the linear-supralinearity criteria within this range because f(D) equals approximately one for the range of 0.5–25 Gy, while supralinearity behavior for the residual dose range up to 2 kGy where the values of f(D) are greater than unity are shown in Figure 8.
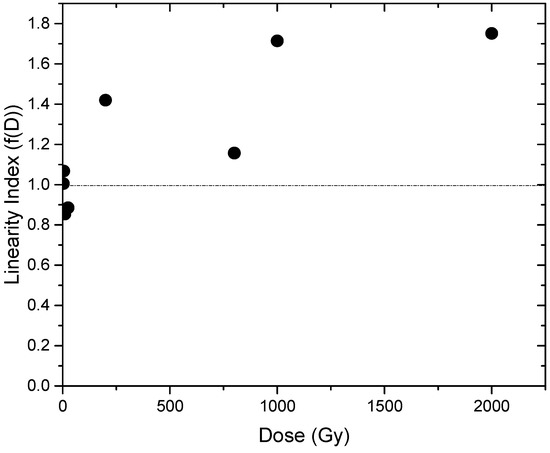
Figure 8.
Linearity index of rhyolite at dose range 0.5–2000 Gy.
The unified interaction model has been used extensively to model the behavior of f(D). Many experimental measurements have also shown that as the glow peak temperature rises, the supralinearity of the various glow peaks rises. This can be explained based on the increased charge carrier migration distances during the recombination (heating) stage resulting in increased effects of track interaction and, in turn, increased luminescence recombination efficiency [42,43].
3.5. Thermal Fading
The TL-response of Dosimeters is affected by a variety of environmental conditions. The temperature of the surrounding medium is maybe the most critical. After irradiation, heat can liberate electrons from its traps, a process known as thermal fading. The trapping parameters affecting this process are the frequency factor (s) and activation energy (E) [44]. Figure 9 shows the thermal fading behavior of 50 Gy gamma irradiated rhyolite disks during a 28-day period. These samples were annealed before the irradiation process and stored at room temperature (20–25 °C) with a humidity of 40–50%.
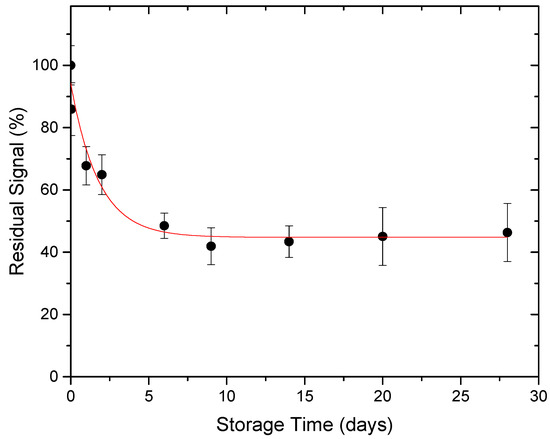
Figure 9.
Thermal fading of 50 Gy gamma irradiated natural rhyolite.
After 24 h, 52 h, one week, and two weeks, the results showed a 32 percent decrease, 52 percent reduction, and 57 percent reduction. During the remaining research time of two weeks, no additional thermal fading was noticed. In the case where the TL readout is delayed, these data will aid in estimating the precise absorbed dosages.
3.6. Reproducibility
Another key criterion in determining reusability of the recommended TL material is its reproducibility for dosimetry applications. The average TL intensity of a collection of annealed rhyolite disks was measured after numerous cycles of 50 Gy gamma irradiation. Based on a standard deviation of six measurements, the obtained data in Figure 10 show that the rhyolite dosimeter has acceptable reusability, with roughly 4% variance in successive measurements.
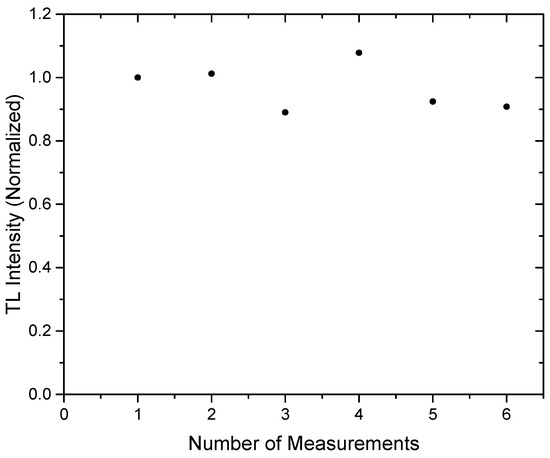
Figure 10.
Reproducibility use of natural rhyolite for dosimetry applications.
3.7. Minimum Detectable Dose (MDD)
By using the dose calibration factor (F), the average background reading (), and its standard deviation (), the following formula provided by Furetta et al. can be used to compute the rhyolite disks’ minimal detectable dose (MDD) (2000) [45].
Rhyolite has dose calibration factor F = 0.98 (0.75) Gy g nC−1, the average background signal B* = 0.40 nC g−1, and its standard deviation = 0.06 nC g−1. The calculated values of the MDD based on the above equation are about 0.5 Gy. Thus, natural rhyolite can measure low gamma doses up to 0.5 Gy.
3.8. Kinetic Parameters Determination
3.8.1. Repeated Initial Rise (RIR) Method
This method was developed by Garlick and Gibson in 1948 and is wildly used for determining the activation energy (E) [46]. The RIR method is based on the fact that at low temperatures, where TL intensities are less than 10–15% of the maximum intensity corresponding to a specific cut-off temperature, the change in charge carrier concentration in the traps is minimal and independent of the kinetic parameters [47]. The TL-intensity I(T) can be formulated as:
The plot of ln (I) against 1/kT where k is the Boltzmann constant, gives a straight line where the activation energy (E) can be determined from the slope. This approach may recur with various stopping temperatures Tstop to acquire a large number of activation energies, and then the number of peaks in the glow curve can be determined if there are many peaks. The irradiation sample was heated at a continuous pace until it reached a certain cut-off temperature Tstop, at which point a thermoluminescence decay was recorded. Several heating and cooling cycles have produced a set of data I(T) spanning the temperature range of 333–673 K.
For a section of the data acquired at stopping temperatures of 100, 110, 130, 140, and 150 °C, Figure 11 depicts the relationship between ln (I) vs. 1/kT. The activation energy value is anticipated by the slope for each stopping temperature. The graph of the acquired values of the activation energy E vs. Tstop is shown in Figure 12. The obtained results displayed that the activation energies are nearly similar in five places (plateau region), indicating that the glow curve has five overlapping peaks with average activation energies of 0.77 ± 0.01, 0.86 ± 0.01, 1.01 ± 0.01, 0.99 ± 0.00, and 1.78 ± 0.01 eV, respectively.
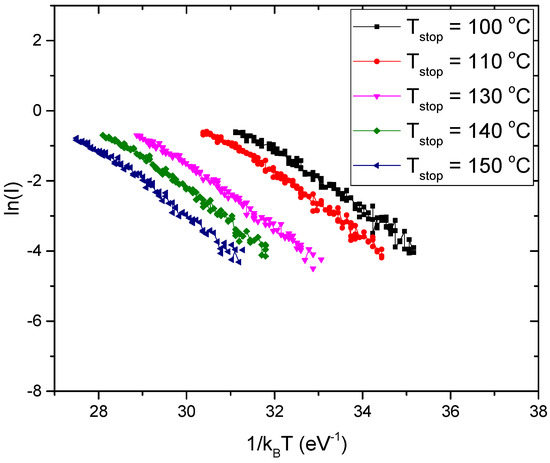
Figure 11.
Initial raise plots of natural rhyolite sample at some values of Tstop.
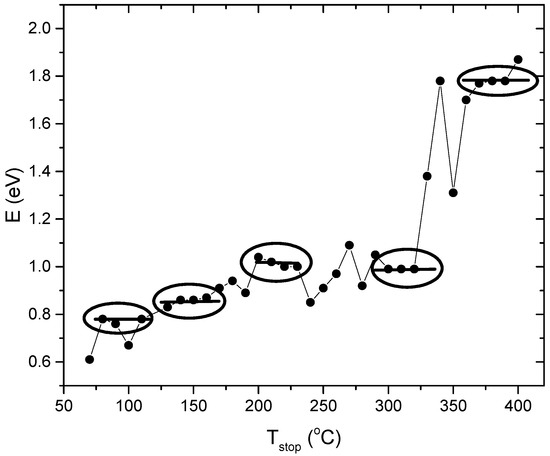
Figure 12.
The activation energies (E) of natural rhyolite given by the RIR method.
3.8.2. Computerized Glow Curve Deconvolution (CGCD) Method
The glow curves of natural rhyolite have been deconvoluted into five interfering peaks using the general order kinetics equation given by Kitis et al. [48].
where I is the glow-peak intensity, s (s−1) is the frequency factor, E (eV) is the activation energy, n0 is the initial concentration of trapped carriers, T (K) is the absolute temperature, k (eV K−1) is the Boltzmann constant, Δ = 2 kT/E, and β is the heating rate. The deconvolution process was carried out using the Korean atomic energy institute’s TL-ANAL tool [49]. As initial approximations, the number of peaks (five) and the corresponding values of their activation energies (obtained by the RIR method) were entered into the algorithm. The calculated value of the figure of merit (FOM) for all TL glow peaks determines the accuracy of the study [50]. The fit is satisfactory if the FOM values are between 0.0 and 2.5 percent, 2.5 and 3.5 percent is minor fit, and >3.5% is bad fit.
Figure 13 shows the glow curve deconvolution of a natural rhyolite sample irradiated with 50 Gy and recorded at a 3 °C/s heating rate. The glow curve deconvolution findings are summarized in Table 1. The computed standard deviation of the mean owing to many measurements or fitting peaks during the deconvolution process is incorporated in the considered activation energy data, which is the uncertainty type A. The acquired findings indicated that the glow curve of rhyolite material has five overlapping peaks created at 142, 176, 221, 298, and 355 °C, respectively, at a heating rate of 3 °C/s, and that the activation energies are compatible with the RIR method’s results. The obtained kinetic order for the deconvoluted peaks showed mixed-order kinetic.
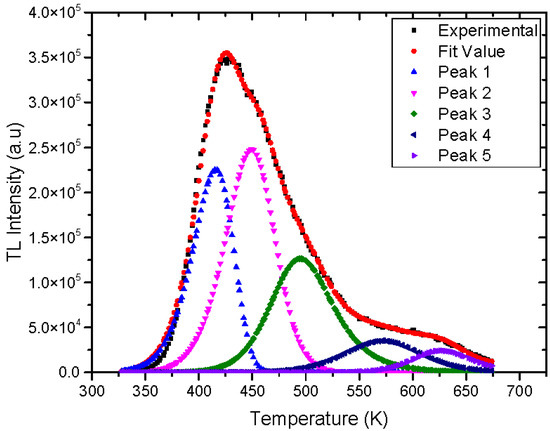
Figure 13.
Glow curve deconvolution of natural rhyolite at 3 °C/s heating rate and irradiated by 50 Gy.

Table 1.
The kinetic parameters for natural rhyolite.
4. Conclusions
In this paper, natural rhyolite material is shaped into small disks to be used as a thermoluminescence dosimeter. Chemical composition and crystal structure of its composite phases showed that sodium aluminum silicate (42.193 ± 0 wt. %), potassium aluminum silicate (32.826 ± 1.079 wt. %), and silicon oxide (24.982 ± 0.671 wt. %) are the three identified phases of rhyolite composition. Linear dose response up to 25 Gy followed by supralinearity up to 2000 Gy are obtained. The obtained TL characteristics of rhyolite showed that this material has linear dose response up to 25 Gy, followed by supralinearity up to 2000 Gy, as well as relatively high fading rate of 57% after two weeks with no more thermal fading noted. Low detection limit of roughly 0.5 Gy and reasonable repeatability of about 4% variation in successive measurements are noted. These characteristics may qualify rhyolite as the sustainable natural material used in this study for a variety of applications involved radiation dose assessment.
Author Contributions
E.S.: methodology, validation, data curation, writing—original draft, writing—review and editing. D.A.A.: conceptualization, methodology, resources. S.A.E.-K.: methodology, writing—original draft. M.M.: methodology. All authors have read and agreed to the published version of the manuscript.
Funding
This research was funded by Princess Nourah bint Abdulrahman University, Riyadh, Saudi Arabia, Researchers Supporting Project number [PNURSP2022R57].
Institutional Review Board Statement
Not applicable.
Informed Consent Statement
Not applicable.
Data Availability Statement
Not applicable.
Acknowledgments
The authors express their gratitude to Princess Nourah bint Abdulrahman University Researchers Supporting Project number (PNURSP2022R57), Princess Nourah bint Abdulrahman University, Riyadh, Saudi Arabia.
Conflicts of Interest
The authors declare no conflict of interest.
References
- Kron, T. Thermoluminescence dosimetry and its applications in medicine-Part 1: Physics, materials and equipment. Australas. Phys. Eng. Sci. Med. 1994, 17, 175–199. [Google Scholar] [PubMed]
- Moscovitch, M.; John, T.J.; Cassata, J.R.; Blake, P.K.; Rotunda, J.E.; Ramlo, M.; Velbeck, K.J.; Luo, L.Z. The application of LiF:Mg,Cu,P to large scale personnel dosimetry: Current status and future directions. Radiat. Prot. Dosim. 2006, 119, 248–254. [Google Scholar] [CrossRef]
- Chand, S.; Mehra, R.; Chopra, V. Recent developments in phosphate materials for their thermoluminescence dosimeter (TLD) applications. Luminescence 2021, 36, 1808–1817. [Google Scholar] [CrossRef]
- Saleh, H.M.; Salman, A.A.; Faheim, A.A.; El-Sayed, A.M. Polymer and polymer waste composites in nuclear and industrial applications. J. Nucl. Energy Sci. Power Gener. Technol. 2020, 9, 1000199. [Google Scholar]
- Saleh, H.M.; Salman, A.A.; Faheim, A.A.; El-Sayed, A.M. Sustainable composite of improved lightweight concrete from cement kiln dust with grated poly (styrene). J. Clean. Prod. 2020, 277, 123491. [Google Scholar] [CrossRef]
- Dawoud, M.M.A.; Hegazi, M.M.; Saleh, H.M.; El Helew, W.K. Removal of stable and radio isotopes from wastewater by using modified microcrystalline cellulose based on Taguchi L16. Int. J. Environ. Sci. Technol. 2022, 1–12. [Google Scholar] [CrossRef]
- Dawoud, M.M.A.; Hegazy, M.M.; Helew, W.K.; Saleh, H.M. Overview of Environmental Pollution and Clean Management of Heavy Metals and Radionuclides by using Microcrystalline Cellulose. J. Nucl. Ene. Sci. Power Gener. Technol. 2021, 3, 2. [Google Scholar]
- Saleh, H.M.; Bondouk, I.I.; Salama, E.; Esawii, H.A. Consistency and shielding efficiency of cement-bitumen composite for use as gamma-radiation shielding material. Prog. Nucl. Energy 2021, 137, 103764. [Google Scholar] [CrossRef]
- Reda, S.M.; Saleh, H.M. Calculation of the gamma radiation shielding efficiency of cement-bitumen portable container using MCNPX code. Prog. Nucl. Energy 2021, 142, 104012. [Google Scholar] [CrossRef]
- Eid, M.S.; Bondouk, I.I.; Saleh, H.M.; Omar, K.M.; Sayyed, M.I.; El-Khatib, A.M.; Elsafi, M. Implementation of waste silicate glass into composition of ordinary cement for radiation shielding applications. Nucl. Eng. Technol. 2021, 54, 1456–1463. [Google Scholar] [CrossRef]
- Eskander, S.B.; Saleh, H.M.; Tawfik, M.E.; Bayoumi, T.A. Towards potential applications of cement-polymer composites based on recycled polystyrene foam wastes on construction fields: Impact of exposure to water ecologies. Case Stud. Constr. Mater. 2021, 15, e00664. [Google Scholar] [CrossRef]
- Saleh, H.M.; Eskander, S.B. Impact of water flooding on hard cement-recycled polystyrene composite immobilizing radioactive sulfate waste simulate. Constr. Build. Mater. 2019, 222, 522–530. [Google Scholar] [CrossRef]
- Saleh, H.M.; El-Saied, F.A.; Salaheldin, T.A.; Hezo, A.A. Influence of severe climatic variability on the structural, mechanical and chemical stability of cement kiln dust-slag-nanosilica composite used for radwaste solidification. Constr. Build. Mater. 2019, 218, 556–567. [Google Scholar] [CrossRef]
- Saleh, H.M.; El-Sheikh, S.M.; Elshereafy, E.E.; Essa, A.K. Performance of cement-slag-titanate nanofibers composite immobilized radioactive waste solution through frost and flooding events. Constr. Build. Mater. 2019, 223, 221–232. [Google Scholar] [CrossRef]
- Saleh, H.M.; Salman, A.A.; Faheim, A.A.; El-Sayed, A.M. Influence of aggressive environmental impacts on clean, lightweight bricks made from cement kiln dust and grated polystyrene. Case Stud. Constr. Mater. 2021, 15, e00759. [Google Scholar] [CrossRef]
- Preusser, F.; Chithambo, M.L.; Götte, T.; Martini, M.; Ramseyer, K.; Sendezera, E.J.; Susino, G.J.; Wintle, A.G. Quartz as a natural luminescence dosimeter. Earth Sci. Rev. 2009, 97, 184–214. [Google Scholar] [CrossRef]
- Thamóné Bozsó, E.; Füri, J.; Kovács István, J.; Biró, T.; Király, E.; Nagy, A.; Törökné Sinka, M.; Kónya, P.; Mészárosné Turi, J.; Vígh, C. Characteristics of quartz separates of different formations in Hungary from the aspect of osl dating. Foldt. Kozlony 2020, 150, 61. [Google Scholar] [CrossRef][Green Version]
- Bailiff, I.K.; Stepanenko, V.F.; Göksu, H.Y.; Bøtter-Jensen, L.; Brodski, L.; Chumak, V.; Correcher, V.; Delgado, A.; Golikov, V.; Jungner, H.; et al. Comparison of retrospective luminescence dosimetry with computational modeling in two highly contaminated settlements downwind of the chernobyl NPP. Health Phys. 2004, 86, 25–41. [Google Scholar] [CrossRef]
- Beneitez, P.; Correcher, V.; Millán, A.; Calderón, T. Thermoluminescence analysis for testing the irradiation of spices. J. Radioanal. Nucl. Chem. Artic. 1994, 185, 401–410. [Google Scholar] [CrossRef]
- Soliman, C.; Salama, E. Investigation on the suitability of natural sandstone as a gamma dosimeter. Nucl. Instrum. Methods Phys. Res. Sect. B Beam Interact. Mater. At. 2009, 267, 3323–3327. [Google Scholar] [CrossRef]
- Salama, E. Egyptian limestone for gamma dosimetry: An electron paramagnetic resonance study. Radiat. Eff. Defects Solids 2014, 169, 325–333. [Google Scholar] [CrossRef]
- El-Faramawy, N.; Alazab, H.A.; Gad, A.; Sabry, M. Study of the thermoluminescence kinetic parameters of a β-irradiated natural calcite. Radiat. Phys. Chem. 2022, 190, 109793. [Google Scholar] [CrossRef]
- Almuqrin, A.; Soliman, C.; ELShokrof, K.; Aloraini, D. Tuff rock as a new thermoluminescent material for gamma dosimetry. Asian J. Sci. Res. 2018, 11, 126–133. [Google Scholar] [CrossRef]
- DeMouthe, J.F. Natural materials: Sources, properties, and uses. Rocks Miner. 2006, 81, 3972006. [Google Scholar]
- Aloraini, D.A. Sensitization of natural rhyolite rock using high gamma doses for thermoluminescence dosimetry. Luminescence 2020, 35, 1043–1047. [Google Scholar] [CrossRef]
- Azorín, J.; Furetta, C.; Scacco, A. Preparation and properties of thermoluminescent materials. Phys. Stat. Solidi 1993, 138, 9–46. [Google Scholar] [CrossRef]
- Lutterotti, L. Total pattern fitting for the combined size-strain-stress-texture determination in thin film diffraction. Nucl. Instrum. Methods Phys. Res. Sect. B Beam Interact. Mater. At. 2010, 268, 334–340. [Google Scholar] [CrossRef]
- Harlow, G.E. The anorthoclase structures: The effects of temperature and composition. Am. Mineral. 1982, 67, 975–996. [Google Scholar]
- Bailey, S.W. Refinement of an intermediate microcline structure. Am. Mineral. 1969, 54, 1540–1545. [Google Scholar]
- Levien, L.; Prewitt, C.T.; Weidner, D.J.; Prewir, C.T.; Weidner, D.J. Structure and Elastic Properties of Quartz at Pressure. Am. Mineral. 1980, 65, 920–930. [Google Scholar]
- El Makhloufy, S.; Tridane, M.; Majdi, E.M.; Marouani, H.; Zerraf, S.; Belhabra, M.; Cherqaoui, A.; Belaaouad, S. Chemical preparation, thermal behavior and infrared studies of the new cyclotriphosphate tetrahydrate of manganese and distrontium, MnSr2(P3O9)2.4H2O. Mediterr. J. Chem. 2019, 9, 280–289. [Google Scholar] [CrossRef]
- Liang, Y.; Ouyang, J.; Wang, H.; Wang, W.; Chui, P.; Sun, K. Synthesis and characterization of core-shell structured SiO2@YVO4 :Yb3+,Er3+ microspheres. Appl. Surf. Sci. 2012, 58, 3689–3694. [Google Scholar] [CrossRef]
- Mozgawa, W.; Król, M.; Dyczek, J.; Deja, J. Investigation of the coal fly ashes using IR spectroscopy. Spectrochim. Acta Part A Mol. Biomol. Spectrosc. 2014, 132, 889–894. [Google Scholar] [CrossRef]
- Moenke, H.H.W. Silica, the Three-dimensional Silicates, Borosilicates and Beryllium Silicates. In The Infrared Spectra of Minerals; Mineralogical Society of Great Britain and Ireland: Oxford, UK, 2015. [Google Scholar]
- Treto-Suárez, M.A.; Prieto-García, J.O.; Mollineda-Trujillo, Á.; Lamazares, E.; Hidalgo-Rosa, Y.; Mena-Ulecia, K. Kinetic study of removal heavy metal from aqueous solution using the synthetic aluminum silicate. Sci. Rep. 2020, 10, 10836. [Google Scholar] [CrossRef]
- Mandal, A.K.; Agrawal, D.; Sen, R. Preparation of homogeneous barium borosilicate glass using microwave energy. J. Non. Cryst. Solids 2013, 371, 41–46. [Google Scholar] [CrossRef]
- Study, S.; Consumption, L.E.; Part, D.U.; Utilization, D.; Yoshizawa, N.; Harimoto, K.; Ichihara, M.; Miki, Y.; Takase, K.; Inoue, T. Synthesis, Characterization and Bioactive Study of Borosilicate Sol-Gel Glass Khairy. Nat. Sci. 2015, 13, 475–476. [Google Scholar]
- Rada, S.; Dehelean, A.; Culea, E. FTIR and UV-VIS spectroscopy investigations on the structure of the europium-lead-tellurate glasses. J. Non. Cryst. Solids 2011, 357, 3070–3073. [Google Scholar] [CrossRef]
- Bos, A.J.J.; Vijverberg, R.N.M.; Piters, T.M.; McKeever, S.W.S. Effects of Cooling and Heating Rate on Trapping Parameters in LiF: Mg, Ti Crystals. J. Phys. D Appl. Phys. 1992, 25, 1249–1257. [Google Scholar] [CrossRef]
- Amer, H.A.; Elashmawy, M.M.; Alazab, H.A.; Ezz El-Din, M.R. Suitability of pure nano crystalline LiF as a TLD dosimeter for high dose gamma radiation. Nucl. Technol. Radiat. Prot. 2018, 33, 93–99. [Google Scholar] [CrossRef]
- Chen, R.; McKeever, S.W.S. Characterization of nonlinearities in the dose dependence of thermoluminescence. Radiat. Meas. 1994, 23, 667–673. [Google Scholar] [CrossRef]
- Horowitz, Y.S.; Oster, L.; Datz, H. The thermoluminescence dose-response and other characteristics of the high-temperature TL in LiF:Mg,Ti (TLD-100). Radiat. Prot. Dosim. 2007, 124, 191–205. [Google Scholar] [CrossRef]
- Attix, F.H. Further consideration of the track-interaction model for thermoluminescence in LiF(TLD-100). J. Appl. Phys. 1975, 46, 81–88. [Google Scholar] [CrossRef]
- Chen, R.; Pagonis, V.; Lawless, J.L. Evaluated thermoluminescence trapping parameters-What do they really mean? Radiat. Meas. 2016, 91, 21–27. [Google Scholar] [CrossRef]
- Furetta, C.; Prokic, M.; Salamon, R.; Prokic, V.; Kitis, G. Dosimetric characteristics of tissue equivalent thermoluminescent solid TL detectors based on lithium borate. Nucl. Instrum. Methods Phys. Res. Sect. A Accel. Spectrometers Detect. Assoc. Equip. 2001, 456, 411–417. [Google Scholar] [CrossRef]
- Jose, M.T.; Anishia, S.R.; Annalakshmi, O.; Ramasamy, V. Determination of thermoluminescence kinetic parameters of thulium doped lithium calcium borate. Radiat. Meas. 2011, 46, 1026–1032. [Google Scholar] [CrossRef]
- Garlick, G.F.J.; Gibson, A.F. The electron trap mechanism of luminescence in sulphide and silicate phosphors. Proc. Phys. Soc. 1948, 60, 574–590. [Google Scholar] [CrossRef]
- Kitis, G.; Gomez-Ros, J.M.; Tuyn, J.W.N. Thermoluminescence glow-curve deconvolution functions for first, second and general orders of kinetics. J. Phys. D. Appl. Phys. 1998, 31, 2636–2641. [Google Scholar] [CrossRef]
- Chung, K.S.; Choe, H.S.; Lee, J.I.; Kim, J.L.; Chang, S.Y. A computer program for the deconvolution of thermoluminescence glow curves. Radiat. Prot. Dosim. 2005, 115, 345–349. [Google Scholar] [CrossRef]
- Balian, H.G.; Eddy, N.W. Figure-of-merit (FOM), an improved criterion over the normalized chi-squared test for assessing goodness-of-fit of gamma-ray spectral peaks. Nucl. Instrum. Methods 1977, 145, 389–395. [Google Scholar] [CrossRef]
Publisher’s Note: MDPI stays neutral with regard to jurisdictional claims in published maps and institutional affiliations. |
© 2022 by the authors. Licensee MDPI, Basel, Switzerland. This article is an open access article distributed under the terms and conditions of the Creative Commons Attribution (CC BY) license (https://creativecommons.org/licenses/by/4.0/).