Article

An Evaluation Model for the Comfort of Vehicle Intelligent Cockpits Based on Passenger Experience

1
School of Automobile and Transportation, Xihua University, Chengdu 610039, China
2
School of Mechanical Engineering, Southwest Jiaotong University, Chengdu 610031, China
*
Author to whom correspondence should be addressed.
These authors contributed equally to this work.
Sustainability 2022, 14(11), 6827; https://doi.org/10.3390/su14116827
Submission received: 2 April 2022 / Revised: 30 May 2022 / Accepted: 30 May 2022 / Published: 2 June 2022
(This article belongs to the Special Issue Smart Transportation and Intelligent and Connected Driving)

Abstract

:
With the development of intelligence and network connectivity, the development of the automotive industry is also moving toward intelligent systems. For passengers, the utility of intelligence is to achieve more convenience and comfort. The intelligent cockpit is the place where passengers directly interact with the car, which directly affects the experience of passengers in the car. For the intelligent cockpits that have emerged in recent years, a reasonable and accurate comfort evaluation model is urgently needed. Therefore, in this article, from the passenger’s perspective, a subjective evaluation experiment was set up to collect data on four important indicators affecting the comfort of the intelligent cockpit: sound, light, heat, and human–computer interaction. The subjective evaluation weights were derived from a questionnaire, and the entropy weighting method was used to obtain the objective weights. Finally, the two weights were combined using the idea of game theory combination assignment to get the final accurate weights. Using the idea of penalty type substitution, the four index models were then synthesized to get the final evaluation model. The feasibility of the model was verified when measuring the car cockpit. The feasibility of the method means it can evaluate the comfort level of an intelligent cockpit more reasonably, facilitate the enhancement and improvement of the model, and promote the development of the model to achieve maximum passenger comfort.

1. Introduction

1.1. Background

With the gradual maturing of automated driving technology, various types of autonomous vehicles are being used more and more. The original intention of intelligent driving technology was to improve traffic efficiency and reduce accidents [1]. In recent years, the comfort of intelligent vehicles has become a standard for evaluating their quality and has been paid more and more attention [2]. When choosing an intelligent vehicle, safety and comfort are the first factors to be considered which directly affect the acceptance and purchase degree of consumers [3,4,5]. There is a close relationship between the comfort of intelligent vehicles and passengers’ trust and acceptance of them [6,7]. In other words, improving comfort contributes to the popularity of intelligent vehicles. The comfort of the vehicle includes driving comfort and riding comfort. Driving comfort mainly exists in manual driving scenarios. As the level of automated driving is further improved from the L3 level, the vehicle cockpit will become more intelligent [8]. The driving task will be automatically taken over by the vehicle, and the driver’s driving status will be transformed into that of a normal passenger. Therefore, the vehicle cockpit will become the third space for work, play, and social interaction [9]. The comfort evaluation of the vehicle’s intelligent cockpit will also be transformed into the comfort evaluation of passengers. With the application of intelligent driving technology and the transformation of the driver’s identity, the interior of the vehicle cockpit will be redesigned, and comfort research based on the passengers’ riding experience will be particularly important [10]. Therefore, it is necessary to establish intelligent vehicle comfort evaluation standards and models.

1.2. Research Status

1.2.1. Passenger Comfort

The research on vehicle comfort has a long history, but there is no unified and clear definition of comfort in academia. Comfort is considered a state of relaxation, pleasure, and subjective feeling, according to The Merriam-Webster Dictionary. Richards pointed out that comfort is a subjective state in which people respond to the environment or a situation [11]. Slater defines comfort as a state of physical, psychological, and physiological harmony between a person and the environment [12].
The debate around comfort has largely centered on the understanding of the difference between comfort and discomfort. Overall, there are two interpretations of comfort. One view holds that comfort is two discrete states: comfort and discomfort. Typically, comfort is defined as the absence of discomfort [13]. Branton also considered comfort to be a state of lack of negativity that does not necessarily indicate positivity [14]. Summala also noted that comfort is pleasant and not experienced in the face of high arousal [15]. From this point of view, as long as the passengers in the vehicle do not feel uncomfortable, it can be considered comfortable. Therefore, passengers in a comfortable state may ignore the fact that they are in a car [16]. Another view of comfort argues that comfort and discomfort are not one-dimensional assumptions on the same continuous scale. Multiple studies have shown that comfort and discomfort are affected by different variables; therefore, Zhang et al. pointed out that the main goal of studying comfort is to distinguish variables related to comfort and discomfort [17,18]. Although there is no agreement on a definition of comfort, scholars generally agree that most definitions have in common: (1) comfort is subjective; (2) comfort is influenced by both internal and external factors; (3) comfort is a feeling for something or reaction in the environment [19].
In summary, although scholars have different views on the definition of comfort, they all agree that comfort is generally associated with positivity, relaxation, and pleasure. At the same time, comfort is also associated with the absence of discomfort and restlessness, according to perceptions of comfort. Therefore, passenger comfort in an automated vehicle can be considered as the passenger not feeling discomfort in the vehicle cockpit or is being a state of physical and psychological relaxation and pleasure.

1.2.2. Evaluation Criteria and Models for Passenger Comfort in Automated Vehicles

In an intelligent vehicle cockpit, the comfort of passengers will be affected by the internal and external environment. When evaluating passenger comfort in a vehicle cockpit, the occupant, vehicle, and cockpit should be considered as a system. Vibration and noise caused by the vehicle itself and the road, air movement, temperature in the cockpit, lighting conditions, seat ergonomics, etc., will affect the comfort of the passengers in the cockpit. In addition, individual passenger characteristics and sitting posture can also lead to differences in comfort or discomfort.
In traditional automobiles, the most common practice is to use the car seat as the object to measure the vehicle vibration, acceleration, and other indicators to determine comfort [20]. After the vertical vibration of the vehicle and the shifting shock are transmitted to the passengers, the discomfort felt by adults and children is also different [21,22]. Through dummy experiments and data statistics, the noise level in the vehicle can be obtained, which can then be used to establish the relationship between noise and comfort [23,24]. In addition, different road conditions and engine-induced noises have different effects on passenger comfort [25]. The vehicle acoustic comfort index can be used to build an optimization model. Therefore, the relationship between engine noise and vibration can be studied, and the rules of acoustic comfort in passenger vehicle cockpits can also be obtained [26]. Cockpit temperature is also one of the main factors affecting passenger comfort. One study found that the flow field and temperature field of the passenger compartment can affect the thermal comfort of the occupants [27]. Vehicles’ thermal comfort is affected by solar radiation, body heat insulation effects, average radiation temperature, and exposure time [28]. The infrared reflection treatment of vehicle glass can reduce the air temperature in the vehicle cockpit, which is also beneficial to improving passenger comfort and vehicle economy [29]. In addition, economical sensors can be used to monitor the temperature distribution in the cockpit, thereby improving thermal comfort [30,31]. At the same time, the lighting function in the cockpit cannot be ignored, which can improve the driver’s driving comfort and occupant reading [32]. The lighting in the cockpit is also affected by the instrumentation in the cockpit. If there is glare, etc., driving fatigue can easily result, which will lead to improper operation and traffic accidents [33]. With the development of automated driving technology, the ergonomic intelligent cockpit has been redesigned and rearranged with regard to ISO standards. There are more and more human–computer interaction functions in the intelligent cockpit. In addition to the traditional physical interface of the cockpit, the individual characteristics of the passengers, sitting posture, etc., all have an impact on comfort [34,35].
A combination of subjective and objective evaluation is generally used for vehicle comfort evaluation [19,36,37]. Using data measurement and passenger scoring, a passenger evaluation model for the ride comfort of a vehicle can be obtained. From the above literature review, it can be seen that there is a lack of models for comprehensive evaluation of the comfort of vehicle cockpits. With the development of intelligent vehicles, the intelligent cockpit has been redesigned and rearranged, and the passenger experience has been further improved, so it is more and more necessary to comprehensively evaluate the comfort of the intelligent cockpit.

1.3. Purpose of This Study

In this study, we conduct a passenger experience experiment with an intelligent cockpit. Through a vehicle with intelligent cockpit functionality, passengers’ comfort data regarding the cockpit environment is collected, including the evaluation data of noise, light, heat, and human–machine interaction comfort. From the subjective and objective perspectives, the evaluation factors of the comfort of the intelligent cockpit are established, the expert evaluation data is processed by the analytic hierarchy process (AHP) and the entropy weight method, and the comprehensive evaluation model of the comfort of the intelligent cockpit is constructed with game theory. The comfort evaluation model based on passenger experience can analyze the influencing factors of cockpit comfort and aid in cockpit design and automatic driving control strategies.

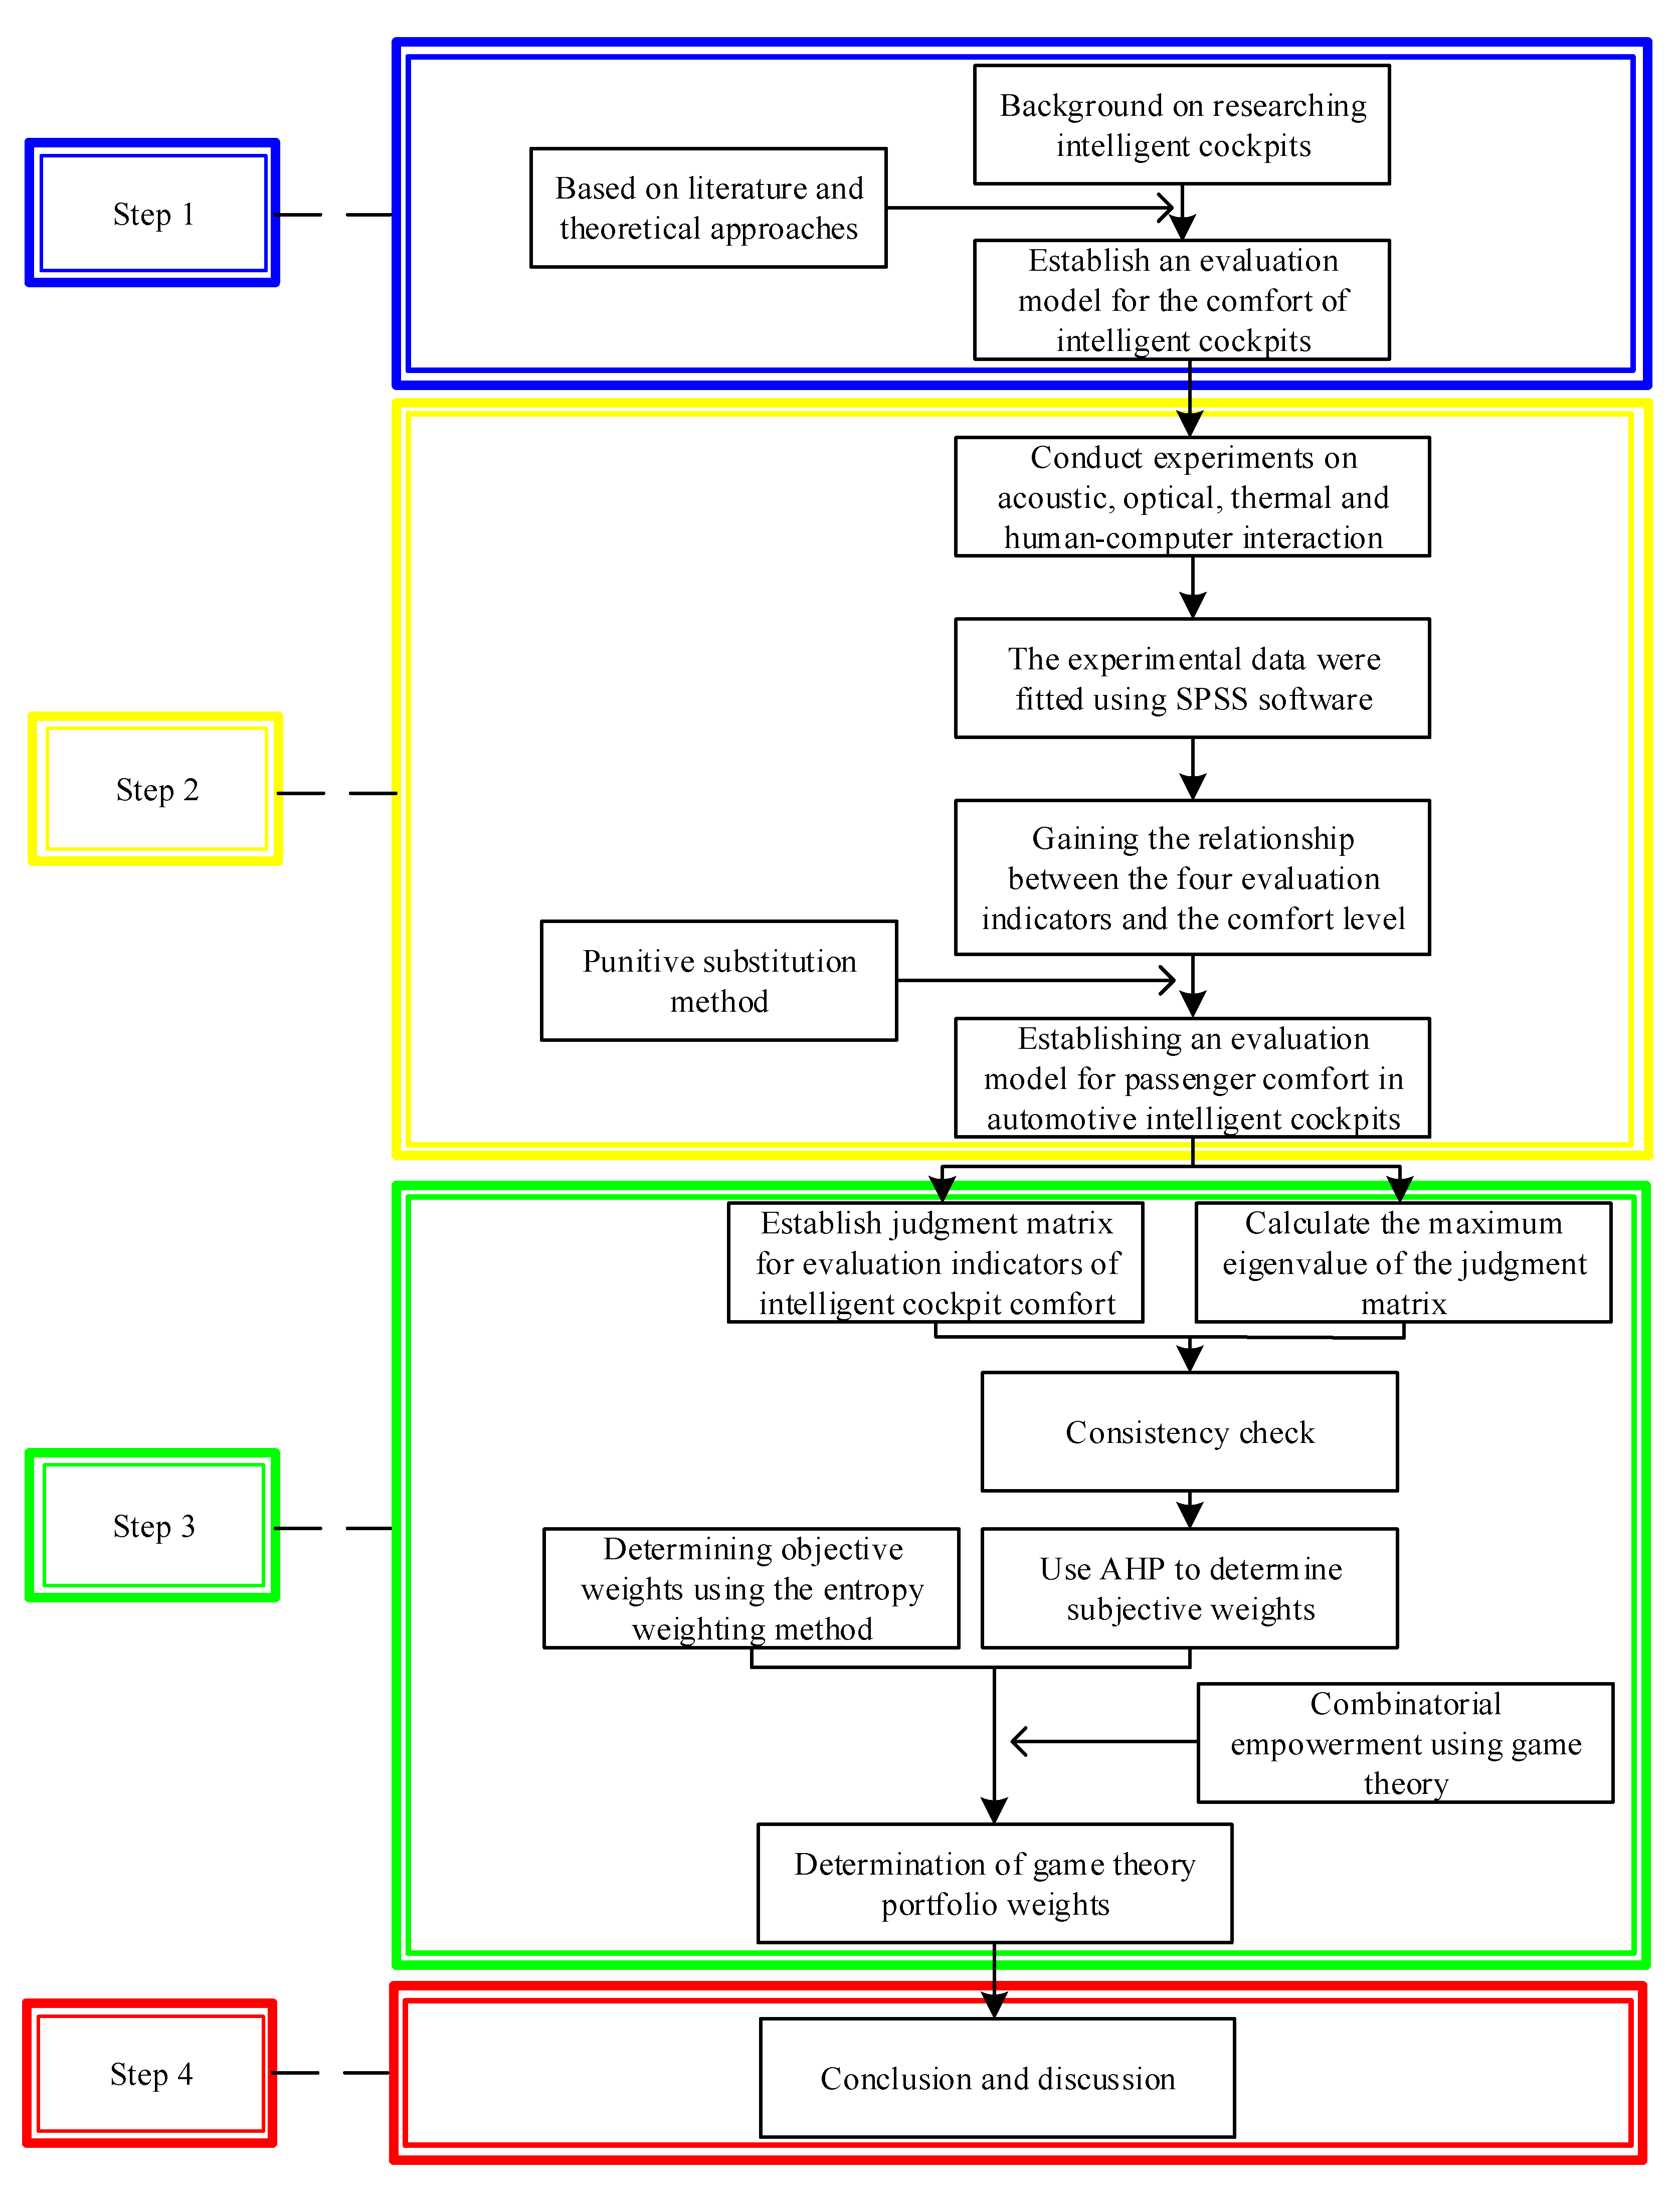
1.4. A Framework for Research on Passenger Comfort in Automotive Intelligent Cockpits

The analysis process of the research framework for automotive intelligent cockpit comfort comprises four stages, as shown in Figure 1: Stage 1: Introduction of research background and review of literature and methodology; Stage 2: The relationships between acoustic environment, optical environment, thermal environment, and human–computer interaction and passenger comfort are obtained through experiments; Stage 3: Calculation of subjective weights and objective weights by hierarchical analysis and the improved entropy weight method, respectively, followed by combination of subjective weights and objective weights with game theory, followed by establishment a comprehensive comfort assessment model for passengers in intelligent cockpits of cars and analysis of a case study of intelligent cars; Stage 4: Results and discussion.

2. Materials and Methods

The main research purpose of this paper is to explore the influence of the environment of the intelligent cockpit on passenger comfort. The noise, light, heat, and human–computer interaction experiments of the intelligent cockpit are designed, and a comprehensive evaluation model of the comfort of the intelligent cockpit based on passenger experience is established.

2.1. Experimental Equipment and Participants

2.1.1. Equipment and Personnel

This experiment was conducted in the cockpit of a 2020 Audi A4L sedan, which was chosen as the experimental environment for the intelligent cockpit because it is generally considered to have a good sense of technology and human–computer comfort, etc. in the literature studies on intelligent cockpits [38]. The interior of one of the Audi intelligent cockpits is shown in Figure 2. We invited 35 teachers and students to operate vehicles to participate in the experiment, all of whom had driving experience and were aged between 22 and 47, covering the young and middle-aged population. The composition of the personnel is shown in Table 1.
Subjects are trained on comfort evaluation before the experiment, including experiment content and precautions. The experiments are conducted simultaneously in groups of two at a time, selecting the driver’s position and the right rear seat occupant and measuring the comfort of the occupants under different conditions.
The noise measurement instrument is a precision noise level meter, a model AWA6291 handheld real-time signal analyzer with a range of 25–140 dB (A) and an error of no more than 0.1 dB (A). As the light source in the cockpit of the car is relatively singular, to study the light comfort of occupants under different illumination levels, an LED light source was added to the cockpit of the experimental car, and the illuminance of the light source was measured using a digital illuminance meter. For the thermal environment experiment, a small, portable mobile air conditioner was added in the cockpit of the car, which combined with the onboard air conditioner to control and adjust the cockpit temperature. The experimental instruments mainly include the RTD and data acquisition instrument for testing the temperature in the cockpit, the dry and wet bulb thermometer for measuring the relative humidity in the cockpit, the thermal anemometer for measuring the wind speed in the cockpit, and the adiabatic pressure meter for measuring the pressure in the cockpit.

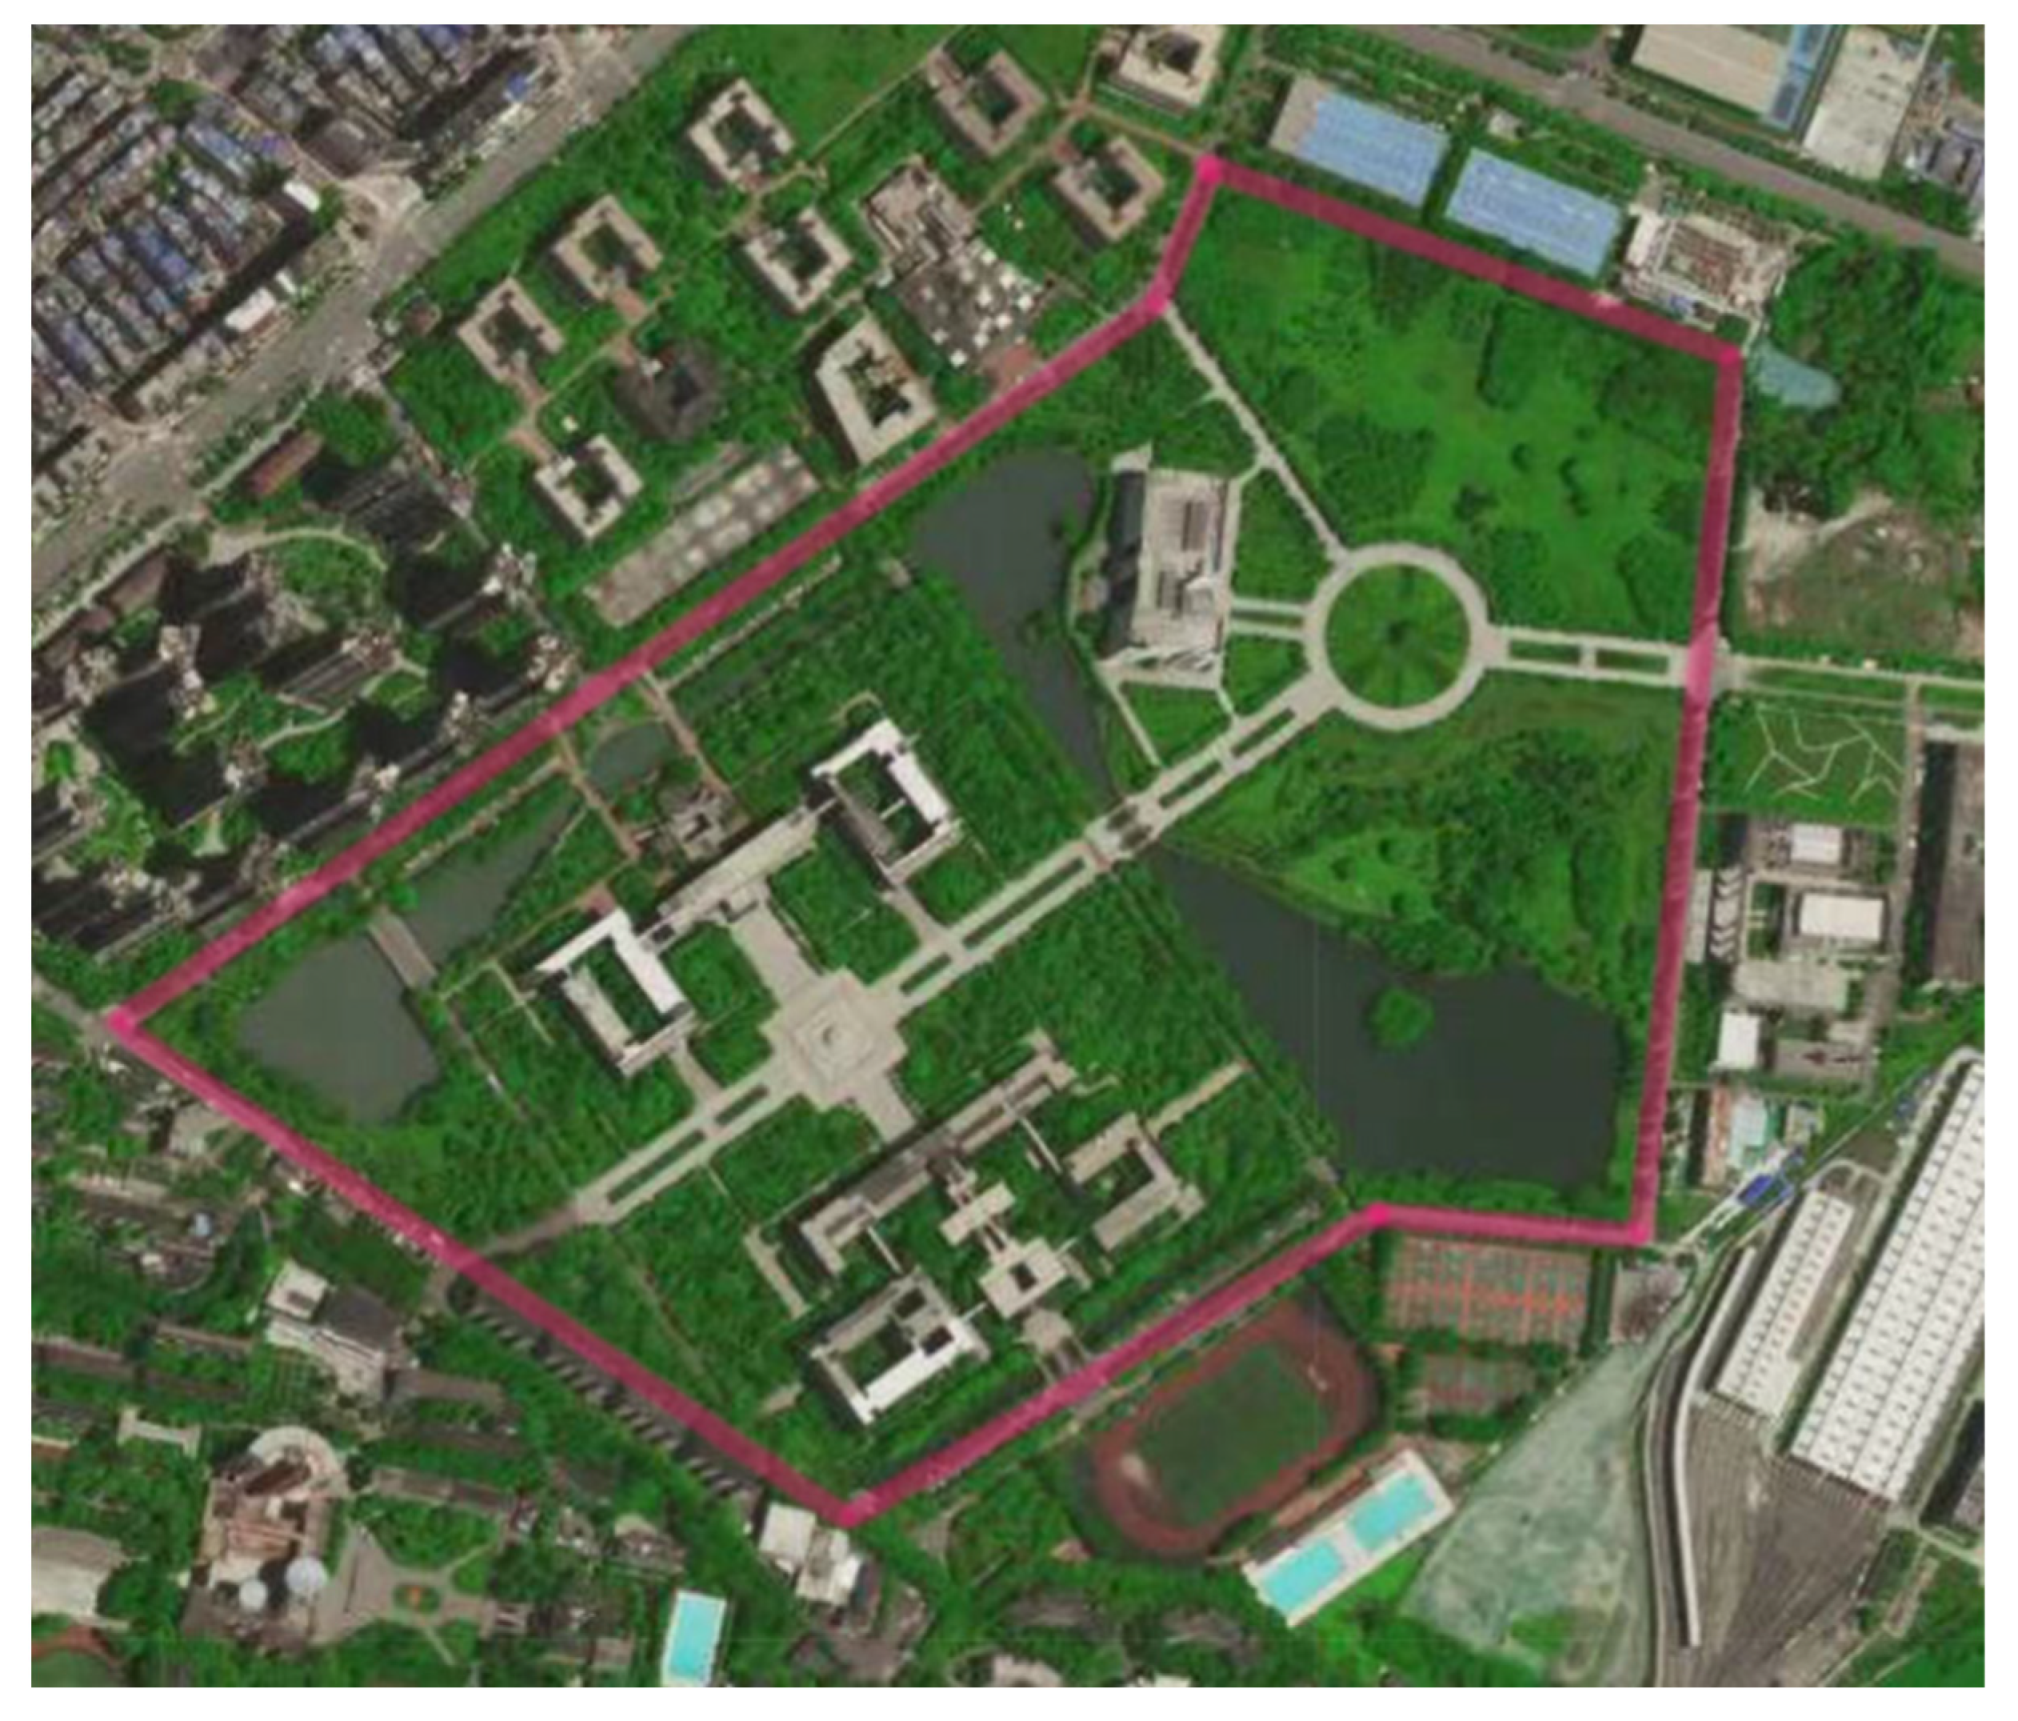
2.1.2. Experimental Site

The experimental road is the experimental test route at Xihua University, as shown in Figure 3. The road section drawn in red is the driving route of the car on the map during the specific experiment. Since constant-speed driving is the most common driving condition in real life, the experimental conditions of this evaluation model are all set to a constant speed, and the vehicle speed is controlled at about 40 km/h. During the experiment, the car windows are closed to reduce the influence of external noise and heat sources. The temperature in the cockpit is controlled within the range of 25 °C ± 1 °C in the noise experiment. Lighting experiments are performed at night, and the rest are performed during the day.

2.2. Experimental Procedure

After obtaining the weight of each factor, it is necessary to further determine the relationship between sound, light, heat, and human–computer interaction and the comfort of the intelligent cockpit. The single-factor experimental method was used to obtain the formula for the functional relationship between each parameter and comfort. When evaluating the comfort level, the comfort voting method given by ASHRAE Standard adopts a 5-level index system, while the American Society of Automotive Engineers, based on the subjective evaluation index of the SAE 1441 standard, has a 10-point recommendation table. Combined with the ASHRAE standard and SAE 1441 standard, and further considering the scoring habits of score evaluation, the comfort evaluation scale of this paper is formulated as shown in Table 2.

2.2.1. Acoustic Experiment

The national standard “Motor vehicle fixed noise sound pressure level measurement method” regulates the noise measurement method inside the car, therefore, the intelligent car with automatic driving function is to meet the test conditions of this standard. During the measurement, it is ensured that the distance between the vehicle and the surrounding large objects is greater than 20 m, and the car sunroof, window wiper, heating device, air conditioner, and air inlet and outlet are closed. The measurement of noise in the cockpit of the car is location-dependent; the noise distribution point in the car next to the ear of the representative occupant is chosen as the measurement point, and the driver’s position is a mandatory measurement point.
To obtain the noise environment when the vehicle is moving, noise recording data from highways, city sections, and intersections are collected for editing. Generally speaking, the human ear perceives sound frequencies in the 20 Hz–20,000 Hz range. As the vehicle driving and vibration noise are low-frequency long noise, the sound sources collected are divided according to low-frequency region (<1000 Hz), medium-frequency region (3500–4500 Hz), and high-frequency region (6000–8000 Hz), and the low-frequency noise curve collected at the site and edited for the experiment is shown in Figure 4.
With reference to the influence of environmental noise, the experimental noise level is set to 50 dB (A) as the lower limit, and due to the national standard of China’s gasoline cars for fixed noise of not more than 85 dB (A), the experimental upper limit of the noise level set to 90 dB (A). As the car noise belongs to the low-frequency noise range, the most common working conditions such as uniform speed are chosen for noise experiments. The noise experimental grouping is shown in Table 3. The experimental results were fitted with SPSS software, and the fitted results are shown in Figure 5.
The dimensionless function of the cockpit acoustic environment is a linear fitting function for the low-frequency uniform operating conditions under experimental conditions, as shown in Equation (1):
y 1 = 0.150 N + 16.795
where y 1 represents the cockpit noise and vibration comfort evaluation value; N represents the noise at the A sound level as the evaluation method to get the evaluation value; the unit is dB.

2.2.2. Optical Environment Experiment

In order to avoid the influence of direct sunlight on the cockpit light environment, the cockpit light environment comfort experiment was carried out at night and in a dark place without streetlights. At the same time, excluding the influence of other variables, the overall driving condition was uniform, and the corresponding vehicle speed was the same as the noise environment experiment.
The experimental conditions of illumination classification for specific experiments are shown in Table 4. Since the color temperature characteristics of the light source will affect the atmosphere of the place of use, the general color temperature is between 3300–5300 K as an intermediate color, which is used often in offices, schools, reading rooms, etc. Considering the functional division of the smart cockpit, which has both rest and office leisure functions, the experiment was carried out at a color temperature of 3500 K. Concerning the illuminance grading standard for interior lighting of buildings, the illuminance test ranges from 50 lx to 1000 lx at each color temperature. The experimental results were fitted with SPSS software, and the fitted results are shown in Figure 6.
The dimensionless function of the cockpit light environment selects the quadratic fitting function of the cockpit experimental data under 3500 K color temperature and uniform speed conditions, as shown in Equation (2):
y 2 = 0.00002019 C 2 + 0.022 C + 3.489
where y 2 represents the cockpit light environment comfort evaluation value, C represents the illuminance in the cockpit, and the unit is lx.

2.2.3. Thermal Environment Experiment

After investigation, most passenger cars on the market at present have a cockpit temperature adjustment range of 18–30 °C. The temperature experiment range for this experiment was set to 17–31 °C. The experimental working conditions and temperature conditions are shown in Table 5.
When conducting the single-factor thermal environment experiment, only the most common working condition of uniform speed was considered, and the corresponding vehicle speed conditions were the same as in the noise environment experiment. To measure the comfort level of different parts of the occupant’s body, the temperature measurement points in the vehicle cockpit were arranged to include the occupant’s legs, the steering wheel, the seat backrest, and the seat headrest, which were used for the temperature perception of the occupant’s legs, hands, torso, and head, respectively. The experimental results were fitted with SPSS software, and the fitted results are shown in Figure 7.
The cockpit thermal environment dimensionless function is selected as a quadratic fitting function for the cockpit experimental data under uniform speed conditions, as shown in Equation (3):
y 3 = 0.054 T 2 + 2.649 T 22.856
where y 3 represents the cockpit thermal comfort assessment value, and T represents the cockpit temperature in °C.

2.2.4. Human–Computer Interaction Experiment

Currently, the intelligent cockpit function equipment on the market mainly focuses on convenience of use; safety assistance; acoustic, optical, thermal, and visual comfort; human–computer interaction; etc. There are more than forty kinds of direct or indirect human–computer interaction comfort technologies, in addition to the cockpit space size, instrumentation interior, etc. At the same time, the study of human–computer interaction in intelligent cockpits also requires consideration of the reliability and responsiveness of the technology, so it is difficult to ascertain the relationship between cockpit human–computer interaction and cockpit comfort through one or several cockpit human–computer interaction equipment experiments. However, in general, without considering functional redundancy, equipment diversification in the cockpit will promote the comprehensive comfort of the cockpit, and the technical equipment situation of the cockpit has some special relationship with the total price of the car. Therefore, data on the comfort of the intelligent cockpit can be obtained by researching the equipment situation of the human–computer interaction technology products in the cockpit of the vehicle.
According to the technical research department of the China Automotive Industry Information Network (CAIN), the functional data of intelligent cockpits of 6744 vehicle models on the Chinese market in 2021 were studied, and a heat map of the equipment of car cockpit technology and car price was drawn, as shown in Figure 8.
From the heat map, we can see that as the price of cars increases, the equipment rate of car cockpit technology also rises, and for cars over 450,000 yuan, the equipment rate reaches more than 80%. Among them, the car with the highest equipment rate is in the range of 800,000–850,000 yuan. Because the purpose of the intelligent cockpit function equipment is to make the car highly intelligent and improve driving comfort, the equipment rate is used instead of comfort to establish the relationship between car price and intelligent cockpit human–computer interaction comfort, and data fitting is carried out, as shown in Figure 9.
The cockpit HMI dimensionless function selects a fitting function for the quadratic function of the human–machine experimental data, as shown in Equation (4):
y 4 = 0.001 P 2 + 0.163 P + 1.398
where y 4 represents the evaluation value of cockpit human–computer interaction environmental comfort, and P represents the price of the car in increments of 10,000 yuan.

3. Calculation of The Weights

3.1. Subjective Weight Calculation

Judgment Matrix

The judgment matrix is the basis of the hierarchical analysis method, which requires calculating the relative importance among interrelated evaluation indicators layer by layer and quantifying the importance of each indicator, after which a judgment matrix is constructed. In the hierarchical analysis method, the judgment matrix can be obtained by the method of two-by-two comparison of relative importance between parameters. In order to calculate the relative importance between evaluation indicators, the nine-level scale proposed by Professor T.L. Satty is widely used, but it has limitations, such as the large differences between the scale values, which makes it more difficult for people to make accurate judgments, and when we need higher-precision weights, we need to improve the scale value system for constructing weights.
This investigation uses the evaluation scale of AHP, applies the idea of the scale-free limit, introduces the binary weight assignment value, and gives the judgment value C i j in terms of “two to two importance ratio,” that is, the problem of importance comparison is regarded as a problem of weight assignment between only two factors, and the specific way of assignment is shown in Table 6.
To understand the relative importance of the sound, light, heat, and human–computer interaction parameters, a web-based questionnaire was used to collect information. The participants mainly included users of new energy vehicles, vehicle technology developers, automotive after-market personnel, and vehicle owners, totaling 135 people. The judgment matrix of the hierarchical analysis method constructed based on the statistics recovered from the survey is shown in Table 7.
The judgment matrix in Table 7 was processed by the square root method, sum-product method, inverse row sum method, and row geometric mean method, and the subjective weights of the four evaluation indexes obtained by the four methods were averaged to finally obtain the subjective weights of the four evaluation indexes, as shown in Table 8.

3.2. Objective Weight Calculation

The objective weights were scored by experts, and five experts engaged in comfort research in the automotive industry were invited to score the intelligent cockpit comfort factors objectively, as shown in Table 9.
The objective weights were calculated using the entropy weighting method, which can reflect the rich attributes of the evaluation indicators at the acoustic, optical, thermal, and human–computer interaction levels [7]. First, the weight of the j th evaluation index in the i th expert rating value is calculated according to the evaluation matrix:
p i j = x i j i = 1 n x i j
The entropy value H j of the j th evaluation indicator is calculated:
H j = 1 ln n i = 1 n p i j ln p i j
The objective weights of each evaluation indicator are calculated to obtain:
ω j = 1 H j j = 1 n ( 1 H j )    
The evaluation matrix used to carry out the entropy weighting method is shown in Table 8, and the final objective weights of sound, light, heat, and human–computer interaction obtained by substituting the matrix into Equations (5)–(7) are calculated as 0.2337, 0.2787, 0.2072, and 0.2804, in that order.

3.3. Optimization of Portfolio Weights Based on Game Theory

After calculating the subjective and objective weights of the acoustic environment, optical environment, thermal environment, and human–computer interaction environment, the subjective and objective weights need to be assigned. Since there is no reference experience for the allocation of subjective and objective weights for the comprehensive evaluation of the cockpit comfort of intelligent vehicles, and the subjective and objective weights are symbiotic and relative to the cockpit comfort indexes, we can neither consider only one aspect of the subjective and objective weights and thus lose the other nor simply allocate them equally. Therefore, the allocation based on subjective and objective weights can be optimized according to the idea of game theory.
The method for optimizing the subjective and objective weights of the intelligent cockpit using game theory is as follows:
(1) The two methods of subjective weights and objective weights used to calculate the weights of the evaluation indicators of the intelligent cockpit acoustic environment, optical environment, thermal environment, and human–computer interaction environment are obtained as ω k = ( ω k 1 , ω k 2 , ω k n ) , where k = 1 ,   2 n . If the linear combination of the n weight vectors has coefficients α k = ( α k 1 , α k 2 , α k n ) , then any linear combination ω has the following equation hold:
ω = k = 1 n ( α k ω k T )
(2) Using the basic idea of game theory, the optimal combination weight vector ω * is obtained by optimizing the linear combination coefficients α k so that the deviation of ω * from ω is minimized, and for this purpose, the countermeasure model is introduced:
m i n k = 1 n α k ω k T ω k 2
The system of linear equations for the optimal derivative condition obtained from the matrix differentiation property is:
[ ω 1 ω 1 T ω 1 ω n T ω n ω 1 T ω n ω n T ] [ α 1 α n ] = [ ω 1 ω 1 T ω n ω n T ]
The values obtained from the above equation are normalized as follows:
α * = α k / k = 1 n α k    
The combined weights based on game theoretical ideas ω * are calculated as follows:
ω * = k = 1 n α k * ω k T
According to the calculation results of the subjective weights and objective weights, the coefficients of the subjective and objective weights can be obtained by substituting the relevant factors into the above equation, which are 0.69 and 0.31, respectively. After substituting the data of subjective weights and objective weights vector, the weight vector based on game theory optimization can be obtained as ( 0.2344 ,   0.2079 ,   0.2557 ,   0.3020 ) , which contains the final evaluation weights of the sound environment, light environment, and thermal environment; the final evaluation weights of the primary indicators of the human–computer interaction environment are ( 0.2344 ,   0.2079 ,   0.2557 ,   0.3020 ) .

4. Intelligent Cockpit Comprehensive Comfort Evaluation Model and Case

4.1. Model Synthesis

The substitution synthesis method is divided into two cases, whose expressions are shown in Equation (13):
Y = L + i = 1 n ( y i L ) ω i
where Y is the comfort evaluation score; L is the theoretical minimum value of a single evaluation index; y i is the dimensionless value of the first evaluation index; ω i is the weight value of the first index; and n is the number of evaluation indexes.
When compiling a comprehensive evaluation model for intelligent cockpit comfort, it is necessary to consider the boundary values for each evaluation value, as several evaluation factors are involved. Incorporating the evaluation idea of synthesis, when any one factor has the minimum comfort evaluation value, the combined comfort evaluation value should also be the lowest. When y i = 0 , the evaluation value ( y i L ) ω i of the comprehensive comfort of the intelligent cockpit should be the minimum value, that is, Y = 0 . Therefore, the dimensionless function of a single factor takes values in the range of [0, 10], and Equation (14) needs to be corrected. The mathematical function max can be used to ensure that the corrected evaluation value of comfort of each first-level evaluation index is between [0, 10], as shown in Equation (14):
Y i = max ( y i , 0 )
According to the principle of synthesis, the dimensionless functions obtained from the above noise and vibration environment, light environment, thermal environment, and human–computer interaction environment, the weights of each level of evaluation index factors, and the correction formula are substituted into Equation (13) for synthesis to obtain the expression of the comprehensive evaluation model of intelligent cockpit comfort, which is shown in Equation (15) below:
Y = L + [ max ( 0 , y 1 ) L ] 0.2344 [ max ( 0 , y 2 ) L ] 0.2079 [ max ( 0 , y 3 ) L ] 0.2557 [ max ( 0 , y 4 ) L ] 0.3020
In the above equation, Y is the predicted intelligent cockpit integrated comfort voting results; L is the lower limit of the value of a single index, which is 0; y 1 , y 2 , y 3 , and y 4 are the dimensionless functions of the noise and vibration environment, light environment, thermal environment, and human–computer interaction environment comfort indexes, respectively; see Equations (1)–(4).
Equation (14) is the evaluation model of the comprehensive comfort of the intelligent cockpit based on occupant’s perception evaluation. The total evaluation value of comprehensive comfort is obtained by multiplicative synthesis through the linear transformation of the dimensionless functions of single factors affecting the evaluation of smart cockpit comfort. In order to reflect the degree of influence of different evaluation factors on the comprehensive comfort, the weight coefficients were considered for the evaluation values of single indicators when the multiplicative synthesis of the evaluation model was carried out. At the same time, from the perspective of practical evaluation, if the comfort of any single evaluation environment is intolerable, its single evaluation value is 0, and after penalty-type synthesis, all will make the total evaluation value 0, that is, the comprehensive comfort of the intelligent cockpit is intolerable.

4.2. Case Verification

Whether the comprehensive evaluation model of intelligent cockpit comfort shown in Equation (15) is reasonable or not must be verified by real engineering cases. We chose the Tesla Model 3 car cockpit for example validation.
Some subjects were selected to conduct a comprehensive evaluation of the abovementioned smart cockpit comfort. According to the experimental conditions in Chapter 3, the validations were conducted in July climate conditions in the plain conditions of Chengdu. For the noise and vibration environment, optical environment, thermal environment, and human–computer interaction environment, the experimental environment was not validated because the extreme experimental conditions were not easily available. Eight subjects (four males and four females) were selected to conduct experiments on the Tesla Model 3 to evaluate the comfort of the smart cockpit under different working conditions, and the subjects’ experimental results were correlated with the predicted composite comfort calculated from the evaluation model of Equation (15).
The comprehensive evaluation values of the subjects and the comprehensive evaluation comfort values obtained from Equation (15) are shown in Table 10, while the significance test results between them are shown in Table 11. It can be seen that the comprehensive comfort tests of the experimented Tesla cars are significantly correlated, indicating that the established comprehensive comfort evaluation formula is reasonable and can be applied to engineering practice.
In Table 11, * indicates a significant correlation at the 0.05 level, and ** indicates a significant correlation at the 0.01 level. It can be seen that the evaluation results of the established comprehensive evaluation model of intelligent cockpit comfort are in good agreement with the experimental results and can be used for engineering experimental evaluations.

5. Conclusions and Discussions

In the environment of increasingly intelligent vehicle cockpits, this paper establishes a passenger comfort evaluation model of intelligent vehicle cockpits based on passenger experience. The model evaluates the passenger comfort of an intelligent cockpit based on four aspects: acoustic environment, optical environment, thermal environment, and human–computer interaction. The subjective and objective weights of the four evaluation indicators are obtained by using AHP and the entropy weighting method, and the final weights of the four evaluation indicators are finally obtained by the use of game theory combination assignment. Meanwhile, in order to ascertain the specific relationship between the four evaluation indexes and passenger comfort, this paper sets up four experiments to obtain the specific effects of changes in four parameters of sound, light, temperature, and human–computer interaction on changes in passenger comfort. Finally, an evaluation model of passenger comfort of an automotive intelligent cockpit is established based on the idea of penalized substitution.
In this paper, the model is applied to the Tesla Model 3, and a significance test is performed between the volunteer test data and the composite evaluation value derived from the model. The results show a significant correlation. Thus, the rationality of the passenger comfort evaluation model is verified.
The establishment of the model has some significance for the future design of intelligent cockpits in automobiles and is also conducive to improving the shortcomings of some models in terms of passenger comfort.
Although this experiment measured the comfort of passengers in terms of sound, light, heat, and human–computer interaction, there are still the following shortcomings:
(1)
The number of samples used in this experiment is small, which may have some influence on the results of the experiment.
(2)
This experiment solely involved Asian people, and the factor of ethnicity may cause some errors in the results of the experiment.
(3)
Human–computer interaction has unidentifiable factors, the relationship between human–computer interaction and human comfort cannot be well expressed, and we only adopted a superficial substitution method, so much work is needed in the future regarding human–computer interaction.

Author Contributions

Conceptualization, J.Y.; methodology, S.X.; formal analysis, S.X.; investigation, R.Q. and Y.C.; resources, J.Y.; writing—original draft preparation, J.Y., S.X., C.H. and D.D.; writing review and editing, J.Y., C.H. and D.D. All authors discussed and commented on the manuscript. All authors have read and agreed to the published version of the manuscript.

Funding

This work was supported by: (1) The Open Research Fund of Sichuan Key Laboratory of Vehicle Measurement, Control and Safety (szjj2018-130); (2) Sichuan Province Innovation Training Project (S202110650026 and S202110650028).

Institutional Review Board Statement

Ethical review and approval was waived for this study because the experimenters were only filling out the ride experience in this experiment and no medically or biologically relevant human studies were involved.

Informed Consent Statement

Informed consent was obtained from all subjects involved in the study.

Data Availability Statement

All data generated or analyzed during this study are included in this published article.

Conflicts of Interest

The authors declare no conflict of interest.

References

  1. Vlakveld, W.; van Nes, N.; de Bruin, J.; Vissers, L.; van der Kroft, M. Situation awareness increases when drivers have more time to take over the wheel in a Level 3 automated car: A simulator study. Transp. Res. Part F Traffic Psychol. Behav. 2018, 58, 917–929. [Google Scholar] [CrossRef]
  2. Du, Y.; Liu, C.; Li, Y. Velocity control strategies to improve automated vehicle driving comfort. IEEE Intell. Trans-Portation Syst. Mag. 2018, 10, 8–18. [Google Scholar] [CrossRef]
  3. Paddeu, D.; Parkhurst, G.; Shergold, I. Passenger comfort and trust on first-time use of a shared autonomous shuttle vehicle. Transp. Res. Part C Emerg. Technol. 2020, 115, 102604. [Google Scholar] [CrossRef]
  4. Terken, J.; Pfleging, B. Toward shared control between automated vehicles and users. Automot. Innov. 2020, 3, 53–61. [Google Scholar] [CrossRef] [Green Version]
  5. Wang, C.; Zhao, X.; Fu, R.; Li, Z. Research on the comfort of vehicle passengers considering the vehicle motion state and passenger physiological characteristics: Improving the passenger comfort of autonomous vehicles. Int. J. Environ. Res. Public Health 2020, 17, 6821. [Google Scholar] [CrossRef]
  6. Bellem, H.; Thiel, B.; Schrauf, M.; Krems, J.F. Comfort in automated driving: An analysis of preferences for different automated driving styles and their dependence on personality traits. Transp. Res. Part F Traffic Psychol. Behav. 2018, 55, 90–100. [Google Scholar] [CrossRef]
  7. Siebert, F.W.; Oehl, M.; Höger, R.; Pfister, H.-R. Discomfort in automated driving–the disco-scale. In Proceedings of the International Conference on Human-Computer Interaction, Las Vegas, NV, USA, 21–26 July 2013; Springer: Berlin, Germany, 2013; pp. 337–341. [Google Scholar]
  8. Weigl, K.; Schartmüller, C.; Riener, A.; Steinhauser, M. Development of the Questionnaire on the Acceptance of Automated Driving (QAAD): Data-driven models for Level 3 and Level 5 automated driving. Transp. Res. Part F Traffic Psychol. Behav. 2021, 83, 42–59. [Google Scholar] [CrossRef]
  9. Tan, H.; Sun, J.H.; Guan, D.S.; Zhou, M.L.; Jian-Ping, Q.I.; Zhao, Y. Development Trend of Human-Computer Interaction in Intelligent Vehicles. Packag. Eng. 2019, 40, 32–42. [Google Scholar]
  10. Elbanhawi, M.; Simic, M.; Jazar, R. In the passenger seat: Investigating ride comfort measures in autonomous cars. IEEE Intell. Transp. Syst. Mag. 2015, 7, 4–17. [Google Scholar] [CrossRef]
  11. Richards, L. On the Psychology of Passenger Comfort; Human Factors in Transport Research; Oborne, D.J., Levis, J., Eds.; Academic Press: New York, NY, USA, 1980; Volume 2. [Google Scholar]
  12. Slater, K. Human Comfort; CC Thomas: Springfield, IL, USA, 1985. [Google Scholar]
  13. Floyd, W.; Roberts, D. Anatomical and physiological principles in chair and table design. Ergonomics 1958, 2, 1–16. [Google Scholar] [CrossRef]
  14. Braton, P. Behaviour, body mechanics and discomfort. Ergonomics 1969, 12, 316–327. [Google Scholar] [CrossRef] [PubMed]
  15. Summala, H. Towards understanding motivational and emotional factors in driver behaviour: Comfort through satisficing. In Modelling Driver Behaviour in Automotive Environments; Springer: London, UK, 2007; pp. 189–207. [Google Scholar]
  16. Bishu, R.R.; Hallbeck, M.S.; Riley, M.W.; Stentz, T.L. Seating comfort and its relationship to spinal profile: A pilot study. Int. J. Ind. Ergon. 1991, 8, 89–101. [Google Scholar] [CrossRef]
  17. Kamijo, K.; Tsujimura, H.; Obara, H.; Katsumata, M. Evaluation of seating comfort. SAE Trans. 1982, 91, 2615–2620. [Google Scholar]
  18. Zhang, L.; Helander, M.G.; Drury, C.G. Identifying factors of comfort and discomfort in sitting. Hum. Factors 1996, 38, 377–389. [Google Scholar] [CrossRef]
  19. De Looze, M.P.; Kuijt-Evers, L.F.; van Dieen, J. Sitting comfort and discomfort and the relationships with objective measures. Ergonomics 2003, 46, 985–997. [Google Scholar] [CrossRef]
  20. Vér, I.L.; Beranek, L.L. Noise and Vibration Control Engineering: Principles and Applications; John Wiley & Sons: Hoboken, NJ, USA, 2005. [Google Scholar]
  21. Sezgin, A.; Arslan, Y.Z. 782. Analysis of the vertical vibration effects on ride comfort of vehicle driver. J. Vibroeng. 2012, 14, 1392–8716. [Google Scholar]
  22. Wicher, J.; Wieckowski, D. Influence of vibrations of the child seat on the comfort of child’s ride in a car. Eksploatacja i Niezawodnosc-Maint. Reliab. 2010, 48, 102–110. [Google Scholar]
  23. Flor, D.; Pena, D.; Pena, L.; de Sousa, V.A.; Martins, A. Characterization of noise level inside a vehicle under different conditions. Sensors 2020, 20, 2471. [Google Scholar] [CrossRef]
  24. da Silveira Brizon, C.J.; Medeiros, E.B. Combining subjective and objective assessments to improve acoustic comfort evaluation of motor cars. Appl. Acoust. 2012, 73, 913–920. [Google Scholar] [CrossRef]
  25. Nor, M.J.M.; Fouladi, M.H.; Nahvi, H.; Ariffin, A.K. Index for vehicle acoustical comfort inside a passenger car. Appl. Acoust. 2008, 69, 343–353. [Google Scholar] [CrossRef]
  26. Junoh, A.K.; Nopiah, Z.; Muhamad, W.; Nor, M.; Fouladi, M. An optimization model of noise and vibration in passenger car cabin. Adv. Mater. Res. 2012, 383, 6704–6709. [Google Scholar] [CrossRef]
  27. Walgama, C.; Fackrell, S.; Karimi, M.; Fartaj, A.; Rankin, G. Passenger thermal comfort in vehicles-a review. Proc. Inst. Mech. Eng. Part D: J. Automob. Eng. 2006, 220, 543–562. [Google Scholar] [CrossRef]
  28. Danca, P.; Vartires, A.; Dogeanu, A. An overview of current methods for thermal comfort assessment in vehicle cabin. Energy Procedia 2016, 85, 162–169. [Google Scholar] [CrossRef] [Green Version]
  29. Devonshire, J.M.; Sayer, J.R. Radiant heat and thermal comfort in vehicles. Hum. Factors 2005, 47, 827–839. [Google Scholar] [CrossRef]
  30. Martinho, N.; Silva, M.; Ramos, J. Evaluation of thermal comfort in a vehicle cabin. Proc. Inst. Mech. Eng. Part D J. Automob. Eng. 2004, 218, 159–166. [Google Scholar] [CrossRef]
  31. Russi, L.; Guidorzi, P.; Pulvirenti, B.; Aguiari, D.; Pau, G.; Semprini, G. Air Quality and comfort characterisation within an electric vehicle cabin in heating and cooling operations. Sensors 2022, 22, 543. [Google Scholar] [CrossRef] [PubMed]
  32. Khanh, T.Q. Lighting Quality for Automotive Lighting. Light Eng. 2014, 22, 59–63. [Google Scholar]
  33. Anant, S.; Veni, S. Safe driving using vision-based hand gesture recognition system in non-uniform illumination conditions. J. ICT Res. Appl. 2018, 12, 2. [Google Scholar] [CrossRef]
  34. Oh, G.T.; Lee, S.Y.; Ko, J.J. Design and implementation of gesture recognition and safe driving assistance system using wearable band based on in-vehicle HUD system. J. Korean Inst. Commun. Inf. Sci. 2018, 43, 2192. [Google Scholar] [CrossRef]
  35. Naddeo, A.; Cappetti, N.; Vallone, M.; Califano, R. New trend line of research about comfort evaluation: Proposal of a framework for weighing and evaluating contributes coming from cognitive, postural and physiologic comfort perceptions. In Proceedings of the 5th International Conference on Applied Human Factors and Ergonomics AHFE 2014, Kraków, Poland, 19–23 July 2014. [Google Scholar]
  36. Naddeo, A.; Cappetti, N.; D’Oria, C. Proposal of a new quantitative method for postural comfort evaluation. Int. J. Ind. Ergon. 2015, 48, 25–35. [Google Scholar] [CrossRef]
  37. Da Silva, M.G. Measurements of comfort in vehicles. Meas. Sci. Technol. 2002, 13, R41. [Google Scholar] [CrossRef]
  38. Wang, Y.H. Cognitive Mechanism and Evaluation Method of Human-machine Interaction in Intelligent Vehicle Cockpit. Ph.D. Thesis, Northwestern Polytechnical University, Xianyang, China, 2019. [Google Scholar]
Figure 1. Research framework and analysis process of the intelligent vehicle cockpit comfort evaluation model.
Sustainability 14 06827 g001
Figure 2. Test cockpit situation.
Sustainability 14 06827 g002
Figure 3. Experimental roadmap. The red line indicates the road where we conducted the experiment at Xihua University.
Sustainability 14 06827 g003
Figure 4. Low-frequency noise distribution map. The solid and dashed lines represent the left and right channels of the human ear, respectively.
Sustainability 14 06827 g004
Figure 5. Acceleration working condition.
Sustainability 14 06827 g005
Figure 6. Experimental results of cockpit illumination.
Sustainability 14 06827 g006
Figure 7. Cockpit thermal experiment.
Sustainability 14 06827 g007
Figure 8. Heat map of car price and cockpit technology equipment rate.
Sustainability 14 06827 g008
Figure 9. Cockpit human–computer interaction comfort.
Sustainability 14 06827 g009
Table 1. Subjects’ profile.
GenderMaximum ValueMinimum ValueAverage ValueStandard Deviation
Age/yearsMale472231.758.89
Female452228.637.51
Height/cmMale175168171.632.39
Female173155165.385.07
Bodyweight/kgMale756468.133.47
Female574850.752.68
Body Type
BMI/kg·m2
Male25.9521.7123.151.44
Female23.7316.7118.662.11
Table 2. Comfort scoring criteria.
Comfort SituationUnbearableVery
Uncomfortable
UncomfortableSlightly
Uncomfortable
Comfortable
Score interval[0, 2](2, 4](4, 6](6, 8](8, 10]
0 represents the most uncomfortable state, and 10 represents the most comfortable state. In order to objectively describe the degree of comfort, the 10-point scoring principle was adopted in the comfort evaluation experiment, and the subjects’ scores could be accurate to one decimal place.
Table 3. Acoustic experiment.
StatusFrequency RangeNoise Level dB (A)
Uniform speedLow frequency (<1000 Hz)505560657075808590
Table 4. Illumination experiment.
Color
Temperature
Working
Condition
Illumination (lx)
3500 (K)Uniform speed50100150200250300350400450500550600650700
Table 5. Thermal environment experiments.
Work ConditionsTemperature (°C)
Uniform speed1719212325272931
Table 6. C i j weight assignment.
Binary Weight Difference The   Weight   of   i   ( W i ) The   Weight   of   j   ( W j ) C i j
050501
1055451.2222
3065351.8571
5075253
7085155.6666
9095519
Table 7. Hierarchical analysis judgment matrix.
Acoustic
Environment
Optical
Environment
Thermal
Environment
Human-Computer
Interaction
Acoustic environment11.1901007450.8939393940.785076758
Optical environment0.84026499810.5309246790.603849238
Thermal environment1.1186440681.88350634410.806684734
Human-computer interaction1.27376081.6560424971.2396416571
Table 8. Calculation results of evaluation index weights.
Evaluation Index/
Weighting Calculation Method
Square Root MethodSum-Product MethodInverse Row Sum MethodRow Geometric Mean Method   ω i   ω i / n
Acoustic environment0.23625750.20770920.24394540.24567340.93358560.2333964
Optical environment0.19851890.17453070.14488300.18896210.70689480.1767237
Thermal environment0.26428810.32872980.27288810.25243521.11834110.2795853
Human-computer
interaction
0.30093550.28903030.33828350.31292921.24117860.3102946
Table 9. Objective weighting score table.
Acoustic
Environment
Optical
Environment
Thermal
Environment
Human-Computer
Interaction
Expert 18.18.28.48.5
Expert 27.57.37.67.9
Expert 38.38.28.49.0
Expert 48.27.98.08.7
Expert 58.48.18.28.7
Table 10. Experimental results for Tesla Model 3.
Acoustic
Environment
Optical
Environment
Thermal
Environment
Human-Computer InteractionComprehensive ComfortY
Tesla Model 38.48.58.38.58.58.43
8.68.78.68.78.68.65
8.38.58.48.58.48.43
8.48.68.48.68.58.50
8.28.58.58.88.68.52
8.58.48.68.78.78.56
8.28.38.48.58.48.36
8.38.58.58.68.58.48
Table 11. Correlation analysis results.
Number of Subject SamplesPearsonKendallSpearman
Tesla Model 380.801 *0.803 **0.901 **
Publisher’s Note: MDPI stays neutral with regard to jurisdictional claims in published maps and institutional affiliations.

