
Non-Potable Water Quality Assessment Results for Water Conservation in the Context of a Medical Facility Case Study


Abstract
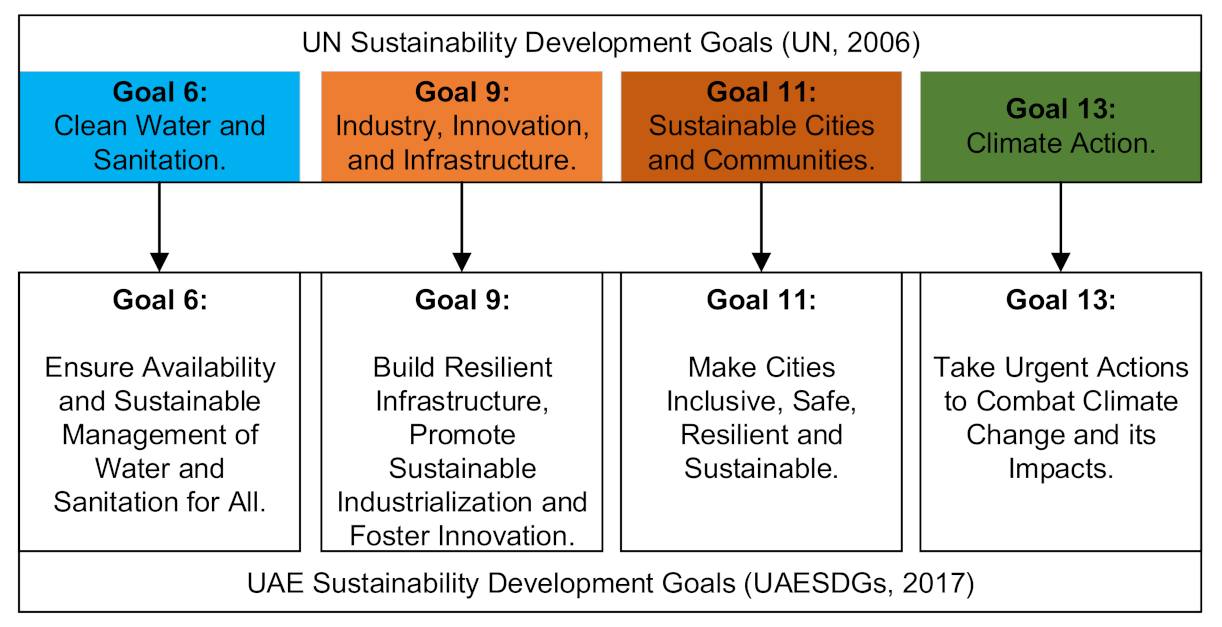
:1. Introduction
- the “Climate Project” (2018) to raise awareness of climate change and the importance of climate resilience;
- the “Climate Innovation Exchange Forum (CLIX)” to facilitate the sourcing and funding of climate change solutions and technologies;
- the “National Climate Change Plan 2050” to support the transition to a climate-resilient green economy while managing GHG emissions, increasing climate adaptation capabilities, and engaging private sector and other stakeholders to support the mitigation and adaptation efforts of the government; and
- the “National Climate Adaptation Program (2017)” to assess the climate adaptation potential of four key sectors (health, energy, infrastructure, and environment) [12].
2. Methodology
2.1. Research Method
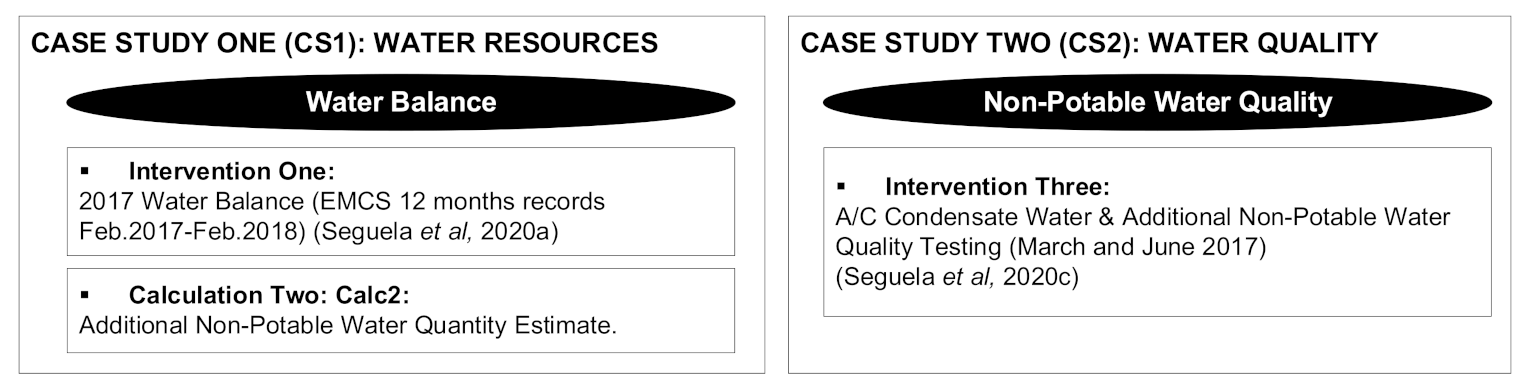
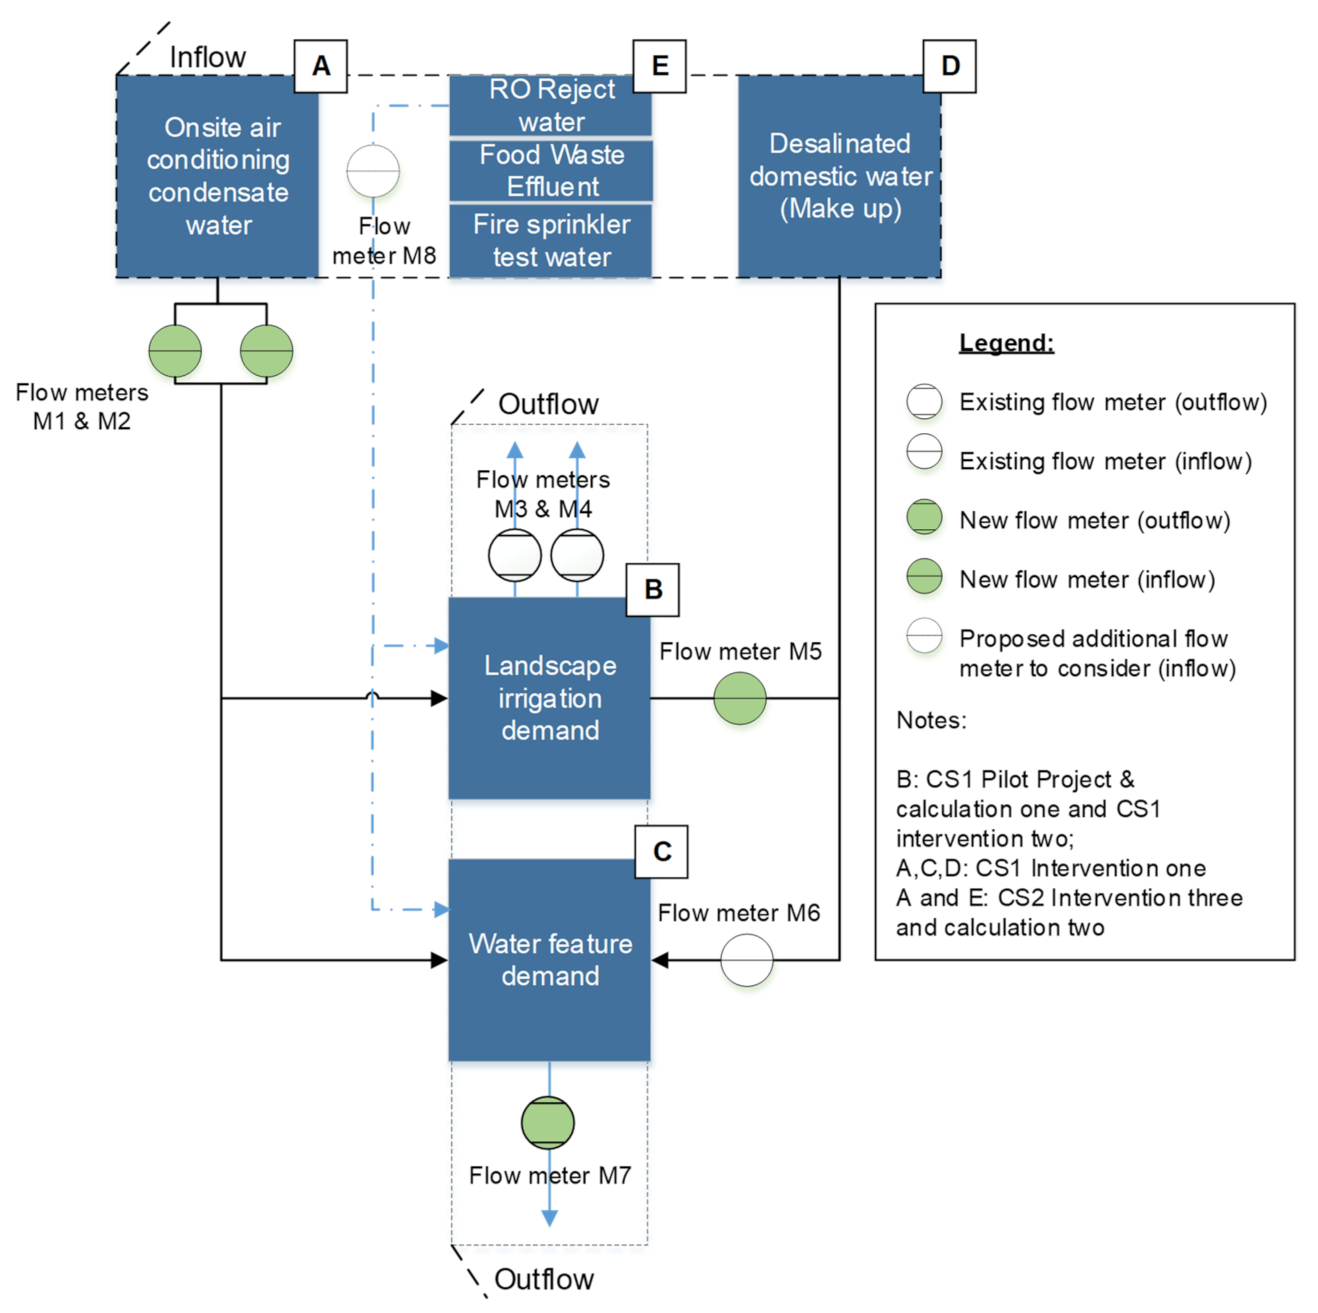
2.2. CS1 Intervention One: Water Resources
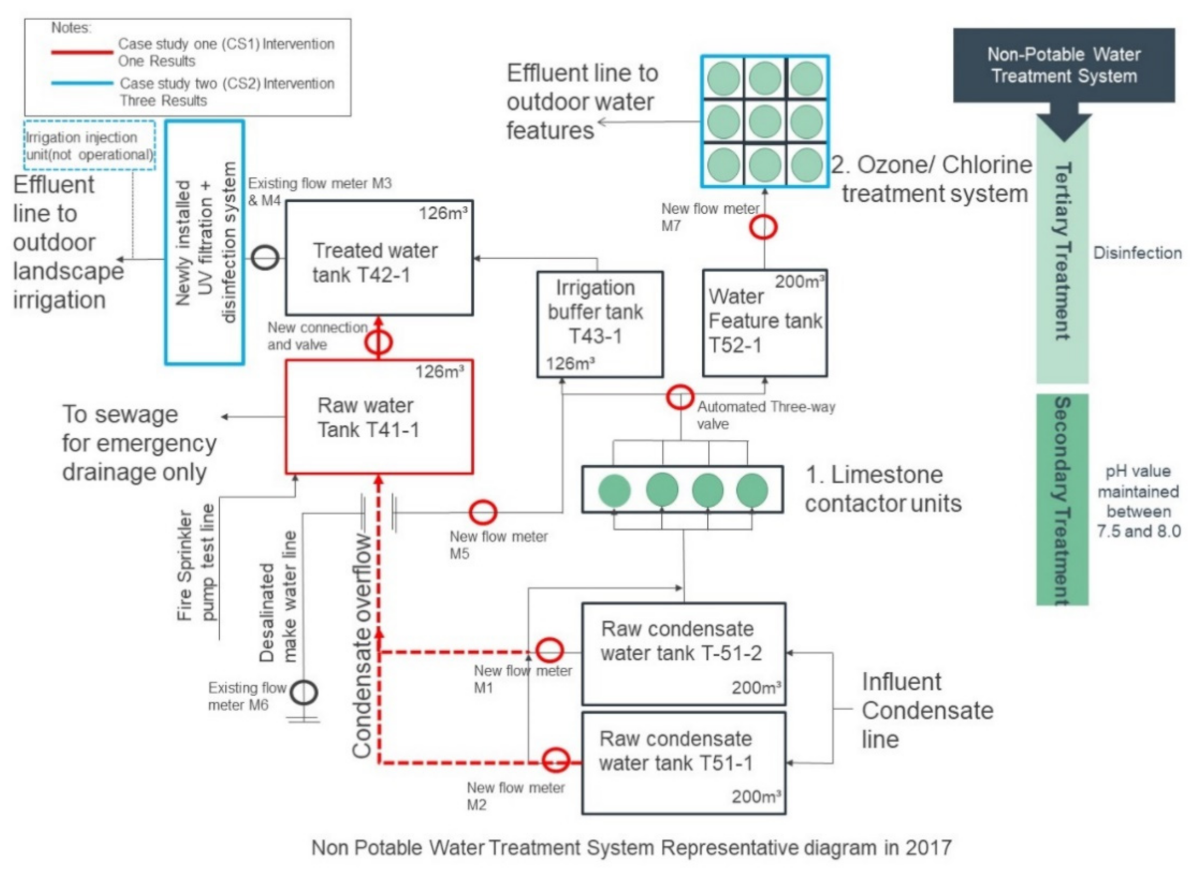
2.3. CS2 Intervention Three: Water Quality
2.4. CS2 Intervention Three: Non-Potable Water Quality Assessment
2.5. CS1 Calculation Two (CS1 Calc2): Additional Non-Potable Water Quantity Estimate
2.5.1. Fire Sprinkler Pump Test Water
2.5.2. Reverse Osmosis Reject Water (RORW)
2.5.3. Food Waste Effluent
2.5.4. Fire Sprinkler Pump Test Water
3. Results
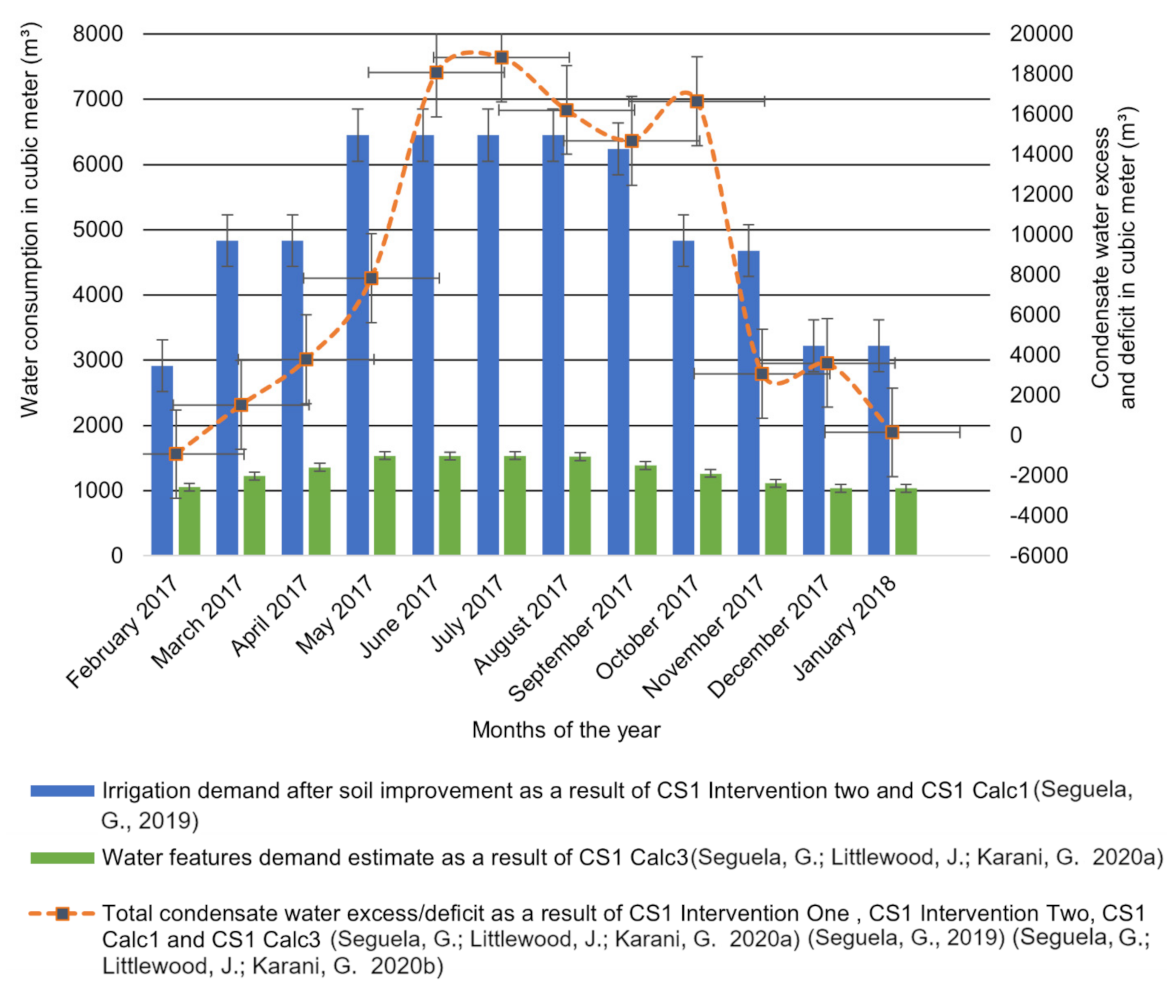
3.1. CS1 Calculation Two (CS1 Calc2) Results: Tackling the Water Deficit
3.1.1. Fire Sprinkler Pump Test Water
3.1.2. Reverse Osmosis Reject Water (RORW)
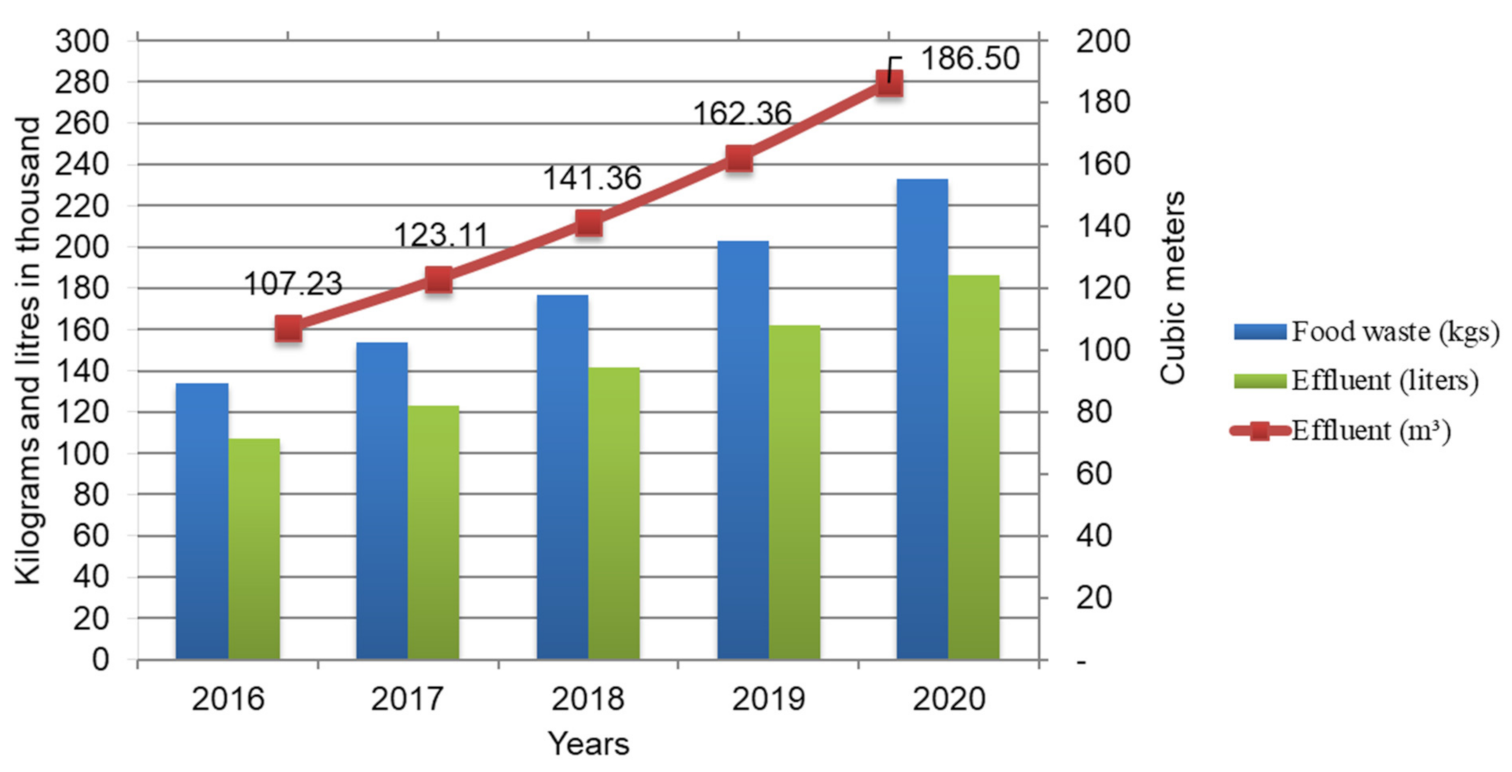
3.1.3. Food Waste Effluent
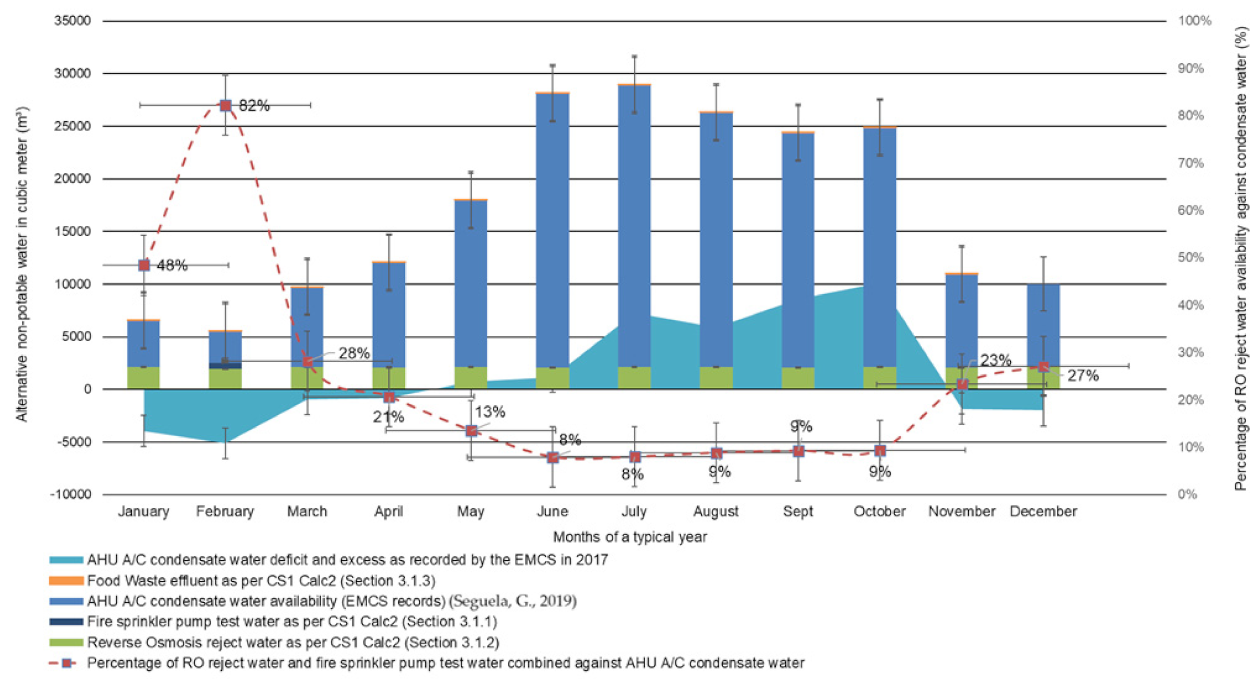
3.1.4. Overall Additional Non-Potable Water Quantity Results
3.2. CS2 Intervention Three Results
3.2.1. Food Waste Effluent
3.2.2. Fire Sprinkler Pump Test Water
3.2.3. Reverse Osmosis Reject Water (RORW)
3.2.4. Heavy Metal Results for All Non-Potable Water Types
3.3. CS2 Intervention Three Non-Potable Water Treatment Risk Assessment
3.4. Water Resources Implications and Risks Summary
4. Discussion
4.1. Interpretation of the Findings
4.1.1. MFCS Alternative Response: Water Demand
4.1.2. MFCS Alternative Response: Non-Potable Water Quality
4.1.3. Existing and Additional Non-Potable Water Sources Reuse Potential
4.1.4. CS2 Water Quality Assessment Outcome
4.1.5. Water Quality Assessment in Relation to Soil Quality
4.2. Contribution One: Case Study Two (CS2) Non-Potable Water Characterization “Fit for Purpose”
4.3. Non-Potable Water Reuse Key Considerations Summary
4.4. Limitations: Laboratory Test Methods
4.5. Future Work
5. Conclusions
- The RSB standard should address these water types for reuse, the type of water treatment required for LI and WF reuse, and their salinity concentration limits;
- Food waste effluent should not be reused for LI because it has the potential to pollute the environment due to heavy metal content;
- Healthcare buildings designed with a RO system should recover, store, and treat RORW (with a TDS < 500 mg/L) for reuse for either LI and/or outdoor WFs use. The RORW quantities generated must be calculated before a recovery system is installed considering an additional pump will need to be installed to convey the recycled reject water to the water storage tank;
- To monitor and measure quantities of RORW and FSPTW, flow meters should be installed at the exit of the water reservoir tanks or at the exit of the system’s line;
- Buildings should recover and treat FSPTW for LI and/or outdoor WFs use;
- NPW treatment systems should be selected “fit for purpose” to maximize operational cost and minimize impact on human safety and the environment.
Author Contributions
Funding
Institutional Review Board Statement
Informed Consent Statement
Conflicts of Interest
Appendix A. CS2 Intervention Three Non-Potable Water Evaluation

| Nutrient Guidelines in Irrigation Water (mg/L), Duncan et al. [14] | ||||||
|---|---|---|---|---|---|---|
| Nutrient Parameters | Symbol | Units | Low | Normal | High | Very High |
| Sulfur | S | mg/L | <10 | 10–30 | 30–60 | >60 |
| Amonium | mg/L | <2 | 2–75 | 75–100 | >100 | |
| Sulfate | mg/L | <30 | 30–90 | 90–180 | >180 | |
| Nitrate | mg/L | <5 | 5–50 | 50–100 | >100 | |
| Calcium | Ca | mg/L | <20 | 20–60 | 60–80 | >80 |
| Magnesium | Mg | mg/L | <10 | 10–25 | 25–35 | >35 |
| Potassium | K | mg/L | <5 | 5–20 | 20–30 | >30 |
| Nitrogen | N | mg/L | <1.1 | 1.1–11.3 | 11.3–22.6 | >22.6 |
| Phosphorous | P | mg/L | <0.01 | 0.1–0.4 | 0.4–0.8 | >0.8 |
| Reclaimed Water Guidelines (mg/L), Duncan et al. [14] | ||||||
| Salinity Parameters | Symbol | Units | Recommended Maximum Values | Desired Range | ||
| Electrical Conductivity | EC | ds/m | 1.5 | 0.40–1.20 | ||
| Sodium | Na | mg/L | 200 | <70 | ||
| Chloride | Cl | mg/L | 250 | <70 (root injury/foliage uptake injury) <100(if sprinkler used on foliage) | ||
| Boron (micronutrient) | B | mg/L | 0.5 | <0.5 | ||
| Bicarbonate | mg/L | 250 | <120; <90 (if sprinkler used on foliage) | |||
| Total Dissolved Solids | TDS | mg/L | 960 | 256–832 | ||
| Sodium adsorption ratio | SAR | meq/L | 5.7 | <6 | ||
| Irrigation Criteria for Trace Elements (mg/L), RSB [26,53] | ||||||
| Trace Elements | Symbol | Units | Maximum Allowable Concentration | |||
| Alumnium | Al | mg/L | 5 | |||
| Arsenic | As | mg/L | 0.1 | |||
| Beryllium | Be | mg/L | 0.1 | |||
| Cadmium | Cd | mg/L | 0.01 | |||
| Chromium | Cr | mg/L | 0.1 | |||
| Cobalt | Co | mg/L | 0.05 | |||
| Copper | Cu | mg/L | 0.2 | |||
| Fluoride | F | mg/L | 1 | |||
| Iron | Fe | mg/L | 5 | |||
| Lead | Pb | mg/l | 5 | |||
| Lithium | Li | mg/L | 2.5 | |||
| Manganese (micronutrient) | Mn | mg/L | 0.2 | |||
| Molybdenum (micronutrient) | Mo | mg/L | 0.01 | |||
| Nickel | Ni | mg/L | 0.2 | |||
| Selenium | Se | mg/L | 0.02 | |||
| Vanadium | mg/L | 0.1 | ||||
| Zinc (micronutrient) | Zn | mg/L | 2 | |||
| Microbiology Recycled Water Quality (mg/L), RSB [26,53] | ||||||
| Microbiology Parameters | Symbol | Units | Maximum Allowable Concentration | |||
| Fecal Coliforms | - | CFU/mL | 100 | |||
| Helminths Ova (parasitic worms) | - | CFU/mL | <1 | |||
| Intestinal Enterococci | - | CFU/mL | 40 | |||
| Sanitary Recycled Water Quality (mg/L), RSB [26] | ||||||
| Sanitary Parameters | Symbol | Units | Maximum Allowable Concentration | |||
| pH | - | - | 6 to 8 | |||
| Biological Oxygen Demand | BOD | mg/L | 10 | |||
| Total Suspended Solids | TSS | mg/L | 10 | |||
| Ammonia Nitrogen | NH4-N | mg/L | - | |||
| Total Phosphorous | mg/L | - | ||||
| Turbidity | NTU | 5 | ||||
| Residual Chlorine | mg/L | 0.5 to 1 | ||||
| Dissolved Oxygen | DO | mg/L | ≥1 | |||
References
- Seguela, G.; Littlewood, J.; Karani, G. Water resource management in the context of a non-potable water reuse case study in arid climate. Energ. Ecol. Environ. 2020, 5, 369–388. [Google Scholar] [CrossRef]
- Seguela, G. Implementation and Evaluation of an Outdoor Water Conservation Strategy for Hospital Decarbonisation in an Arid Climate. Ph.D. Thesis, Cardiff Metropolitan University, Cardiff, Wales, 2019. [Google Scholar]
- Seguela, G.; Littlewood, J.R.; Karani, G. A GHG metric methodology to assess onsite buildings non-potable water system for outdoor landscape use. App. Sci. 2020, 10, 1339. [Google Scholar] [CrossRef] [Green Version]
- Verner, D. MENA Development Report. Adaptation to a Changing Climate in the Arab Countries: A Case for Adaptation Governance and Leadership in Building Climate Resilience; World Bank: Washington, DC, USA, 2012. [Google Scholar]
- Zeitoon, B.; Saab, N.; El-Ashry, M.L. (Eds.) Arab Environment Water: Sustainable Management of a Scarce Resource; Arab Forum for environment and Development: Beirut, Lebanon, 2010. [Google Scholar]
- Pacia, D.; Yeh, D. Adaptation to climate for water utilities. In Water Reclamation and Sustainability; Ahuja, S., Ed.; Elsevier: San Diego, CA, USA, 2014; pp. 19–56. [Google Scholar]
- United Nations. The Sustainable Development Goals 2020 Report. Available online: https://unstats.un.org/sdgs/report/2020/ (accessed on 10 October 2021).
- United Arab Emirates Government. The Sustainable Development Goals. Available online: https://uaesdgs.ae/en/goals (accessed on 10 October 2021).
- United Arab Emirates Government. The UAE Water Security Strategy 2036. Available online: https://u.ae/en/about-the-uae/strategies-initiatives-and-awards/federal-governments-strategies-and-plans/the-uae-water-security-strategy-2036 (accessed on 10 October 2021).
- United Arab Emirates Government. Annual CSR National Index Launched (Media Release). Available online: https://uaecabinet.ae/en/details/news/annual-csr-national-index-launched (accessed on 10 October 2021).
- United Arab Emirates Government. UAE SDGs—Goal 11: Make Cities Inclusive, Safe, Resilient and Sustainable. Available online: https://uaesdgs.ae/en/goals/sustainable-cities-and-communities (accessed on 10 October 2021).
- United Arab Emirates Government. UAE SDGs—Goal 13: Take Urgent Action to Combat Climate Change and Its Impacts. Available online: https://uaesdgs.ae/en/goals/climate-action (accessed on 10 October 2021).
- Ministry of Environment and Water. Ministerial Resolution Number (476) of the Year 2007 Concerning by-Law of AGCC Fertilizers and Agricultural Soil Conditioners Law. Available online: https://www.moccae.gov.ae/assets/download/e4e8ae38/476.pdf.aspx (accessed on 3 May 2021).
- Duncan, R.R.; Carrow, R.N.; Huck, M.T. Turfgrass and Landscape Irrigation Water Quality: Assessment and Management; CRC Press: Boca Raton, FL, USA, 2009. [Google Scholar]
- Loveless, K.J.; Ghaffour, N.; Farooq, A. Collection of condensate water: Global potential and water quality impacts. Water Resour. Manag. 2013, 27, 1351–1361. [Google Scholar] [CrossRef] [Green Version]
- Ali Khan, S.A.; Al-Zubaidy, S.N. Conservation of potable water using chilled water condensate from air conditioning machines in hot & humid climate. Int. J. Engin. Innov. Tech. 2013, 3, 182–188. [Google Scholar]
- Licina, D.; Sekhar, C. Energy and water conservation from air handling unit condensate in hot and humid climates. Energy Build. 2012, 45, 257–263. [Google Scholar] [CrossRef]
- Lawrence, T.; Darwich, A.K.; Means, J.K.; Boyle, S. ASHRAE Green Guide. Design, Construction, and Operation of Sustainable Buildings, 4th ed.; ASHRAE: Atlanta, GA, USA, 2013. [Google Scholar]
- Cabrera, R. Non-potable water sources for urban landscape irrigation in arid regions. J. Arid Land Stud. 2014, 24, 89–92. [Google Scholar]
- Kant, S.; Jaber, F.; Qiblawey, H. A/C condensate for water reuse: An approach towards environmental sustainability in Doha. In American Society of Agricultural and Biological Engineers Annual International Meeting; American Society of Agricultural and Biological Engineers: Dallas, TX, USA, 2012; Available online: https://www.scopus.com/record/display.uri?eid=2-s2.0-84871779776&origin=inward&txGid=afa8008826f25b73ba602558217b2506 (accessed on 10 October 2021).
- Bryant, J.A.; Ahmed, T. Condensate water collection for an institutional building in Doha, Qatar: An opportunity for water sustainability. In Proceedings of the Sixteenth Symposium on Improving Building Systems in Hot and Humid Climates; IJEIT: Plano, TX, USA, 2008; Available online: http://www.ijeit.com/Vol%203/Issue%202/IJEIT1412201308_34.pdf (accessed on 6 February 2017).
- Creswell, J.W.; Plano Clark, V.L. Designing and Conducting Mixed Methods Research, 2nd ed.; Sage: London, UK, 2011. [Google Scholar]
- Yin, R.K. Case Study Research: Design and Methods, 5th ed.; Sage: Thousand Oaks, CA, USA, 2014. [Google Scholar]
- Seguela, G.; Littlewood, J.R.; Karani, G. Onsite food waste processing as an opportunity to conserve water in a medical facility case study, Abu Dhabi. Energy Procedia 2017, 111, 548–557. [Google Scholar] [CrossRef]
- Seguela, G.; Littlewood, J.; Karani, G. Non-potable water quality assessment methodology for water conservation in arid climates. Water Conserv. Sci. Engin. 2020, 5, 215–234. [Google Scholar] [CrossRef]
- Regulatory Supervision Bureau. Guide to Recycled Water and Biosolids Regulations 2010; Regulatory Supervision Bureau: Abu Dhabi, United Arab Emirates, 2010. Available online: http://rsb.gov.ae/assets/documents/264/regsrwb2010.pdf (accessed on 12 September 2012).
- NFPA. National Fire Protection Association. Standard for Service Tests of Fire Pump Systems on Fire Apparatus. 2001. Available online: https://www.nfpa.org/assets/files/AboutTheCodes/1911/1911-A2002-rop.pdf (accessed on 6 February 2017).
- Plumbing Industry Commission. Guide to Fire Sprinkler System Water Saving. 2008. Available online: https://www.citywestwater.com.au/documents/guide_to_fire_sprinkler_system.pdf (accessed on 6 February 2017).
- Department of Municipal Affairs and Transport. Abu Dhabi International Building Code: Plumbing Systems; UAE Government: Abu Dhabi, United Arab Emirates, 2013. [Google Scholar]
- American Water Works Association. Water Treatment: Principles and Practices of Water Supply Operations, 4th ed.; AWWA: Denver, CO, USA, 2010. [Google Scholar]
- United States Environment Protection Agency. 2012 Guidelines for Water Reuse; EPA: Washington, DC, USA, 2012; Available online: https://watereuse.org/wp-content/uploads/2015/04/epa-2012-guidelines-for-water-reuse.pdf (accessed on 3 January 2017).
- Victorian Government Department of Health. Guidelines for Water Reuse and Recycling in Victorian Healthcare Facilities; Government of Victoria: Melbourne, Australia, 2009. Available online: https://www2.health.vic.gov.au/Api/downloadmedia/%7B949656D2-00DA-486E-B450-84C75D71A0BF%7D (accessed on 25 February 2016).
- Atura. Handbook for Reusing or Recycling RORW from Haemodialysis in Healthcare Facilities; Melbourne Health: Melbourne, Australia, 2013; Available online: https://waterportal.com.au/swf/images/swf-files/62r-2056-handbook.pdf (accessed on 6 February 2017).
- Rasmussen, J.; Bergstrom, B. Food waste diversion at urban university. BioCycle 2011, 52, 34. Available online: http://www.biocycle.net/2011/12/19/food-waste-diversion-at-urban-university/ (accessed on 25 February 2016).
- Glawe, D. San Antonio Condensate Collection and Use Manual for Commercial Buildings; City of San Antonio: San Antonio, CA, USA, 2013; Available online: http://www.saws.org/conservation/commercial/Condensate/docs/SACCUManual_20131021.pdf (accessed on 4 April 2015).
- World Health Organization. Guidelines for Drinking-Water Quality, 4th ed.; WHO: Geneva, Switzerland, 2011; Available online: http://apps.who.int/iris/bitstream/10665/44584/1/9789241548151_eng.pdf (accessed on 25 February 2016).
- Seguela, G.; Littlewood, J.R.; Karani, G. A study to assess non-potable water sources for reducing energy consumption in a medical facility case study, Abu Dhabi. Energy Procedia 2017, 134, 797–806. [Google Scholar] [CrossRef]
- Seguela, G.; Littlewood, J.R.; Karani, G. Eco-engineering strategies for soil restoration and water conservation: Investigating the application of soil improvements in a semi-arid climate in a Medical Facility Case Study, Abu Dhabi. J. Ecol. Engin. 2017, 121, 53–64. [Google Scholar] [CrossRef]
- Ayers, R.S.; Westcot, D.W. Water Quality for Agriculture; FAO Irrigation and Drainage Paper 29; Food and Agriculture Organization: Rome, Italy, 1994; Available online: http://www.fao.org/DOCREP/003/T0234E/T0234E00.htm#TOC (accessed on 17 August 2017).
- Bedbabis, S.; Ben Rouina, B.; Boukhris, M.; Ferrara, G. Effect of irrigation with treated wastewater on soil chemical properties and infiltration rate. J. Environ. Manag. 2014, 133, 45–50. [Google Scholar] [CrossRef] [PubMed]
- Asano, T.; Burton, F.L.; Leverenz, H.L.; Tsuchihashi, R.; Tchobanoglous, G. Water Reuse: Issues, Technologies, and Applications; McGraw Hill: New York, NY, USA, 2007. [Google Scholar]
- Wu, T.Y.; Mohammad, A.W.; Lim, S.L.; Lim, P.N.; Hay, J.X.W. Recent advances in the reuse of wastewaters for promoting sustainable development. In Wastewater Reuse and Management; Sharma, S., Sanghi, R., Eds.; Springer: New York, NY, USA; London, UK, 2013. [Google Scholar]
- Rhee, H.P.; Yoon, C.G.; Son, Y.K.; Jang, J.H. Quantitative risk assessment for reclaimed wastewater irrigation on paddy rice field in Korea. Paddy Water Environ. 2011, 9, 183–191. [Google Scholar] [CrossRef]
- World Health Organization. Heterotrophic Plate Counts and Drinking-Water Safety: The Significance of HPCs for Water Quality and Human Health; WHO: Geneva, Switzerland, 2003; Available online: http://apps.who.int/iris/bitstream/10665/42612/1/9241562269.pdf?ua=1 (accessed on 25 May 2017).
- Flynn, R. Interpreting Soil Tests: Unlock the Secrets of Your Soil; New Mexico State University: Las Cruces, NM, USA, 2015; Available online: http://aces.nmsu.edu/pubs/_circulars/CR676.pdf (accessed on 20 September 2017).
- Lado, M.; Ben-Hur, M. Treated domestic sewage irrigation effects on soil hydraulic properties in arid and semiarid zones: A review. Soil Tillage Res. 2009, 106, 152–163. [Google Scholar] [CrossRef]
- El-Nahhal, Y.; Tubail, K.; Safi, M.; Safi, J. Effect of treated waste water irrigation on plant growth and soil properties in Gaza Strip, Palestine. Am. J. Plant Sci. 2013, 4, 1736–1743. [Google Scholar] [CrossRef] [Green Version]
- Weber, S.; Khan, S.; Hollender, J. Human risk assessment of organic contaminants in reclaimed wastewater used for irrigation. Desalination 2009, 187, 53–64. [Google Scholar] [CrossRef] [Green Version]
- Jasim, S.Y.; Saththasivam, J.; Loganathan, K.; Ogunbiyi, O. Reuse of treated sewage effluent (TSE) in Qatar. J. Water Process Engin. 2016, 11, 174–182. [Google Scholar] [CrossRef]
- Dawood, M.A.; Sallam, O.M.; Abdelfattah, A.A. Treated wastewater management and reuse in arid regions: Abu Dhabi case study. In Proceedings of the 10th Gulf Water Conference, Manama, Bahrein, 22–24 April 2012. [Google Scholar]
- Xu, J.; Laosheng, W.; Andrew, W.; Zhanga, Y. Impact of long-term reclaimed wastewater irrigation on agricultural soils: A preliminary assessment. J. Hazard. Mater. 2010, 183, 780–786. [Google Scholar] [CrossRef] [PubMed]
- Benitez, E.; Romero, E.; Gómez, M.; Gallardo-Lara, F.; Nogales, R. Biosolids and biosolids-ash as sources of heavy metals in a plant-soil system. Water Air Soil Pollut. 2001, 132, 75–87. Available online: https://link.springer.com/article/10.1023%2FA%3A1012012924151 (accessed on 10 December 2017). [CrossRef]
- Regulation Supervision Bureau. The Water Quality Regulations (Fourth Edition); UAE Government: Abu Dhabi, United Arab Emirates, 2014. Available online: http://rsb.gov.ae/assets/documents/366/regswaterquality4thedition.pdf (accessed on 12 September 2012).


| P3 Reverse Osmosis (RO) and RO Water Parameters | Units | Reject Water | |
|---|---|---|---|
| RO One | RO Two | ||
| Run-time operation | hours/day | 24 | 8 |
| RO size | m3/hour | 3.3 | 2.8 |
| Salt rejection rate | % | 98 | 98 |
| Feed water recovery rate | % | 70 | 60 |
| Fire Pump Tests | Gallons per Minute (gpm) | Liters per Minute (lpm) | Test One Water Usage in lpm (Equation (1)) | Test Two Water Usage in lpm (Equation (2)) | Total Water Usage in m3(Equation (3)) |
|---|---|---|---|---|---|
| Pump 1 | 1250 | 4732 | 94,640 | 141,960 | 473.20 |
| Pump 2 | 1250 | 4732 | 94,640 | 141,960 | |
| Pump 3 | 500 | 1893 | 37,860 | 56,790 | 189.30 |
| Pump 4 | 500 | 1893 | 37,860 | 56,790 | |
| Pump 5 | 750 | 2839 | 56,780 | 85,170 | 283.90 |
| Pump 6 | 750 | 2839 | 56,780 | 85,170 | |
| Pump 7 | 500 | 1893 | 37,860 | 56,790 | 189.30 |
| Pump 8 | 500 | 1893 | 37,860 | 56,790 | |
| Total water usage in m3 | 1136 (round off) | ||||
| Raw Food Waste Effluent Tested by Location and by Date | pH | BOD (mg/L) | DO (mg/L) | TSS (mg/L) | TDS (mg/L) | Residual Chlorine (mg/L) |
|---|---|---|---|---|---|---|
| Hotel A 1 December 2015 [24] | 3.54 | 18 | - | 10 | 84 | - |
| University 1 May 2016 [24] | 3.15 | 65 | 5.7 | <6 | 190 | 0.03 |
| Hotel B 4 May 2016 [24] | 3.02 | 5 | 5.3 | 8 | 308 | <0.02 |
| MFCS 22 September 2016 | 2.7 | 57,200 | - | 10 | 706 | - |
| MFCS 26 September 2016 | 4.8 | 42,400 | - | <6 | 452 | - |
| MFCS 29 September 2016 | 3.11 | 52,460 | - | 10 | 690 | - |
| MFCS 4 October 2016 | 3.98 | 10,200 | - | <6 | 242 | - |
| MFCS 3 November 2016 | 3.68 | 405 | 4.5 | - | 180 | 0.12 |
| MFCS 22 November 2016 | 3.76 | 105 | 4.5 | - | 120 | 0.12 |
| MFCS 29 November 2016 | 3.84 | 405 | 4.5 | - | 210 | 0.14 |
| MFCS 06 December 2016 | 2.86 | - | 4.5 | - | 160 | 0.12 |
| MFCS 7 December 2016 | 2.81 | 655 | - | - | - | - |
| MFCS 8 December 2016 | 2.48 | 1260 | - | - | - | - |
| MFCS 14 December 2016 | 2.37 | 805 | - | - | - | - |
| RSB recommended values for water recycling [26] | 6 to 8 | 10 | ≥1 | 10 | - | 0.5 to 1 |
| Duncan et al., recommended values [14] | 6.5 to 8.4 | - | - | - | <960 | <1 |
| US EPA recommended values [31] | 6 to 9 | ≤10 | <1 |
| Raw Food Waste Effluent Tested by Location and by Date | Faecal Coliforms (CFU/100 mL) | Intestinal Enterococci (CFU/100 mL) | Helminth Ova (Number/L) |
|---|---|---|---|
| Hotel A 1 December 2015 [24] | <1.8 | non-detectable | non-detectable |
| University 1 May 2016 [24] | <1.8 | non-detectable | non-detectable |
| Hotel B 4 May 2016 [24] | <1.8 | non-detectable | non-detectable |
| MFCS 3 November 2016 | not tested | not tested | non-detectable |
| MFCS 22 November 2016 | not tested | not tested | non-detectable |
| MFCS 29 November 2016 | not tested | not tested | non-detectable |
| MFCS 6 December 2016 | not tested | not tested | non-detectable |
| RSB recommended values for water recycling [26] | 100 | 40 | <1 |
| US EPA recommended values [31] | non-detectable | - | - |
| Fire Pump Test Water Tested by Location and by Date | pH | BOD (mg/L) | DO (mg/L) | TSS (mg/L) | TDS (mg/L) | Residual Chlorine (mg/L) |
|---|---|---|---|---|---|---|
| Sample one (7 March 2017) | 7.99 | 27 | 5.6 | 56 | 106 | 0.02 |
| Sample two (7 March 2017) | 8.05 | 19 | 5.7 | 38 | 98 | <0.02 |
| RSB recommended values for water recycling [26] | 6 to 8 | 10 | ≥1 | 10 | - | 0.5 to 1 |
| Duncan et al., recommended values [14] | 6.5 to 8.4 | - | - | - | <960 | <1 |
| US EPA recommended values [31] | 6 to 9 | ≤10 | >5 | - | - | <1 |
| Fire Pump Test Water Tested by Location and by Date | Faecal Coliforms (CFU/100 mL) | Total Bacterial Count (Heterotrophic Plate Count) (CFU/100 mL) | Helminth Ova (Number/L) |
|---|---|---|---|
| Sample one (7 March 2017) | <1 | 2100 | non-detectable |
| Sample two (7 March 2017) | <1 | 1900 | non-detectable |
| RSB recommended values for water recycling [27] | 100 | - | <1 |
| US EPA recommended values [32] | non-detectable | - | - |
| World Health Organization [3] | - | <500 | - |
| Reverse Osmosis Reject Water Tested by Date | pH | BOD (mg/L) | DO (mg/L) | TSS (mg/L) | TDS (mg/L) | Residual Chlorine (mg/L) |
|---|---|---|---|---|---|---|
| 3 June 2017 | 6.4 | <3 | 6.2 | <6 | 7 | <0.02 |
| October 2017 tested by others | 7.1 | - | - | - | 320 | - |
| RSB recommended values for water recycling [26] | 6 to 8 | 10 | ≥1 | 10 | - | 0.5 to 1 |
| Duncan et al., recommended values [14] | 6 to 8 | - | - | - | <960 | <1 |
| US EPA recommended values [31] | 6 to 9 | ≤10 | - | - | - | <1 |
| RORW Tested by Date | Fecal Coliforms (CFU/100 mL) | Total Bacterial Count (Heterotrophic Plate Count) (CFU/100 mL) | Pseudomonas aeruginosa (CFU/100 mL) |
|---|---|---|---|
| 3 June 2017 | <1 | 1500 | non-detectable |
| RSB recommended values for water recycling [26] | 100 | - | <1 |
| US EPA recommended values [31] | non-detectable | - | - |
| World Health Organization [36] | - | <500 | - |
| Non-Potable Water Types | Cadmium (mg/L) | Copper (mg/L) | Zinc (mg/L) | Aluminium (mg/L) | Selenium (mg/L) | Cobalt (mg/L) |
|---|---|---|---|---|---|---|
| Treated condensate water (2017) | <0.002 | <0.002 | <0.001 | <0.005 | <0.001 | <0.02 |
| Raw fire sprinkler pump test wastewater (2017) | <0.002 | <0.002 | <0.001 | <0.005 | <0.001 | <0.002 |
| Raw reverse osmosis reject water (2017) | <0.002 | <0.002 | <0.001 | <0.005 | <0.001 | <0.002 |
| Raw food waste effluent wastewater (October 2016) | <0.002 | 0.553 | 0.458 | 9.30 | 0.042 | <0.002 |
| Water Resources and Associated Issues | Implications for the Audience Target | Risks |
|---|---|---|
| Condensate water, RORW, FSPTW | Monitor quantities for reuse by flow metering | Water wastage |
| Non-potable system including all non-potable water types | Provide sufficient long-term storage at design stage preferably to minimize cost | Water wastage |
| Water system automation | ||
| Condensate water, FSTW, RORW | Reuse for LI and WFs providing it is going through a tertiary treatment system | BOD, bacterial counts, and Legionella prevention |
| WF water chemical treatment | Treatment system automation | Environmental pollution and human health impact |
| Water conservation training and awareness | Wastewater treatment technician and mechanical engineers to receive quarterly refresher training on water quality requirements, testing, and chemical dosing monitoring | Environmental pollution |
| Parameters Tested | FSPTW in 2017 | Food Waste Effluent Wastewater Average (2015–2016) | Condensate Water in 2017 | RORW in 2017 | Ayers and Wescot [13]; Duncan et al. [14] | ||||
|---|---|---|---|---|---|---|---|---|---|
| R | T | R | T | R | T | R | T | Recommendations | |
| Salinity parameters | |||||||||
| TDS (mg/L) | 102 | - | 345 | - | 35 | 56 | 320 | - | <960 |
| EC (ds/m) | 0.15 | - | 0.5 | - | 0.05 | 0.09 | 0.5 | - | >0.7 |
| Sodium (mg/L) | 11.05 | - | 18.66 | 3.7 | 5.8 | 0.8 | - | <200 | |
| SAR (meq/L) | 0.5 | - | 1.83 | - | 0.6 | 0.4 | not detected | - | <6 |
| Macronutrients | Duncan et al. [14] | ||||||||
| Calcium (mg/L) | 37 | - | 5.6 | - | 9 | 12 | not detected | - | 20–60 |
| Magnesium (mg/L) | 1.7 | - | 1.5 | - | 2.6 | 2.4 | not detected | - | 10–25 |
| Potassium (mg/L) | 1.5 | - | - | - | 0.8 | 0.8 | not detected | - | 5–20 |
| Sanitary parameters | RSB requirements [26] | ||||||||
| pH | 8 | - | 3.2 | - | 7.1 | 8 | 6.4 | - | 6–8 |
| BOD (mg/L) | 23 | - | 16,590 | - | 3.5 | <3 | <3 | - | <10 |
| DO (mg/L) | 5.6 | - | 4.8 | - | 7.6 | 6.5 | 6.2 | - | >1 |
| Microbiology parameters | WHO [36] | ||||||||
| Bacterial counts (CFU/100 mL) | 2000 | - | - | 173 | <1 | 1500 | <500 | ||
| Potential Water Infiltration Problem | ||
|---|---|---|
| SAR of Soil | Unlikely If EC Is | Likely If EC Is |
| Electrical Conductivity (EC) in dS/m | ||
| 0–3 | >0.7 | <0.3 |
| 3.1–12 | >2.0 | <0.5 |
| 12.1–20 | >3.0 | <1.0 |
| 20.1–40 | >5.0 | <2.0 |
| Non-Potable Water Types for Reuse for LI and WFs | Key Issues to Consider (See Table A1 for Non-Potable Water Reuse Recommendations Limits and Quality Risk Assessment) | Impact | |||
|---|---|---|---|---|---|
| Soil Infiltration | Pipe Corrosion | Soil Pollution | Human Health | ||
| Condensate Water | Test EC, SAR, pH levels, and bacterial counts | X | X | X | |
| RORW | Test TDS, EC, SAR, pH levels, and bacterial counts | X | X | ||
| Food waste effluent | Test heavy metals, such as aluminium and copper levels, BOD, pH, and bacterial counts | X | X | ||
| FSPTW | Test BOD, TDS, and bacterial counts | X | X | ||
Publisher’s Note: MDPI stays neutral with regard to jurisdictional claims in published maps and institutional affiliations. |
© 2022 by the authors. Licensee MDPI, Basel, Switzerland. This article is an open access article distributed under the terms and conditions of the Creative Commons Attribution (CC BY) license (https://creativecommons.org/licenses/by/4.0/).
Share and Cite
Seguela, G.; Littlewood, J.R.; Karani, G. Non-Potable Water Quality Assessment Results for Water Conservation in the Context of a Medical Facility Case Study. Sustainability 2022, 14, 6578. https://doi.org/10.3390/su14116578
Seguela G, Littlewood JR, Karani G. Non-Potable Water Quality Assessment Results for Water Conservation in the Context of a Medical Facility Case Study. Sustainability. 2022; 14(11):6578. https://doi.org/10.3390/su14116578
Chicago/Turabian StyleSeguela, Geraldine, John Richard Littlewood, and George Karani. 2022. "Non-Potable Water Quality Assessment Results for Water Conservation in the Context of a Medical Facility Case Study" Sustainability 14, no. 11: 6578. https://doi.org/10.3390/su14116578
APA StyleSeguela, G., Littlewood, J. R., & Karani, G. (2022). Non-Potable Water Quality Assessment Results for Water Conservation in the Context of a Medical Facility Case Study. Sustainability, 14(11), 6578. https://doi.org/10.3390/su14116578