Article

Source Discrimination of Mine Gushing Water Using Self-Organizing Feature Maps: A Case Study in Ningtiaota Coal Mine, Shaanxi, China

1
National Engineering Research Center of Coal Mine Water Hazard Controlling, Beijing 100083, China
2
College of Geoscience and Surveying Engineering, China University of Mining and Technology, Beijing 100083, China
*
Author to whom correspondence should be addressed.
Sustainability 2022, 14(11), 6551; https://doi.org/10.3390/su14116551
Submission received: 27 April 2022 / Revised: 23 May 2022 / Accepted: 24 May 2022 / Published: 27 May 2022
(This article belongs to the Special Issue Application of Isotope Techniques on Water Resources Management)

Abstract

:
Currently, there is a contradiction between coal mining and protection of water resources, meaning that there is a need for an effective method for discriminating the source of mine gushing water. Ningtiaota Coal Mine is a typical and representative main coal mine in the Shennan mining area. Taking this coal mine as an example, the self-organizing feature map (SOM) approach was applied to source discrimination of mine gushing water. Fisher discriminant analysis, water temperature, and traditional hydrogeochemical discrimination methods, such as Piper and Gibbs diagrams, were also employed as auxiliary indicators to verify and analyze the results of the SOM approach. The results from the three methods showed that the source of all the gushing water samples was surface water. This study represents the innovative use of an SOM in source discrimination for the first time. This approach has the advantages of high precision, high efficiency, good visualization, and less human interference. It can quantify sources while also comprehensively considering their hydrogeochemical characteristics, and it is especially suitable for case studies with large sample sizes. This research provides a more satisfactory solution for water inrush traceability, water disaster prevention and control, ecological protection, coal mine safety, and policy intervention.

1. Introduction

There are 36 coal mines in China with a production capacity of greater than 10 Mt/a, and the total production capacity of these mines is as high as 612 Mt/a. Three of these mines are located in the Shennan mining area, namely, Hongliulin, Zhangjiamao, and Ningtiaota coal mines. The Shennan mining area is located at the border of the Northern Shaanxi Plateau and the Maowusu Desert in northwestern China. The western part of the mining area is a relatively flat desert beach area, and the eastern part is a fragmented loess gully area. The mining area is arid and rainless, with a large amount of evaporation. It has sparse vegetation and serious soil erosion. For a long time, the Shennan mining area has been short of water resources. Most of the water for production and domestic use is taken from the groundwater of the Quaternary Salawusu Formation and burnt rock water in the mining area. Various water resources in the area are affected to varying degrees by the large-scale mining of coal. The contradiction between coal mining and the protection of water resources has become increasingly prominent, and problems with water resources are becoming increasingly significant.
The Ningtiaota Coal Mine is a super-large main coal mine, and its production capacity is 12 Mt/a. Due to its specific features and representativeness, this mine has attracted the attention of a large number of researchers. Stable hydrogen and oxygen isotopic and hydrochemical data were used by Huang et al. [1] to study the water–rock interactions and the sources and mechanisms of groundwater recharge and drainage. Their research provided a reference for water resource management and water inrush prevention in other coal mines. In addition, the finite element theory was used by Xie et al. [2] to analyze and solve the groundwater flow field and simulate the impact of coal mining on the upper aquifer. Hou et al. [3] used distance discriminant analysis, Bayes discriminant analysis, and Fisher discriminant analysis (FDA) to establish a mine-water source-identification model, and they compared the applicable conditions, sample size, accuracy, and identification capabilities of different models. Liu et al. [4] applied a hydraulic tomography technique to perform water-releasing tests on the coal mine, by which the characterization of water hazard aquifers was achieved. However, there have been few studies considering the identification of the sources of gushing water in mines in the Shennan mining area. This is a very urgent problem that needs to be addressed so that targeted and effective prevention and control measures can be taken. Discrimination of mine-water inflow sources has a positive effect on the preservation, development, and utilization of water resources, coal mine safety, and ecological and environmental protection. It can also provide theoretical guidance for the formulation of water-preserving coal-mining plans and water inflow prevention measures.
With the continuous and large-scale mining of coal resources, there are hidden hazards to mine safety. In particular, the more serious and frequent disasters caused by water inrush in mines lead to serious threats to human life and property [5,6,7]. Take Ningtiaota coal mine as an example: the roof first weighting of the first working face, S1210, in the south wing of Ningtiaota coal mine occurred when the distance of the stopping reached 61 m along the strike of the coal seam. The water gushed into the roadway along with the roof caving. According to the flow monitoring data, the water yield of the mine increased from 50 m3/h to 1157 m3/h in the next 6 days. The water inrush lasted for several months with little fluctuation, and the final water inflow was stabilized at 400 m3/h. By the end of October, the total water inflow was 3.58 million m3. The source of the water inrush was the weathering zone of the bedrock. The weathered bedrock aquifer is the main water inrush source, which entered the working face through the caving fissures. In November 2011, the water inrush occurred in the working face, N1110, when the stopping scope was about 460–500 m. The maximum water inflow was 190 m3/h. The emergency response was carried out immediately by strengthening drainage capability after the water inrush disaster happened. The water inflow decreased significantly after 3 days and now there is no water in the working face. There are many factors that can contribute to mine-water inrush, including complicated and differing geological structures and hydrogeological conditions, natural and geographical conditions, mine pressure, water pressure, and mining activities [6,8,9,10,11,12]. Mine-water inrush mostly occurs in faults, aquicludes, and the weak points of rock formations. The mine water can then enter the mining face and pose a threat to the miners.
Currently, mine-water inrush is the second-most-common type of mining disaster after gas outbursts. During the period from 2010 to 2019, there were 140 mine-water disasters in China and 718 deaths. For example, on 28 March 2010, Wangjialing Coal Mine in Linfen City, Shanxi Province, the collapse of an abandoned small kiln and the release of the water contained in the abandoned tunnels and goafs of another mine caused a sudden water inrush accident that caused 38 deaths, 115 injuries, and direct economic losses of up to CNY 49.3729 million. In Xinjing Coal Mine in Datong City, Shanxi Province, there was illegally organized production and risky operations near the goaf. Due to the impacts of blast loosening, water pressure soaking, and changes in mine pressure caused by mining activities, the limited amount of safety coal pillar was destroyed. As a consequence, on 18 May 2006, a particularly serious flood accident occurred, causing 56 deaths and direct economic losses of CNY 53.12 million. On 12 December 2004, due to a lack of water detection and drainage measures during coal mining and tunneling, the mining of the Tianchi Coal Mine in Tongren City, Guizhou Province, approached the subsided karst cave that intersects the coal seam three-dimensionally, and a particularly serious water-penetration accident occurred, causing 21 deaths and direct losses of CNY 7.83 million. Similarly, due to illegal mining of waterproof coal pillars in the Mushi Coal Mine of Zaozhuang City, Shandong Province, the roof of the coal seam fell and formed a water break channel directly connected to the ground, which caused open-pit water and sediment to break into the well. As a result, an extremely large water-break accident occurred on 26 July 2003. The accident caused 35 deaths, and the economic losses amounted to CNY 2.981 million. In summary, establishing the sources of mine-water inrush is of great significance to rescuing miners, resuming production, preventing accidents, and formulating policies [13].
Researchers generally divide source discrimination methods for mine-water inrush into three main categories: nonlinear analysis methods, multivariate statistical methods, and hydrochemical characteristic analysis methods. Commonly used nonlinear analysis methods include the fuzzy mathematics comprehensive evaluation method [14], grey system correlation method, BP artificial neural network method [15], GIS theory method, extension recognition method, support vector machine method [16,17,18,19], and extreme learning machine method. These discrimination methods require abundant training samples and do not require subjective design judgment sets. They, therefore, have high learning efficiency and robustness. However, they generally have the potential defects of over-learning and slow convergence. The weights of the extreme learning machine method are randomly generated, and the threshold is 0. The hydrochemical characteristics are ignored, so a large amount of hydrogeochemical characteristic information may be lost, resulting in unclear classification. Multivariate statistical methods mainly include discriminant analysis, cluster analysis, and principal component analysis [20,21]. The discriminant analysis methods include the sequential discriminant method, the secondary discriminant method, the stepwise discriminant method [22], the distance discriminant method [3], FDA [15,22], Bayesian discriminant analysis [3], and the random forest method [23]. These methods require a set of subjective design judgments. They emphasize quantification but ignore analysis of the hydrogeochemical characteristics. The advantages of these methods are that they have reduced data dimensions, improved calculation speed and operating efficiency, improved accuracy and stability, and reduced information loss. Fundamentally, however, they are an effective solution to the practical problem. Hydrogeochemical characteristic analysis methods include the conventional hydrochemistry method [24,25,26,27], the isotope method [28,29], the tracer test method, the trace element method [30], and the water temperature and water level method [31]. Furthermore, the laser-induced fluorescence technology, GIS, and temperature analysis have been introduced to quickly identify the source of water inrush [32,33].
In this study, a self-organizing feature map (SOM) was applied to discrimination of mine-water inrush sources for the first time. The FDA, the Piper diagram, the Gibbs diagram, and the water temperature were also used to analyze and verify the water inflow source in an auxiliary way from quantitative and qualitative perspectives. The sources of the unknown water samples were determined. When water gushing or water-gushing symptoms appear in a mine, real-time detection should be carried out to quickly identify the type of water source. This work is of great significance for the study of regional hydrogeochemical effects and the replenishment and drainage relationship between groundwater and surface water. This research provides a scientific basis for mine-water hazard prediction, as well as water source anticipation and control. It provides theoretical support and a practical basis for policy formulation and mine-water hazard prevention.

2. Materials and Methods

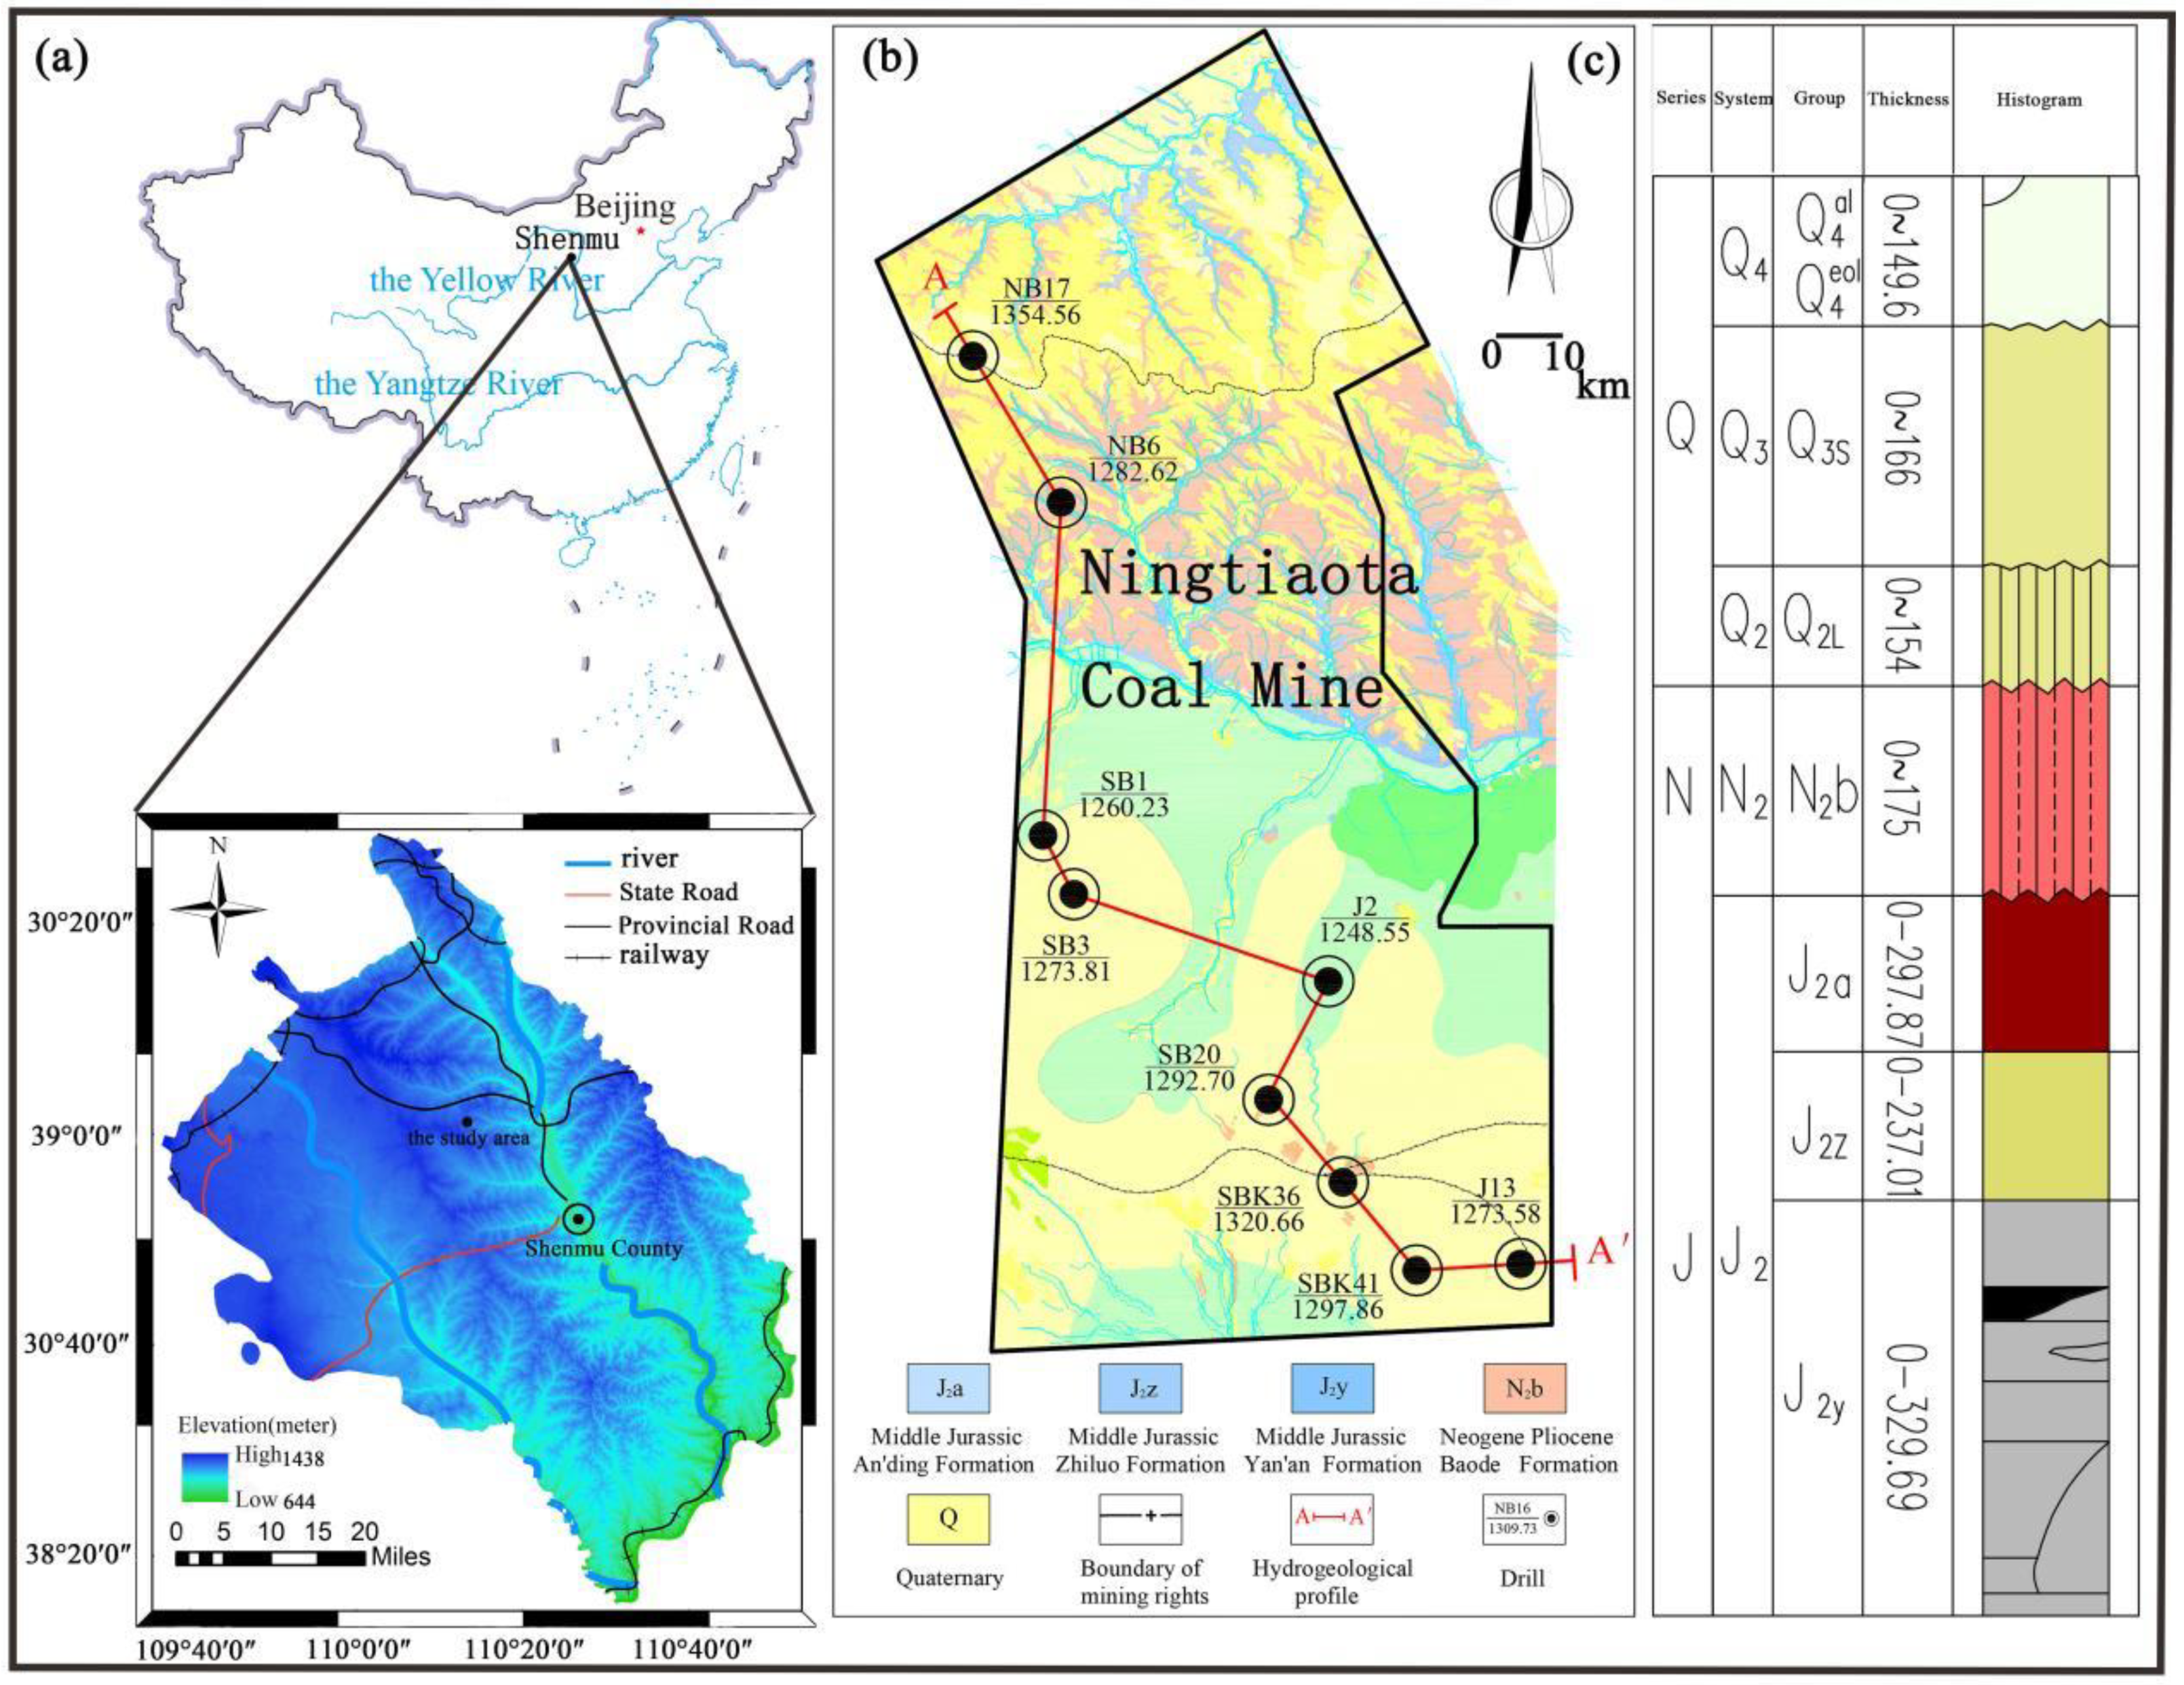
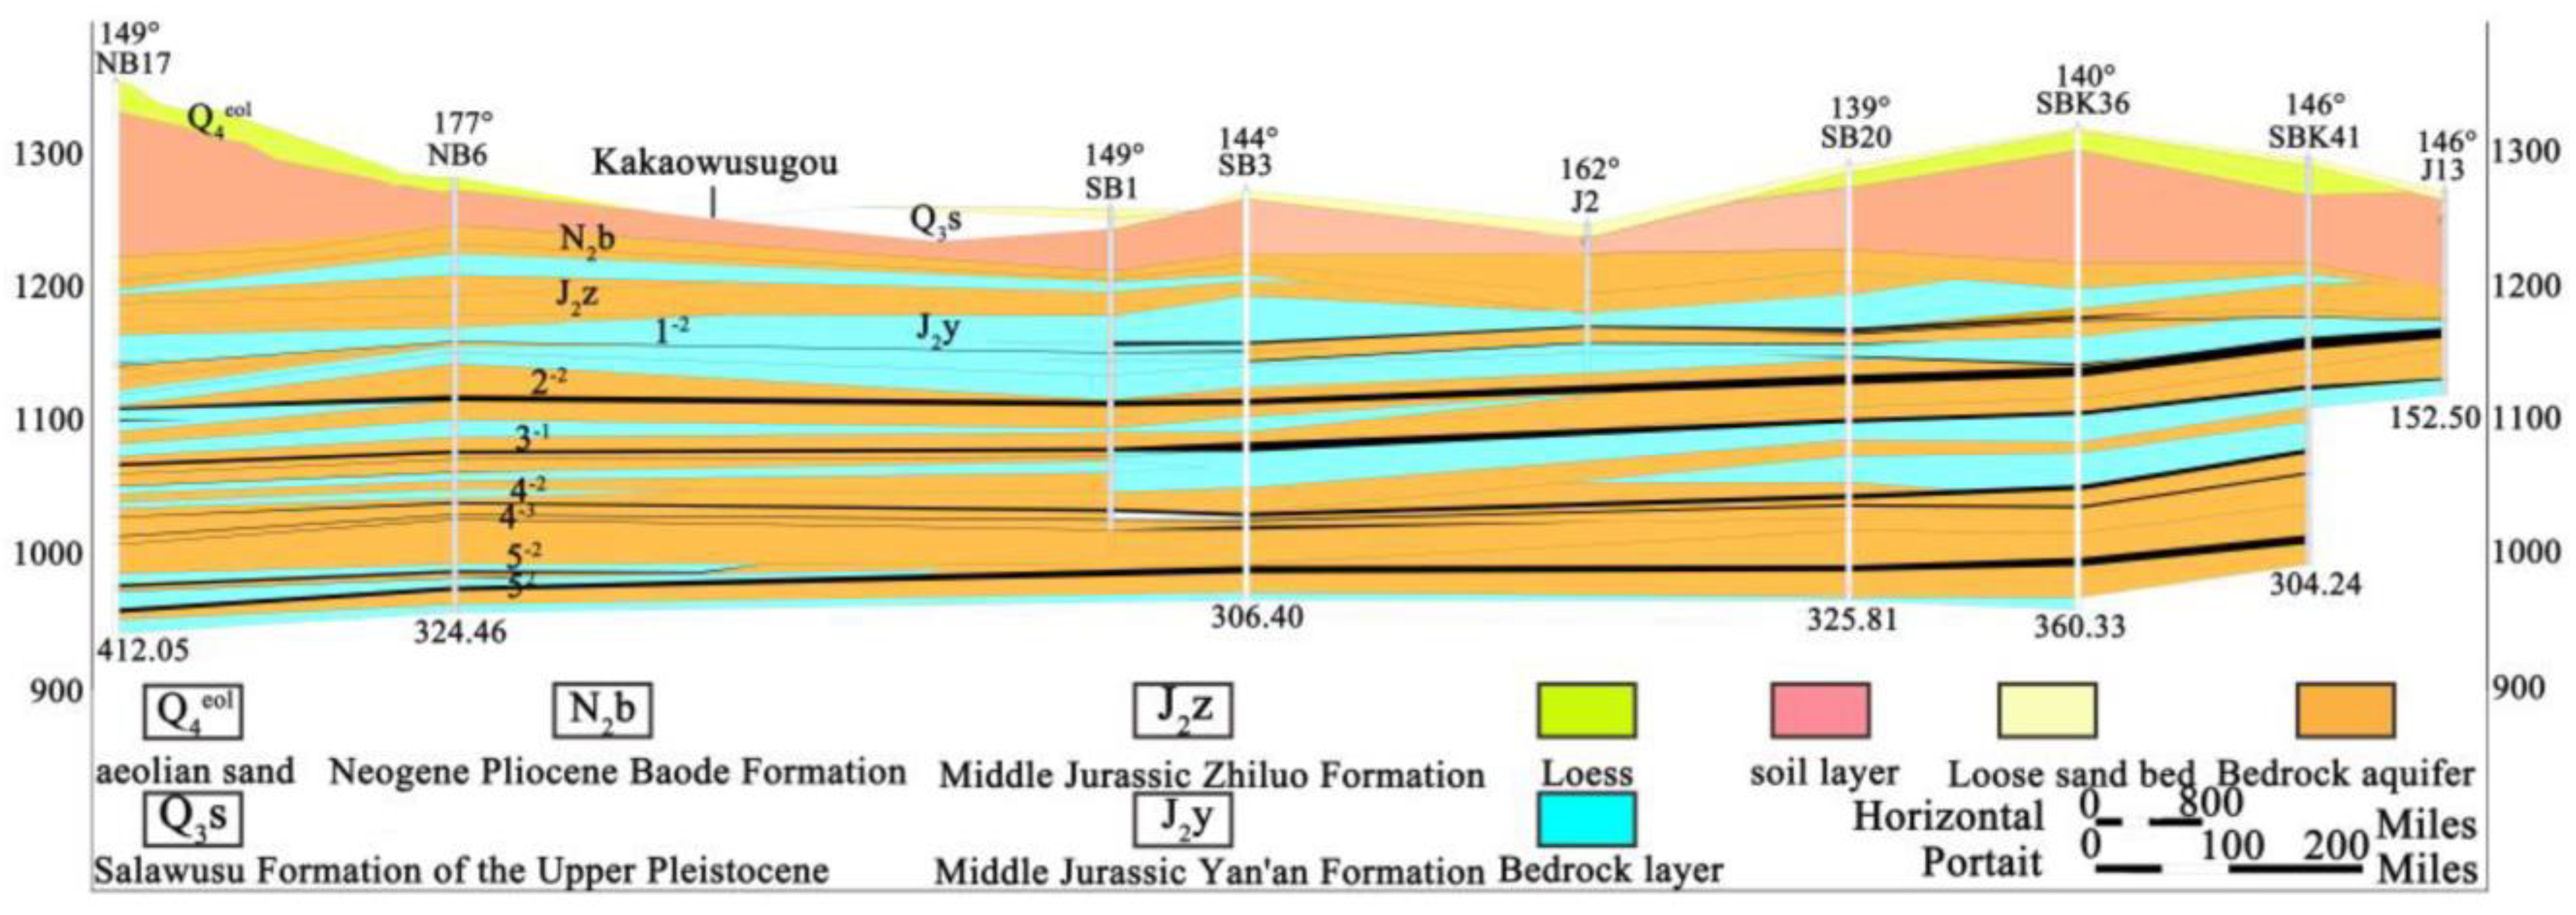
2.1. Geological and Hydrogeological Conditions

Ningtiaota Coal Mine (38°57′24″–39°07′57″ N, 110°09′29″–110°16′23″ E) is located in Shenmu County, Yulin City, Shaanxi Province, and is in the southern part of the Shennan mining area (Figure 1). The study area has a mid-temperate semi-arid continental monsoon climate, with an annual average precipitation of 434.1 mm and an annual mean temperature of 8.6 °C. The annual average wind speed is 2.3 m/s and the average evaporation is 1712.0 mm. Ningtiaota coal mine is located in the Kuye River basin, a tributary of the Yellow River. The main water systems in the area are the Miaogou and Lucaogou rivers, and the Kaokaowusugou and its branches, the Kentieling and Xiaohoumu rivers. Ningtiaota Coal Mine is located in the northern part of the Loess Plateau and on the southeastern edge of the Mu Us Sandy Land. The terrain is high in the northwest and southwest, and low in the middle. The geomorphic unit is dominated by windy beaches and loess hilly and gully areas. The geological structure of this area is simple, the whole is a monoclinic layer inclined to the west, and no faults or magmatic rocks are seen. A stratigraphic map of the region is shown in Figure 1.
The Quaternary Holocene System is dominated by modern aeolian sand and alluvial strata with good water permeability. The lithology of the Salawusu Formation of the Upper Pleistocene of the Quaternary System is composed of silt, fine sand, medium sand, sub-sand, sub-clay, and a peat layer. This aquifer is the key layer for water-preserving coal mining, with a unit water inflow of 0.008–4.321 L/s·m and a permeability coefficient of 0.011–23.582 m/d. The lithology of the Lishi Formation of the Middle Pleistocene is dominated by gray-yellow or brown-yellow sub-clay and sub-sandy soil, with scattered calcareous nodules. Vertical fissures are developed, and they are in unconformity contact with the underlying strata. The unit water inflow is 0.01776–0.04705 L/s·m and the permeability coefficient is 0.10017–0.89640 m/d. This formation is one of the key water-preserving layers with weak water richness [34]. The Baode Formation is dominated by light red and brown-red clay and sub-clay, with irregular calcareous nodules, distributed in layers. The gravel layer in the local section is 10–30 cm. Its permeability coefficient is 0.0016–0.0170 m/d, and it forms a key waterproof soil layer with the loess of the Lishi Group [34]. The upper part of the Middle Jurassic Anding Formation is dominated by purple-red mudstone and sandy mudstone, interbedded with silt and fine sandstone, and the lower part is dominated by mudstone and sandy mudstone, with sandy mudstone interbedded. The lithology of the Zhiluo Formation is dominated by feldspar conglomerate, with medium sortability and calcareous cementation. The structure is loose, the porosity is increased, the water permeability of the rock is enhanced, and the cracks are relatively developed. The average permeability coefficient is 0.142 m/d and the average unit water inflow is 0.0402 L/s·m [34]. The Yan’an Formation is composed of gray-white and light gray medium-fine-grained feldspar sandstone, including four water-bearing rock sections: J2z–2−2, 2−2–3−1, 3−1–4−2, and 4−2–5−2. Jurassic sandstone, Neogene, and Quaternary shock sediments are the main strata in the region.
The main sources of mine-water filling caused by coal mining are atmospheric precipitation, surface water, underground aquifer water, burnt-rock water, and goaf water. The main water-filled aquifers are quaternary loose-pore phreatic aquifers (Q), weathered-fissure water of layered clastic rocks from the Middle Jurassic Anding Formation (J2a) and Zhiluo Formation (J2z), fissure-confined water from the Middle Jurassic Yan’an Formation (J2y), and phreatic aquifers of burnt-rock fissure holes (Figure 2).

2.2. Sample Collection and Analysis

The observation data were taken from water samples tested and previous water quality analysis reports for the mining area. There was a total of 40 water samples, of which 2 were from the Quaternary loose layer pore phreatic aquifer, 16 were from the Middle Jurassic Zhiluo Formation clastic weathered fissure aquifer, and 13 were from the Middle Jurassic Yan’an Formation fissure confined water aquifer. Three were surface water and six were pit gushing water (Table S1). Eleven main indicators were measured in the water samples: water temperature (T), total dissolved solids (TDS), pH, main cations (K+, Na+, Ca2+, and Mg2+), and main anions (HCO3, SO42, Cl, and NO3). The parameters T, pH, and TDS were tested in situ using a HANNA-HI9828 portable multiparameter instrument. The ions K+ and Na+ were tested using ion chromatography, and the other ions were tested by titration and gravimetric methods. Since the sources of Na+ and K+ are roughly the same, Na+ and K+ are often classified into one group (Table S1). The electrical neutrality equation is used to check whether the aqueous solution meets the basic equilibrium condition (Equation (1)); that is, the total number of positive ions is equal to the negative ions in solution on a charge basis. The charge balance error in this study is lower than 5%, indicating that the analysis and test results are reliable.
E = | Z · m c Z · m a Z · m c + Z · m a | × 100 %
where E is the charge balance error, Z is the charge number of the ions, and mc and ma are the molar concentrations of cations and anions, respectively.

2.3. Self-Organizing Feature Map

The SOM, which was proposed by Kohonen in 1982, is an artificial neural network model for unsupervised competitive learning that simulates the SOM of the brain and nervous system [35]. The essence of the SOM is to map high-dimensional data to low-dimensional space through nonlinear changes while retaining its most primitive topological structure. It aims to achieve the purpose of dimensionality reduction and clustering, and it is widely used in various fields to analyze complex data and extract information; there is an SOM toolbox implementation in MATLAB. The steps for the creation of an SOM include initializing the low-dimensional neural network, setting parameters and variables, finding and adjusting the best matching unit (BMU) according to the Euclidean minimum principle, and iterative calculation [36,37]. The nodes contained in the SOM structure have a common arrangement of a two-dimensional hexagonal grid [38]. Based on the heuristic algorithm, the number of neuron nodes m is calculated using 5√N, where N represents the number of samples. The number of nodes determines the accuracy and generalization ability of the SOM and is the key to good clustering [39]. In addition, terrain error (TE) represents the proportion of nonadjacent data vectors, and this determines the degree of retention of the topological structure. The quantization error (QE) characterizes the average distance between the vector and BMW to measure the map resolution [37,40]. Therefore, TE and QE are used to evaluate the selection of map nodes and, finally, determine the optimal number of nodes. In addition, K-means clustering and the Davies–Bouldin index (DBI) are used to visualize the final clustering results on a topological network graph.

2.4. Hydrogeochemical Method

The Piper diagram is used to reflect the relative content of the main ions and to determine hydrochemical types through the relative distribution positions of different water samples. It has been widely used in the classification of hydrochemical types and the judgment of the mutual chemical reactions between groundwater and its surrounding rock. In addition, based on the principle that a given aquifer will have particular hydrogeochemical characteristics and there are differences in hydrogeochemical properties between different aquifers, the Piper diagram is used to determine the source of unknown water in a mine and qualitatively judge the hydraulic connections of different layers [23,31]. This functionality is implemented by AqQA version 1.1.4.1 (Rockware, Inc., Golden, CO, USA).

2.5. Fisher Discriminant Analysis

Fisher discriminant analysis uses the ideas of dimensionality reduction and projection. Its essence is to project high-dimensional training-sample data into a low-dimensional space in an appropriate direction. It aims to make the sum of squared deviations of each sample within a class after projection as small as possible, while making it as large as possible between classes. Then, a few linear combinations of multidimensional vectors can be used to replace the original multiple variables to obtain a multivariate linear discriminant function. Finally, the attribution of the samples is judged and the groups are separated. The category of an unknown sample can be judged according to the minimum squared Mahalanobis distance, which is calculated based on the relative centroid between the training samples and the unknown samples. This greatly improves the speed, accuracy, and effectiveness of machine learning. The main principles and basic ideas of FDA are as follows.
Suppose the original samples have n categories, and the sample set of each category contains m samples. The sample set of observation data is:
x i j = ( x 1 ,   x 2 ,   x 3 , ,   x m )
where i = 1, 2, 3, …, n and j = 1, 2, 3, …, m. The mean vector µi and covariance matrix ∑i of the nth sample are expressed as:
μ i = 1 / N i x x j x
i = x x j ( x μ i )   ( x μ i ) T             ( x     x j )
where Ni indicates the sample number of the nth type.
The sum of squared deviations within a group (A) and the sum of squared deviations between groups (B) are calculated using [41]:
A = i = 1 n j = 1 m ( x j i μ i )   ( x j i μ i ) T
B = i = 1 n m i   ( x i μ i   ) ( x i μ i ) T
The largest eigenvalue (λ) and the corresponding eigenvector (U) can be estimated from:
( A 1   B     λ I ) U = 0
where I is the identity matrix. The discriminant function is then established and solved in the equation (Zhao et al., 2020):
Y = U 1 x

3. Results and Discussion

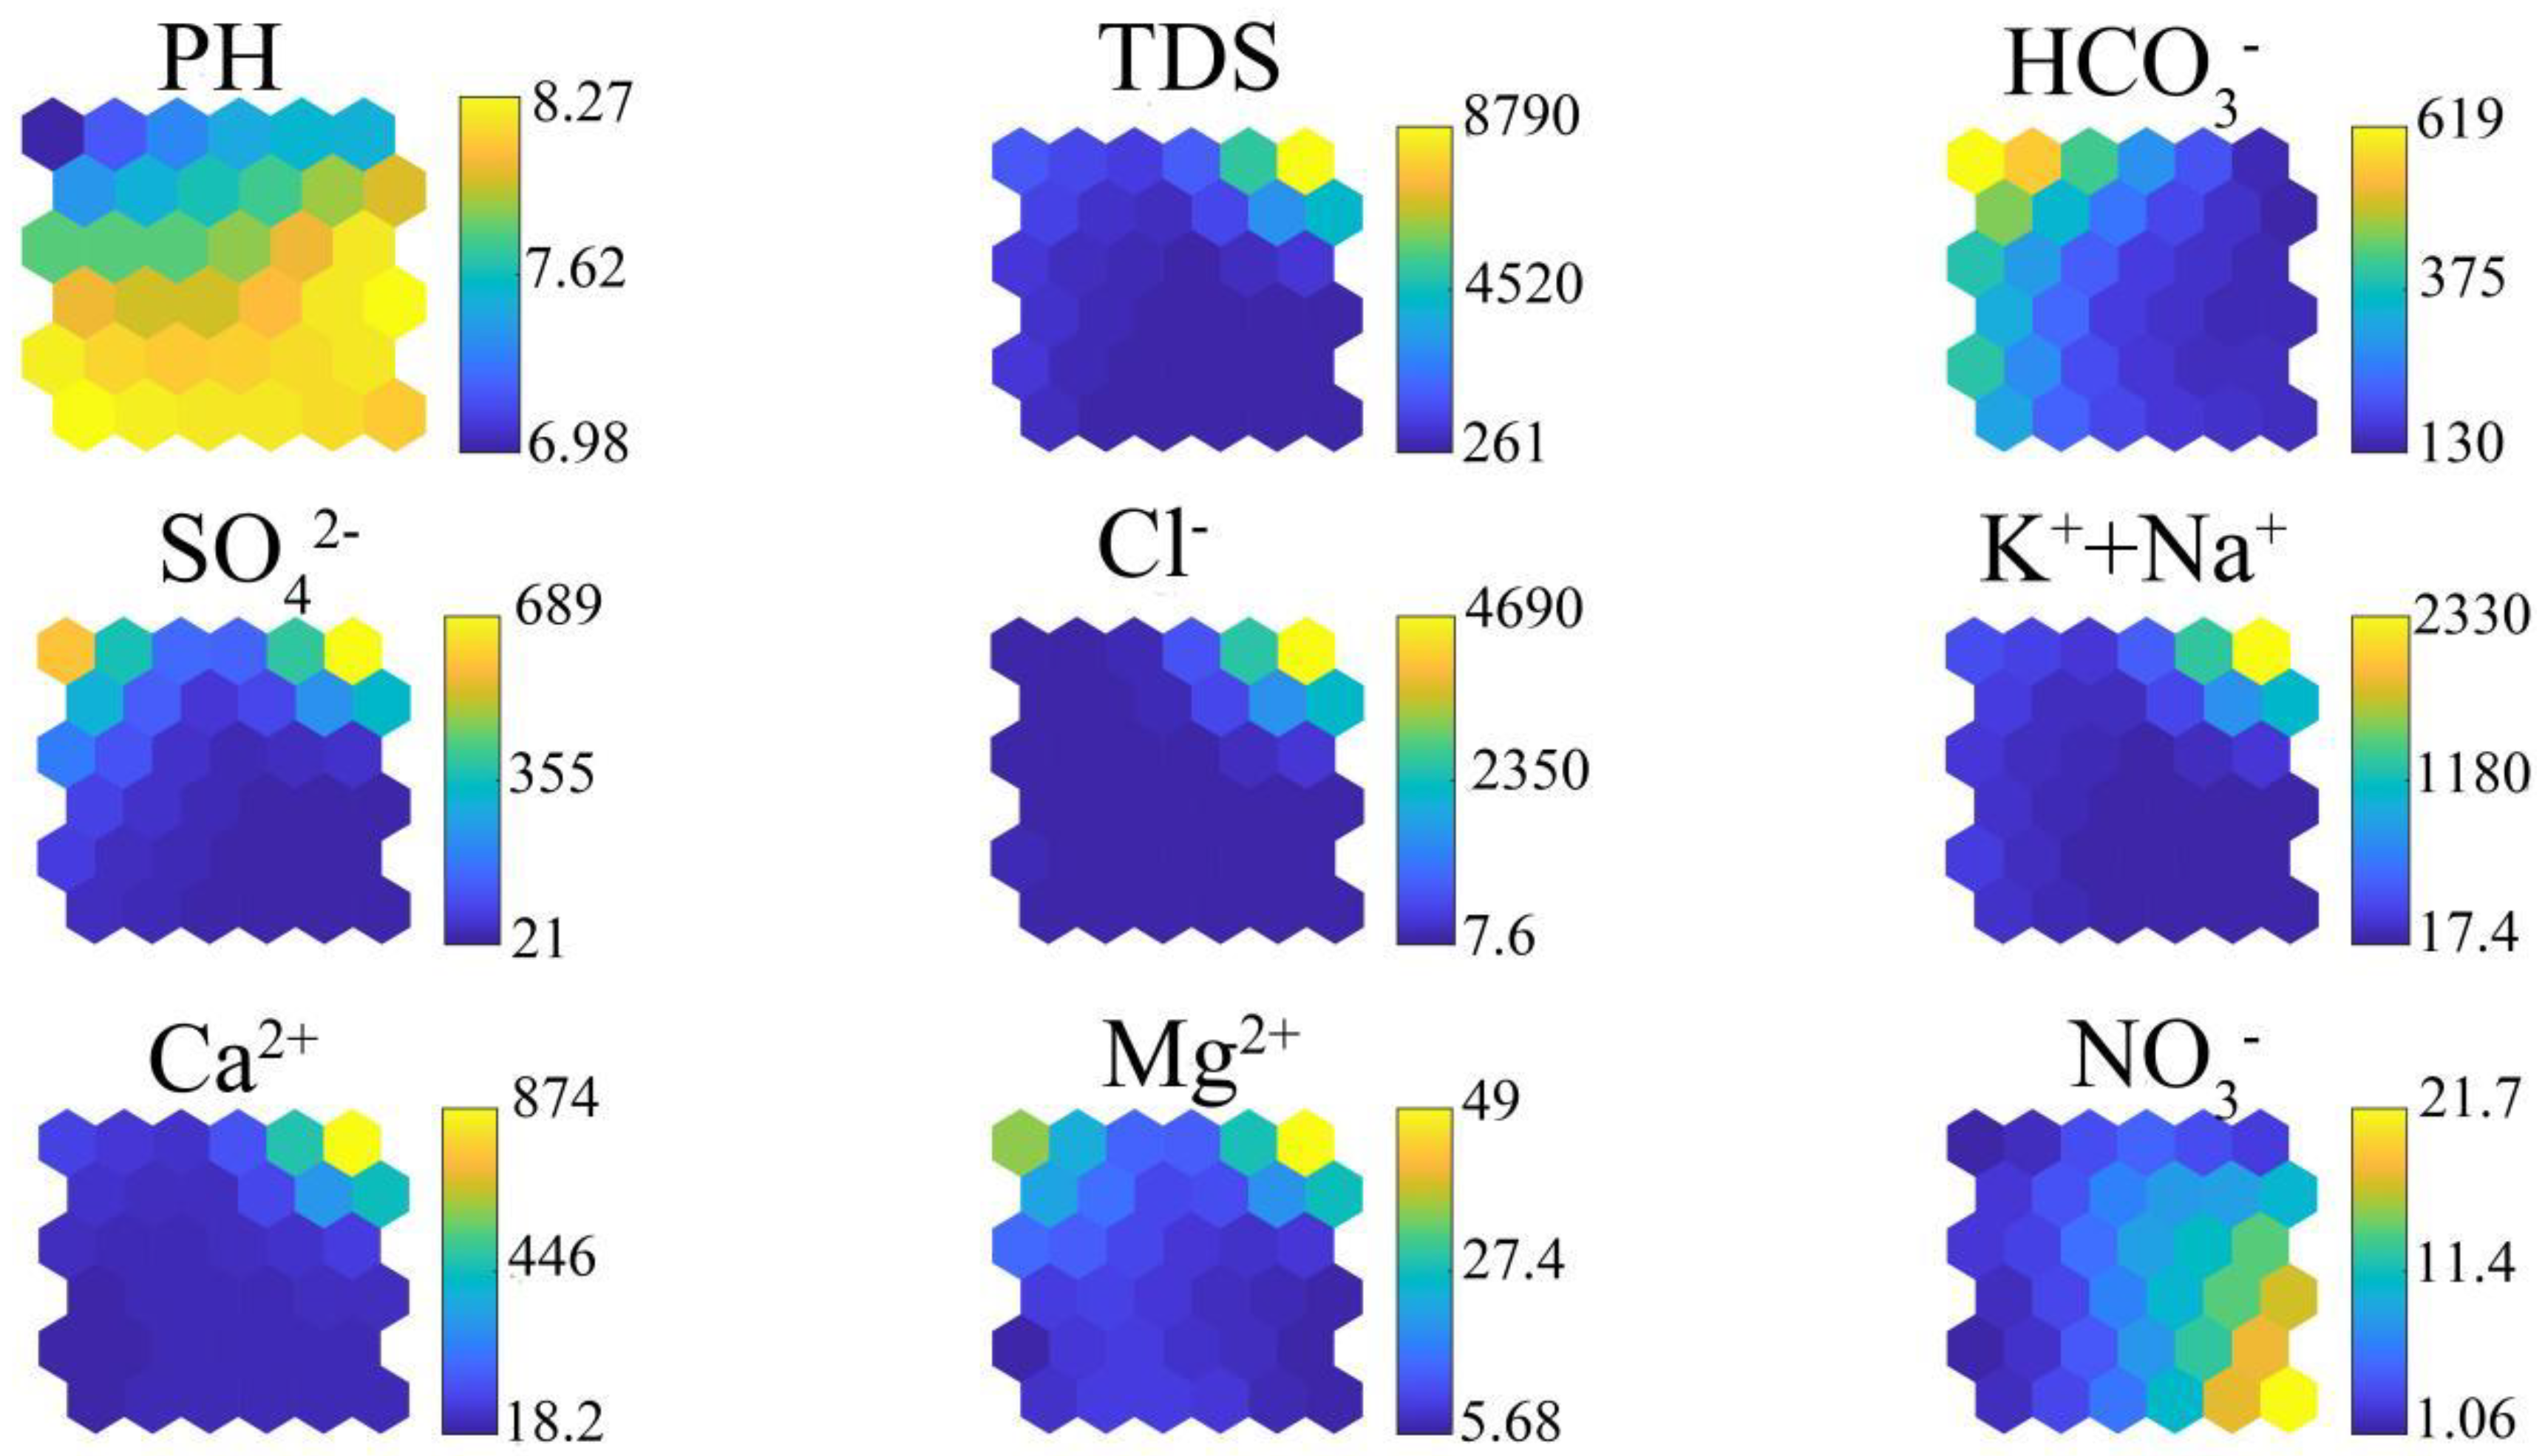
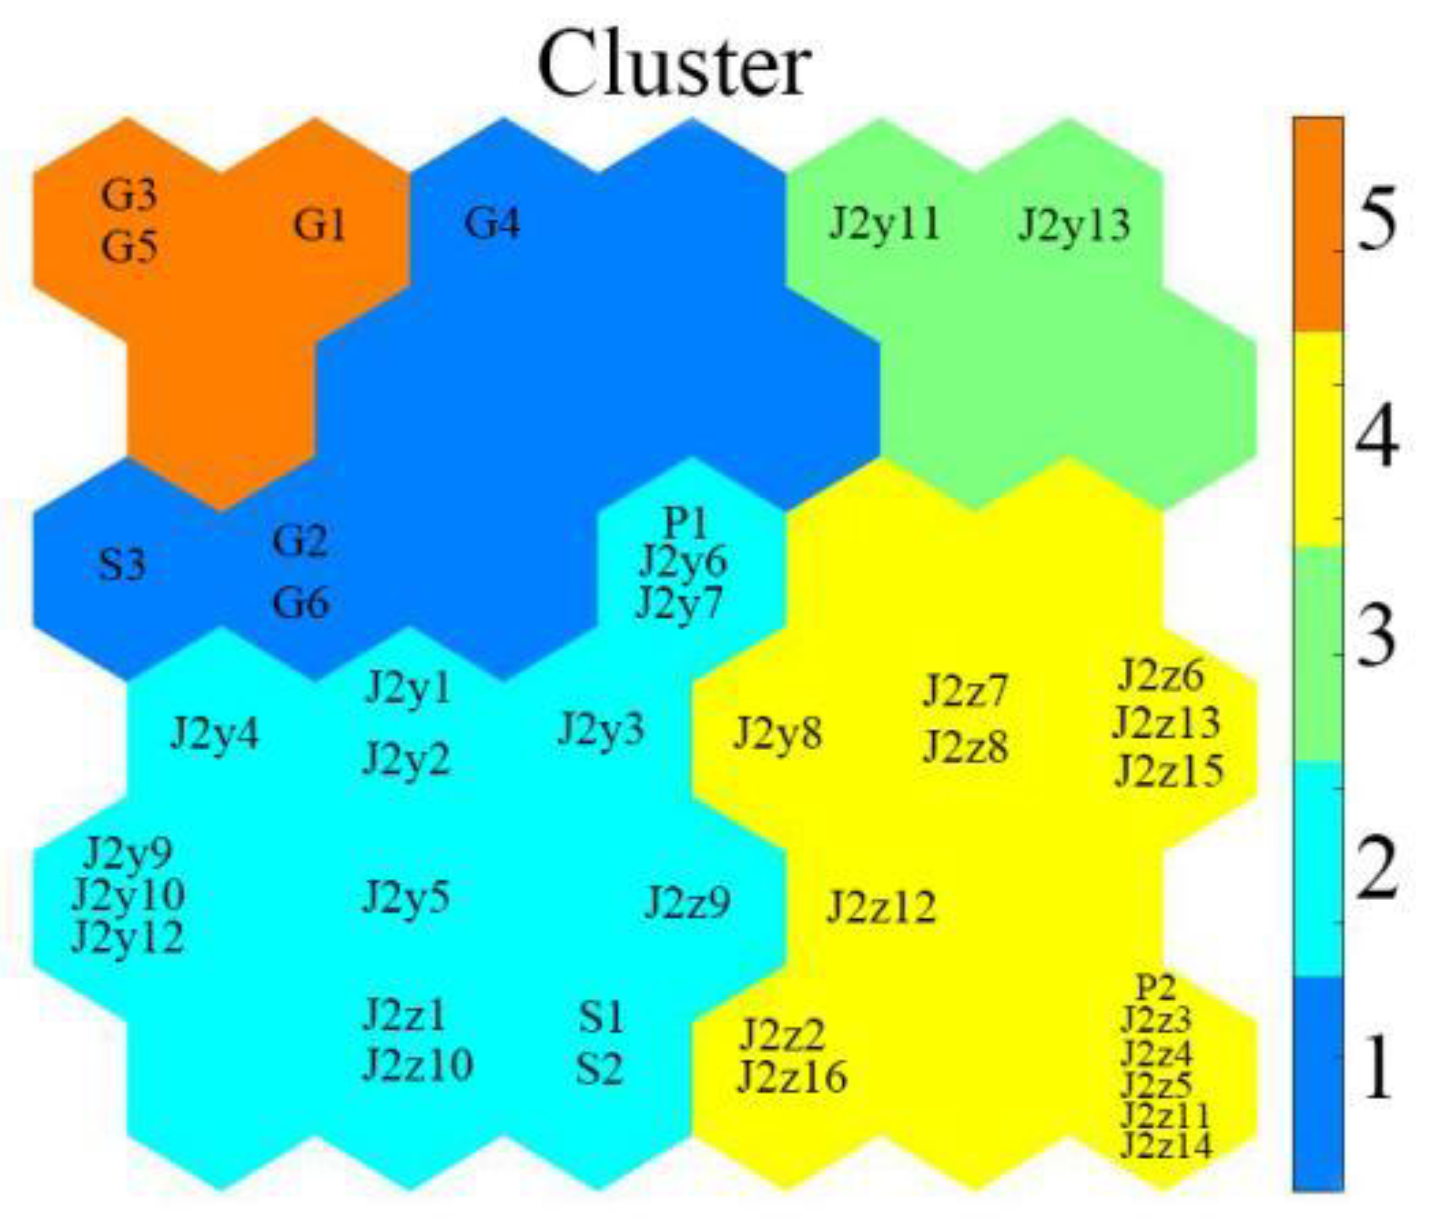
3.1. SOM and Clustering of Water Samples

In this research, 6 × 6 neurons and five clusters were calculated in SOM using MATLAB to sort water samples according to their ion concentrations and the indicators pH and TDS. A neural matrix visualization of the individual indexes in the SOM was exhibited in Figure 3. The color gradients of TDS, Cl, K+ + Na+, Ca2+, Mg2+, and SO42− had the same trend, which indicated that the distributions of these ions had a high degree of similarity, and the correlations between these ions were very high. However, the color gradients of pH, HCO3, and NO3 were different, indicating that there was no obvious correlation between these three indicators and other components. Clustering based on the smallest DBI index, an SOM neural network clustering pattern classification map with five clusters was obtained (Figure 4).
The neural matrix of all components except pH in cluster 2 was dark blue, indicating that the ion concentrations were the lowest, but the pH is higher. Most of the samples in this cluster were fissure water from the Middle Jurassic Yan’an Formation. Nevertheless, there were still two surface water samples, one Quaternary pore water sample, and three fissure water samples from the Middle Jurassic Zhiluo Formation in this cluster. Similarly, except for Cl, the neural matrix of cluster 1 was light blue, which showed that the concentrations of water samples in this cluster were higher than those of cluster 2, with extremely low Cl. There was one surface water sample and three gushing water samples in this cluster, specifically S3, G2, G6, and G4. In cluster 3, the SOM neural matrix visualizations of TDS, SO42−, Cl, K+ + Na+, Ca2+, and Mg2+ were distributed in yellow and cyan. Only two water samples were included in this cluster, namely, J2y 11 and J2y 13. These results showed that the ion concentration in this cluster was high. The neurons in cluster 4 were dark blue, representing relatively low contents of seven kinds of ions. However, the NO3 was obviously the highest. A total of 13 samples in this cluster were fissure water from the Middle Jurassic Zhiluo Formation, and one sample, P2, was Quaternary pore water. Furthermore, the neurons of HCO3, SO42−, and Mg2+ in cluster 5 were yellow, orange, and green, respectively. This showed that the three ion concentrations in G1, G3, and G5 are high.
The principle of the SOM is dimensionality reduction and clustering. Samples within a given cluster in the SOM neural network will have similar hydrogeochemical characteristics, and this indicates that the water samples in a cluster might be from the same source. On this principle, the gushing water samples G2, G4, and G6 were identified as surface water because they were placed in the same cluster as S3. In addition, the color gradients of clusters 1 and 5 are the same or similar. Therefore, their water sources were close. Samples G1, G3, and G5 were regarded as surface water.
There were some conditions applicable to the creation of an SOM. First of all, there were certain requirements on the number of samples: the larger the sample size, the more accurate the water source identification results. Second, the color gradient of the SOM neural matrix visualization was greatly affected by the extreme values of the indicators, and the clustering pattern classification might be influenced by this. To further verify and improve the results, traditional hydrogeochemical methods and FDA were selected to perform water source discrimination.

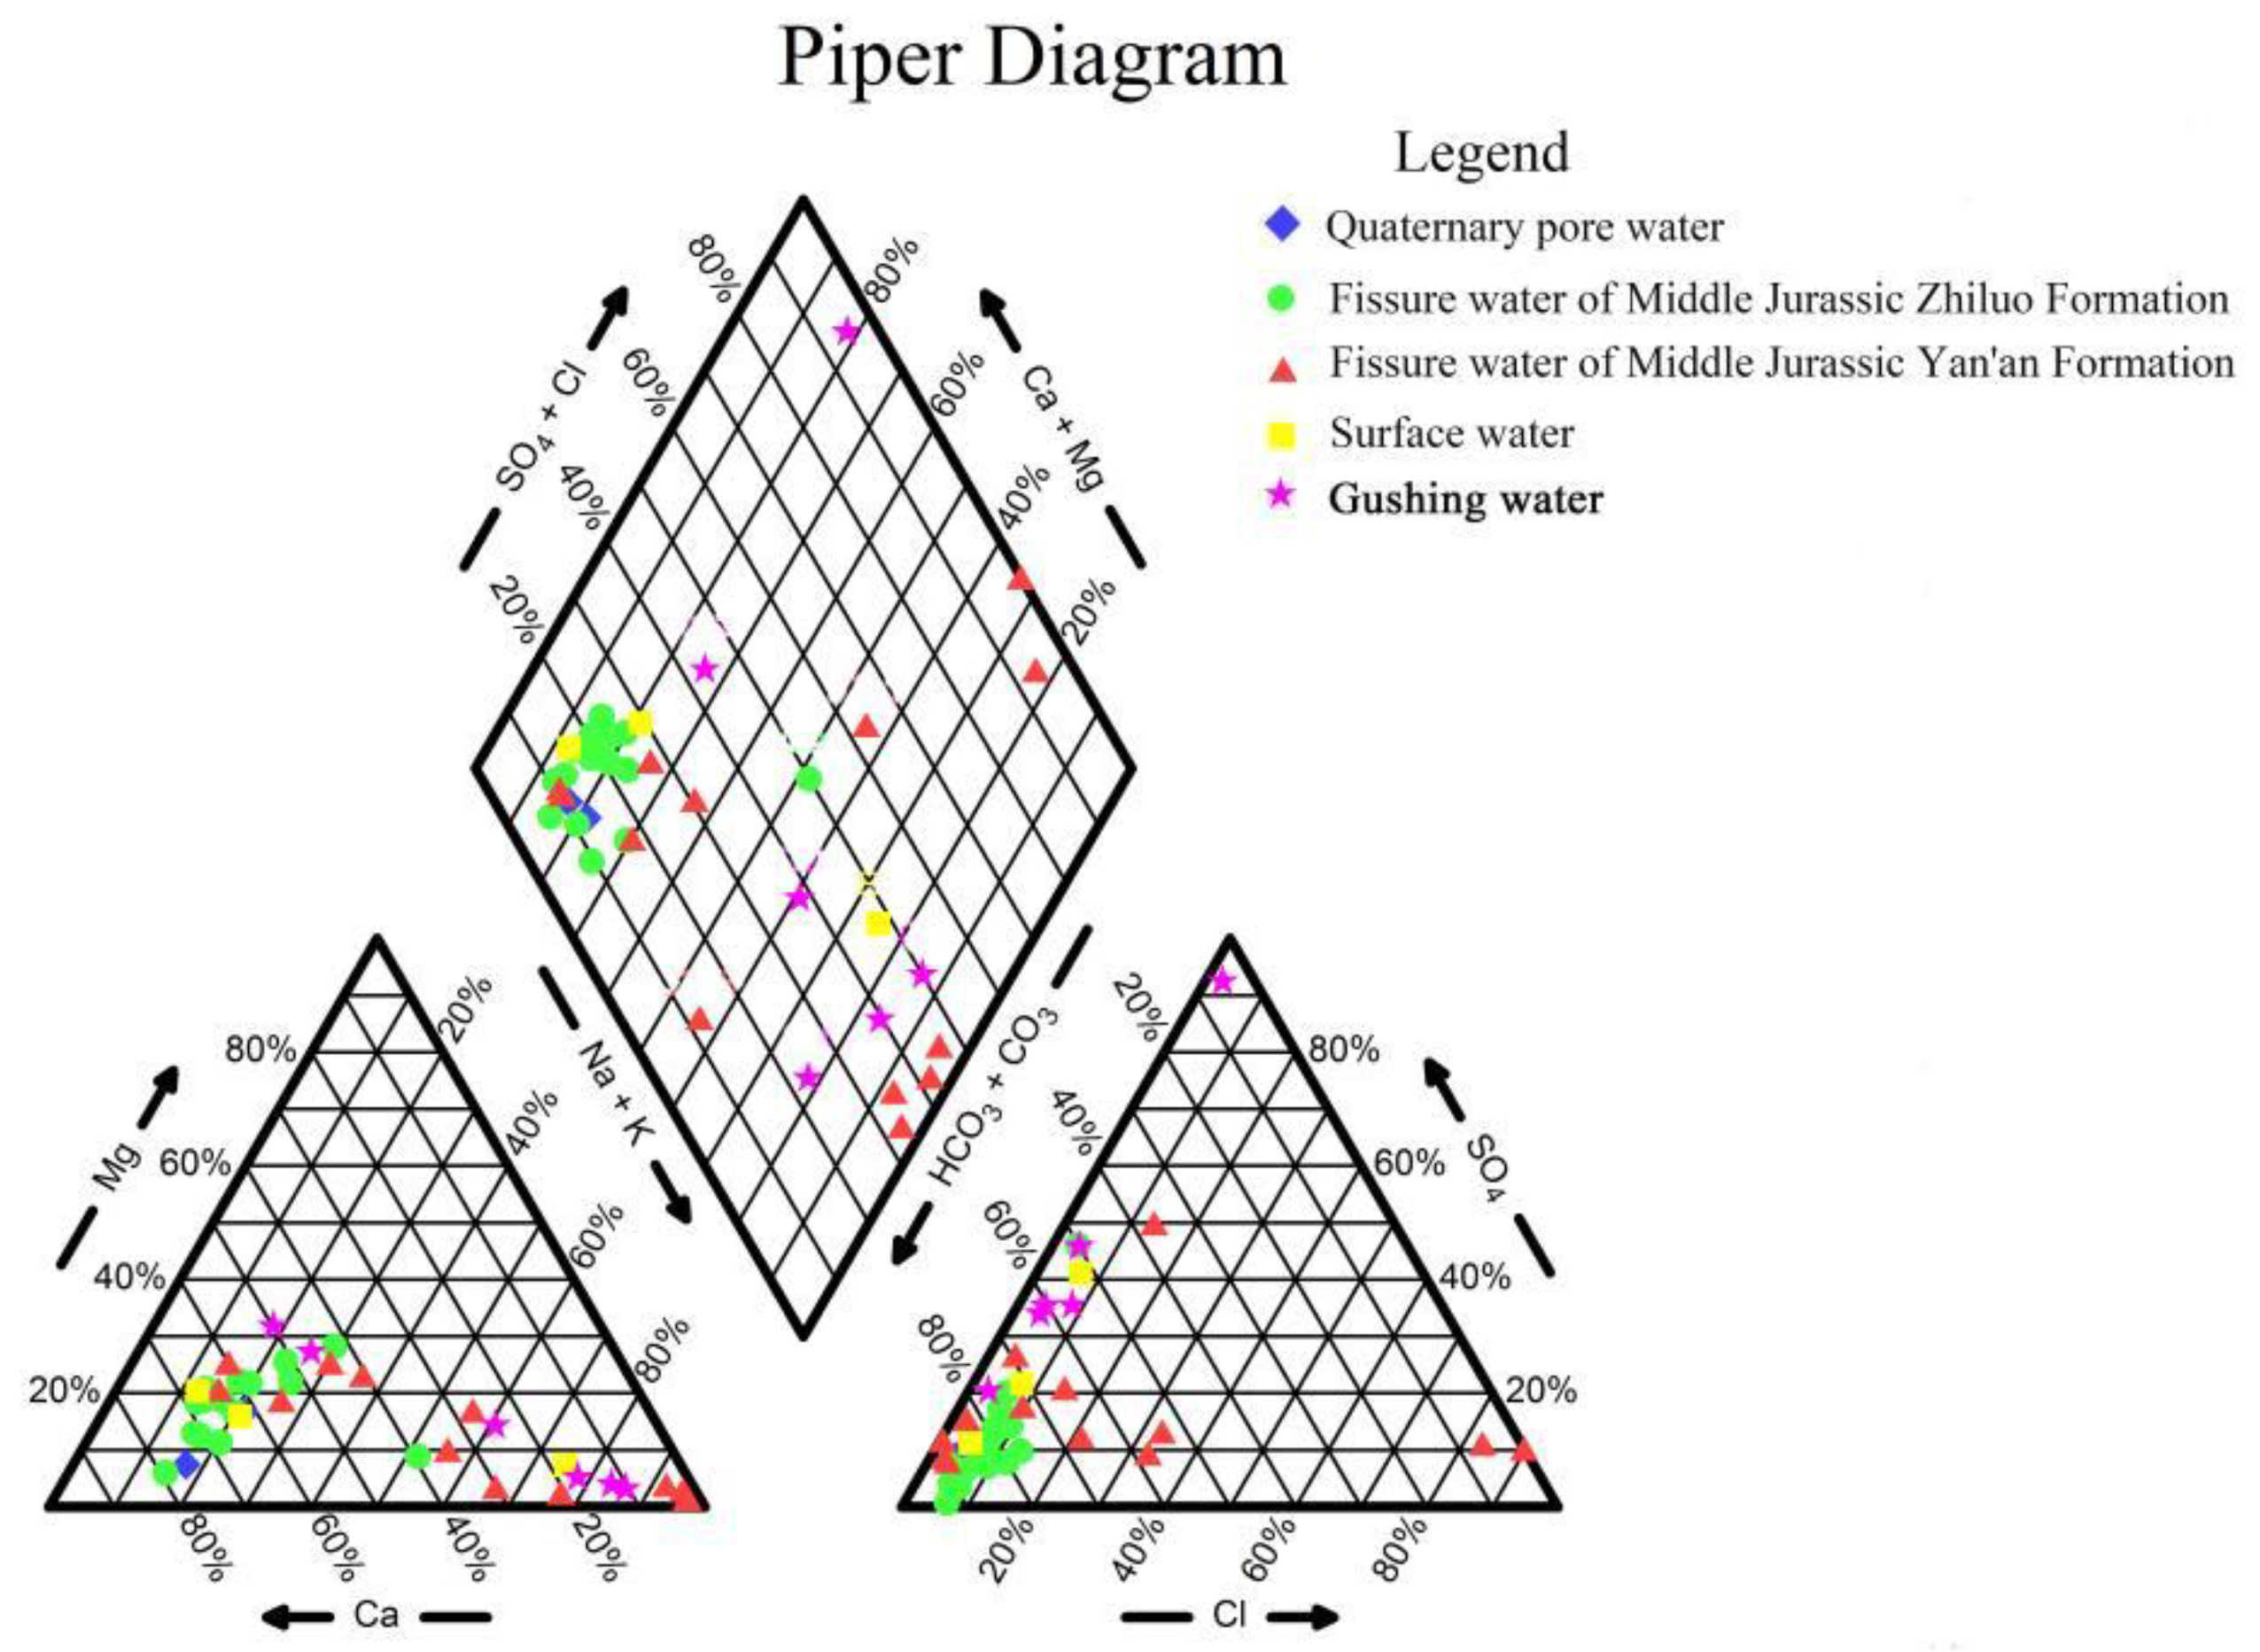
3.2. Hydrogeochemical Discrimination

A Piper trilinear diagram was established using AqQA to analyze the hydrogeochemical characteristics of the samples (Figure 5). The parameters Ca2+, Mg2+, K++Na+, HCO3, SO42, Cl, TDS, pH, and NO3 were selected to discriminate the source of mine gushing water (Table S1) [42,43]. Additionally, Gibbs diagrams were used to divide the natural water into three main types—evaporation dominance, rock-weathering dominance, and precipitation dominance—according to their ionic components (Figure 6). The distribution of water sample points on the Gibbs diagrams in this study was obviously concentrated around TDS values in the range 100–1000 mg/L.
The hydrogeochemical type of Quaternary pore water was found to be HCO3–Ca, and the average TDS was 276.025 mg/L. The level of dissolved solids in the water indicated that it was affected by the combined effects of rock weathering and atmospheric precipitation. This demonstrated that the Quaternary pore water had a close hydraulic relationship with atmospheric precipitation and other horizon water, and its cyclic evolution was frequent. Most of the fissure water from the Middle Jurassic Zhiluo Formation was found to have the hydrogeochemical type HCO3–Ca. A small number of water samples were HCO3–Ca·Na, HCO3·SO4–Na·Ca, HCO3–Ca·Na·Mg, and HCO3–Ca·Mg. The TDS was 269.147 mg/L, similar to pore water. These hydrogeochemical characteristics indicated that this aquifer had a certain hydraulic connection with pore water; it was dominated by rock weathering [44,45,46]. In fissure water from the Middle Jurassic Yan’an Formation, the main cations were found to be Na+ and Ca2+, and the main anions were HCO3, Cl, and SO42. The average TDS value was 1963.963 mg/L, significantly higher than the values for the other samples. The dominance of evaporation and rock weathering led to this high ion concentration, especially HCO3, Na+, SO42, and Cl. The reason for this was presumed to be rock dissolution, and cation exchange and dissolution. The hydrogeochemical types of the surface water samples were HCO3–Ca and HCO3·SO4–Na, with a higher TDS of 586.820 mg/L, and this was mainly caused by evaporation and rock weathering. Evaporation caused continuous water loss and salt enrichment, and the rock weathering was judged by the presence of Ca2+ and HCO3. According to the Piper trilinear diagram, the hydrogeochemical types of the six gushing water samples were HCO3·SO4–Na, HCO3·SO4–Na, HCO3·SO4–Na, HCO3–Na, SO4–Ca·Mg, and HCO3·SO4–Ca·Mg·Na. Therefore, G1, G2, G3, G4, G5, and G6 could be qualitatively identified as surface water.
Water temperature was added as an auxiliary indicator for water-source identification. The average water temperatures of Quaternary pore water, fissure water from the Middle Jurassic Zhiluo Formation, fissure water from the Middle Jurassic Yan’an Formation, and surface water were 11.50 °C, 11.31 °C, 18.91 °C, and 19.10 °C, respectively, with an increasing trend. The temperature of pore water was similar to that of the fracture water in the Zhiluo Formation. Based on the on-site test results, the temperatures of the gushing water from G1–G6 were, in order, 20.4 °C, 22.2 °C, 19.9 °C, 21.2 °C, 20.6 °C, and 12.0 °C. Clearly, water samples G1, G2, G3, G4, and G5 were close to the temperature of surface water. However, when the two aquifers were relatively close, the water was affected by external environmental interference [47,48]. The judgment of this result was limited by the number of samples. As such, using the water temperature to determine the water source was not completely reliable [31]; it could only be used as an auxiliary reference.

3.3. Source Identification Using FDA

The eight main hydrogeochemical components—pH (x1), TDS (x2), HCO3 (x3), SO42 (x4), Cl (x5), K++Na+ (x6), Ca2+ (x7), and Mg2+ (x8)—were selected as the indicators for identification of the source of gushing water. The sources were classified into four categories, namely, Quaternary pore water (P), fissure water from the Middle Jurassic Zhiluo Formation (J2z), fissure water from the Middle Jurassic Yan’an Formation (J2y), and surface water (S). The six groups of gushing water samples (G) were regarded as unknown water samples to be judged (Table S1). The statistical software package SPSS v19.0 (SPSS Inc., Chicago, IL, USA) was used to apply FDA. The resulting discriminant functions were:
y 1 = 6.061 x 1 0.007 x 3 + 0.015 x 4 0.005 x 6 48.069
y 2 = 0.612 x 1 + 0.005 x 2 + 0.008 x 3 + 0.020 x 4 0.025 x 6 + 2.140
The significance levels of Equations (9) and (10) were found to be 0.000 and 0.003, respectively. These were much less than 0.05, indicating that both discriminant functions were highly effective. In addition, the cumulative percentages of the two typical discriminant functions were 87.8% and 26.2%, respectively. This showed that the fitted relationships between the basic information of the water samples and the unknown water-source types were effective, and the first function was found to be more effective. In the discriminant analysis, the variables Cl, Ca2+, and Mg2+ were unused due to their extremely small correlations. For a standardized canonical discriminant function, the coefficients of discriminant function 1 were found to be 1.427, 1.000, −0.757, 3.094, and −3.591, corresponding to pH, TDS, HCO3, SO42, and K++Na+, respectively. In contrast, the respective coefficients of discriminant function 2 were −0.144, 13.694, 0.910, 4.131, and −17.704. This demonstrated that the main indicators K++Na+, SO42, pH, and TDS greatly improved the ability to identify the source of water inrush.
The spatial distribution of water samples as determined by both discrimination functions was calculated. This is plotted in Figure 7, in which the water sample types were Quaternary pore water (P), fissure water from the Middle Jurassic Yan’an Formation (J2y), surface water (S), and fissure water from the Middle Jurassic Zhiluo Formation (J2z). The distances of gushing water to the centroids of the four water sample types are listed in Table 1.
The distances of G1, G2, G3, G5, and G6 to the centroid of surface water were found to be the shortest, which implied that these five samples came from surface water. Based on the principle of minimum distance, G4 was found to originate from Quaternary pore water. According to the results of FDA, the appropriate proportion of training samples was 80%, which showed that the discriminant function was effective and its accuracy was relatively reliable.

3.4. Method Comparison

There have been serious mine water accidents in the Ningtiaota Coal Mine. However, engineering methods, such as geophysical prospecting and drilling, were unable to accurately identify the source of the gushing mine water, and this consumed a large amount of labor and funds [49,50]. This research provided a simple and quick method—the self-organizing feature map—for water source identification.
Through the above analysis, the sources of G1, G2, G3, G4, G5, and G6 were all judged by SOM to be surface water. The results obtained by hydrogeochemical methods were the same. Since the water temperature was significantly affected by the distance of the aquifers, environmental interference, and the number of samples, this could only be used as an auxiliary identification method. However, using FDA, the gushing water sample G4 was identified as Quaternary pore water. Considering their hydrogeological characteristics, G4 and G2 were very close, and the two sampling points were located in the same aquifer. Their lithology was the same, and their hydrogeochemical composition was similar. Furthermore, the six sampling points were distributed around the Kentieling river. The upper bedrock was missing, forming a skylight. Outcrops appeared in the aquifers of the Salawusu Formation in the river channel. Fissures and pores developed in the lower bedrock, which caused a large amount of surface water to replenish the groundwater. In addition, only six indicators—pH, TDS, HCO3, SO42, K+, and Na+—were considered effective in FDA. The variables Cl, Ca2+, and Mg2+ were not used in the source discrimination. Furthermore, the FDA method did not consider the hydrogeochemical characteristics simultaneously. For these reasons, the source of the gushing water sample G4 was regarded as surface water. In conclusion, the source of all the mine gushing water samples was concluded to be surface water.

4. Conclusions

Through field studies and experimental tests focusing on mine gushing water in Ningtiaota Coal Mine, 11 indicators, including pH, TDS, T, and the main ions, were measured in 40 water samples to characterize their hydrogeochemical characteristics. In this research, a self-organizing feature map was applied for discrimination of the source of mine gushing water. Water samples G1–G6 were identified as surface water based on the principle of them having similar hydrogeochemical characteristics as the surface-water cluster. In addition, FDA, water temperature, and traditional hydrogeochemical discrimination, including Piper and Gibbs diagrams, were employed to verify the SOM analysis as auxiliary measures. The results obtained by traditional hydrogeochemical methods were consistent with the SOM results. The water-temperature judgment and FDA had the respective defects of being susceptible to environmental interference and not considering the hydrogeochemical characteristics. The source of G4 was, thus, comprehensively judged to be surface water.
The SOM approach has important advantages in data visualization, dimensionality reduction, and clustering, and it is especially suitable for source analysis with abundant training samples. It can not only be used to quantify a source, but it also simultaneously considers the hydrogeochemical characteristics of a sample. This method reduces human interference in sample sets, and the results of source discrimination of mine gushing water, thus, have the characteristics of high efficiency and high precision. The proposed application of SOM provides a more satisfactory solution to the problem of discrimination of the source of mine gushing water. In summary, this research provides a scientific basis for mine-water hazard prediction, and water source anticipation and control. It provides theoretical support and a practical basis for policy formulation and mine-water hazard prevention.

Supplementary Materials

The following supporting information can be downloaded at: https://www.mdpi.com/article/10.3390/su14116551/s1, Table S1: Hydrogeochemical components.

Author Contributions

Conceptualization, Q.W. and Y.Z.; Formal analysis, D.Z., Y.Z. and Z.Z.; Methodology, D.Z., Y.Z., Q.W. and A.M.; Software, X.Z.; Validation. X.D.; Visualization, D.Z., Y.Z., S.G. and H.Z.; Writing—original draft, D.Z.; Writing—review and editing, D.Z., Y.Z. and S.G. All authors have read and agreed to the published version of the manuscript.

Funding

This work was sponsored by the National Natural Science Foundation of China (No. 42072284, No. 42027801, No. 41877186), National Key R&D Program of China (2021YFC2902004), the Major Science and Technology Projects of Inner Mongolia Autonomous Region (2020ZD0020-4), S&T Program of Hebei (20374207D), and the Fundamental Research Funds for the Central Universities (2022YQSH01). Research project on positive impacts of typical abandoned mines in Inner Mongolia support by Natural Resources Department of Inner Mongolia Autonomous Region, Evaluation and prediction of typical coal mine mining subsidence and surface movement rule in Ordos support by Natural Resources Department of Inner Mongolia Autonomous Region.

Institutional Review Board Statement

Not applicable.

Informed Consent Statement

Informed consent was obtained from all subjects involved in the study by the public opinion research agency that carried out the survey.

Data Availability Statement

Data available on request due to privacy restrictions.

Conflicts of Interest

The authors declare that they have no known competing financial interests or personal relationships that could have appeared to influence the work reported in this paper.

References

  1. Huang, X.J.; Wang, G.C.; Liang, X.Y.; Cui, L.F.; Ma, L.; Xu, Q.Y. Hydrochemical and Stable Isotope (δD and δ18O) Characteristics of Groundwater and Hydrogeochemical Processes in the Ningtiaota Coalfield, Northwest China. Mine Water Environ. 2018, 37, 119–136. [Google Scholar] [CrossRef]
  2. Xie, P.; Li, W.P.; Yang, D.D.; Jiao, J.J. Hydrogeological Model for Groundwater Prediction in the Shennan Mining Area, China. Mine Water Environ. 2018, 37, 505–517. [Google Scholar] [CrossRef]
  3. Hou, E.K.; Wen, Q.; Che, X.Y.; Chen, W.; Wei, J.B.; Ye, Z.N. Study on recognition of mine water sources based on statistical analysis. Arab. J. Geosci. 2019, 13, 5. [Google Scholar] [CrossRef]
  4. Liu, Z.B.; Zhao, R.J.; Dong, S.N.; Wang, W.K.; Sun, H.F.; Mao, D.Q. Scanning for water hazard threats with sequential water releasing tests in underground coal mines. J. Hydrol. 2020, 590, 125350. [Google Scholar] [CrossRef]
  5. Wu, Q.; Zhao, D.K.; Wang, Y.; Shen, J.J.; Mu, W.P.; Liu, H.L. Method for assessing coal-floor water-inrush risk based on the variable-weight model and unascertained measure theory. Hydrogeol. J. 2017, 25, 2089–2103. [Google Scholar] [CrossRef]
  6. Zeng, Y.F.; Wu, Q.; Liu, S.Q.; Zhai, Y.L.; Zhang, W.; Liu, Y.Z. Vulnerability assessment of waterbursting from Ordovician limestone into coal mines of China. Environ. Earth Sci. 2016, 75, 1431. [Google Scholar] [CrossRef]
  7. Zeng, Y.F.; Wu, Q.; Liu, S.Q.; Zhai, Y.L.; Lian, H.Q.; Zhang, W. Evaluation of a coal seam roof water inrush: Case study in the Wangjialing coal mine, China. Mine Water Environ. 2017, 37, 174–184. [Google Scholar] [CrossRef]
  8. Wu, Q.; Huang, X.L.; Dong, D.L.; Yin, Z.R.; Li, J.M.; Hong, Y.Q.; Zhang, H.J. “Three maps-two predictions” method to evaluate water bursting conditions on roof coal. J. China Coal Soc. 2000, 125, 60–65. [Google Scholar] [CrossRef]
  9. Wu, Q.; Zhang, Z.L.; Zhang, S.Y.; Ma, J.F. A new practical methodology of the coal floor water bursting evaluating Ⅱ: The vulnerable index method. J. China Coal Soc. 2007, 132, 1121–1126. (In Chinese) [Google Scholar]
  10. Wu, Q.; Fan, Z.L.; Liu, S.Q.; Zhang, Y.W.; Sun, W.J. Water-richness evaluation method of water-filled aquifer based on the principle of information fusion with GIS: Water-richness index method. J. China Coal Soc. 2011, 136, 1124–1128. [Google Scholar] [CrossRef]
  11. Liu, H.; Cao, Y. Technologies of Preventing Coal Mine Water Hazards for Sustainable Development in North China. Geotech. Geol. Eng. 2011, 29, 1–5. [Google Scholar] [CrossRef]
  12. Li, X.B.; Li, D.Y.; Liu, Z.X.; Zhao, G.Y.; Wang, W.H. Determination of the minimum thickness of crown pillar for safe exploitation of a subsea gold mine based on numerical modelling. Int. J. Rock Mech. Min. Sci. 2013, 57, 42–56. [Google Scholar] [CrossRef]
  13. Wu, Q.; Liu, S.Q.; Zeng, Y.F. The progress of the mine water prevention and control on basic principles in China. Annu. Meet. Int.-Mine-Water-Assoc. (IMWA) 2016, 122–126. (In Chinese) [Google Scholar]
  14. Yang, W.F.; Xia, X.H.; Pan, B.L.; Gu, C.S.; Yue, J.G. The fuzzy comprehensive evaluation of water and sand inrush risk during underground mining. J. Intell. Fuzzy Syst. 2016, 30, 2289–2295. [Google Scholar] [CrossRef]
  15. Chen, Y.; Zhu, S.Y.; Yang, C.W. Analysis of hydrochemical evolution in main discharge aquifers under mining disturbance and water source identification. Environ. Sci. Pollut. Res. 2021, 28, 26784–26793. [Google Scholar] [CrossRef]
  16. Sakizadeh, M.; Mirzaei, R.; Ghorbani, H. Geochemical influences on the quality of groundwater in eastern part of Semnan Province, Iran. Environ. Earth Sci. 2016, 75, 917. [Google Scholar] [CrossRef]
  17. Li, Y.P.; Shen, J.; Tao, J.J. Water source identification of the drained-produced horizons for the coalbed methane well based on support vector machine. Pet. Geol. Oilfield Dev. Daqing 2018, 37, 171–174. (In Chinese) [Google Scholar]
  18. Dong, D.L.; Chen, Z.Y.; Lin, G.; Li, X.; Zhang, R.M.; Ji, Y. Combining the Fisher Feature Extraction and Support Vector Machine Methods to Identify the Water Inrush Source: A Case Study of the Wuhai Mining Area. Mine Water Environ. 2019, 38, 855–862. [Google Scholar] [CrossRef]
  19. Mao, Z.Y.; Cui, P.J.; Huang, C.J.; Han, R.Y. KPCA-CS-SVM discrimination model of mine water inrush source. J. Liaoning Tech. Univ. 2021, 40, 104–111. (In Chinese) [Google Scholar]
  20. Zhang, H.; Xing, H.F.; Yao, D.X.; Liu, L.L.; Xue, D.R.; Guo, F. The multiple logistic regression recognition model for mine water inrush source based on cluster analysis. Environ. Geol. 2019, 78, 612. [Google Scholar] [CrossRef]
  21. Duan, X.L.; Ma, F.S.; Gu, H.Y.; Guo, J.; Zhao, H.J.; Liu, G.W.; Liu, S.Q. Identification of Mine Water Sources Based on the Spatial and Chemical Characteristics of Bedrock Brines: A Case Study of the Xinli Gold Mine. Mine Water Environ. 2022, 41, 126–142. [Google Scholar] [CrossRef]
  22. Jiang, C.L.; An, Y.Q.; Zheng, L.G.; Huang, W.W. Water Source Discrimination in a Multiaquifer Mine Using a Comprehensive Stepwise Discriminant Method. Mine Water Environ. 2021, 40, 442–455. [Google Scholar] [CrossRef]
  23. Hao, Q.; Wu, X.; Mu, W.P.; Deng, R.C.; Hu, B.Y.; Gao, Y. Groundwater source determination of mine inflow or inrush using a random forest model. Sci. Technol. Eng. 2020, 20, 6411–6418. (In Chinese) [Google Scholar]
  24. Bouzourra, H.; Bouhlila, R.; Elango, L.; Slama, F.; Ouslati, N. Characterization of mechanisms and processes of groundwater salinization in irrigated coastal area using statistics, Gis, and hydrogeochemical investigations. Environ. Sci. Pollut. Res. 2015, 22, 2643–2660. [Google Scholar] [CrossRef] [PubMed]
  25. Najib, S.; Fadili, A.; Mehdi, K. Conntribution of hydrochemical and geoelectrical approaches to investigate salinization process and seawater intrusion in the coastal aquifers of Chaouia, Morocco. J. Contam. Hydrol. 2017, 198, 24–36. [Google Scholar] [CrossRef]
  26. Kuroda, K.; Hayashi, T.; Do, T.D.; Canh, C.V.; Nga, T.T.V.; Funabiki, A.; Takizawa, S. Groundwater recharge in suburban areas of Hanoi, Vietnam: Effect of decreasing surface water bodies and land-use change. Hydrogeol. J. 2017, 25, 727–742. [Google Scholar] [CrossRef]
  27. Xu, Z.M.; Sun, Y.J.; Gao, S.; Zhao, X.M.; Duan, R.Q.; Yao, M.H.; Liu, Q. Groundwater Source Discrimination and Proportion Determination of Mine Inflow Using Ion Analyses: A Case Study from the Longmen Coal Mine, Henan Province, China. Mine Water Environ. 2018, 37, 385–392. [Google Scholar] [CrossRef] [Green Version]
  28. Petitta, M.; Primavera, P.; Tuccimei, P. Interaction between deep and shallow groundwater systems in areas affected by Quatemary tectonics (Central Italy): A geochemical and isotope approach. Environ. Earth Sci. 2011, 63, 11–30. [Google Scholar] [CrossRef]
  29. Mauryaa, P.; Kumaria, R.; Mukherjeeb, S. Hydrochemistry in integration with stable isotopes (δ18O and δD) to assess seawater intrusion in coastal aquifers of Kachchh district, Gujarat, India. J. Geochem. Explor. 2019, 196, 42–56. [Google Scholar] [CrossRef]
  30. Potot, C.; Féraud, G.; Schärer, U. Groundwater and river baselinequality using major, trace elements, organic carbon and Sr–Pb–Oisotopes in a Mediterranean catchment: The case of the lower VarValley (south-eastern France). J. Hydrol. 2012, 472, 126–147. [Google Scholar] [CrossRef]
  31. Wu, Q.; Mu, W.P.; Xing, Y.; Qian, C.; Shen, J.J.; Wang, Y.; Zhao, D.K. Source discrimination of mine water inrush using multiple methods: A case study from the Beiyangzhuang Mine, Northern China. Bull. Eng. Geol. Environ. 2019, 78, 469–482. [Google Scholar] [CrossRef]
  32. Ma, L.; Qian, J.Z.; Zhao, W.D. An approach for quickly identifying water-inrush source of mine based on GIS and groundwater chemistry and temperature. Coal Geol. Explor. 2014, 42, 49–53. [Google Scholar]
  33. Yan, P.C.; Zhou, M.R.; Liu, Q.M.; Wang, R.; Liu, J. Research on the Source Identification of Mine Water Inrush Based on LIF Technology and SIMCA Algorithm. Spectrosc. Spectr. Anal. 2016, 36, 243–247. [Google Scholar] [CrossRef]
  34. Wu, Y.L. Mining-Induced Environmental Engineering Geological Pattern Zoning in Yushen Coal Mining Area, Northern Shaanxi; China University of Mining & Technology: Beijing, China, 2017. [Google Scholar]
  35. Kohonen, T. Self-organized formation of topologically correct feature maps. Biol. Cybern. 1982, 43, 59–69. [Google Scholar] [CrossRef]
  36. Kohonen, T.; Schroeder, M.R.; Huang, T.S. Self-Organizing Maps; Springer: Berlin/Heidelberg, Germany, 1997. [Google Scholar]
  37. Zhu, G. Characteristics of Groundwater Environment and Heavy Metals Transport in a Typical Metal Mine in Tongling, Anhui Province; China University of Geosciences: Beijing, China, 2018. [Google Scholar]
  38. Baghanam, A.H.; Nourani, V.; Aslani, H.; Taghipour, H. Spatiotemporal variation of water pollution near landfill site: Application of clustering methods to assess the admissibility of LWPI. J. Hydrol. 2020, 591, 125581. [Google Scholar] [CrossRef]
  39. Cereghino, R.; Park, Y.S. Review of the Self-Organizing Map (SOM) approach in water resources: Commentary. Environ. Model. Softw. 2009, 24, 945–947. [Google Scholar] [CrossRef]
  40. Wu, C.; Fang, C.; Wu, X.; Zhu, G.; Zhang, Y.Z. Hydrogeochemical characterization and quality assessment of groundwater using self-organizing maps in the Hangjinqi gasfield area, Ordos Basin, NW China. Geosci. Front. 2020, 12, 781–790. [Google Scholar] [CrossRef]
  41. Zhao, W.; Liu, Q.M.; Chai, H.C.; Zhang, M.; Xie, Z.G. Identification of water inrush source based on fisher discriminant method and centroid distance theroy. Sci. Technol. Eng. 2020, 20, 3552–3556. (In Chinese) [Google Scholar]
  42. Xiao, Y.; Hao, Q.C.; Zhang, Y.H.; Zhu, Y.C.; Yin, S.Y.; Qin, L.M.; Li, X.H. Investigating sources, driving forces and potential health risks of nitrate and fluoride in groundwater of a typical alluvial fan plain. Sci. Total Environ. 2021, 802, 149909. [Google Scholar] [CrossRef]
  43. Xiao, Y.; Liu, K.; Hao, Q.C.; Xiao, D.; Zhu, Y.C.; Yin, S.Y.; Zhang, Y.H. Hydrogeochemical insights into the signatures, genesis and sustainable perspective of nitrate enriched groundwater in the piedmont of Hutuo watershed, China. Catena 2022, 212, 106020. [Google Scholar] [CrossRef]
  44. Yu, H.; Gui, H.; Zhao, H.; Wang, M.; Li, J.; Fang, H.; Jiang, Y.; Zhang, Y. Hydrochemical characteristics and water quality evaluation of shallow groundwater in Suxian mining area, Huaibei coalfield, China. Int. J. Coal Sci. Technol. 2020, 7, 825–835. [Google Scholar] [CrossRef]
  45. Zhang, K.; Li, H.; Han, J.; Jiang, B.; Gao, J. Understanding of mineral change mechanisms in coal mine groundwater reservoir and their influences on effluent water quality: A experimental study. Int. J. Coal Sci. Technol. 2020, 8, 154–167. [Google Scholar] [CrossRef]
  46. Lewińska-Preis, L.; Szram, E.; Fabiańska, M.J.; Nádudvari, Á.; Misz-Kennan, M.; Abramowicz, A.; Kruszewski, Ł.; Kita, A. Selected ions and major and trace elements as contaminants in coal-waste dump water from the Lower and Upper Silesian Coal Basins (Poland). Int. J. Coal Sci. Technol. 2021, 8, 790–814. [Google Scholar] [CrossRef]
  47. Xiao, Y.; Liu, K.; Hao, Q.C.; Li, Y.S.; Xiao, D.; Zhang, Y.J. Occurrence, Controlling Factors and Health Hazards of Fluoride-Enriched Groundwater in the Lower Flood Plain of Yellow River, Northern China. Expo. Health 2022, 14, 345–358. [Google Scholar] [CrossRef]
  48. Qiu, H.; Gui, H.; Fang, P.; Li, G. Groundwater contamination and human health risk based on Monte Carlo simulation in a typical mining area in Northern Anhui Province, China. Int. J. Coal Sci. Technol. 2021, 8, 1118–1129. [Google Scholar] [CrossRef]
  49. Mursito, A.T.; Widodo; Arifin, D.N. Characterization of bio-coal briquettes blended from low quality coal and biomass waste treated by Garant® bio-activator and its application for fuel combustion. Int. J. Coal Sci. Technol. 2020, 7, 796–806. [Google Scholar] [CrossRef] [Green Version]
  50. Sun, K.; Fan, L.; Xia, Y.; Li, C.; Chen, J.; Gao, S.; Wu, B.; Peng, J.; Ji, Y. Impact of coal mining on groundwater of Luohe Formation in Binchang mining area. Int. J. Coal Sci. Technol. 2021, 8, 88–102. [Google Scholar] [CrossRef]
Figure 1. Map of the study area and the stratigraphic map ((a) Geographical location of the coal mine. (b) Hydrogeologic profile. (c) stratigraphic map).
Sustainability 14 06551 g001
Figure 2. Hydrogeological profile.
Sustainability 14 06551 g002
Figure 3. Neural matrix visualization of the SOM for individual indexes—pH, TDS, HCO3, SO42, Cl, K+ + Na+, Ca2+, Mg2+, and NO3—in all samples.
Sustainability 14 06551 g003
Figure 4. SOM neural network clustering pattern classification map.
Sustainability 14 06551 g004
Figure 5. Piper trilinear diagram.
Sustainability 14 06551 g005
Figure 6. Gibbs diagrams.
Sustainability 14 06551 g006
Figure 7. Spatial distribution of water sample discriminant function.
Sustainability 14 06551 g007
Table 1. Distance of gushing water to the centroid.
Gushing WaterDistance to the Centroid of PDistance to the Centroid of J2zDistance to the Centroid of J2yDistance to the Centroid of S
G111.07413.24412.04210.618
G22.2532.9371.9341.648
G317.70018.93718.30616.066
G45.6659.1057.1577.609
G527.63427.46327.67424.761
G63.6453.9413.4551.313
Publisher’s Note: MDPI stays neutral with regard to jurisdictional claims in published maps and institutional affiliations.

