Article

A Study on the Factors Affecting Academic Achievement in the Non-Face-to-Face Class Environment Due to COVID-19: Focusing on Computer Liberal Arts Education Class

1
Department of Software, College of Computing and Informatics, Sungkyunkwan University, Seoul 03063, Korea
2
Department of Electrical, Electronic & Communication Engineering, Hanyang Cyber University, Seoul 04764, Korea
3
Department of Information Systems, Hanyang University, Seoul 04764, Korea
*
Author to whom correspondence should be addressed.
Sustainability 2022, 14(11), 6547; https://doi.org/10.3390/su14116547
Submission received: 27 April 2022 / Revised: 24 May 2022 / Accepted: 24 May 2022 / Published: 27 May 2022

Abstract

:
As a result of the COVID-19 pandemic, many universities have shifted to non-face-to-face classes resulting in numerous changes in the educational system. Since programming education includes a greater proportion of practice than theory-oriented courses, non-face-to-face classes have several constraints. As a result, to properly execute software education and enhance educational performance for non-major students, it is required to conduct research. Students’ psychological moods and activities collected in online classrooms were used to investigate factors impacting academic success as measured by scores and grades. Multiple regression analysis and logistic regression analysis were conducted by using data mining analytical approach. Attendance, effort expectancy, hedonic motivation, confidence, frequency of communication in mobile chat rooms, and Python programming intention factors were retrieved as an outcome of the performance. The relevance of the factors was confirmed, and it was revealed that hedonic motivation was crucial for students in Class A, while attendance had a significant impact on academic progress for students in the other grades. The goal of this research is to assist university organizations in making decisions by enhancing computer liberal arts education and offering implications for future non-face-to-face teaching environments such as during the COVID-19 pandemic.

1. Introduction

Digital transformation has been conducted in various industrial areas, and the demand for software (SW) engineers and developers has increased. Even though the information systems have been enormous and complicated, which has also increased the demand for information technology (IT) outsourcing companies, acquiring appropriate IT members is still difficult [1]. Furthermore, one of the reasons for the company’s failure is the absence of proficient developers [2], as fostering proficient developers is demanding. Therefore, several countries and private organizations, including the United Kingdom, Brazil, the United States, and Australia, are focusing on developing SW talent with the help of quite a few corporations [3]. In Korea, education is conducted in elementary and middle schools to enhance the public’s understanding of SW and spread the use of SW by revising the SW Promotion Act [4], and related education is being conducted for non-major students through the SW-centered university project [5]. In accordance with this SW-centered national strategy, universities promoted the expansion of opportunities for technical education to non-major students, who do not belong to IT-related departments.
Meanwhile, due to the COVID-19 epidemic, many schools in Asia have introduced many changes in the education system by closing or by converting non-face-to-face classes using IT. In Hong Kong, after-school activities for adolescent students were completely stopped, but artistic intelligence education was conducted using social networking services (SNS) such as Edmodo [6]. In Indonesia, the outcome of using the WhatsApp application resulted in students’ perception of online classes being positive [7]. South Korea’s education system is no exception, the Ministry of Education recommended that schools be postponed for several weeks and then hold telecommuting classes such as remote classes and classes for using assignments [8]. However, according to research by Kaffenberger (2021), after three months of school closures, students will experience more than a year of learning loss because they will have fallen behind the curriculum when they re-enter school, which requires systematic efforts centered on mitigation strategies [9]. Therefore, a novel term, emergency remote teaching (ERT), has been proposed, which is a concept distinct from planned and designed online classes and is a temporary teaching method for sustainable education in crisis situations. The decisive difference between ERT and online classes is that ERT returns to its original offline class when the crisis is over [10].
In this unusual circumstance, where non-face-to-face online classes have replaced face-to-face classes, it is essential to examine the elements that influence academic accomplishment to properly perform SW education and improve educational performance to non-major levels. Furthermore, due to a shortage of trained SW workers, academic accomplishment might be a significant signal for minimizing future company failures and developing sustainable SW education. In addition, via analysis, assessment, and feedback, the quality of classes may be increased by such a virtuous cycle approach.
As a result, from the second semester of 2020 to the first semester of 2021, this study gathers the characteristics of 463 college students who took Python programming classes in a non-face-to-face categorization. The extended unified theory of acceptance and application of technology (UTAUT2) model in Venkatesh, Thong, and Xu (2012) was used to collect survey data on Python programming intention and Keller’s confidence (1987). In addition, there is a class attendance rate and the frequency of interactions in the online chat room. Through multiple regression analysis and logistic regression analysis, we statistically conduct building, evaluation, and forecasting. Additionally, decision trees are utilized to compare the effect of distinctive characteristics.
The level of learning completion by students can be used to assess the efficacy of a class [11]. Academic accomplishment is an index that may indicate the degree of learning, and elements impacting academic achievement are retrieved in this study. It is noteworthy in this regard since an empirical study was conducted to examine the features of non-majors who finished programming topics in a non-face-to-face way. Furthermore, unlike most research on programming challenges that assume a face-to-face setting, this study extracts characteristics that impact academic accomplishment in non-face-to-face classrooms and offers aspects that need to be considered for effective online programming programs. This research intends to enhance computer liberal arts education and offer implications for responding to future changes in the non-face-to-face educational environment, such as COVID-19.
The following are the components of this research. The theoretical underpinning of this study is explained in Section 2, as well as the differences and uniqueness it has in comparison to previous investigations. The analysis methodologies and processes utilized to carry out the study are discussed in Section 3. The findings of the analysis are described in Section 4. Conclusions and future research are discussed in Section 5.

2. Theoretical Background

2.1. A Study on Online Education on COVID-19 Situation

The COVID-19 pandemic situation, which was suddenly encountered around the world, also had a significant impact on education. A 2020 report published by UNESCO found that the studies of nearly 90% of learners worldwide were disrupted by school closures in March 2020 [12]. Furthermore, from K12 to universities, offline face-to-face classes converted to online classes without sufficient consideration [13]. Therefore, various studies have been conducted according to this situation.
Allam et al. (2020) investigated the readiness of 631 students in the Mass media department for online remote education programs that were implemented unexpectedly due to COVID-19 [14]. Understanding students’ preparedness for online remote education, which includes computer literacy and Internet access, is critical to the effectiveness of online remote education. As platforms such as Google Meet, Zoom, and Cisco Webex demand computer literacy, such as receiving invitation links, turning on cameras and microphones, waiting for manager approval, and being ethically awake when participating in conversations, it is difficult to use e-learning platforms effectively if you do not have these skills. Furthermore, self-directed learning is an important aspect of online learning, and the success or failure of online remote learning is dependent on the motivations of students. Students were randomly selected, and questionnaire survey approaches were utilized to achieve this goal. Seven items on computer, smartphone, and Internet use, as well as demographic data and 16 e-learning readiness ratings, are included in the survey. Students had a very good degree of digital literacy, yet low self-directed learning capacity and learning desire, according to the findings of the study. Students found that online distance learning is strange to them, that they have little contact with teachers, and that stress management is difficult, resulting in poor academic performance. As a result, the instructor encouraged students to describe how the online environment may be used in class while conducting online remote lessons. It was suggested to give appropriate learning resources that can interact, collaborate, and motivate students in order to increase learning motivation. It was also recommended that a study group be formed so that students may make online acquaintances with one another.
Almusharraf and Khahro (2020) investigated the factors that impact students’ happiness with online learning, as well as technical training and appropriate guidance [15]. This study conducted online English as a foreign language (EFL) classes for college students and investigated their attitudes and performance outgrowths of changes in the classroom setting, online platforms, and preferred teaching and learning techniques. During the COVID-19 pandemic, an analysis of 283 students indicated that all students were extremely happy with online education and teacher follow-up management through Moodle, an open-source e-learning platform, as well as WhatsApp and e-mail, a social networking tool for group communication. Alternative assessments were deemed to be satisfactory by students, with projects, question-based, open examinations, assignments, and presentations proving to be useful evaluation methods. More significantly, self-efficacy and self-regulated learning were shown to be mediated by the online environment.
Many individuals have become psychologically exhausted as a consequence of the COVID-19 epidemic. As variables such as anxiety, sadness, and exhaustion diminish learning motivation in e-learning, Dirzyte et al. (2021) emphasized the importance of mental health-related factor research [16]. In the COVID-19 setting, this study tried to examine the association between mental health characteristics and learning motivation of students studying computer programming through e-learning. They examine how the current emotional states of learners are connected to learning motivation, as well as how sadness, anxiety, and exhaustion scores are related to learning motivation, as well as how external learning motivation variables influence mental health aspects. The research involved 444 students, of whom 189 (42.6%) learnt computer programming through e-learning, while others studied social science through e-learning. Among participants in e-learning-based computer programming courses, the study discovered that internal motivating variables of individual attitudes and expectations minimized fatigue, whereas clear guidance, rewards and perceptions, anxiety, and depression increased overall fatigue. Participants and nonparticipants in e-learning-based computer programming courses had different relationships with learning motivation variables, anxiety, depression, and weariness. It is unclear why students’ attitudes and expectations during computer programming e-learning indicated a decrease in general weariness, whereas other e-learning students’ attitudes and expectations suggested an increase. This study discovered that scores of intrinsic and external learning motivation components were correlated with mental health indicators, such as sadness, anxiety, and weariness. Furthermore, the mental health of participants and non-participants in e-learning-based computer programming courses was closely connected to the motivational elements of difficult objectives.

2.2. A Study on Programming Education

The importance of programming education is being emphasized in the educational field. In SW education, educational core values are re-established, and computational thinking (CT) is recognized as a key element in educational activities [17,18]. Dr. Seymour Papert used the original notion of CT for the first time in academic research, and Dr. Jeannette Wing supplemented the academic definition of CT [19]. The term CT refers to a technological activity that designs systems that can solve problems in computer science and improves the scope of human thinking. Previous research suggests that SW education helps both students with majors and non-majors improve their scientific thinking skills [20]. In addition, SW education is important in terms of improving students’ logical thinking ability and problem-solving ability in the process of learning programming [21].
However, programming courses are among the ones with a higher failure rate. In this respect, Bosse and Gerosa (2016) investigated why programming is difficult to learn [3]. From 2010 to 2014, the study’s classes served as the foundation for programming classes at the University of Sao Paulo. At first, 18,784 people applied for the course, but 30% dropped out or earned an F. There was a difference in failure rates between majors and non-majors, with 25.1 percent of majors failing compared to 30.3 percent of non-majors failing. The reasons why students find it difficult were “grammar error”, “variable type”, “parameter transfer when using a function”, and “use an array”. Logical reasoning was the reason why the instructor’s pupils found it challenging. In the case of the language C, it was found that the choice of programming language also affects students because it has more specific grammatical characteristics.
Dawson et al. (2018) created and established distinct programming sessions for non-majors to provide positive computer science experiences, with the learning aim of completing data analysis and visualization projects to systematically solve their academic challenges particularly [22]. Students spent most of their time listening to brief lectures and working in small groups to solve problems, and they were able to receive peer help during this process.

2.3. A Study on Factors of Learner’s Characteristics

This research examines learners’ psychological states and actions in online classrooms. Intention and confidence to utilize Python programming are examples of psychological state, whereas activity content includes attendance and frequency of communication in open chat rooms.
The learner’s psychological condition comes first. The actual action is heavily influenced by one’s intentions [23]. Venkatesh, Thong, and Xu (2012) proposed an extended unified theory of acceptance and use of technology (UTAUT2) model to investigate the elements that influence consumers’ adoption of new technologies as well as their behavioral intentions [24]. UTAUT2 is the most inclusive as it has been developed through integrating other theories or models; independent variables affect the parameters of the behavioral intention, and consequently, the dependent variable, use behavior. This model has been utilized in various fields of research. In Chao (2019)’s research, which conducted an analysis of the structural equation model between the effort expectancy, performance expectancy, and behavioral intention of the UTAUT model for mobile learning of college students, it was found that effort expectancy is lower than performance expectancy, and even in the absence of a modulator main effect, the effort expectancy was found to be statistically insignificant [25]. Another study by Bilegjargal and Hsueh (2021) involved research on online judge systems via the UTAUT2 model which graded assignments that students had completed in the programming class, and it was concluded that hedonic motivation exerts the greatest statistical influence on behavioral intentions of both the CS and non-CS students [26]. Lastly, Cheon et al. (2022) verified this model regarding the Python programming being novel technology to the non-major students [27,28].
In this paper, researchers use the UTAUT2 model’s performance expectancy (PE), effort expectancy (EE), social influence (SI), facilitating conditions (FC), hedonic motivation (HM) factors, and predictors to assume that students’ Python programming intention (PPI) and academic achievement would be high if they continued to use it. Furthermore, behavioral intention (BI) is converted to Python programming intention (PPI) according to the Python programming course and then used as a predictor.
Keller’s ARCS model [29] identifies variables such as attention, relevance, confidence, and pleasure that are important in motivating learners, as well as tactics that assist in their implementation. Among them, student motivation is influenced by confidence. People’s anxiety levels will be reasonably low if they are confident in their skills and the work is not too demanding [30]. They will consistently endeavor to attain their objectives if they are confident in their abilities and the task is not too difficult. According to research by Stankov, Morony, and Lee (2014), confidence is statistically connected to mathematical success and has the most impact [31]. Huett et al. (2008) mentioned that even though the student has high education motivation, their confidence might be affected by the learner’s isolation, unfamiliar virtual education environment, and distance between professors [32]. Burger and Blignaut (2007) analyzed South African students’ computer literacy performance predictions based on psychological characteristics, and confidence was shown to be a statistically significant component [33]. Furthermore, Stankov (2013) conducted literature research about psychological non-cognitive factors with potential influence on academic performance, and it was revealed to have a high correlation by yielding a confidence score greater than 0.45 [34].
In this paper, students who have complete confidence expect that their academic success would be high, and Keller’s course interest survey includes several confidence questions as predictors. The following are the questions that were chosen.
  • With even little luck, I’ll be able to achieve good grades in this class.
  • My ability to succeed in this class is dependent on my efforts.
  • I am confident that if I study well with this subject, I will succeed.
  • I believe the level of challenge in the class is acceptable since it is neither too easy nor too challenging.
The following is the content of the learner’s activities. According to Morgan (2015), attendance and academic faithfulness are complicated for teachers who supervise the virtual school environment. Even though there were many conclusions indicating that the relationship between attendance rate and academic achievement had a positive correlation at the beginning of active research, subsequent studies suggested that it was not a significant factor or even did not possess any relationship [35]. Woodfield, Jessop, and McMillan (2006) claim that attendance is important for both male and female students in their final degree [36]. According to a study by Halpern (2007), even if students’ attendance has a significantly positive influence on academic achievement [37], it was somewhat insufficient compared to other factors. Credé, Roch, and Kieszczynka (2010) and Guleker and Keci (2014) also found a positive correlation [38,39]. Choi (2016) used demographic, school life, psychological, and learning management system data to predict test performance, and the association between absence days and test scores was the strongest, but it was determined to be negligible in multiple regression analysis [40]. Choi-Lundberg et al. (2020) also exhibited minimal correlation [41]. However, according to an examination by Xhomara (2017), a correlation was calculated between lecture attendance and grades and bivariate linear regression, which was found to be statistically noteworthy [42], and Lu and Cutumisu (2022) found that attendance encourages performance through online learning participation and formative evaluation results [43].
Since text messaging and group chatting are now feasible all around the world thanks to the widespread use of smartphones, incorporating these technologies into the classroom has become straightforward. A mobile-based social media platform can influence not only how people communicate, but also create learning processes [44]. Although some students and teachers feel distant due to communication rather than physical distance [45], the total amount of time learners spend communicating with teachers positively affects students’ attitude toward instruction, helping and motivating students to better understand the content of instruction [46]. According to Ingerhan (2012), the efficacy of online learning declines dramatically when students have trouble connecting with teachers [47]. Students responded that Kakao Talk chats helped them comprehend other students’ perspectives and experiences, according to the research by Wrigglesworth (2019), as a consequence of using Kakao Talk, one of Korea’s most popular mobile messengers, in foreign language class sites [48]. Choi et al. (2021) utilized SNS communication tools for group chat in online classes and performed a focus group interview with students, which made them feel it was convenient to check class information immediately and they were satisfied that they could contact their instructors in real time [13]. Khan et al. (2017) conducted a cross-sectional study of the performance of three groups (1. control group, 2. face-to-face class + WhatsApp, 3. face-to-face class + WhatsApp + learning management system) and used WhatsApp messenger to help students participate in the discussion and escalate the learning ability [49].
In this paper, online class attendance and conversation frequency in open chat rooms are used as predictors of academic achievement.

3. Proposed Model

Data mining, also known as knowledge discovery, machine learning, and predictive analysis [50], is the process of searching for meaningful patterns in data. Data mining analysis is carried out in this study by using procedures shown in Figure 1.
Data preparation based on business knowledge in Step 1 comprehends the data generation process and prepares the data for data mining analysis.
The second step is exploratory data analysis, process of finding features through data preparation and the search for a fundamental knowledge of data. The Cronbach’s alpha value is used to assess the questionnaire’s reliability. In addition, to determine the main features of students’ academic accomplishment, a comparison analysis of the average of the questionnaire items is undertaken.
The goal of Step 3 is to limit the number of characteristics in the dataset without sacrificing model performance, as containing too many attributes in the dataset increases the model’s complexity [50].
Stage 4 is to build a model using an algorithm, which is a step that involves choosing and implementing an acceptable analytic approach. The prediction of score and grade is achieved by using multiple regression analysis and logistic regression analysis approaches, respectively, centered on the factors chosen in step 3.
Step 5 is the verification of the model. In general, the predictive analysis construction method divides data into two categories: learning and testing [50]. If the procedure of confirming performance with a fixed test set is repeated in this scenario, the model becomes a model that only performs well for the test set. As a result, cross validation is utilized, which divides the data into k sections and conducts k assessments.
In step 6, decision trees are used to assess the relevance of variables. The relative significance of a variable may be confirmed using standardized regression coefficients in a four-step regression analysis, but it is not feasible to assess whether the variable is significantly important [51]. Decision trees, on the other hand, are simple to utilize from the perspective of an analyst and to interpret the findings from the perspective of a business user [50]. Furthermore, decision tree analysis is used to determine the hierarchical link between elements.

4. Experiment Result

4.1. Step1

First, the understanding of business in step 1 is as follows. Creative programming liberal arts courses for non-majors were opened in the second semester of 2020 and the first semester of 2021, and Python programming sessions were held for 15 weeks. The class covered both theory and practice of web scraping for data analysis using Python. In the second semester of 2020, there were two divisions, and in the first semester of 2021, there were four divisions. One division for each semester was committed to a class that could only be taken by liberal arts students. Due to COVID-19, all six classes were held via online recording lectures, and the same instructor taught the same class and evaluated by the same students.
The contents of Table 1 indicate how attributes are divided into students’ psychological states and activities.
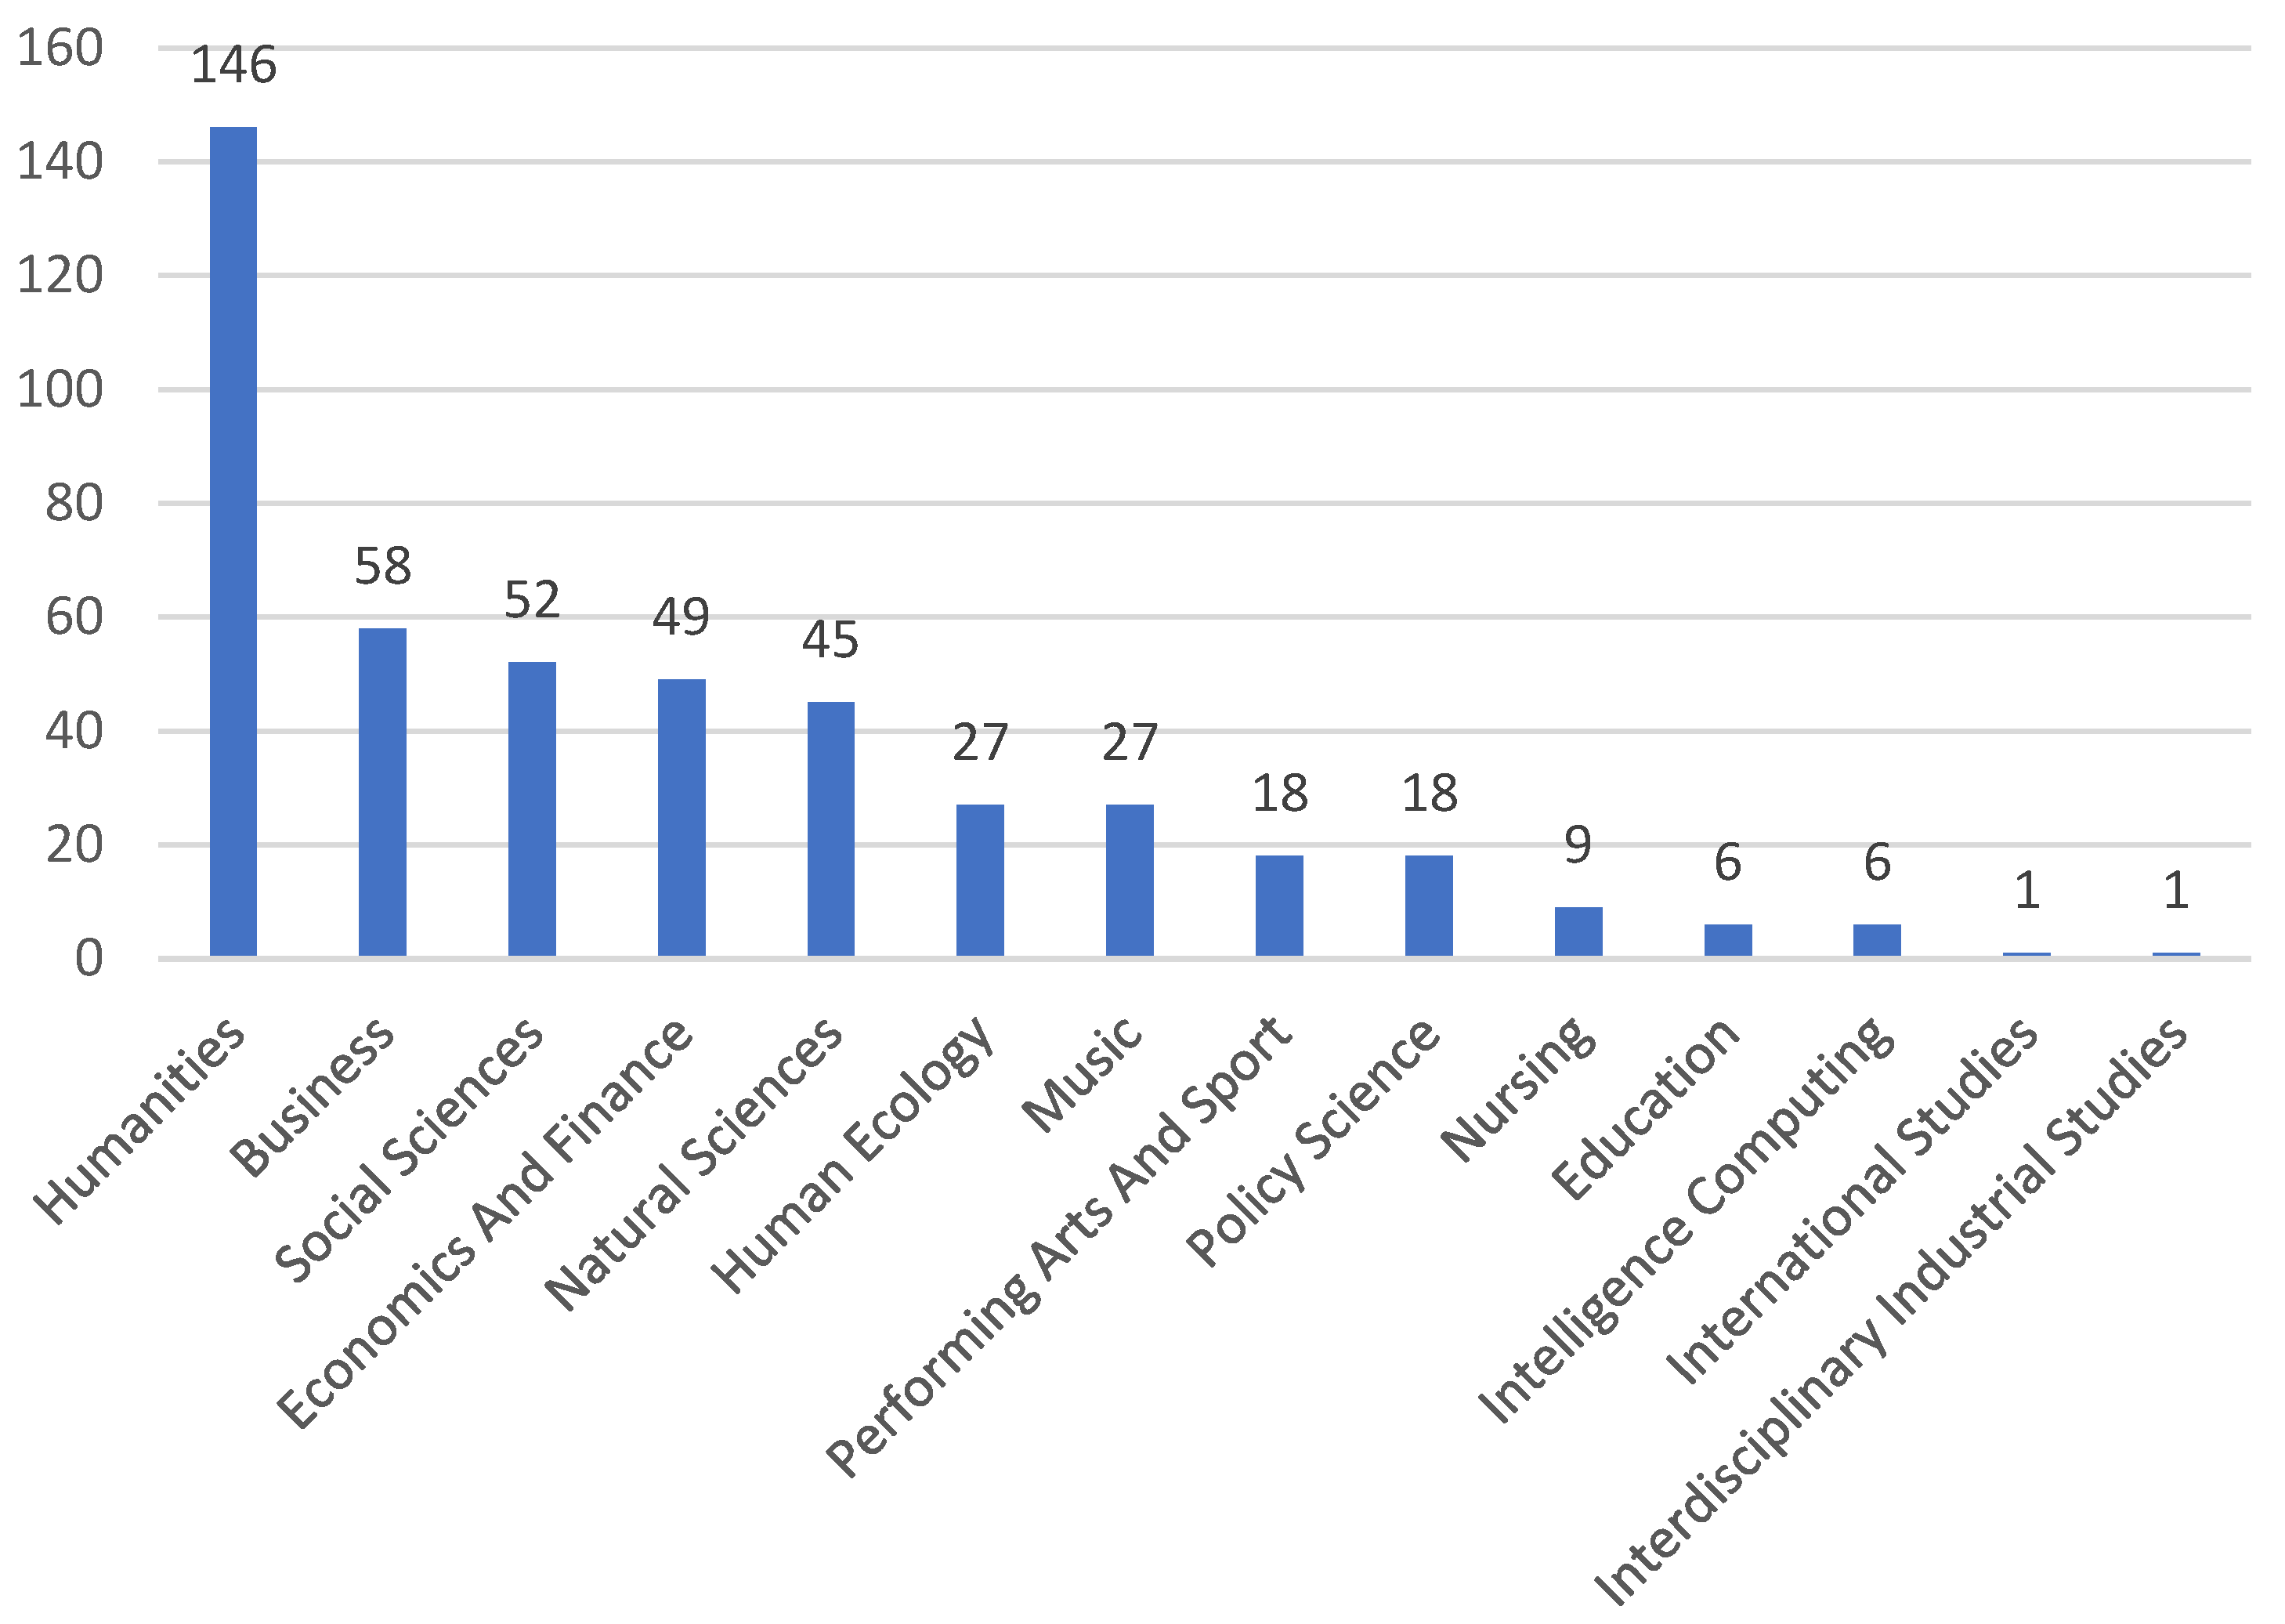
The psychological conditions were assessed using a questionnaire approach. The surveys all employed a seven-point Likert scale, and the measurements were taken right before the final test in Week 15. Prior to the survey, all students were requested to discuss the study’s goal, ensure the confidentiality of personal information, and perform the survey independently. A total of 509 students were surveyed, with 463 responding (excluding F credits and unresponsive students). The proportion of students attending humanities universities is the greatest, as indicated in Figure 2.
Academic achievement is defined as the sum of a final score (numerical type) and a grade (binary type). Actual students receive a total of 100 points, with 10 points given for attendance, 10 points granted for assignments, 40 points allocated for midterms, and 40 points assigned for final examinations. Since attendance is a factor in this study, this score is removed, resulting in a total score ranging from 0 to 90. The grade is based in part on the school’s relative evaluation 4 policy, which is implemented in actual courses. Relative evaluation 4 employs a ratio of up to 40% achieving grade A in the number of students in one class, with the other students achieving B, C, D, and F. This researcher set A at up to 40% in the real class, but confirmed in the final study data that the score fluctuates depending on the class. For example, one class scored an A with 75 points, whereas the other obtained a B. As a result, students with 70 points or more were assigned to A, while the remainder of the students were assigned to B. A grade accounted for 36% of the total 509 students, and 185:278 of the 463 students who eventually achieved an A grade, accounting for 40%.

4.2. Step2

In the second step, exploratory data analysis was performed centering on the collected data, and the analysis SW used was SPSS v. 24 (IBM Korea, Seoul, Korea). First, we investigated the Cronbach’s alpha value, which evaluates the reliability of a measurement method consisting of several items, to measure the reliability of the questionnaire questions. All questionnaire questions are judged to be 0.8 or higher, as shown in Table 2, and the reliability of the measurement item is high.
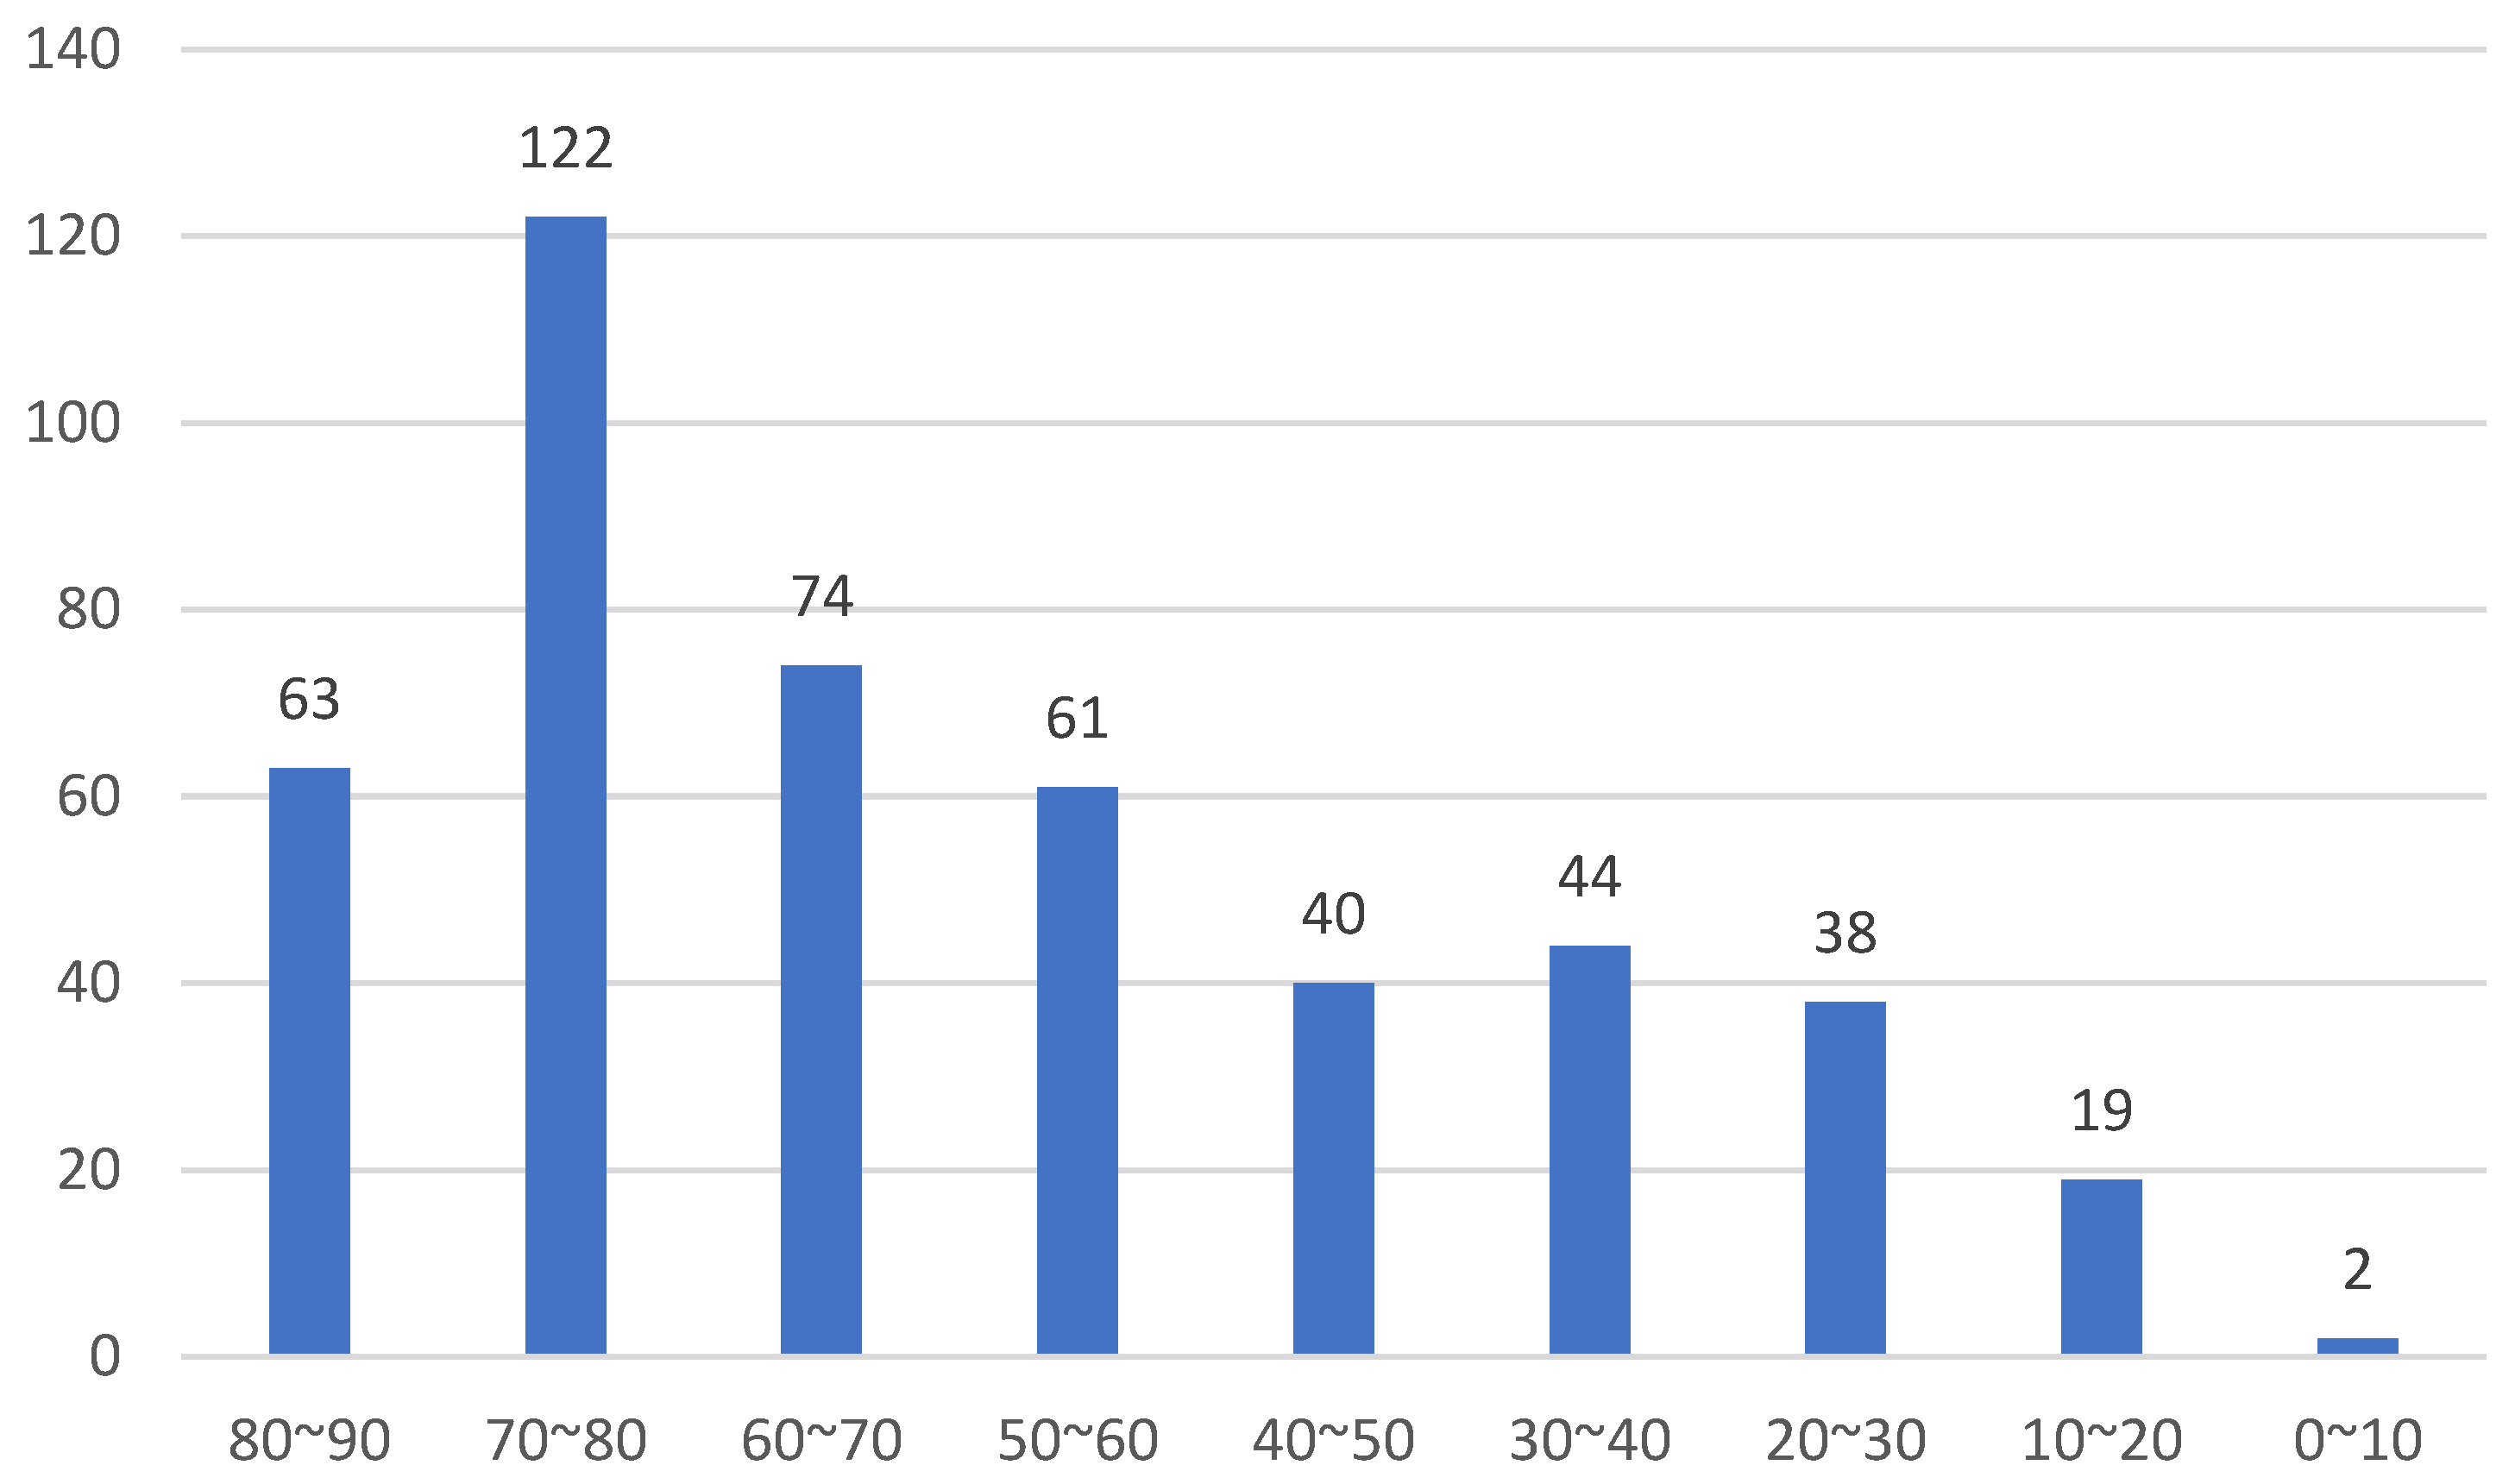
As a result of checking the distribution of scores of the following students, it is confirmed that the 70 points range is the most common and the 60 points range is the second most common, as shown in Figure 3.
The following is an example of Student’s t-test. The t-test was used to compare the characteristics of pupils with A and B grades. The t-test results are presented in Table 3 below. According to Levene’s equal variance test statistic F value, if the significance probability is greater than 0.05, it is performed as equal variances assumed, and if it is less than 0.05, it is performed as a t-test as equal variances not assumed. Except for Kakao Talk, all factors were judged to be statistically significant because their values were less than 0.05. Taking this into account, it is judged that the average of psychological state and activity factors of the students are different, between the students who received grade A and those received grade B.

4.3. Step3

Stage 3 is a feature selection step for score and rating labels, with RapidMiner studio v. 9.10 (RapidMiner Korea, Seoul and Korea) as the analytic SW. RapidMiner’s feature selection includes a filter method and a wrapper technique. The filter technique ranks a criterion and picks only the top characteristics, whereas the wrapper approach iteratively adds or excludes attributes from the current set of attributes to improve accuracy [52,53,54]. The filter technique is typically employed when the number of attributes is very large or computational cost is an essential concern, but the number of attributes in this study is not great, thus, the wrapper approach is utilized.
First, here are the findings of the score analysis. RapidMiner was used to accomplish wrapper-type forward selection and backward elimination. Checking R squared revealed that the forward technique yielded a greater value compared to the backward approach, whose values were 0.343 and 0.323, respectively. The following are the attributes and contents that were chosen.
  • Score: Attendance, EE3, HM2, PPI2, C3
    • EE3: Python programming is easy for me to use.
    • HM2: I find Python programming interesting.
    • PPI2: I will always attempt to utilize Python in my schoolwork and other activities.
    • C3: I feel that if I work hard in this class, I can succeed.
Second, we present the outcome of the grade analysis. Forward selection and background estimation were performed as in the previous example, and it was proven that the former had an accuracy of 72.35 percent, while the latter had an accuracy of 69.11 percent, which was greater than the latter. The following are the attributes and contents that were chosen.
  • Grade: Attendance, Kakao, EE3, HM1, PPI1
    • EE3: Python programming is easy for me to use.
    • HM1: I find Python programming to be enjoyable.
    • PPI1: I intend to continue to use Python.
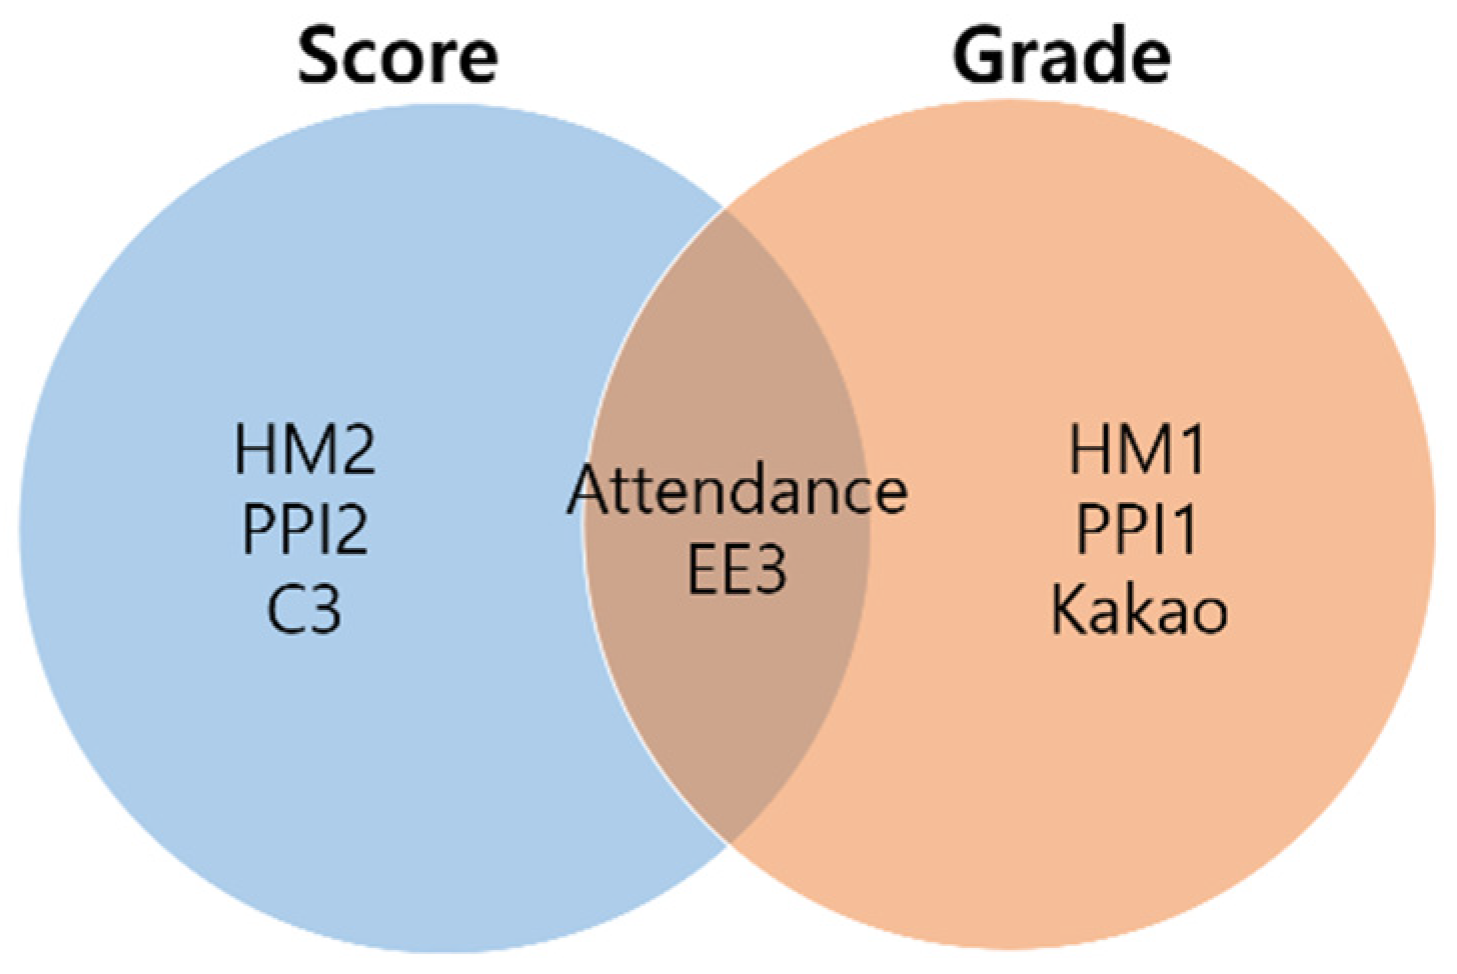
Attendance and EE3 were often chosen in scores and grades, as demonstrated in Figure 4. Hedonic motivation and Python programming intention were retrieved in common, even though the detailed components were distinct. In addition, both the difference set of scores and the difference set of grades have confidence qualities and Kakao attributes.

4.4. Step4

Stage 4 explains the relationship between the independent variables chosen in the previous step and the dependent variable, and a model capable of predicting the dependent variable is developed. Multiple regression analysis was performed using numerical scores, logistic regression analysis was performed using categorical ratings, and statistical verification was performed using SPSS.
Table 4 shows the results of the multiple regression analysis first.
When the Pearson correlation coefficient was used to examine the relationship between the score and each independent variable, it was discovered that EE3 had a relatively high correlation of 0.4 or more, while the rest had a low correlation, and the significance probability between all variables and scores was significant at 0.05. The regression line explains 35.2 percent of the final score, and the adjusted R squared is 0.352. Durbin–Watson’s figure is 1.816, which is near 2, indicating that it is independent. The F value was found to be 51.263, and the regression equation was 0.000, which was significant. The HM2 and PPI2 variables were found to be insignificant through using significance probability in the coefficient, and as both VIFs are smaller than 10, there is no difficulty with multicollinearity. In addition, the non-standardization coefficient is used to generate the regression equation.
Score = −129.210 + 10.376 × Attendance + 2.944 × EE3 + 0.938 × HM2 +
0.727 × PPI2 + 2.772 × C3
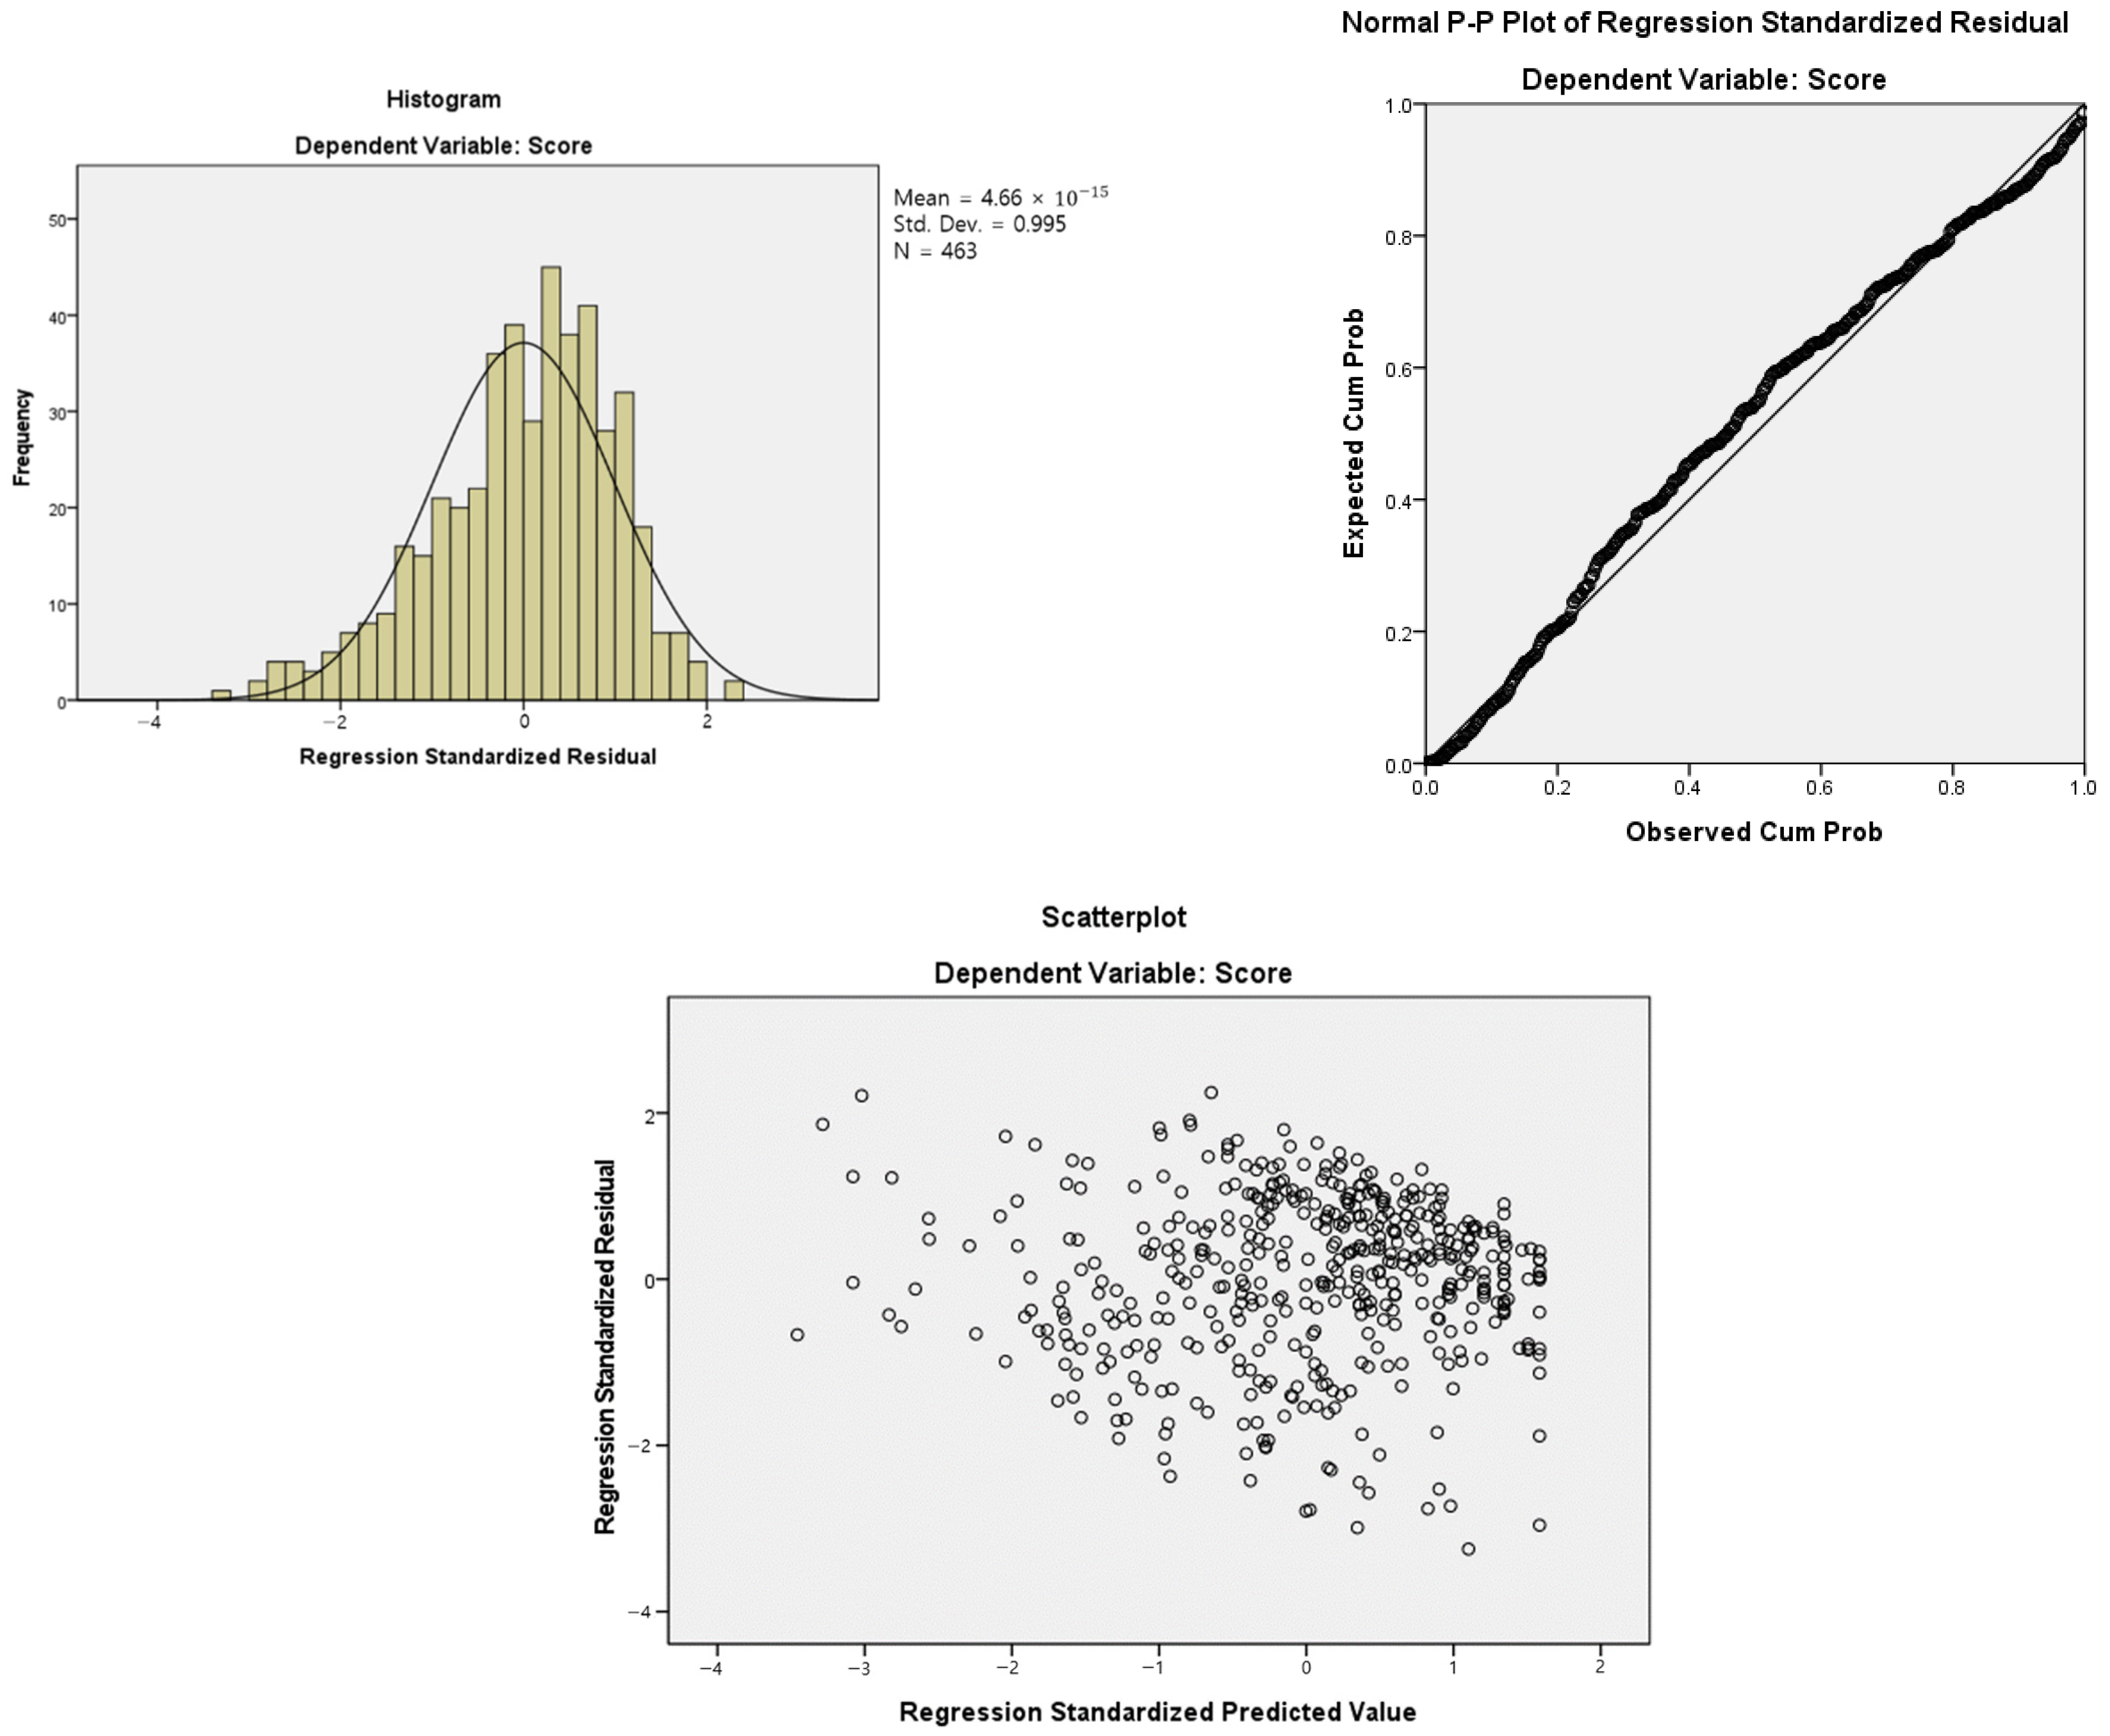
The verification results for the regression model are shown in Figure 5. The histogram of the normalized residuals for the dependent variable is included on the left, and the solid line indicates a normal distribution. The normalized residuals create a conventional normal table in the center picture, with the points lying on a 45-degree straight line. Finally, the picture on the right demonstrates how to test the equal variance assumption. Standardized residuals and standardized predictions have no relationship.
The outcomes of the logistic regression are reported in Table 5 below.
The Chi-square for step, block, and model in the Omnibus tests of model is 119.452, and the regression equation is found to be meaningful since the p-value is less than the significance level of 0.05. In the model summary, the logistic regression equation exhibits −2 LL of 500.192 and explanatory power of 30.8% of the dependent variable, with Nagelkerke R square of 0.308. As the significance probability is larger than 0.05, the null hypothesis that the estimated model is suitable can be chosen as a consequence of completing the Hosmer and Lemeshow test to examine the overall fit of the regression model. Factors apart from Kakao and PPI1 were determined to be significant at the 0.05 level in the developed regression equation, and the regression equation is as follows.
Log(Grade) = 30.365 + −1.819 × Attendance + 0.011 × Kakao + −0.245 × EE3 +
−0.301 × HM1 + −0.091 × PPI1

4.5. Step5

Cross validation with k set to 10 was used to verify the model in step 5. The mean of root mean squared error applied to the square mean of the residual is 16.444 as a consequence of verifying the score. Additionally, the average squared correlation is 0.347, indicating how well the model predicts the observed value.
Second, the grade verification results are described in Table 6. The average sensitivity, or capacity to correctly select A, is 59.46%, while the average specificity, or ability to accurately identify B, is 77.70%. In addition, the average of precision, which is actually related to grade A among the found grade A results, is 63.95%. The accuracy average, which is a broad measure of classifier performance, is 70.41%.
Further significance evaluation of the hit rate of the logistic regression model can be performed as a criterion of group size and probability. The ratio of the sum of the largest rows to the sum of all matrices is 0.629 = (216 + 75)/463. Additionally, 0.533 = ( 0.629 ) 2 + ( 1 0.629 ) 2 is the square of the greatest row’s ratio plus the square of the probability that this does not belong to that group. The resulting model can be regarded to be significant since the hit rate of 0.7041 is greater than these two.
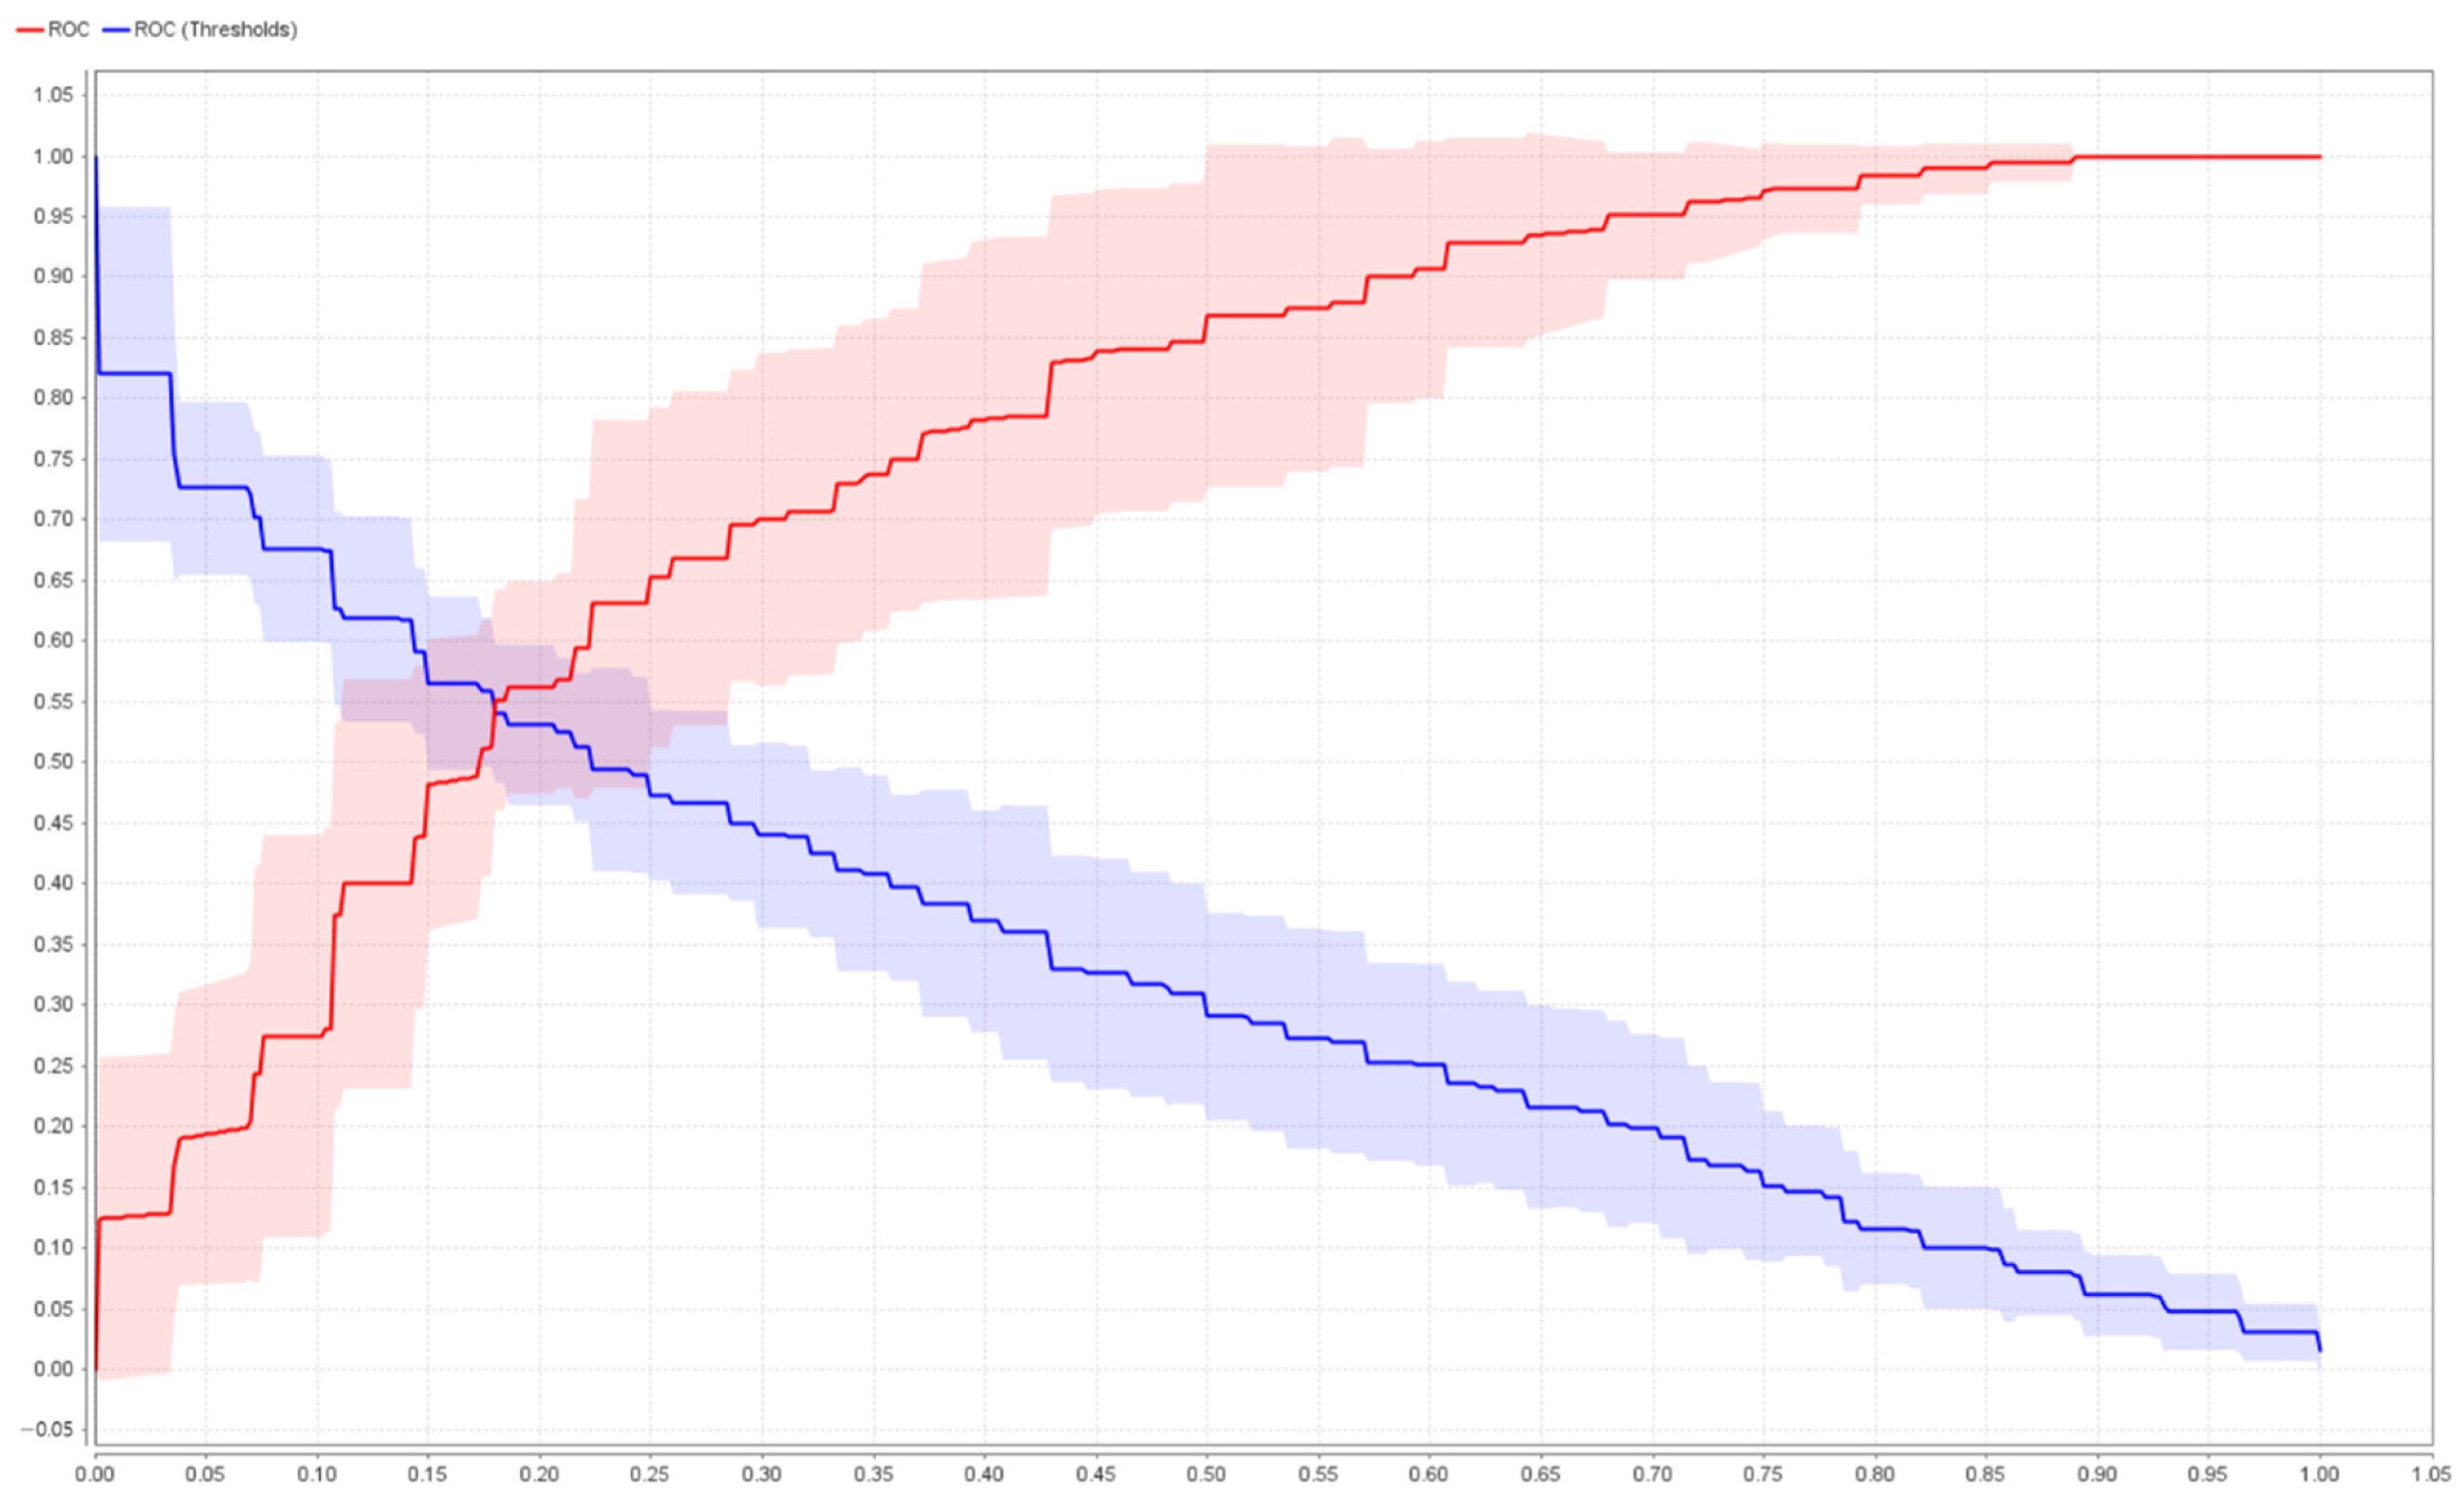
The following are the AUC–ROC curve findings. The average AUC, or area under the ROC curve, is 0.762, as shown in Figure 6, which is a graph that demonstrates the performance of all classification models. Although it is usual for AUC to choose classifiers with a score of 0.8 or above [50], the logistic regression model used in this work does not match this criterion, suggesting that the performance is unsatisfactory.

4.6. Step6

The next stage is to use decision trees to assess the relevance of variables. The upper nodes in the decision tree are chosen based on factors that are significant for segmenting a certain data set [50]. The criteria were set to least squares, centered on the score. Furthermore, the maximum depth was set to 4, and cross validation was performed with K equal to 10. As shown in Figure 7, if EE3 is greater than 4.5, it is confirmed that it consists of students with the highest average score since the root node and attendance is greater than 14.5.
If EE3 is less than 1.5 and PPI2 is less than 2.5, students with the lowest average score are distributed. Attendance had the greatest impact on score, followed by EE3 and PPI2. Among the factors influencing Python programming intention, the relative impact of effort expectancy was the lowest, and it was determined to be negligible even in the structural equation model [27,28]. When it comes to interacting with students’ scores, however, this is chosen through feature selection and confirmed to be a critical component that has the biggest effect after attendance.
Second, except for the criteria of the previous score, the remainder of the grade was kept the same. The criterion has been set to accuracy. As shown in Figure 8, it is proven that HM1 is greater than 5.5 as the root node, EE3 is greater than 3.5, attendance is greater than 13.5, and 93:44 represents more than a majority of students with A grades. If, on the other hand, HM1 is 5.5 or less, EE3 is 5.5 or less, and PPI1 is 6.5 or less, students with B grades are allocated at 203:69. Furthermore, PPI1 had the greatest impact on grade, followed by EE3, Kakao, attendance, and HM1.
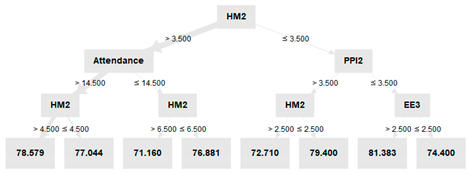
After dividing the students in grades, A and B, the decision tree was executed again with factors chosen in the score, as shown in Table 7.
Attendance, PPI2, and EE3 are all shared by both, however, only the root node of Class A contains HM2. The factors that have the largest impact on grade A are HM2, EE3, PPI2, attendance, and on grade B—attendance, PPI2, and EE3. In other words, it is essential for A-grade students, since the weight of pleasure through Python programming is considerably larger, that the lecturer should concentrate more on their hedonic motivation in order to improve their academic performance. For B-grade students, on the other hand, EE3 has a smaller weight than attendance and PPI2, although the difference is slight. Students find Python programming difficult since this is in the root node of decision tree, and we feel that there is a need to provide a range of approaches to make it easier for students to think logically and write code. Furthermore, students with A grades have a low weight for attendance, whereas students with B grades have the largest weight for attendance. This is thought to be important to motivate students with B grades to attend class and show interest.

5. Conclusions

In the first semester of 2020, the COVID-19 pandemic, which began in early 2020, forced the introduction of non-face-to-face class in the educational area. There were various constraints in SW education, which involves a significant portion of practice, compared to theoretical class that merely delivers lecture videos. We attempted to objectively validate how the pandemic condition influenced pupils’ academic success during this procedure. The objectives of this work were to develop more effective SW education methodologies through educational design and to find solutions to non-face-to-face SW education’s constraints.
Using student information obtained for students in the same subject and the results of the academic performance evaluation, the factors that affected academic accomplishment over the COVID-19 period were investigated. This research examined SW education academic achievement evaluation results and student survey results through analytical modeling in this procedure. Academic accomplishment in non-face-to-face SW classrooms was investigated, and elements that may be included in SW education design were provided. A six-step data analysis process, including exploratory data analysis, feature selection, building model, model evaluation, and checking variable importance, was established to confirm the factors of academic accomplishment. The influence of factors by individual characteristics on college students’ academic success in the second semester of 2020 and the first semester of 2021 during COVID-19 was estimated and validated. Furthermore, the relevance of each variable was verified by using an analytic approach. EE3 (ease of use) was an essential element in levels such as A and B, as a result of examining the achievement level and aspects of students’ academic accomplishment. Many classes in the computer science curriculum spend a considerable amount of time at the start of the lecture setting up programming preferences. Students frequently assist one another or get help from assistants during this procedure. Due to COVID-19, it was difficult to acquire this assistance in non-face-to-face education, particularly in large-scale lectures with more than 50 students. Therefore, the simplicity of use of practical instruments became a more essential component in accomplishment. Particularly in the group that achieved an A grade, satisfaction via programming development such as HM2 became a significant element. This is closely connected to the qualities of computer programs that may be created by a single individual. Creating a curriculum that reflects this feature in non-face-to-face SW education will provide students with an opportunity to improve their performance. The finding that the attendance factor differed between students receiving grades A and B is closely tied to the features of non-face-to-face classes. In addition, along with the components of HM3 and EE3, PPI2 was identified as an important factor, which is the third most important factor for students who obtained A grades. These three characteristics, when considered together, suggest that students who enjoy programming and want to apply it eventually improve their SW education success. The process of students designing and utilizing their own apps may be considered as a tremendous incentive in SW disciplines due to the nature of the subjects.
Since recorded videos were delivered separately due to the nature of non-face-to-face classes, absenteeism is not an issue for students with strong learning motivation even if they are absent, unlike real-time lectures. However, there is a concern that attendance may weaken the enthusiasm to continue the class for students who do not have a high learning motivation. Especially, the SW class curriculum is difficult to understand when learners do not follow the procedure in the sequence of each chapter.
This research identified any changes in non-cs students’ academic success as well as the factors that impact students’ academic achievement at the individual and school levels during the pandemic. Based on the outcomes, the intellectual gap between students grew because of the pandemic, and SW education design was sought to provide implications.
This paper makes the following contributions.
First, the traditional offline programming class was converted to an online programming class so that education would not be interrupted even in a COVID-19 pandemic situation. In this way, students’ right to learn was protected and sustainable education was pursued. Since the class was ERT, it would go offline after the endemic, but it could be an indicator that can be referenced in case of another disaster in the future.
Second, it was shown that programming classes, in which practice is generally regarded as important, can be successfully conducted with asynchronized video classes. To this end, various channels such as instant chat were provided so that students could easily ask questions at any time. In addition, the pre-recorded video remained available so that learners could watch it whenever they wanted without limiting the number of times. In addition, it is expected that this experience will be helpful in expanding the educational service provision method of universities (pre-planned online learning rather than ERT).
Third, factors that significantly affect students’ academic achievement in online liberal arts programming classes were identified. For this reason, this study provides important considerations when designing liberal arts software education.
However, there is a limit to inferring priorities between factors only by analyzing academic achievement and factors in the second semester of 2020 and the first semester of 2021. Through follow-up studies, it is necessary to observe the data linked to the results of this study on an annual basis. It is possible to provide clues that indicate the aspects that contribute to the educational accomplishment of SW education in curriculum design through this procedure. Furthermore, it offers a chance for a systematic learning assistance system for populations with low SW education attainment. Empirical investigations on pandemics, online SW education, and academic accomplishment will be conducted as part of a follow-up study based on this study, contributing to the overall quality improvement of SW education and policy elements that can alleviate the problem of academic gap between student groups.
A limitation of this study is that it did not perform classification according to additional internal characteristics for students not majoring in SW programming. If SW programming beginners have background knowledge of computing, they will be able to reduce the difficulty they feel when establishing the procedure for problem solving in the computing environment and easily specify the process of work. However, we plan to conduct a comparative study on students with a background in computing. Through this follow-up study, we will be able to confirm in more detail the educational effect of logical problem solving provided by CT.

Author Contributions

Conceptualization, S.Y. and H.H.; methodology, O.L. and H.H.; software, M.C. and Y.R.; validation, M.C., Y.R. and H.H.; formal analysis, S.Y.; investigation, C.M. and H.H.; resources, O.L.; data curation, H.H.; writing—original draft preparation, S.Y., C.M. and H.H.; writing—review and editing, S.Y., C.M. and H.H.; visualization, M.C. and H.H.; supervision, H.H.; project administration, H.H. All authors have read and agreed to the published version of the manuscript.

Funding

This research received no external funding.

Institutional Review Board Statement

Ethical review and approval were waived for this study. We used students’ questionnaires, activities, and achievement, but after collecting the data set, we processed it into pseudonymized information so that it cannot be identified.

Informed Consent Statement

Informed consent was obtained from all subjects involved in the study.

Data Availability Statement

The data are not publicly available due to personal information protection act.

Conflicts of Interest

There is no conflict of interests.

References

  1. Cha, K.-J.; Kim, Y.S. Critical success factors for mutual collaboration with suppliers in IT outsourcing industry: A case study of a top IT outsourcing company in Korea. Enterp. Inf. Syst. 2018, 12, 76–95. [Google Scholar] [CrossRef]
  2. Crowne, M. Why software product startups fail and what to do about it. Evolution of software product development in startup companies. In Proceedings of the IEEE International Engineering Management Conference, Cambridge, UK, 18–20 August 2002; pp. 338–343. [Google Scholar]
  3. Bosse, Y.; Gerosa, M.A. Why is programming so difficult to learn? Patterns of Difficulties Related to Programming Learning Mid-Stage. ACM SIGSOFT Softw. Eng. Notes 2017, 41, 1–6. [Google Scholar] [CrossRef]
  4. Software Promotion Act, Science and ICT 2020, c 4, s 2. Available online: https://elaw.klri.re.kr/kor_service/lawView.do?hseq=54778&lang=ENG (accessed on 26 May 2022).
  5. Software-Centered University. Available online: https://www.swuniv.kr/33 (accessed on 29 March 2022).
  6. Ng, T.K. New interpretation of extracurricular activities via social networking sites: A case study of artificial intelligence learning at a secondary school in Hong Kong. J. Educ. Train. Stud. 2021, 9, 49–60. [Google Scholar] [CrossRef]
  7. Allo, M.D.G. Is the online learning good in the midst of COVID-19 Pandemic? The case of EFL learners. J. Sinestesia 2020, 10, 1–10. [Google Scholar]
  8. Stewart, W.H.; Lowenthal, P.R. Distance education under duress: A case study of exchange students’ experience with online learning during the COVID-19 pandemic in the Republic of Korea. J. Res. Technol. Educ. 2022, 54, S273–S287. [Google Scholar] [CrossRef]
  9. Kaffenberger, M. Modelling the long-run learning impact of the COVID-19 learning shock: Actions to (more than) mitigate loss. Int. J. Educ. Dev. 2021, 81, 102326. [Google Scholar] [CrossRef]
  10. Hodges, C.B.; Moore, S.; Lockee, B.B.; Trust, T.; Bond, M.A. The Difference between Emergency Remote Teaching and Online Learning. 2020. Available online: https://er.educause.edu/articles/2020/3/the-difference-between-emergency-remote-teaching-and-online-learning (accessed on 27 March 2022).
  11. Ralph, E.G. Effective College Teaching: Fresh Insights and Exemplary Practices; Nova Science Publishers: New York, NY, USA, 2003. [Google Scholar]
  12. UNESCO. Available online: https://en.unesco.org/covid19/educationresponse (accessed on 29 March 2022).
  13. Choi, J.-J.; Robb, C.A.; Mifli, M.; Zainuddin, Z. University students’ perception to online class delivery methods during the COVID-19 pandemic: A focus on hospitality education in Korea and Malaysia. J. Hosp. Leis. Sport Tour. Educ. 2021, 29, 100336. [Google Scholar] [CrossRef]
  14. Allam, S.N.S.; Hassan, M.S.; Mohideen, R.S.; Ramlan, A.F.; Kamal, R.M. Online distance learning readiness during COVID-19 outbreak among undergraduate students. Int. J. Acad. Res. Bus. Soc. Sci. 2020, 10, 642–657. [Google Scholar] [CrossRef]
  15. Almusharraf, N.; Khahro, S. Students satisfaction with online learning experiences during the COVID-19 pandemic. Int. J. Emerg. Technol. Learn. (iJET) 2020, 15, 246–267. [Google Scholar] [CrossRef]
  16. Dirzyte, A.; Vijaikis, A.; Perminas, A.; Rimasiute-Knabikiene, R. Associations between depression, anxiety, fatigue, and learning motivating factors in e-learning-based computer programming education. Int. J. Environ. Res. Pub. Health 2021, 18, 9158. [Google Scholar] [CrossRef]
  17. Qualls, J.A.; Sherrell, L.B. Why computational thinking should be integrated into the curriculum. J. Comput. Sci. Coll. 2010, 25, 66–71. [Google Scholar]
  18. Council, N.R. Report of a Workshop of Pedagogical Aspects of Computational Thinking Committee for the Workshops on Computational Thinking. 2011. Available online: https://nap.nationalacademies.org/catalog/13170/report-of-a-workshop-on-the-pedagogical-aspects-of-computational-thinking (accessed on 26 May 2022).
  19. Wing, J.M. Computational thinking. Commun. ACM 2006, 49, 33–35. [Google Scholar] [CrossRef]
  20. Council, N.R. Report of a Workshop on the Scope and Nature of Computational Thinking; National Academies Press: Washington, DC, USA, 2010. [Google Scholar]
  21. Tai, D.W.; Yu, C.-H.; Lai, L.-C.; Lin, S.-J. A study on the effects of spatial ability in promoting the logical thinking abilities of students with regard to programming language. World Trans. Eng. Technol. Educ. 2003, 2, 251–254. [Google Scholar]
  22. Dawson, J.Q.; Allen, M.; Campbell, A.; Valair, A. Designing an introductory programming course to improve non-majors’ experiences. In Proceedings of the 49th ACM Technical Symposium on Computer Science Education, New York, NY, USA, 21–24 February 2018; pp. 26–31. [Google Scholar]
  23. Ajzen, I. Perceived behavioral control, self-efficacy, locus of control, and the theory of planned behavior 1. J. Appl. Soc. Psychol. 2002, 32, 665–683. [Google Scholar] [CrossRef]
  24. Venkatesh, V.; Thong, J.Y.; Xu, X. Consumer acceptance and use of information technology: Extending the unified theory of acceptance and use of technology. MIS Q. 2012, 36, 157–178. [Google Scholar] [CrossRef] [Green Version]
  25. Chao, C.-M. Factors determining the behavioral intention to use mobile learning: An application and extension of the UTAUT model. Front. Psychol. 2019, 10, 1652. [Google Scholar] [CrossRef] [Green Version]
  26. Bilegjargal, D.; Hsueh, N.-L. Understanding Students’ Acceptance of Online Judge System in Programming Courses: A Structural Equation Modeling Approach. IEEE Access 2021, 9, 152606–152615. [Google Scholar] [CrossRef]
  27. Cheon, M.; Lee, O.; Mun, C.; Ha, H. Factors Affecting Academic Achievement in SW Education. Int. J. Inf. Educ. Technol. 2022, 12, 333–338. [Google Scholar] [CrossRef]
  28. Cheon, M.; Lee, O.; Mun, C.; Ha, H. A Study on the Factors Affecting Intention of Learning Python Programming: For Non-majors in University. Int. J. Inf. Educ. Technol. 2022, 12, 414–420. [Google Scholar] [CrossRef]
  29. Keller, J.M. Development and use of the ARCS model of instructional design. J. Instr. Dev. 1987, 10, 2–10. [Google Scholar] [CrossRef]
  30. Keller, J.M.; Song, S.H. Attractive Lesson Design; Kyoyookbook: Paju, Korea, 1999; pp. 203–206. [Google Scholar]
  31. Stankov, L.; Morony, S.; Lee, Y.P. Confidence: The best non-cognitive predictor of academic achievement? Educ. Psychol. 2014, 34, 9–28. [Google Scholar] [CrossRef]
  32. Huett, J.B.; Moller, L.; Young, J.; Bray, M.; Huett, K.C. Supporting the distant student: The effect of ARCS-based strategies on confidence and performance. Q. Rev. Distance Educ. 2008, 9, 113. [Google Scholar]
  33. Burger, A.J.; Blignaut, P.J. Predicting the Outcome of a Computer Literacy Course Based on a Candidate’s Personal Characteristics. In Proceedings of the International Conference on Human-Computer Interaction, Beijing, China, 22–27 July 2007; pp. 173–182. [Google Scholar]
  34. Stankov, L. Noncognitive predictors of intelligence and academic achievement: An important role of confidence. Personal. Individ. Differ. 2013, 55, 727–732. [Google Scholar] [CrossRef]
  35. Morgan, H. Online Instruction and Virtual Schools for Middle and High School Students: Twenty-First-Century Fads or Progressive Teaching Methods for Today’s Pupils? Clear. House J. Educ. Strateg. Issues Ideas 2015, 88, 72–76. [Google Scholar] [CrossRef]
  36. Woodfield, R.; Jessop, D.; McMillan, L. Gender differences in undergraduate attendance rates. Stud. High. Educ. 2006, 31, 1–22. [Google Scholar] [CrossRef]
  37. Halpern, N. The impact of attendance and student characteristics on academic achievement: Findings from an undergraduate business management module. J. Furth. High. Educ. 2007, 31, 335–349. [Google Scholar] [CrossRef]
  38. Credé, M.; Roch, S.G.; Kieszczynka, U.M. Class attendance in college: A meta-analytic review of the relationship of class attendance with grades and student characteristics. Rev. Educ. Res. 2010, 80, 272–295. [Google Scholar] [CrossRef]
  39. Guleker, R.; Keci, J. The effect of attendance on academic performance. Med. J. Soc. Sci. 2014, 5, 961. [Google Scholar] [CrossRef] [Green Version]
  40. Choi, J.W. A study on the Use of Data Science in Learning Process Management: Focusing on the Risk Prediction. Doctoral Dissertation, Ajou University, Suwon-si, Korea, 2016. [Google Scholar]
  41. Choi-Lundberg, D.L.; Al-Aubaidy, H.A.; Burgess, J.R.; Clifford, C.A.; Cuellar, W.A.; Errey, J.A.; Harper, A.J.; Malley, R.C.; Ross, R.M.; Williams, A.-M.M.; et al. Minimal effects of reduced teaching hours on undergraduate medical student learning outcomes and course evaluations. Med. Teach. 2020, 42, 58–65. [Google Scholar] [CrossRef] [PubMed]
  42. Xhomara, N. Lectures attendance as a predicting variable of academic achievements of students. In Proceedings of the 11th International Conference on Technology, Education and Development (INTED), Valencia, Spain, 6–8 March 2017; pp. 7830–7840. [Google Scholar]
  43. Lu, C.; Cutumisu, M. Online engagement and performance on formative assessments mediate the relationship between attendance and course performance. Int. J. Inf. Educ. Technol. High. Educ. 2022, 19, 1–23. [Google Scholar] [CrossRef]
  44. Lee, K.-S.; Kim, B.-G. Cross space: The exploration of SNS-based writing activities in a multimodal learning environment. J. Educ. Technol. Soc. 2016, 19, 57–76. [Google Scholar]
  45. Belair, M. An investigation of communication in virtual high schools. Int. Rev. Res. Open Distrib. Learn. 2012, 13, 105–123. [Google Scholar] [CrossRef] [Green Version]
  46. Borup, J.; Graham, C.R.; Davies, R.S. The nature of adolescent learner interaction in a virtual high school setting. J. Comput. Assist. Learn. 2013, 29, 153–167. [Google Scholar] [CrossRef]
  47. Ingerham, L. Interactivity in the online learning environment: A study of users of the North Carolina virtual public school. Q. Rev. Distance Educ. 2012, 13, 65. [Google Scholar]
  48. Wrigglesworth, J. Using smartphones to extend interaction beyond the EFL classroom. Comput. Assist. Lang. Learn. 2020, 33, 413–434. [Google Scholar] [CrossRef]
  49. Khan, A.A.; Siddiqui, A.Z.; Mohsin, S.F.; Al Momani, M.M.; Mirza, E.H. Impact of network aided platforms as educational tools on academic performance and attitude of pharmacology students. Pak. J. Med. Sci. 2017, 33, 1473. [Google Scholar] [CrossRef] [PubMed]
  50. Kotu, V.; Deshpande, B. Predictive Analytics and Data Mining: Concepts and Practice with RapidMiner, 1st ed.; Kaufmann, M., Ed.; Margan Kaufmann: Burlington, MA, USA, 2014. [Google Scholar]
  51. Minitab. Available online: https://blog.minitab.com/ko/adventures-in-statistics-2/how-to-identify-the-most-important-predictor-variables-in-regression-models (accessed on 27 March 2022).
  52. Blum, A.L.; Langley, P. Selection of relevant features and examples in machine learning. Artif. Intell. 1997, 97, 245–271. [Google Scholar] [CrossRef] [Green Version]
  53. Yu, L.; Liu, H. Feature Selection for High-Dimensional Data: A Fast Correlation-Based Filter Solution. In Proceedings of the Twentieth International Conference on Machine Learning, Washington, DC, USA, 21–24 August 2003; pp. 856–863. [Google Scholar]
  54. Kohavi, R.; John, G.H. Wrappers for feature subset selection. Artif. Intell. 1997, 97, 273–324. [Google Scholar] [CrossRef] [Green Version]
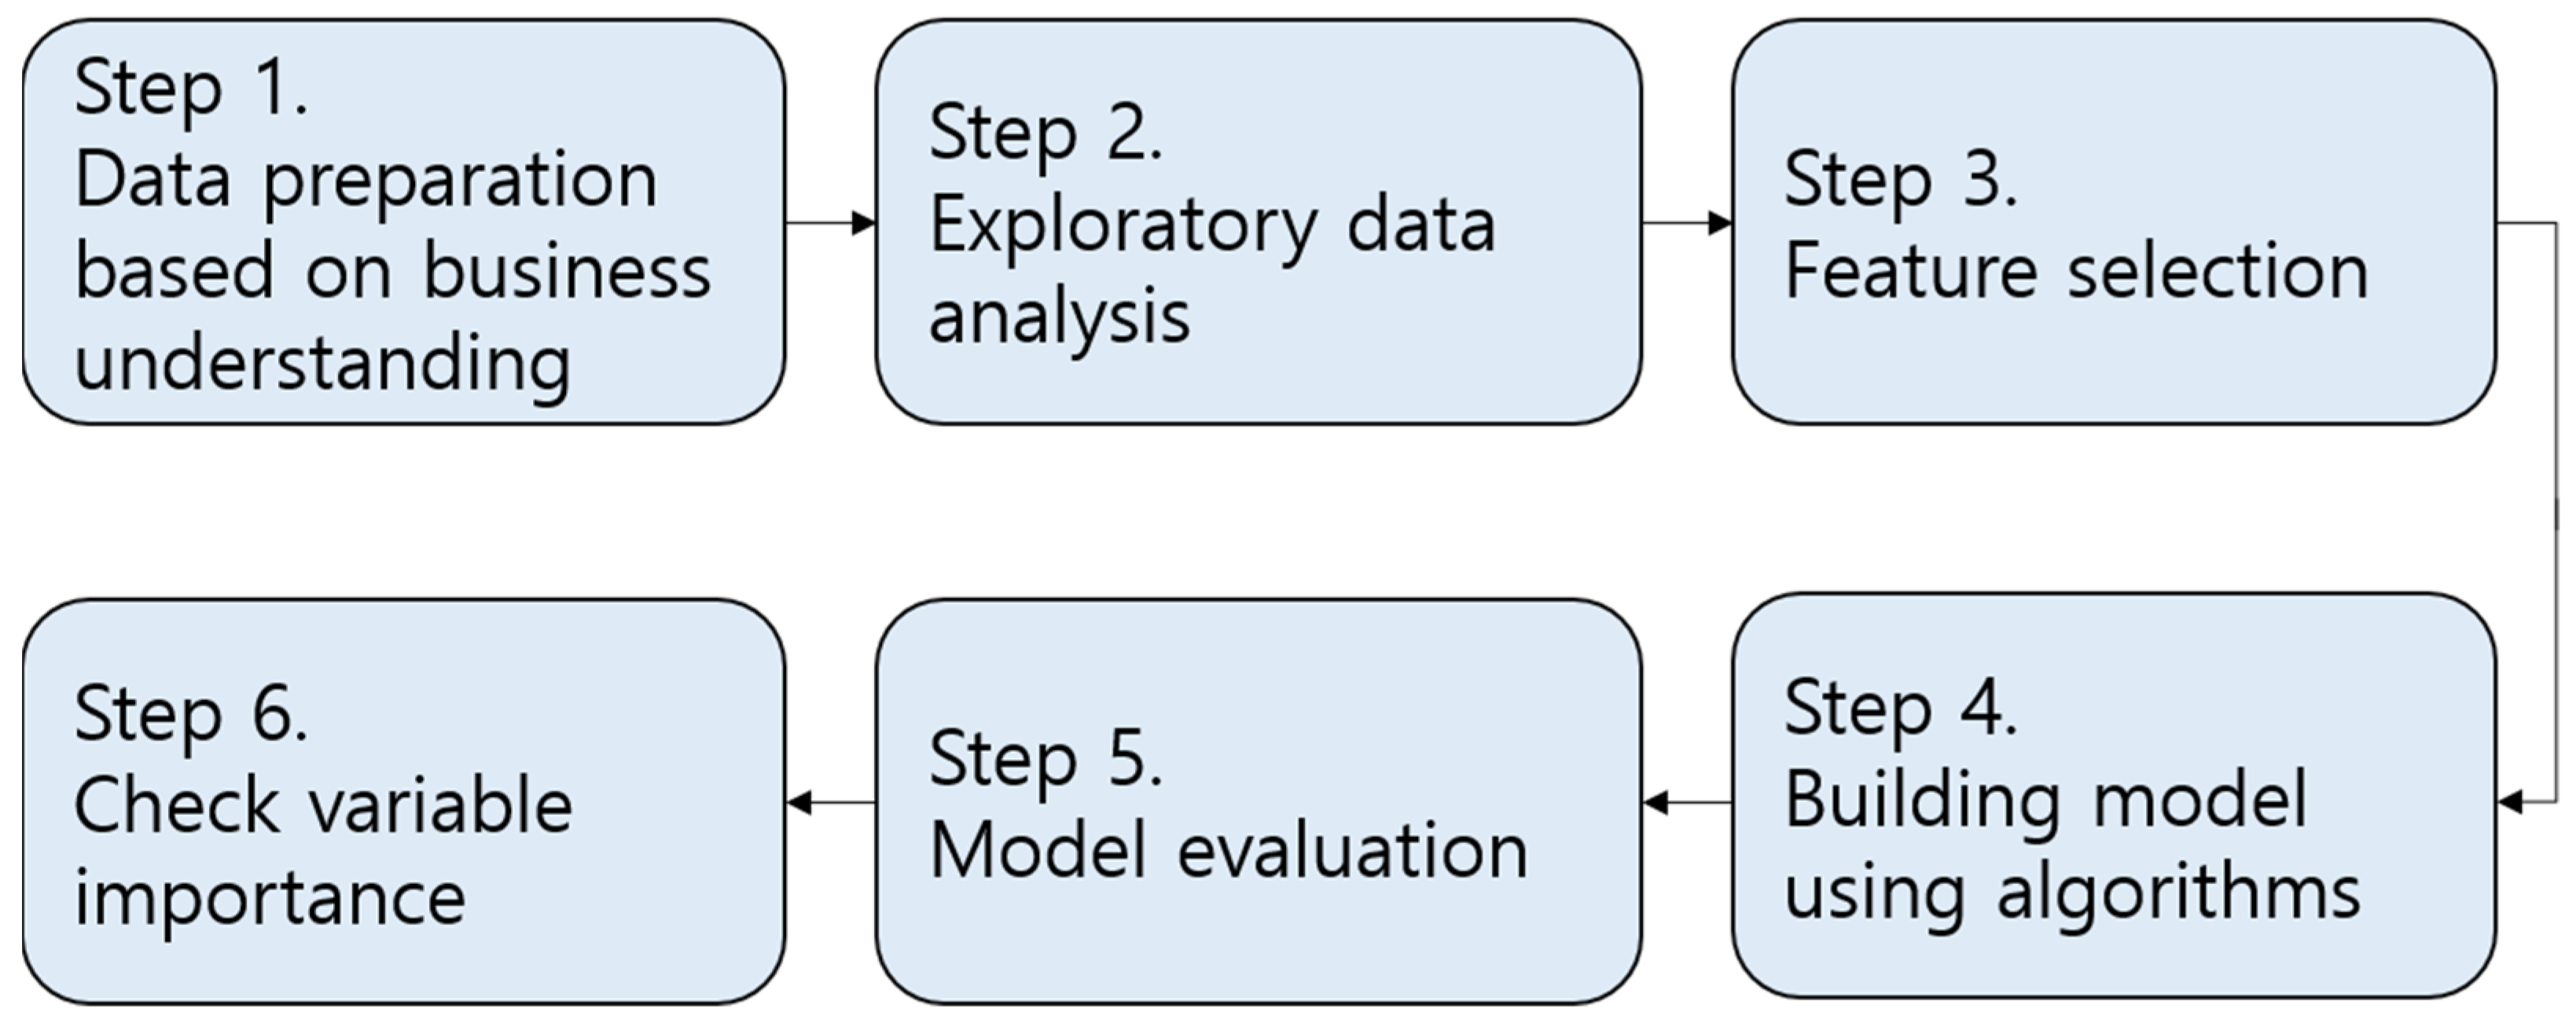
Figure 1. Procedure for performing data mining analysis.
Sustainability 14 06547 g001
Figure 2. Number of students at each college.
Sustainability 14 06547 g002
Figure 3. Students’ score histogram.
Sustainability 14 06547 g003
Figure 4. Venn diagram of score and grade.
Sustainability 14 06547 g004
Figure 5. Verification result of the regression model.
Sustainability 14 06547 g005
Figure 6. ROC curve of the experiment.
Sustainability 14 06547 g006
Figure 7. Decision tree based on score.
Sustainability 14 06547 g007
Figure 8. Decision tree based on grade.
Sustainability 14 06547 g008
Table 1. Classification of attributes.
SectionFeature (Abbreviation)Number of Questionnaire Questions or Items
Psychological statePerformance expectancy (PE)4
Effort expectancy (EE)4
Social influence (SI)3
Facilitating conditions (FC)4
Hedonic motivation (HM)3
Python programming intention (PPI)3
Confidence (C)4
ActivitiesAttendance (Attendance)1
Open KakaoTalk with high frequency (Kakao)1
Table 2. Cronbach’s alpha of questionnaire items.
PEEESIFCHMPPIC
Cronbach’s alpha0.9230.9190.9450.8150.9550.9490.803
Table 3. t-test between A and B.
MeanLevene’s Test for Equality of Variancest-Test for Equality of Means
ABFSig.tdfSig.
Attendance14.9614.57177.7764100.0007.527327.0240.000
Kakao4.825.432.6877590.102−0.349461.0000.727
PE15.764.9826.5430200.0006.394460.6320.000
PE25.734.9827.7760510.0006.314460.9970.000
PE35.194.4914.2002930.0004.951441.0940.000
PE45.504.7411.2195840.0015.616436.5170.000
EE14.143.254.4296520.0366.085410.3440.000
EE24.823.891.0261090.3126.429461.0000.000
EE34.753.615.5100500.0197.620427.0330.000
EE44.453.402.1024960.1487.152461.0000.000
SI14.283.854.3674010.0372.775416.4630.006
SI24.253.773.7760500.0532.994461.0000.003
SI34.444.053.5778740.0592.526461.0000.012
FC15.134.2625.8479340.0006.652458.1560.000
FC24.923.9221.9352540.0007.923455.6980.000
FC34.323.602.0859390.1494.667461.0000.000
FC45.154.6515.6345220.0003.428438.3320.001
HM15.504.4014.7328980.0008.355447.7170.000
HM25.244.156.5445780.0117.627437.0470.000
HM34.963.894.4414780.0366.984424.2040.000
PPI15.284.177.8016520.0057.634436.0110.000
PPI25.314.3318.0401640.0006.886445.6660.000
PPI34.763.781.2764230.2595.980461.0000.000
C14.233.180.3064920.5806.940461.0000.000
C26.185.5425.2407300.0005.780455.4170.000
C36.095.2723.1782880.0006.872456.7460.000
C44.883.802.5411600.1127.115461.0000.000
Table 4. Result of multiple linear regression.
Pearson CorrelationCoefficients
Unstandardized Coefficients BetaStandardized Coefficients BetaSig.VIF
(Constant) −29.210 0.000
Attendance0.37110.3760.3480.0001.018
EE30.4262.9440.2480.0001.860
HM20.3940.9380.0760.1842.323
PPI20.3860.7270.0590.2842.180
C30.3742.7720.1910.0001.398
Model summaryAdjusted R square = 0.352
Std. Error of the estimate: 16.39147
Durbin–Watson = 1.816
ANOVAF = 51.263
Sig. = 0.000
Table 5. Result of binomial logistic regression.
VariablesBS.E.WalddfSig.Exp(B)
Variables in the equationAttendance−1.8190.39521.20510.0000.162
EE3−0.2450.0897.68810.0060.782
Kakao0.0110.0091.59410.2071.011
HM1−0.3010.1127.26610.0070.740
PPI1−0.0910.1020.79510.3730.913
Constant30.3655.93326.19310.0001.5401 × 1013
Omnibus tests of model coefficientChi-square: 119.452
df: 5
Sig.: 0.000
Model summary−2 Log likelihood: 500.192
Cox and Snell R square: 0.227
Nagelkerke R square: 0.308
Hosmer and Lemeshow testChi-square: 12.327
df: 8
Sig.: 0.137
Table 6. Confusion matrix of logistic regression.
True BTrue AClass Precision
Pred. B2167574.23%
Pred. A6211063.95%
Class recall77.70%59.46%Micro average 70.41%
Table 7. Weight of attributes and decision tree based on grade between A and B.
GradeAtrributeWeightDecision Tree
AHM20.562 Sustainability 14 06547 i001
EE30.291
PPI20.134
Attendance0.014
BAttendance0.371 Sustainability 14 06547 i002
PPI20.322
EE30.296
Publisher’s Note: MDPI stays neutral with regard to jurisdictional claims in published maps and institutional affiliations.