Article

New Methodology to Characterize the Workability of Asphaltic Concrete Mixtures Based on Kinematic Compaction Energy

1
School of Science, Technology and Engineering, University of the Sunshine Coast, Sippy Downs, QLD 4556, Australia
2
School of Civil and Environment Engineering, Universiti Sains Malaysia, Nibong Tebal 14300, Penang, Malaysia
*
Author to whom correspondence should be addressed.
Sustainability 2022, 14(11), 6550; https://doi.org/10.3390/su14116550
Submission received: 18 January 2022 / Revised: 9 May 2022 / Accepted: 24 May 2022 / Published: 27 May 2022
(This article belongs to the Special Issue Pavement Design, Analysis and Material Characterization)

Abstract

:
The workability of asphalt mixtures influences the logistical processes and workmanship during pavement construction. There are various methods for analyzing the workability of asphaltic concrete mixtures. However, there is a lack of user-friendly laboratory methods that enable asphalt technologists, pavement engineers, laboratory technicians, and researchers to characterize the trend of workability via Newtonian physics. In this paper, a new methodology, based on momentum theory, has been proposed to evaluate the effects of construction temperature and compaction aid additives on mixture workability. Additionally, a new parameter, namely, the kinematic densifying index (KDI), is defined by the energy conservation theory. The results indicate a linear relationship between compaction energy and bulk specific gravity, which proportionally influence the indirect tensile strength of the mixtures. An adverse correlation between the KDI and the compaction energy index (CEI) was detected. The trend of the KDI strongly depends on the mixing temperature and the additive content. In conclusion, in the future, the KDI can be recommended as a supplementary indicator to analyze the workability of asphalt mixtures. More research is required to correlate the KDI and the other workability indicator for various aggregate gradations and binder types.

1. Introduction

Asphalt mixture workability is a key criterion in the construction of flexible pavements. More workable mixes ease the compaction effort and can accelerate paving work or allow the reduced use of compaction equipment, providing a cost savings. The role of compaction in pavement performance is significant, with asphalt density accounting for more than 80% of structural and functional failures, such as rutting, moisture damage, and raveling in asphalt pavements [1]. Therefore, it is essential that the workability is assessed via laboratory and field assessments to meet the norm of quality control and assurance purposes. The workability of asphalt mixtures depends on many variables, such as binder type, mixture temperature, aggregate gradations, nominal maximum aggregate size, aggregate types, filler types, modifier contents, optimum binder content (OBC), content and type of waste materials in the mixture, and ambient temperature. In addition, warm mix asphalt (WMA) technology is a practical approach to improving the workability of mixtures at lower construction temperatures [2,3,4,5,6]. The workability can also be improved via a change in the sequence of blending aggregate particles and binder [7]. However, considering all the variables in the analysis of workability is impractical. Based on the literature review, previous studies show that there are three concepts to measure workability: equiviscous temperature (EVT), equi-torque temperature (ETT), and the equi-volumetric principle (EVP).

1.1. Equiviscous Temperature

EVT is the temperature at which the viscosity of different binders is identical. Within this range, the aggregate particles are fully coated with binder, and mixtures are workable for hauling and compaction. For example, the Asphalt Institute [8] recommends that mixing and compaction temperatures correspond to viscosity ranges of 170 ± 20 mPa s and 280 ± 30 mPa s, respectively, for conventional bitumen. Yildrim et al. [9] recommend viscosities of 275 mPa s and 550 mPa s at a shear rate of 500 s–1 to determine appropriate mixing and compaction temperatures for polymer-modified binders. It should be noted that the EVT is not limited to the viscosity test. For instance, Chen, et al. [10] evaluated the workability of a loose asphalt mixture via a slump test, which is fundamentally developed for cement concrete. The flow of the mixture in the test depends on the viscosity of the binder. Therefore, the slump test lies within the EVT category.
The advantage of the EVT method is that the binder is fluid enough to coat the graded aggregate, creating a mixture that is workable for the paving and compaction of the asphalt layer. The disadvantage of the EVT method is that a viscometer, which can be costly for laboratories, is required. Moreover, EVT sometimes shows insensitivity to different rates of WMA additives [11,12]. To address this problem, a lubricity test was proposed to evaluate the workability of the WMA [13].

1.2. Equi-Torque Temperature

In the ETT, the torque required to produce fully coated aggregate with a particular binder is measured. A torque range is recommended to determine mixing and compaction temperatures. For example, Wang et al. [14] suggested the ETT methodology as a convenient and effective approach for determining the production temperatures of hot mix asphalt (HMA) and WMA. In addition, Mogawer and Austerman [15], Gudimettla et al. [16,17], and Marvillet and Bougault [18] investigated the torque required to blend aggregate materials and asphalt binder as a criterion to analyze the workability of a mixture. The lower torque means that the mixture is more workable. In this regard, Abdelgalil, et al. [19] developed a workability measuring device using an electronic transducer and a temperature regulator. The torque required to rotate three different pedals was measured via software specifically developed to support the device.
The main advantage of the ETT is that the workability is evaluated based on mixing graded aggregate, instead of the viscosity being measured in the binder, as in the case of the EVT method. Since the aggregate particles are a fully casual phenomenon, the ETT is more realistic. However, the ETT requires a more substantial set-up, and some components must be temperature controlled, which is costly. Furthermore, it is not easy to relocate equipment to a portable laboratory for paving projects in remote areas, due to its size and weight.

1.3. Equi-Volumetric Principles

In the EVP approach, workability is evaluated based on the identical volume of an asphalt mixture sample. Therefore, a more workable mix is defined as the sample requiring the least compaction effort to reach a specific thickness, density, air void content, or porosity, and the method of compaction can vary. As an example, Yu et al. [20] conducted a laboratory study on the workability of WMA containing crumbed rubber. The results showed that the reduction in air voids as the indicator of relative workability depends on the WMA additive type and the compaction method. In another study, Liu et al. [21] evaluated the effect of preheating on the workability of HMA containing reclaimed asphalt pavement (RAP) based on EVP.
Cabrera and Dixon [22] proposed a workability Index (WI) that was based on the correlation between the mixture porosity and the associated compaction energy via a gyratory compactor. Under the same field compaction effort, mixes with a higher WI are more workable [23]. A higher WI is associated with material that is easier to compact in the field. In the European standard [24], one of the methods for measuring workability is based on the sample thickness during compaction, by means of a linear variable differential transformer (LVDT), as a function of the corresponding number of blows by the Marshall hammer.
In addition, Faheem and Bahia [25] proposed two parameters to analyze the workability of a mix based on the air void percentage of a mix as follows:
(1)
The compaction energy index (CEI) is considered an indication of the work applied by a roller to reach the target compaction degree during the construction phase. The CEI can be employed as an indicator to measure the workability of the mixture.
(2)
The traffic densification index (TDI) represents the energy required to densify the mixture by traffic.
A lower CEI is desirable because of less energy required to compact the mix, while a higher TDI is more desirable. A higher TDI means more energy was required to densify the mixture after construction, which increases the rutting resistance of the mix during service. The advantage of the EVP methodology is that the workability can be evaluated for a specific thickness of the mix or target air void content and porosity. However, a disadvantage of this method is that the calculation of CEI, TDI, and WI require a gyratory compactor, which is costly and bulky for a portable laboratory in the field. Moreover, a computer and data logging software are needed to record the density and porosity of the mix after each compaction gyration.

1.4. Aim

A new user-friendly method for analyzing workability, which uses cost-effective equipment, such as that used for traditional compaction testing in many laboratories, is necessary. Since samples can be compacted by means of a Marshall hammer, without requiring access to electricity; this methodology would be useful for paving projects in remote areas and less-equipped laboratories. The energy requirement for compaction has been given considerably less attention in the literature. Therefore, the objectives of this study are described as follows:
  • To propose a new criterion to measure the workability of a mix based on kinematic energy and Newtonian mechanics via the Marshall method;
  • To evaluate the effects of compaction-aid additives on the workability of mixtures using the new criterion via an electric or manual Marshal hammer (without using electricity);
  • To compare the criterion to that of the workability indexes utilized in the literature;
  • To correlate the proposed criteria to the mechanical properties of an asphalt mix.

2. Materials and Methods

2.1. Asphalt Binder

Table 1 shows the rheological characteristics of PG 64–22 as a base asphalt binder. This is referred to as the control asphalt.

2.2. Aggregate Gradation

Granite aggregate was sourced and blended to the mid-gradation of the Malaysian Public Works Department (PWD) [26] specifications for the asphaltic concrete mixture (surface course) with a nominal maximum aggregate size of 14 mm (AC14). Figure 1 shows the particle size distribution of the aggregate.

2.3. Compaction-Aid Additive

One practical approach for increasing asphalt mixture workability is to use additives, which decrease the binder viscosity. As an example, Sasobit®, a synthetic wax used in current WMA production, was introduced as a compaction aid in Europe [27]. In this research, Sasobit® was used as a compaction-aid additive, or asphalt flow improver. The percentage of Sasobit® employed in the experiment ranged from 0% to 4%, at 2% increments by mass of the binder.

2.4. Sample Preparation and Mixture Test

The same OBC (4.90%) was applied for all the samples. The aggregate and Sasobit-® modified PG64-22 binder were blended at 160 °C, 145 °C, and 130 °C. The loose mixtures were conditioned at the compaction temperatures (10 °C lower than each mixing temperature) for two hours.
The maximum theoretical density (Gmm) of the mixture was determined according to ASTM D2041 [28]. The bulk specific gravity (Gmb) of the compacted samples was measured based on ASTM D2626 [29]. The indirect tensile strength (ITS) of the compacted samples was tested at 25 °C in accordance with the ASTM D 6931 procedure [30].
Table 2 shows the designation of mixtures that were produced at various temperatures and compacted by the Marshall hammer and the gyratory compactor. In the table, S represents the Sasobit® content from 0 (control) to 4%. W and H indicate WMA and HMA, respectively. The values of 160 °C, 145 °C, and 130 °C are the mixing temperatures. For example, W145S2 designates the WMA sample produced at 145 °C that contains Sasobit® at 2% by mass of the binder. It should be noted that 3 samples were prepared for each test, and the mean value of the test results was taken as a representative value of the test.
All the samples produced at 160 °C were considered HMA. Although Sasobit® is not commonly added to HMA, it was used as a compaction aid in this study. To characterize the effect of Sasobit® on the trend of the proposed workability indicators, samples were produced at 145 °C and 130 °C without Sasobit®, including W145S0 and W130S0. Due to the practical limit of asphalt mixture samples, some of the mixtures were not compacted using the gyratory compactor. However, all mixtures were compacted using the Marshall hammer (Table 2).

2.5. Proposed Workability Protocol Based on the Kinetic Compaction Energy

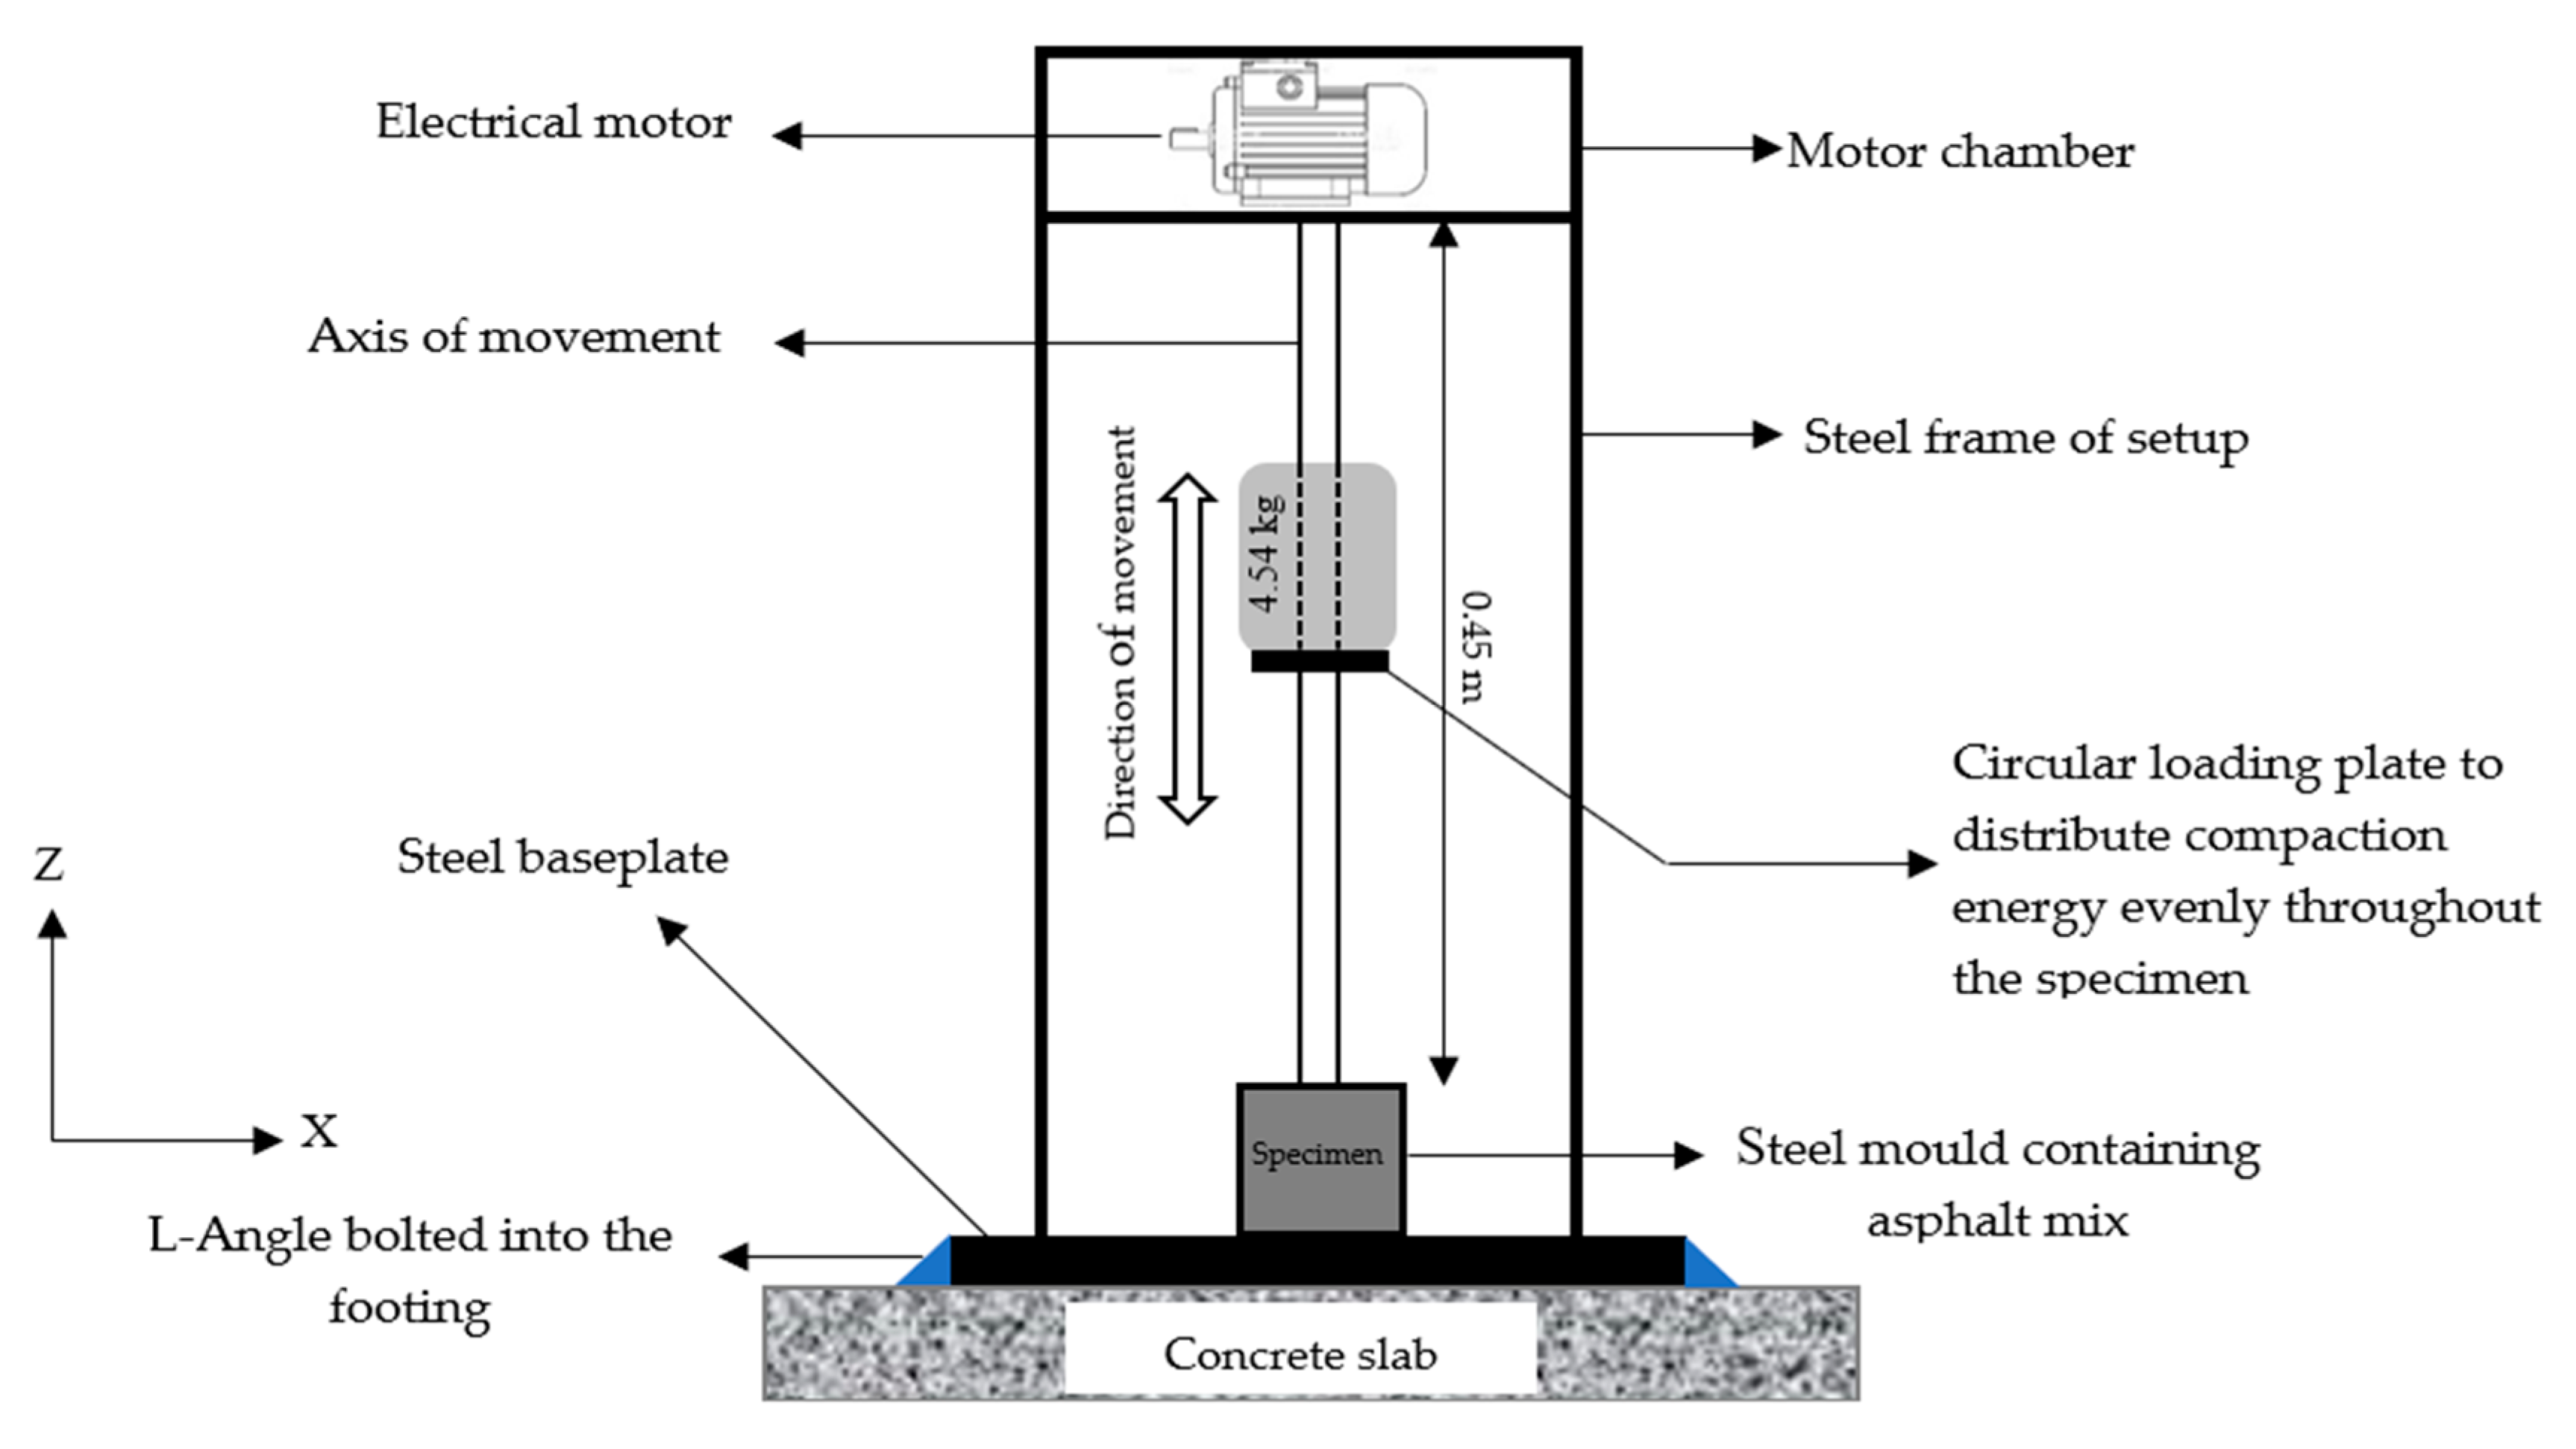
In the Marshall compaction method, a 4.54 kg weight is dropped from a height of 0.45 m (Figure 2). The compaction consists of varying the number of times that the weight drops on the sample in the mold. The impacts, or momentum, due to the weight drop compacts the specimen. Therefore, 75 drops, or blows, per side are often recommended. The same number of drops is used for evaluating the wearing course of highways. The density of the sample increases as the number of blows increases.
The proposed method is based on the law of conservation of energy in Newtonian (classical) physics. Based on this law, the energy is neither created nor destroyed. It is converted from one form into another form. Furthermore, the energy is the sum of the potential energy and kinetic energy in a system (Equation (1)).
E T = E P + E K = 1 2 mv 2 + mgh
  • ET: total mechanical energy; Ep: potential energy; EK: kinetic energy;
  • m: mass; v: speed of mass; h: height;
  • g: gravitational acceleration (9.80 m/s2).
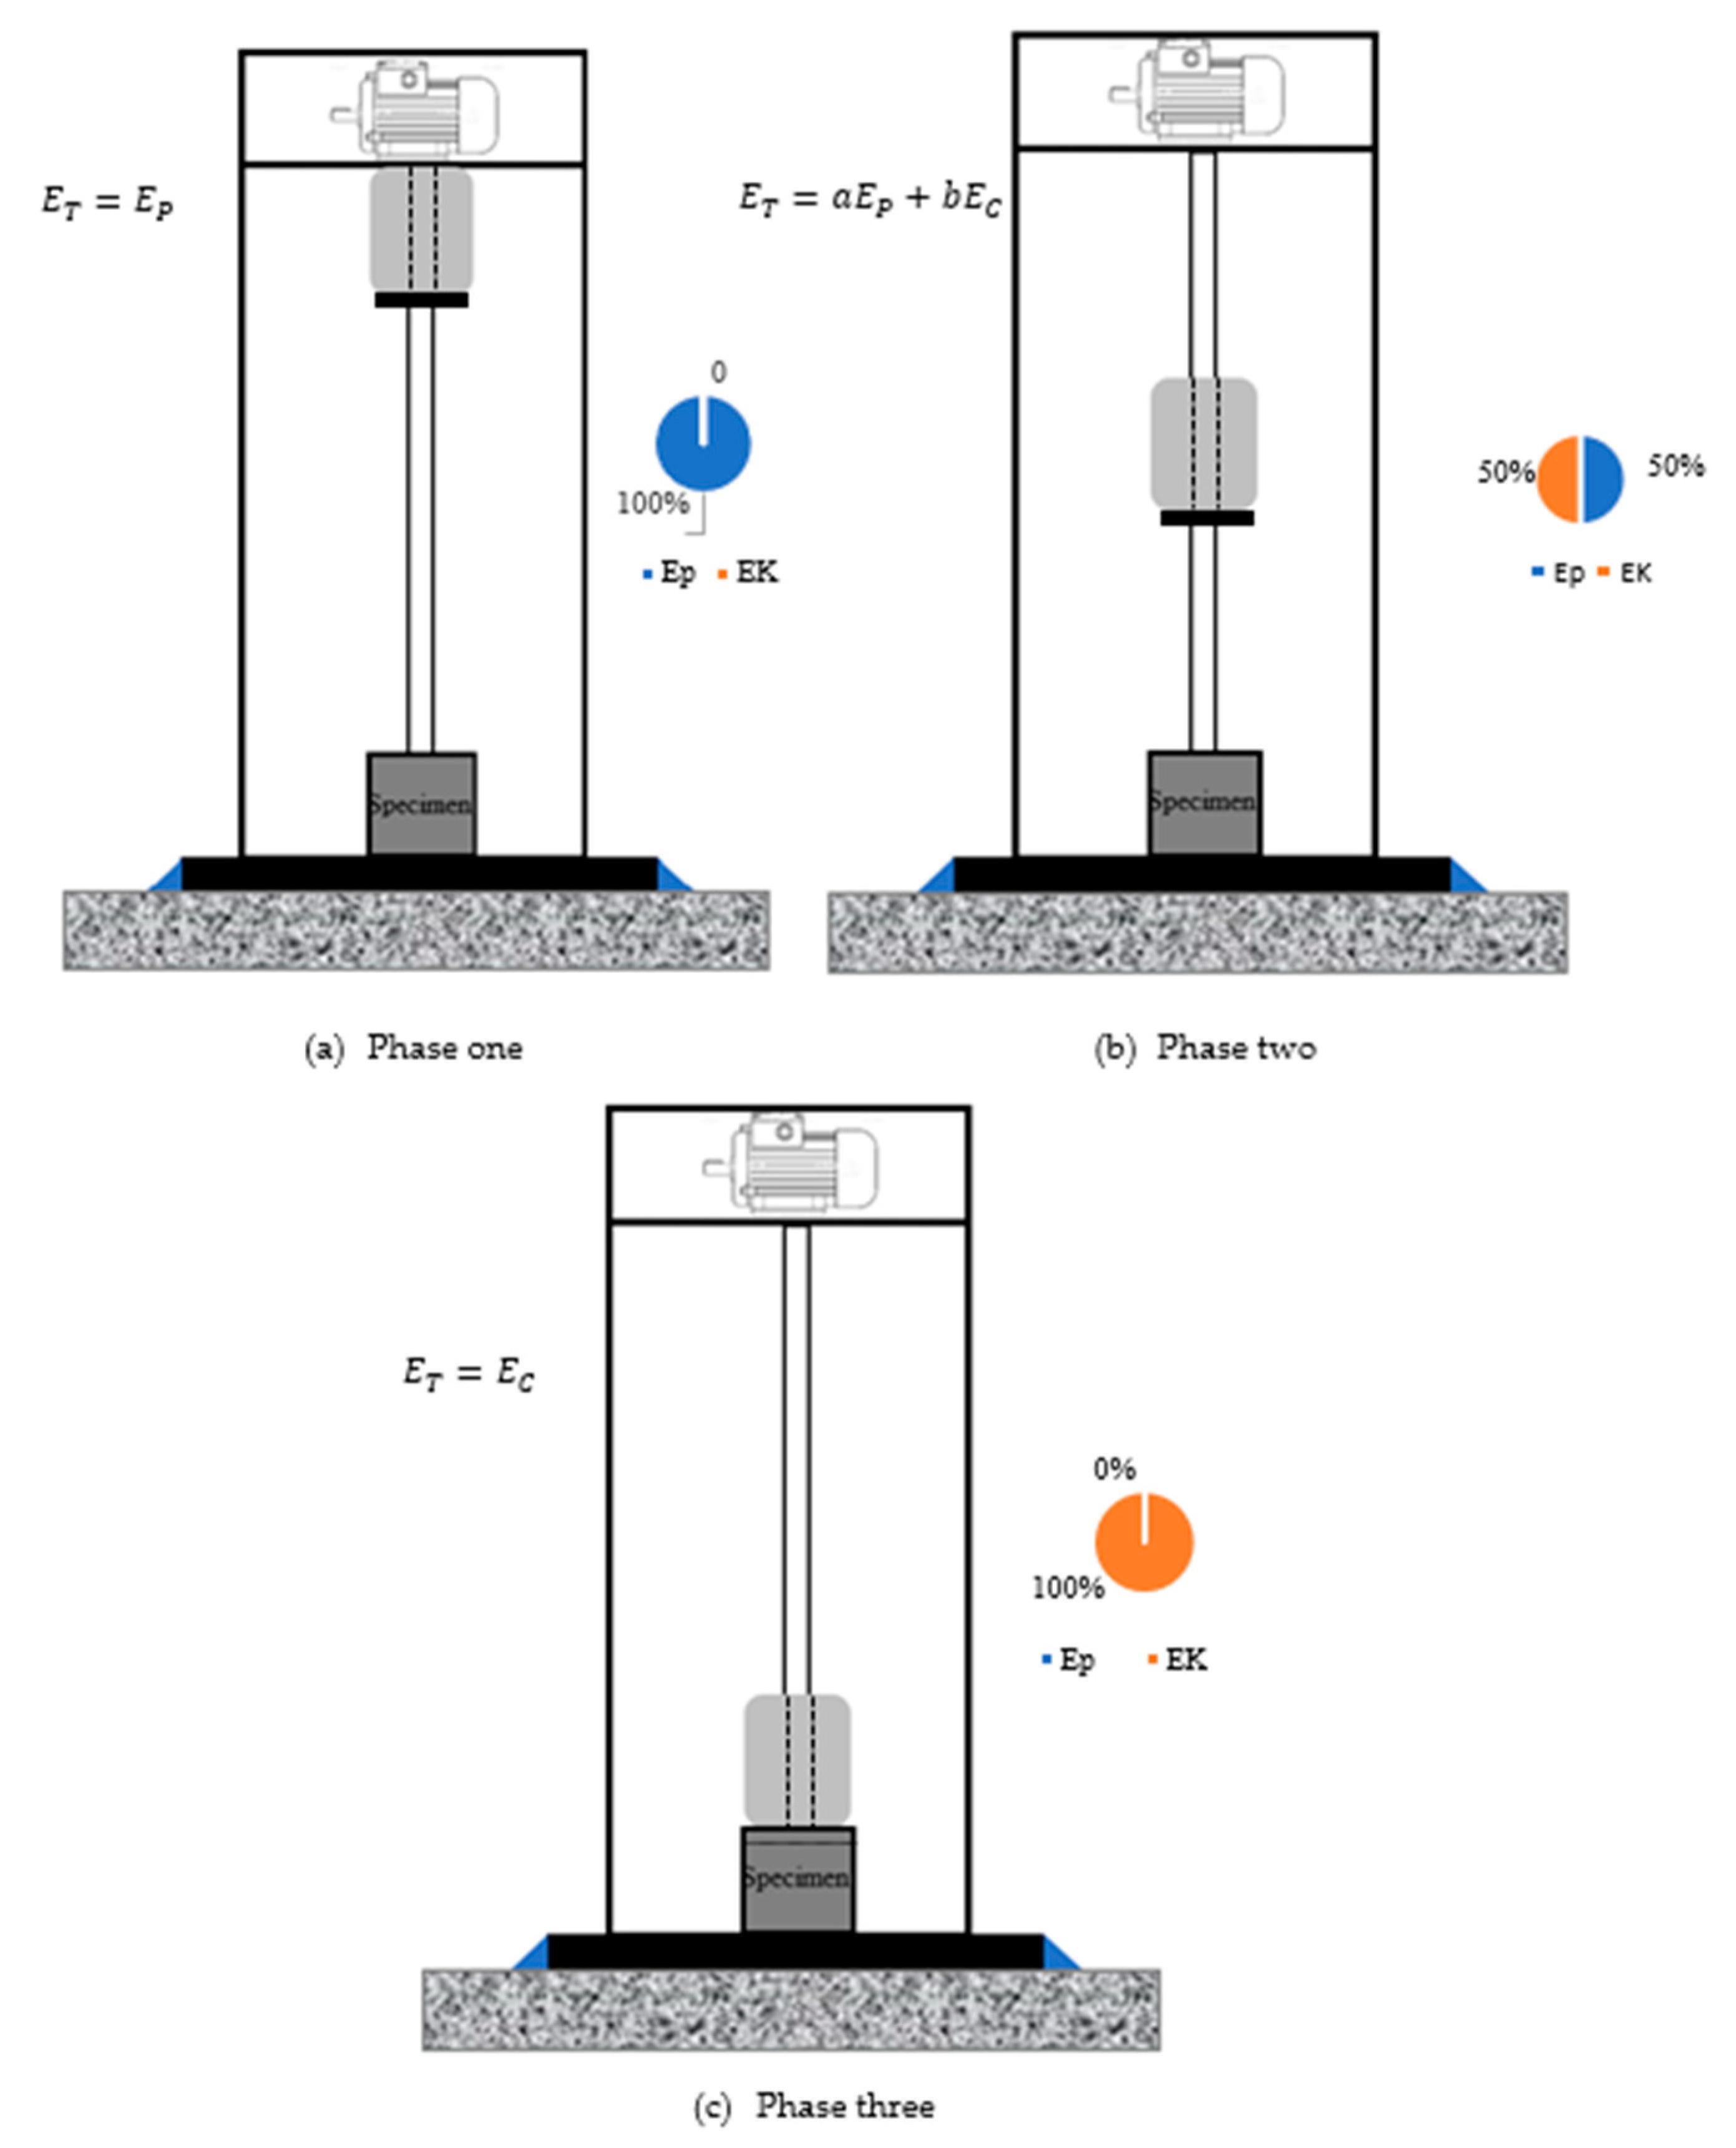
To analyze the compaction effort using the law of conservation of energy, three distinct phases can be adopted based on the position of weight.

2.5.1. Phase One

In this phase, the weight is motionless on top of the height (Figure 3a). Therefore, the total mechanical energy is the same value of the Ep because the speed of the mass is zero.
E T = E P = mgh
Total mechanical energy in phase 1.

2.5.2. Phase Two

In phase two (Figure 3b), the weight falls and the potential energy is consecutively converted into the kinetic energy (Equation (3)). The same amount of potential energy decreases, and the same amount of kinetic energy increases, which results in balance in the energy system.
E T = aE P + bE K = a 1 2 amv 2 + bmgh
a and b are coefficients that decrease the initial potential energy and increase the kinetic energy.

2.5.3. Phase Three

In this phase, all the potential energy is converted into kinetic energy, or the maximum kinetic energy is achieved (Figure 3c).
E T = E K = 1 2 mv 2
Total mechanical energy in phase 3.
Since the amount of total energy is equal in all the phases, the speed of the weight can be calculated from phases 1 and 3 using Equations (5) and (6).
E T Phase   1 = E T Phase   3
mgh   = 1 2 mv 2 v = 2 gh
In determining the compaction effort by the Marshall method, a weight is released from a height of 0.45 m. Therefore, the speed of the weight is 2.96 m/s ( 2 × 9.8 × 0.45 ). It should be noted that the speed of the weight is dependent on its position (Equation (6)).
The energy of compaction was calculated based on the cumulative momentum generated by the fall of the weight. Where the weight touches the tamping face, the speed of the weight would be zero, which imposes a large momentum on the specimen. This momentum happens 75 times per side. Therefore, the total momentum that occurs during compaction is expressed as follows:
E C = i j V 0 V U P = i j V 0 V U mvdv
  • EC: compaction energy (kJ); P: momentum (m2/s); i: number of initial compaction (0);
  • j: number of final compactions per side (in this study: 75; two sides: 150); V0: initial speed of mass (m/s); VU: final speed of mass (m/s); m: weight (kg).
To characterize the effects of the cumulative compaction of energy, a kinetic densifying index (KDI) is proposed. The KDI is the amount of densification achieved per unit of cumulative compaction energy (1 J). Therefore, the unit of KDI is ( t m 3 kJ ). As a result, the KDI is dimensionally represented as T 2 L 5 , where T and L represent the time and length, respectively.
It should be noted that a higher KDI means that more densification per unit of compaction energy, or less compaction energy, is required to densify the mix. To calculate the KDI, Equation (8) is proposed.
KDI = G mb E C = Δ G mb Δ E c = G mb E C = G mb F G mb i E C F E C i
Note : If   E C     then   G mb G mm
where G mb F is the final bulk specific gravity, or the bulk specific gravity of the mix at the last compaction effort (75th compaction effort per side in this study); G mb i is the initial bulk specific gravity of the mix at the first compaction effort, the cumulative compaction energy pertinent to G mb F , and the compaction energy pertinent to G mb i , ECF, and ECi are the compaction energy corresponding to the final and initial blow/compaction effort., respectively.
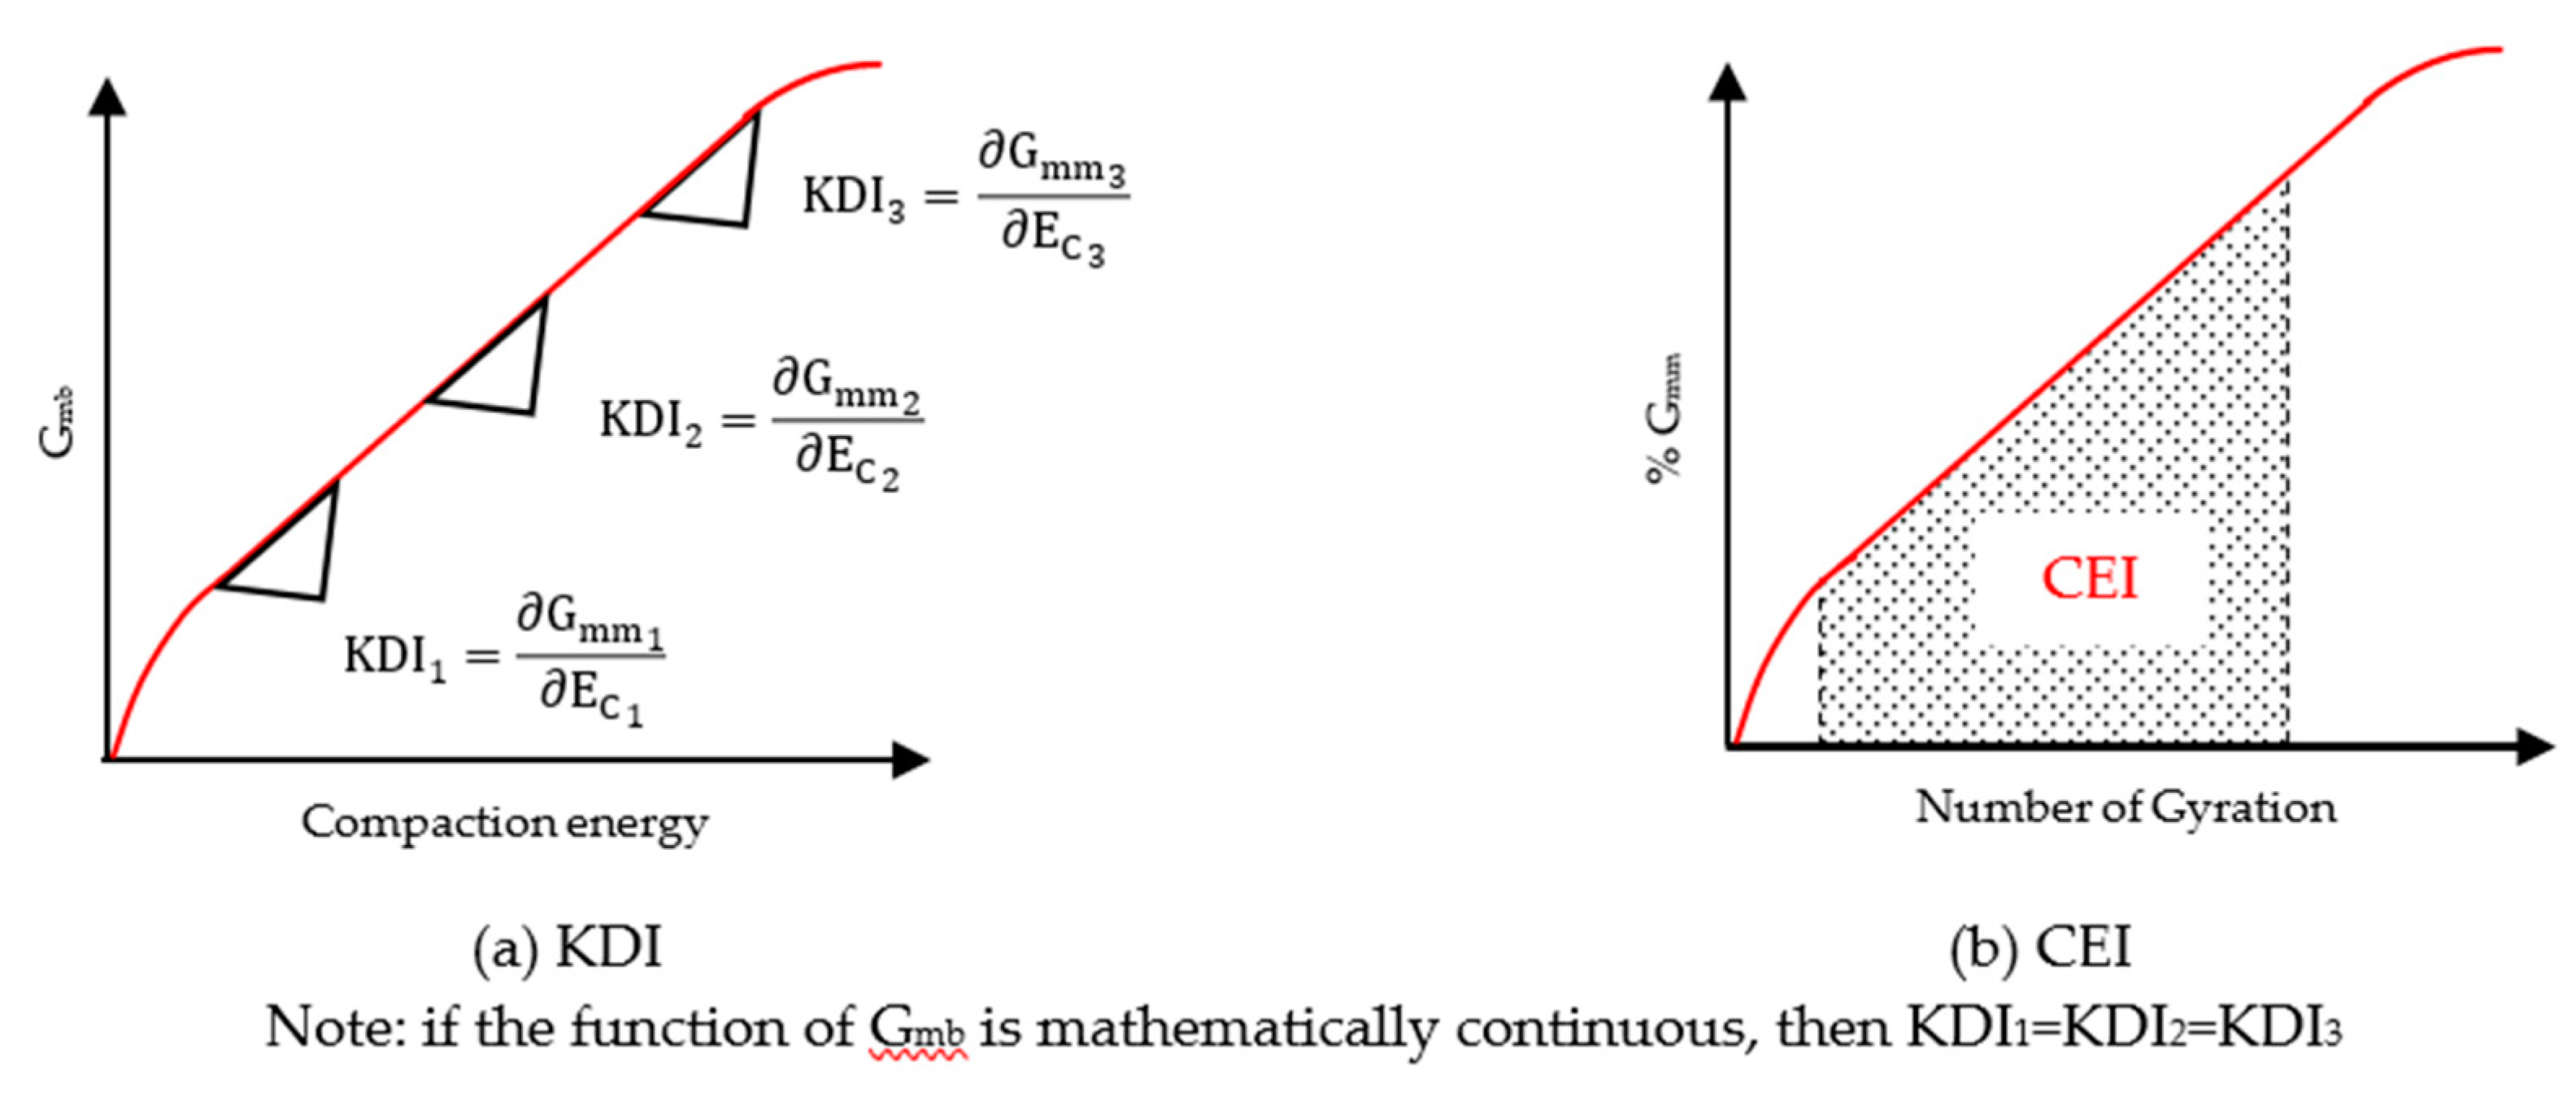
KDI, which is proposed as a workability index in the Marshall method, is the gradient of the bulk density of the mixture over the cumulative compaction energy. Another criterion used to study the workability of the mix is the CEI, which is the area under the 8th gyration and to 92% of the Gmm. The KDI and CEI are schematically illustrated in Figure 4. The lower CEI means less work applied by a roller to reach the target compaction degree. Therefore, the lower the CEI, the more workable the mix. It should be noted that a higher KDI means more densification happens per 1 J of compaction energy. As a result, a higher KDI indicates a more workable mix, which is desirable. CEI of the asphalt mixtures were calculated based on the density of asphalt mixes versus the number of gyrations during the compaction of the samples using gyro-compactor (refer to Table 2). The details of the calculation of CEI may be found in literature [25].
Therefore, 5 series of asphalt mixtures were prepared to calculate the compaction energy (Equation (7)) and determine the density (Figure 4a). The samples are shown in Figure 5. To avoid the effect of heat loss in the compaction, each series was produced separately for each mixture shown in Table 2. Therefore, a total of 135 samples were prepared for the calculation of the KDI: 5 (series) × 3 (Sasobit® content) × 3 (mixing temperature) × 3 (replication). The mean value of the three samples was the representative result for each test.
A sample calculation of the kinetic compaction energy using the proposed methodology (Equation (7) using Marshall method) is shown as follows:
For 15 blows,
Sustainability 14 06550 i001
The same procedure is followed to calculate the compaction energy using 30, 45, 60, and 75 blows. After calculation of the compaction energy of each series, the curve of the cumulative compaction energy and density (Gmb) is plotted for each mixture in Table 2. An ITS test was carried out on mixtures in each series to determine the effect of the KDI on the mixture performance.

2.6. Hypotheses and Scope of Research

It was assumed that all the kinetic energy of the weight in the Marshall setup was converted to compaction effort. However, there is energy loss due to friction between the rim and the axis of the hammer. Further, the drag force that acts on the moving weight was disregarded.
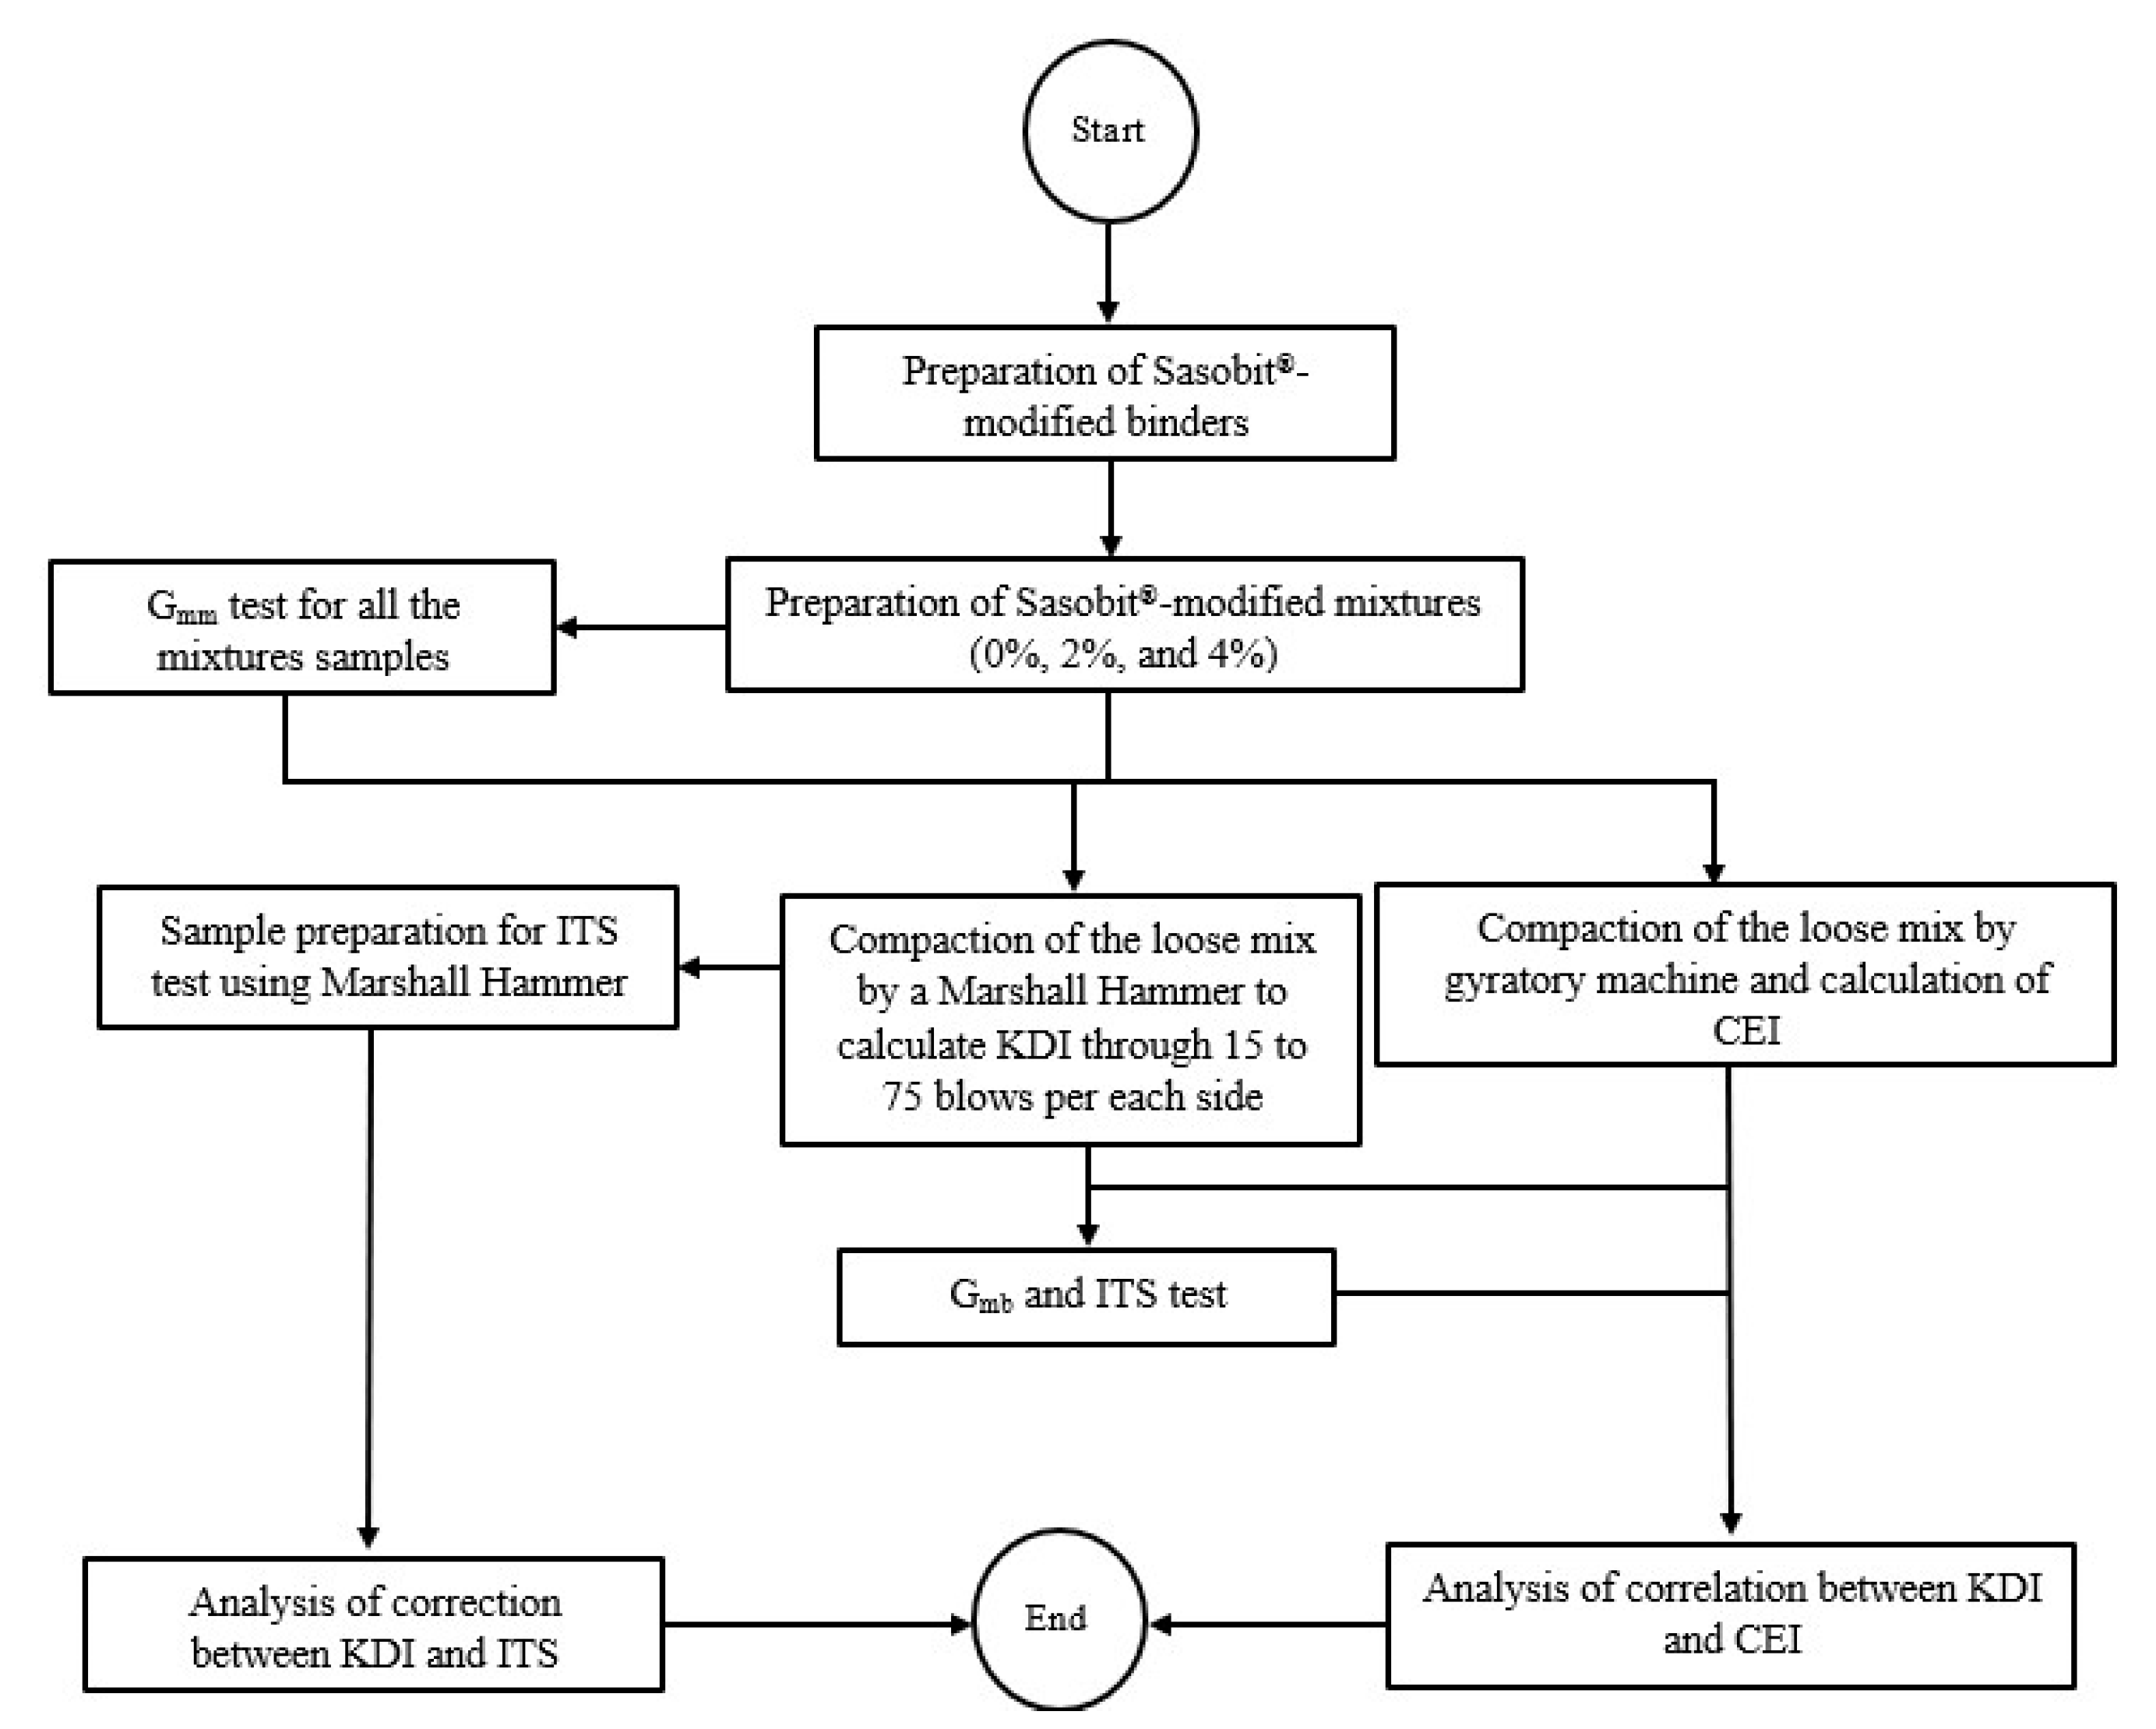
It was assumed that the speed of the weight becomes zero once it touches the plate of compaction on top of the sample. The place of the mold was fixed; therefore, the lateral movement was disregarded. The efficiency of the proposed method was compared with the CEI estimated via the gyratory compactor. It should be noted that the effect of any additive type, aggregate gradation, and binder type may vary the results of the proposed method, which is outside the scope of this study. Figure 6 illustrates the flowchart of the experimental design and analysis.

3. Results and Discussion

3.1. Correlation between KDI and Density

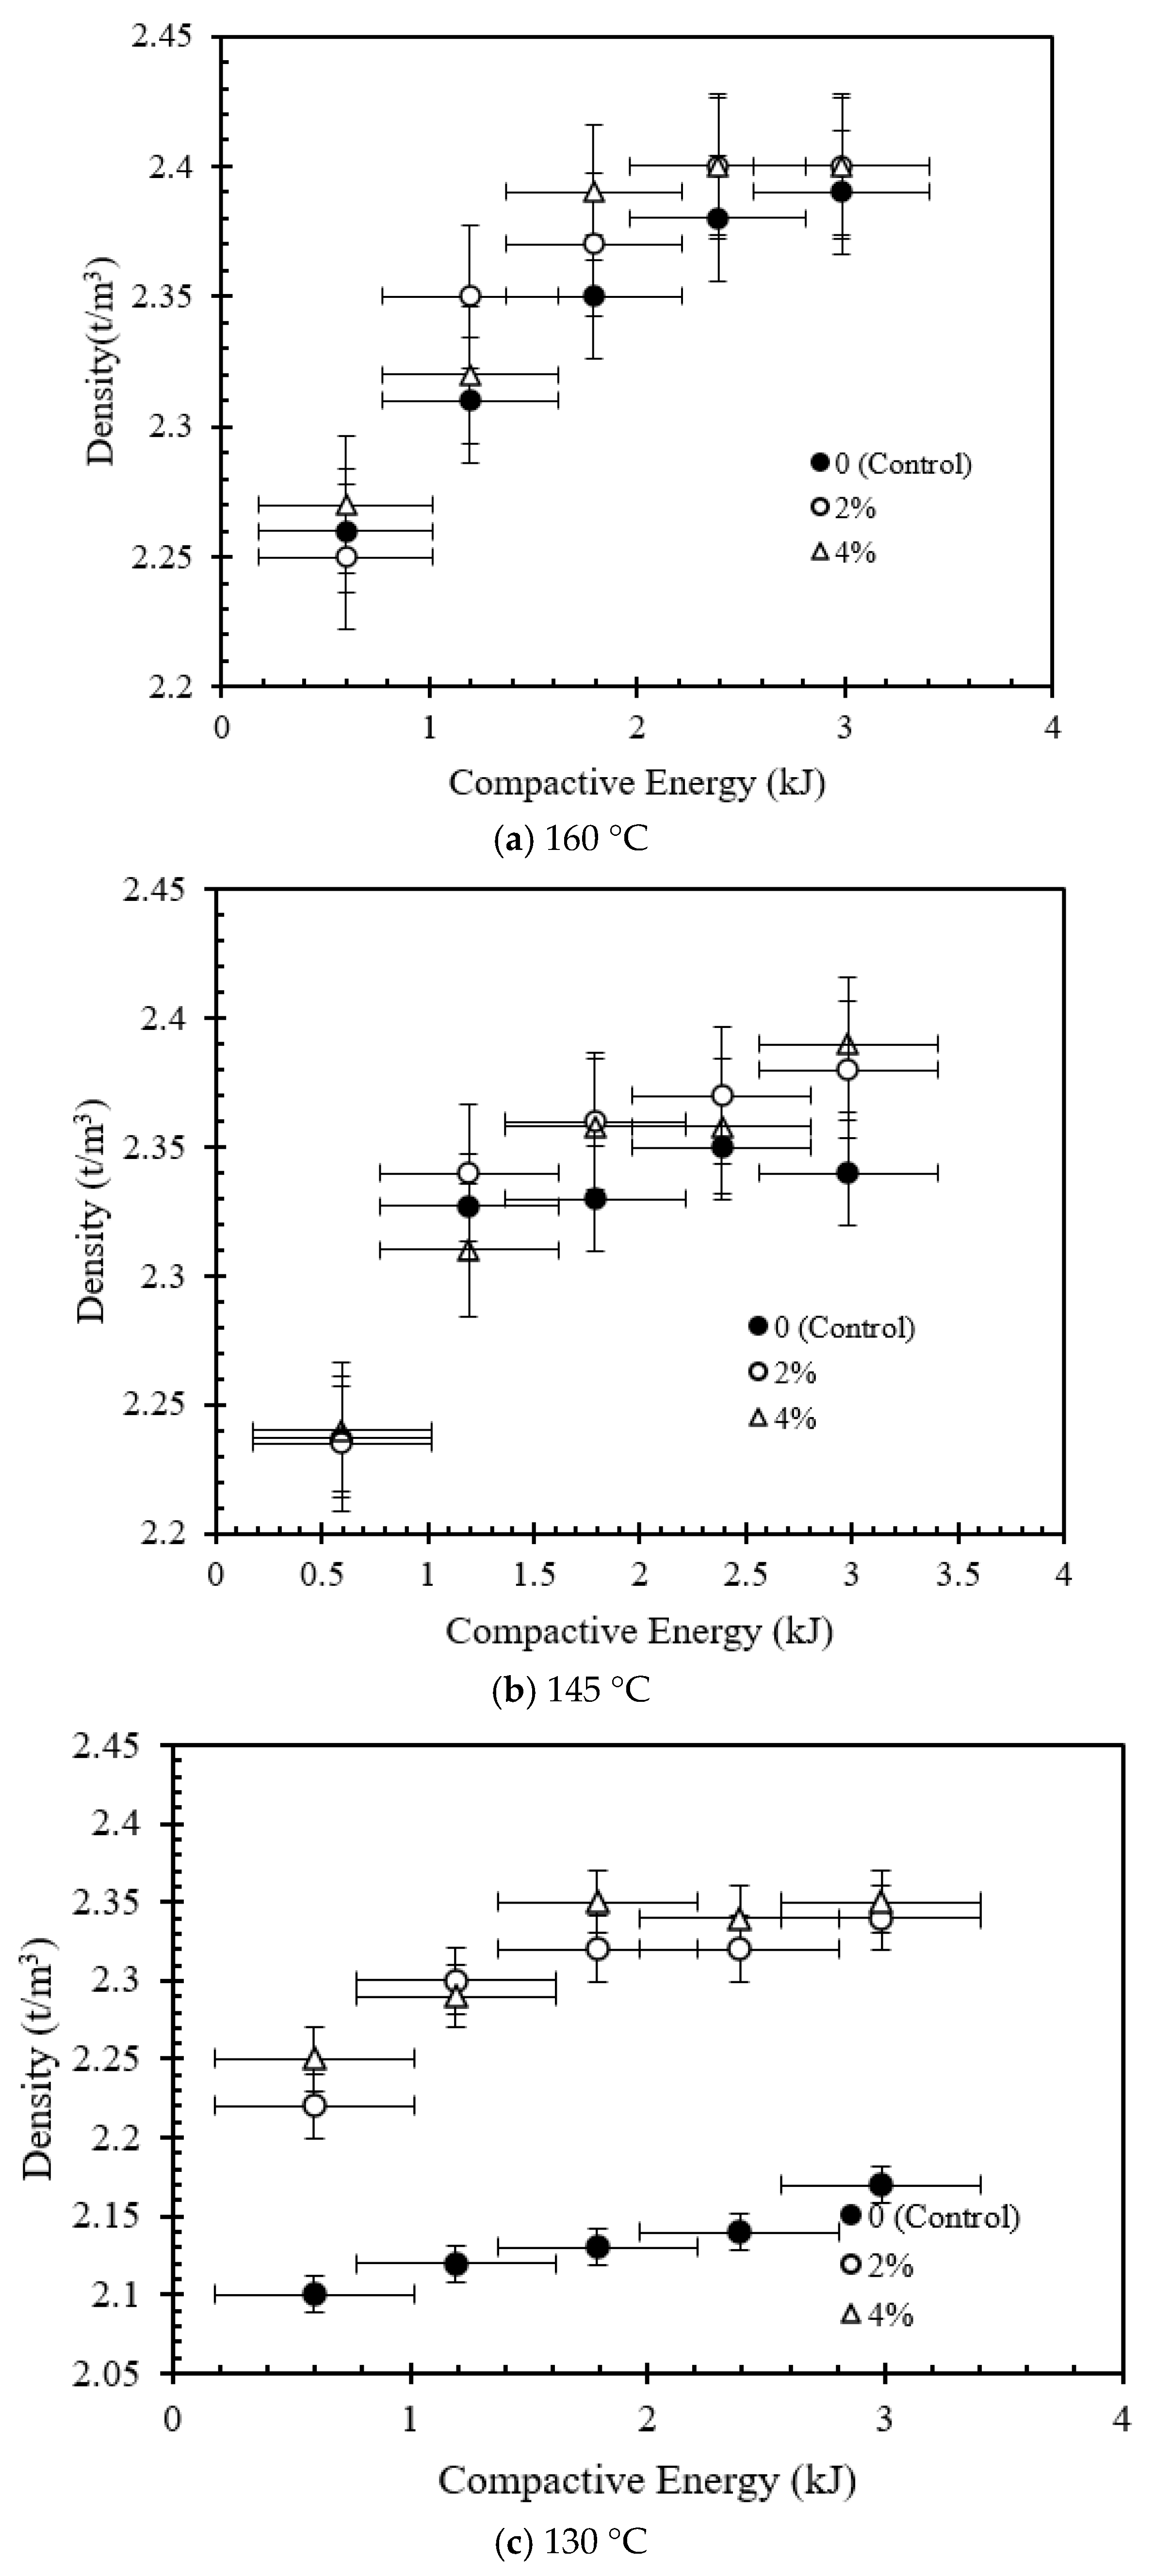
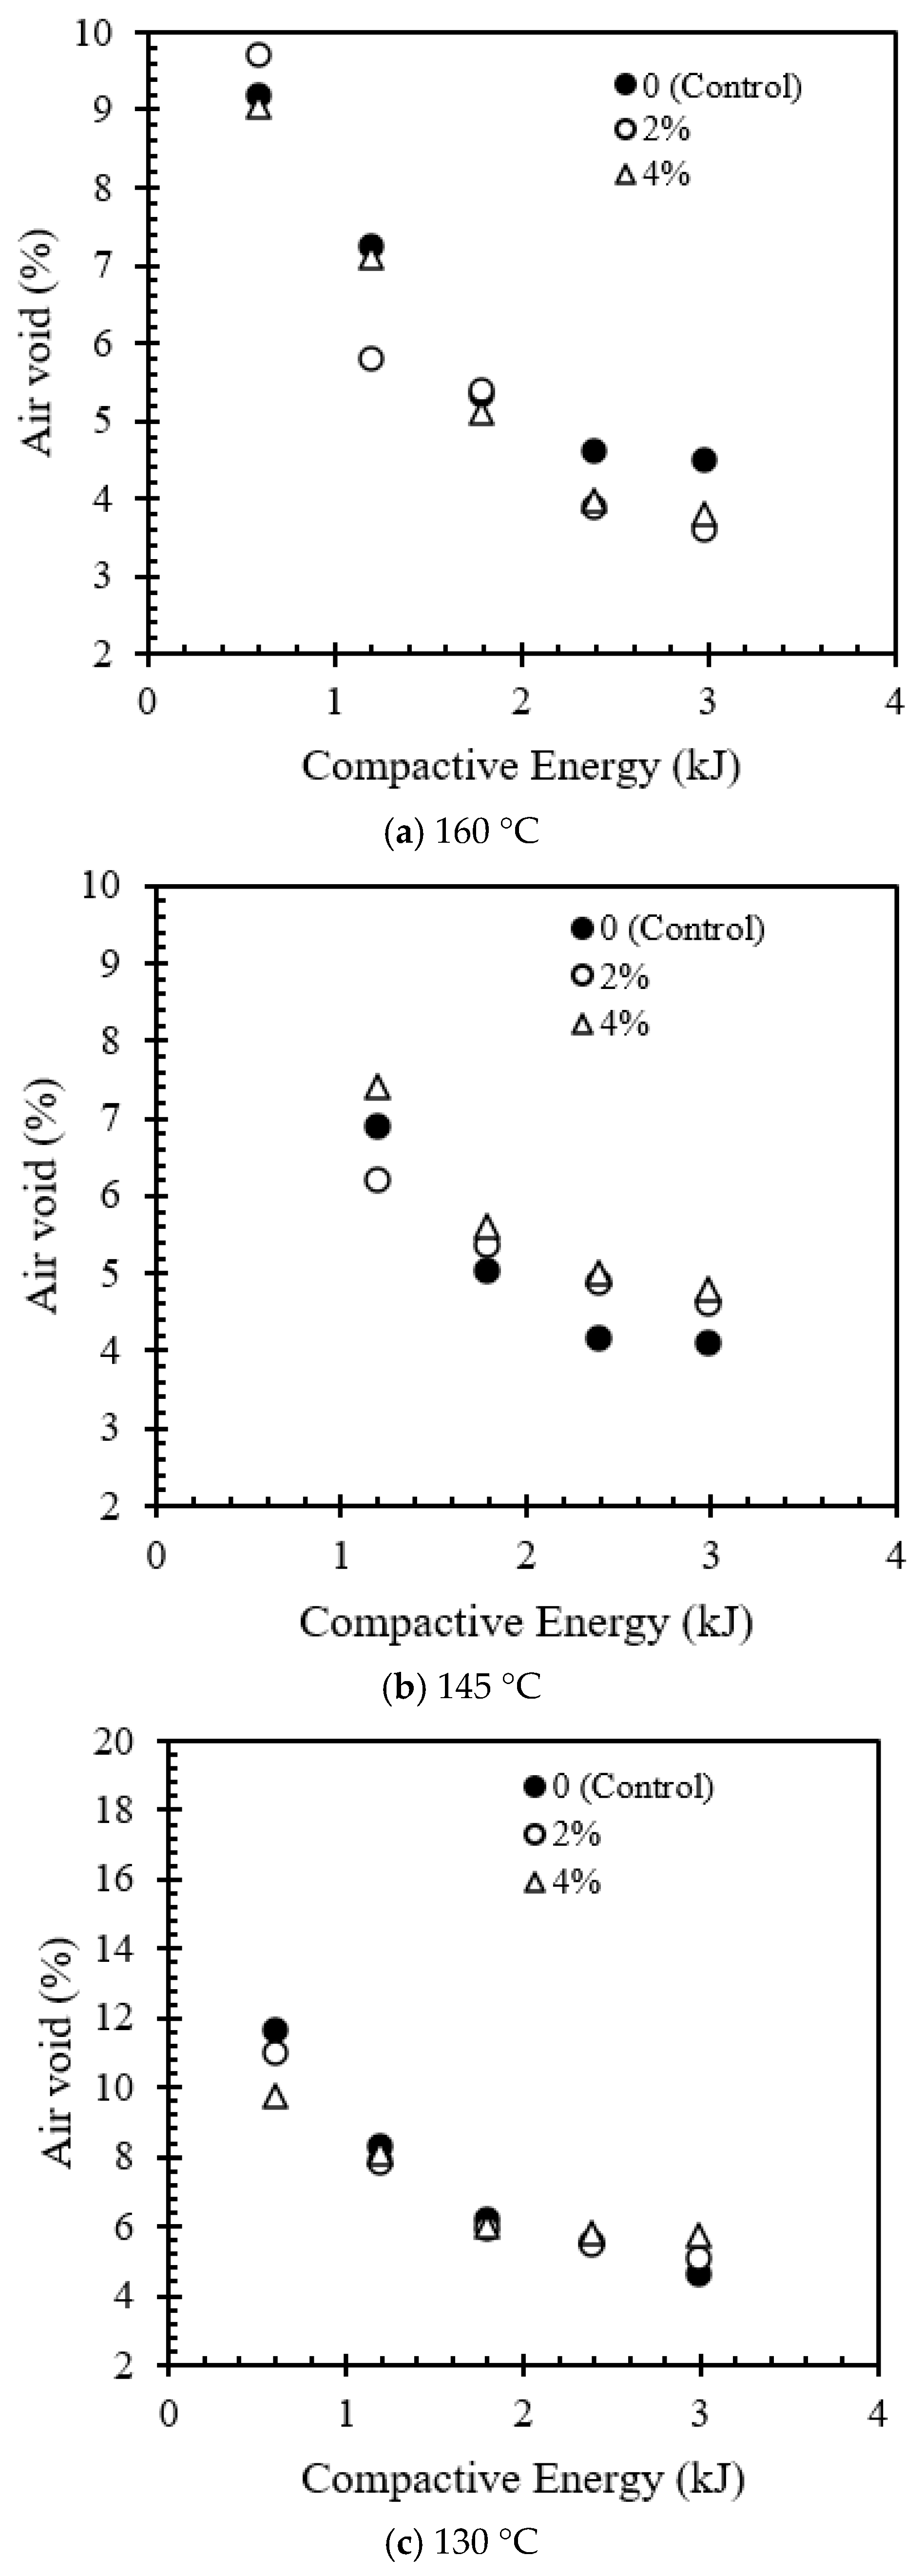
Figure 7 and Figure 8 show the trend of Gmb and the percentage of air void versus compaction energy at various mixing temperatures, respectively. The Gmb necessarily increases and the air void percentage decreases as the compaction energy increases, due to mixture densification. To characterize the effect of compaction energy on the density, Equations (9)–(11) were proposed. It can be seen that Gmb increases linearly in all the mixes. Therefore, the mix type has no effect on the trend of Gmb. Both mixes (the control and Sasobit®-modified mixtures) show almost identical behavior under the compaction effort. However, the amount of densification achieved per unit of compaction energy (1 kJ) is different, which is characterized via KDI ( t m 3 kJ ).
It is noted that the linear trend can change to another trend, depending on the aggregate gradation/type, binder type, binder content, filler type, binder modifier, compaction temperature, and construction technology.
Since Equations (9)–(11) are mathematically continuous linear functions, the gradient of Gmb per unit of compaction energy can be estimated as the slope of the equation. Therefore, the KDI of any mixture is equal to the slope of the equations obtained from Figure 7.
G mb = { 0.055 E C + 2.24 0.0585 E C + 2.25 0.057 E C + 2.25 R2 = 0.94
R2 = 0.80
R2 = 0.84
0 (Control)
2% Sasobit
4% Sasobit
T = 160 °C(9)
G mb = { 0.38 E C + 2.25 0.054 E C + 2.24 0.058 E C + 2.22 R2 = 0.63
R2 = 0.75
R2 = 0.63
0 (Control)
2% Sasobit
4% Sasobit
T = 145 °C(10)
G mb = { 0.027 E C + 2.08 0.044 E C + 2.24 0.042 E C + 2.24 R2 = 0.96
R2 = 0.76
R2 = 0.78
0 (Control)
2% Sasobit
4% Sasobit
T = 130 °C(11)
The effect of the Sasobit® and construction temperature on the KDI of the different mixtures is shown in Figure 9. For example, the maximum values of KDI belong to mixtures produced at 160 °C, which means that the achieved densification per unit of compaction energy was 5.5, 5.8, and 5.7 for HMA samples containing 0, 2%, and 4% Sasobit®, respectively, as shown in Figure 9a. In other words, adding 2% Sasobit®, from 2% to 4%, increases the densification per unit of compaction energy by approximately 6%, which indicates that the interaction between the higher mixing temperature and the compaction-aiding role of Sasobit® may result in a higher density per unit of compaction energy.
It should be noted that the difference between the KDI of mixtures increases as the temperature decreases. For example, Figure 9b shows that the KDI of WMA containing 2% and 4% Sasobit® are 42% and 53% higher, respectively, than the sample containing no Sasobit® and produced at 145 °C. Although the density per unit of compaction energy decreases at the higher viscosity, Sasobit® decreases the binder viscosity, which results in more density during compaction. For instance, the KDI of WMA produced at 145 °C and containing 2% and 4% Sasobit® are very close to the KDI of HMA produced at 160 °C (Figure 9a). A comparison of Figure 9b,c reveals that the rate of the change of density per unit of compaction energy, the slope of the equation or KDI, of samples at 145 °C decreased from 5.4 and 5.8 to 4.4 to 4.2 at 130 °C. A 15 °C reduction in mixing temperature decreases the KDI by 19% to 28%, which means that the unit energy for densifying the mixtures increases by approximately 20%. The role of Sasobit® to improve the densification of a mixture is underscored at the lower construction temperatures. As a result, the KDI is an appropriate indicator of relative workability for HMA and WMA produced using the Marshall hammer.
As shown in Figure 9c, the KDI of the mixture containing 4% Sasobit® and mixed at 130 °C is lower than that of the mixture containing 2%. In contrast, Figure 9b shows that the higher Sasobit® content increases the KDI at 145 °C. The reason is that the viscosity of binder at 130 °C is less than that at 145 °C and 160 °C. In addition, the samples mixed at 130 °C, which compacted at 120 °C (Table 2), lose heat energy during the compaction process. Once the sample temperature drops to lower than 120 °C, which is near the congealing and melting point of Sasobit® [3,31], a lattice structure in the asphalt binder is formed, which increases the binder viscosity [5,32], hence producing a stiffer mixture for compaction. Therefore, the higher Sasobit® content at the low compaction temperature may result in lower workability. It should be noted that the rheological properties of the base binder have a key role in choosing the optimum Sasobit® content, which explains why 1.5% to 3% Sasobit® is recommended by the literature [33,34,35] for the production of WMA.
Table 3 ranks the workability of the mixtures in terms of the KDI. The workability of the mixtures decreases from top to bottom. It can be seen that the most workable mix is H160S2, while the minimum workability is achieved for W130S0. Reducing the mixing temperature, without adding Sasobit®, dramatically decreased the workability of the mixture, resulting in a higher air void content.

3.2. Comparison between KDI and CEI

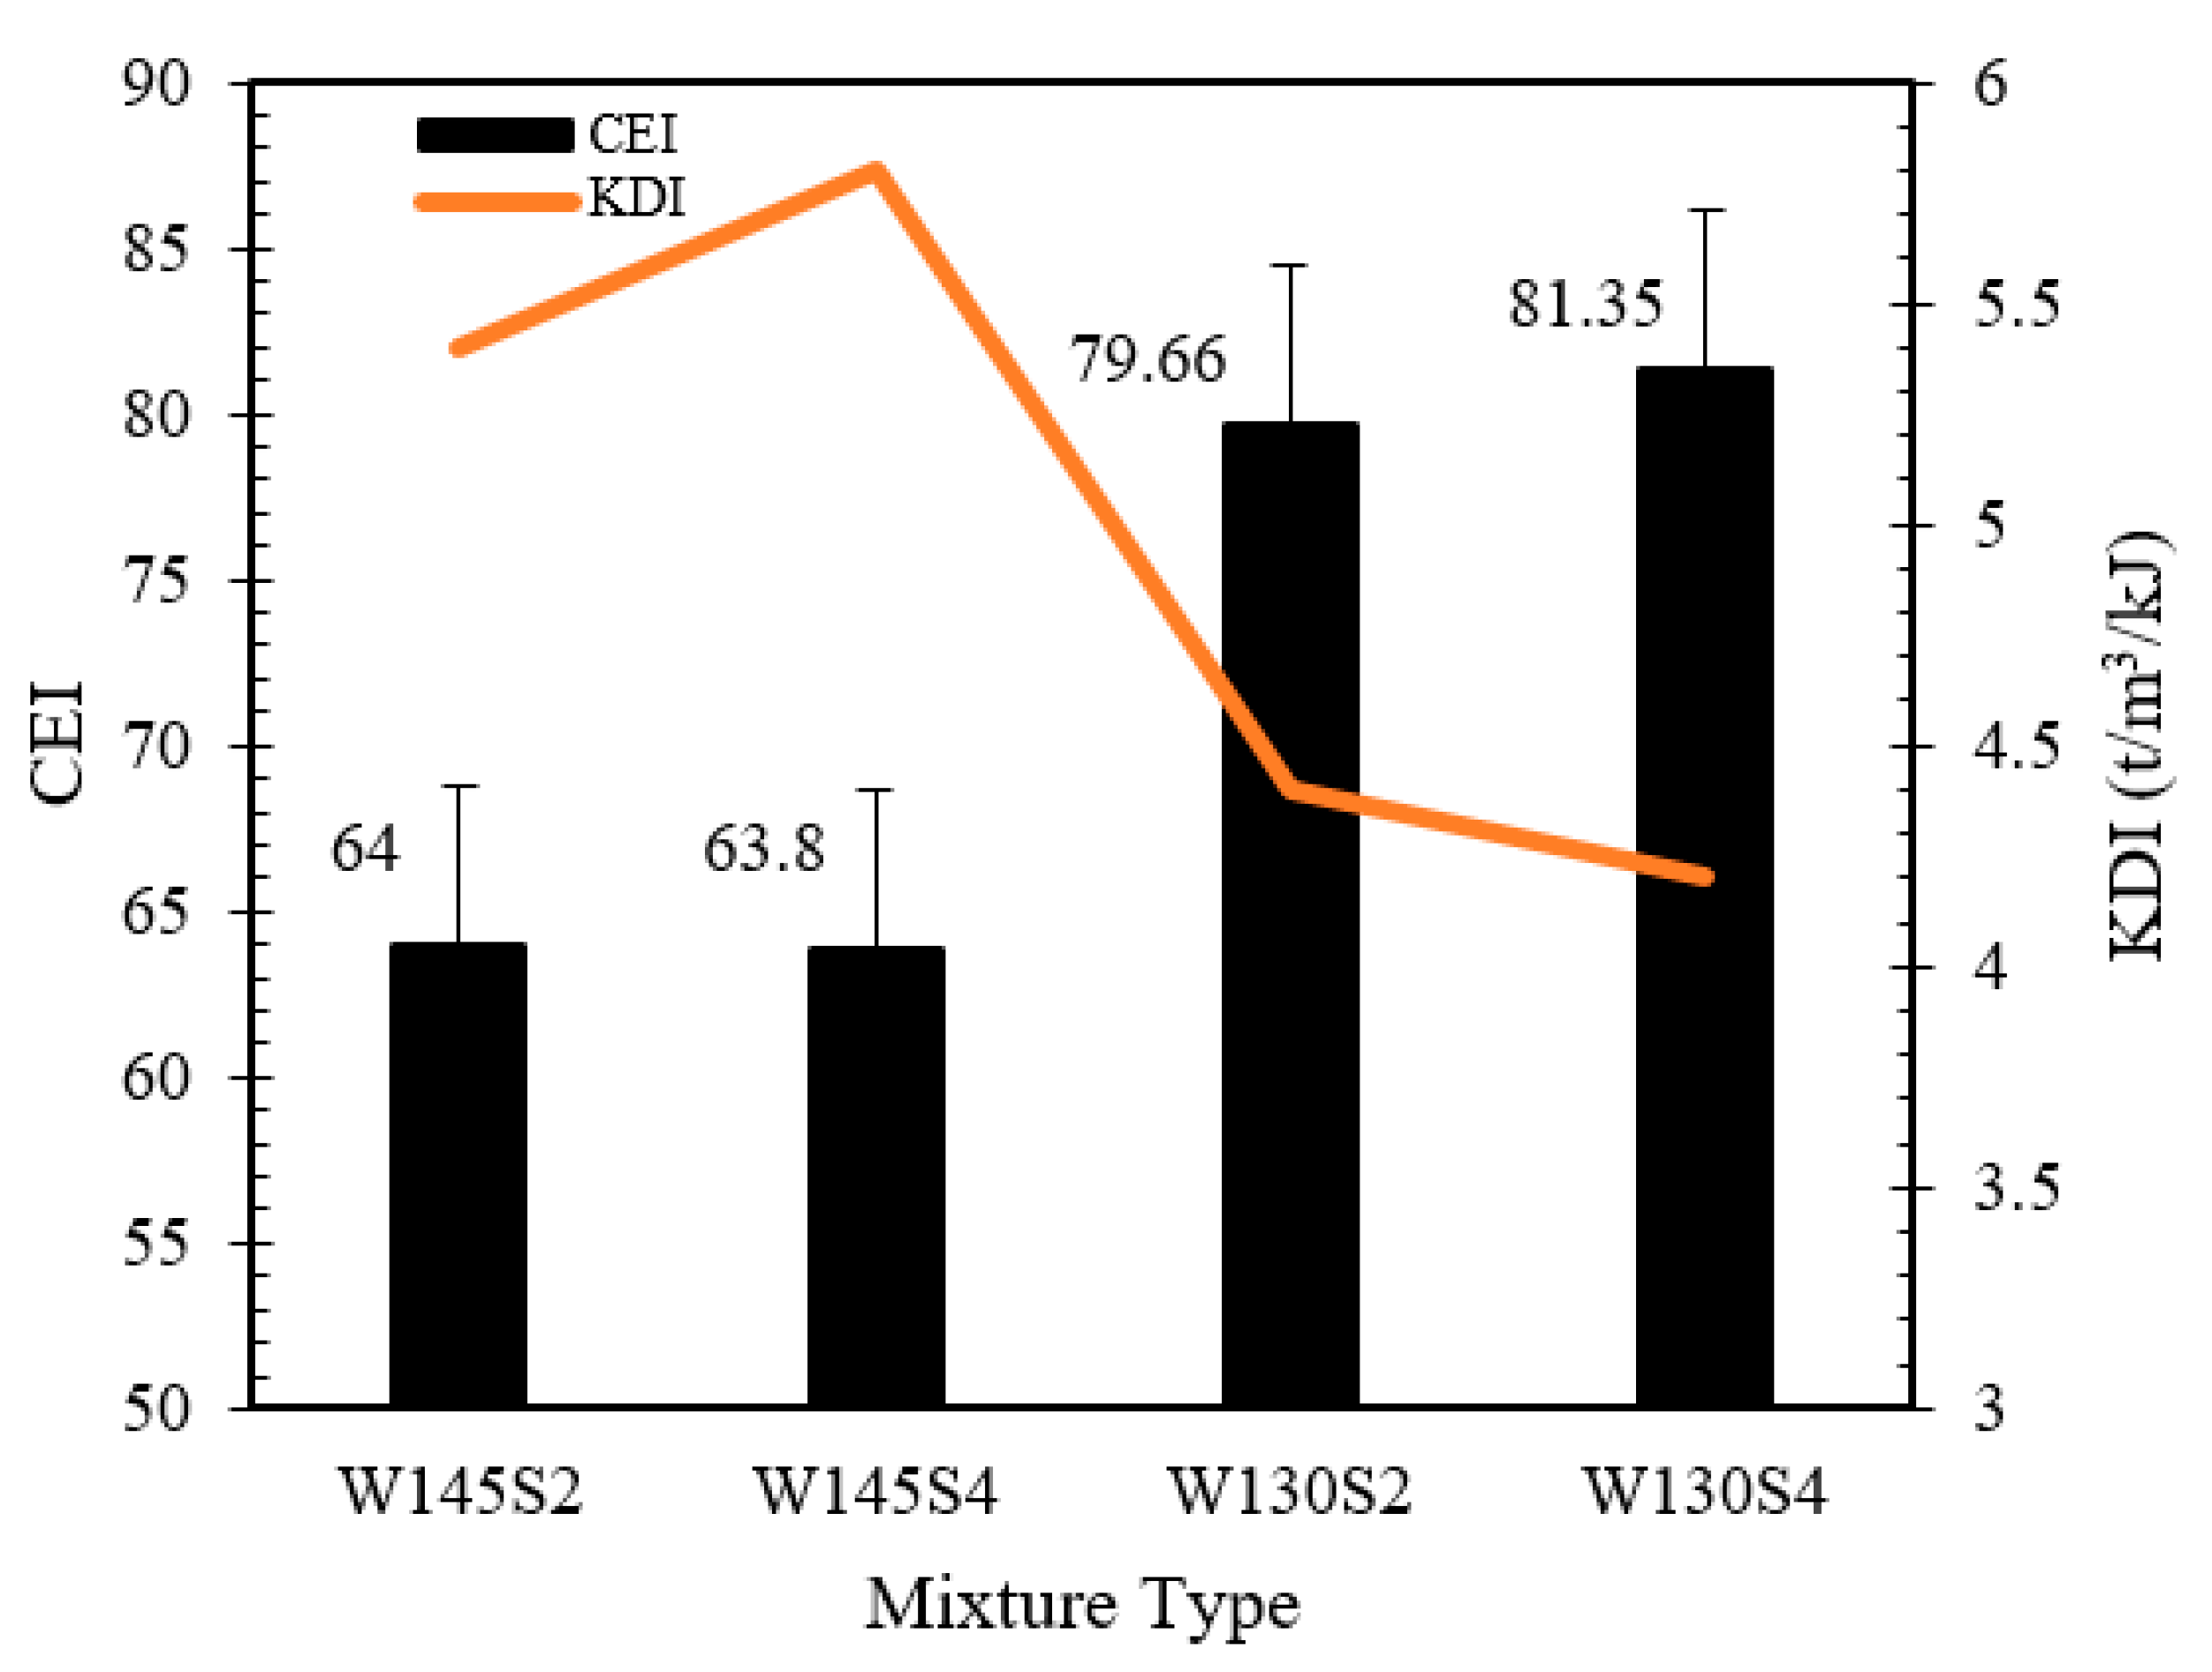
Figure 10 shows the results for the CEI compared with the KDI for the mixtures. Adding Sasobit® decreased the CEI at each mixing temperature, which means that Sasobit® reduced the work applied to reach compaction of 92% Gmm. Therefore, the lower CEI is more desirable in terms of workability. As shown in Figure 10, the CEI of mixtures produced at 145 °C was less than those produced at 130 °C. For example, the CEI of W145S4 is 22% less than for W130S4. W145S4 required 22% less work to reach 92% of the maximum theoretical density (Gmm), compared to that required for W145S4. This improvement can be attributed to the higher mixing temperature that resulted in a lower binder viscosity, and hence, a more workable mix.
Although a lower CEI is desirable, a higher KDI shows more workability. Because a higher Sasobit® content results in less work required to achieve compaction, or to lower the CEI, it increases the potential of densification of a mixture due to the lower viscosity of the binder. As a result, the lower CEI leads to the higher KDI, and vice versa. Thus, there is an inverse relationship between CEI and KDI.
In comparison, the numerical values show that the CEI is approximately 16 times that of the KDI in this study, which is a rough estimation. Therefore, the KDI can be estimated via CEI values. However, the ratio of the CEI to the KDI, or vice versa, may change, depending on the binder type, compaction-aid agent, aggregate gradation/type, OBC, binder type, filler type, and construction temperature.
It is noted that the mechanism of compaction to calculate the CEI and KDI is fundamentally different. The gyratory machine compacts by kneading the loose mix, while the Marshall hammer compacts the samples via the cumulative momentum due to the transition of potential energy to kinematic energy as the hammer impacts the sample (Figure 3 and Equations (1)–(7)). Although the mechanism and concepts vary, the outputs of the analysis of workability are comparable. For example, the most workable mix in terms of the CEI is W145S4, which is the same mix ranked the most workable in terms of the KDI. Table 4 shows the results of ranking the mixtures based on the CEI and KDI.

3.3. Effect of KDI on ITS

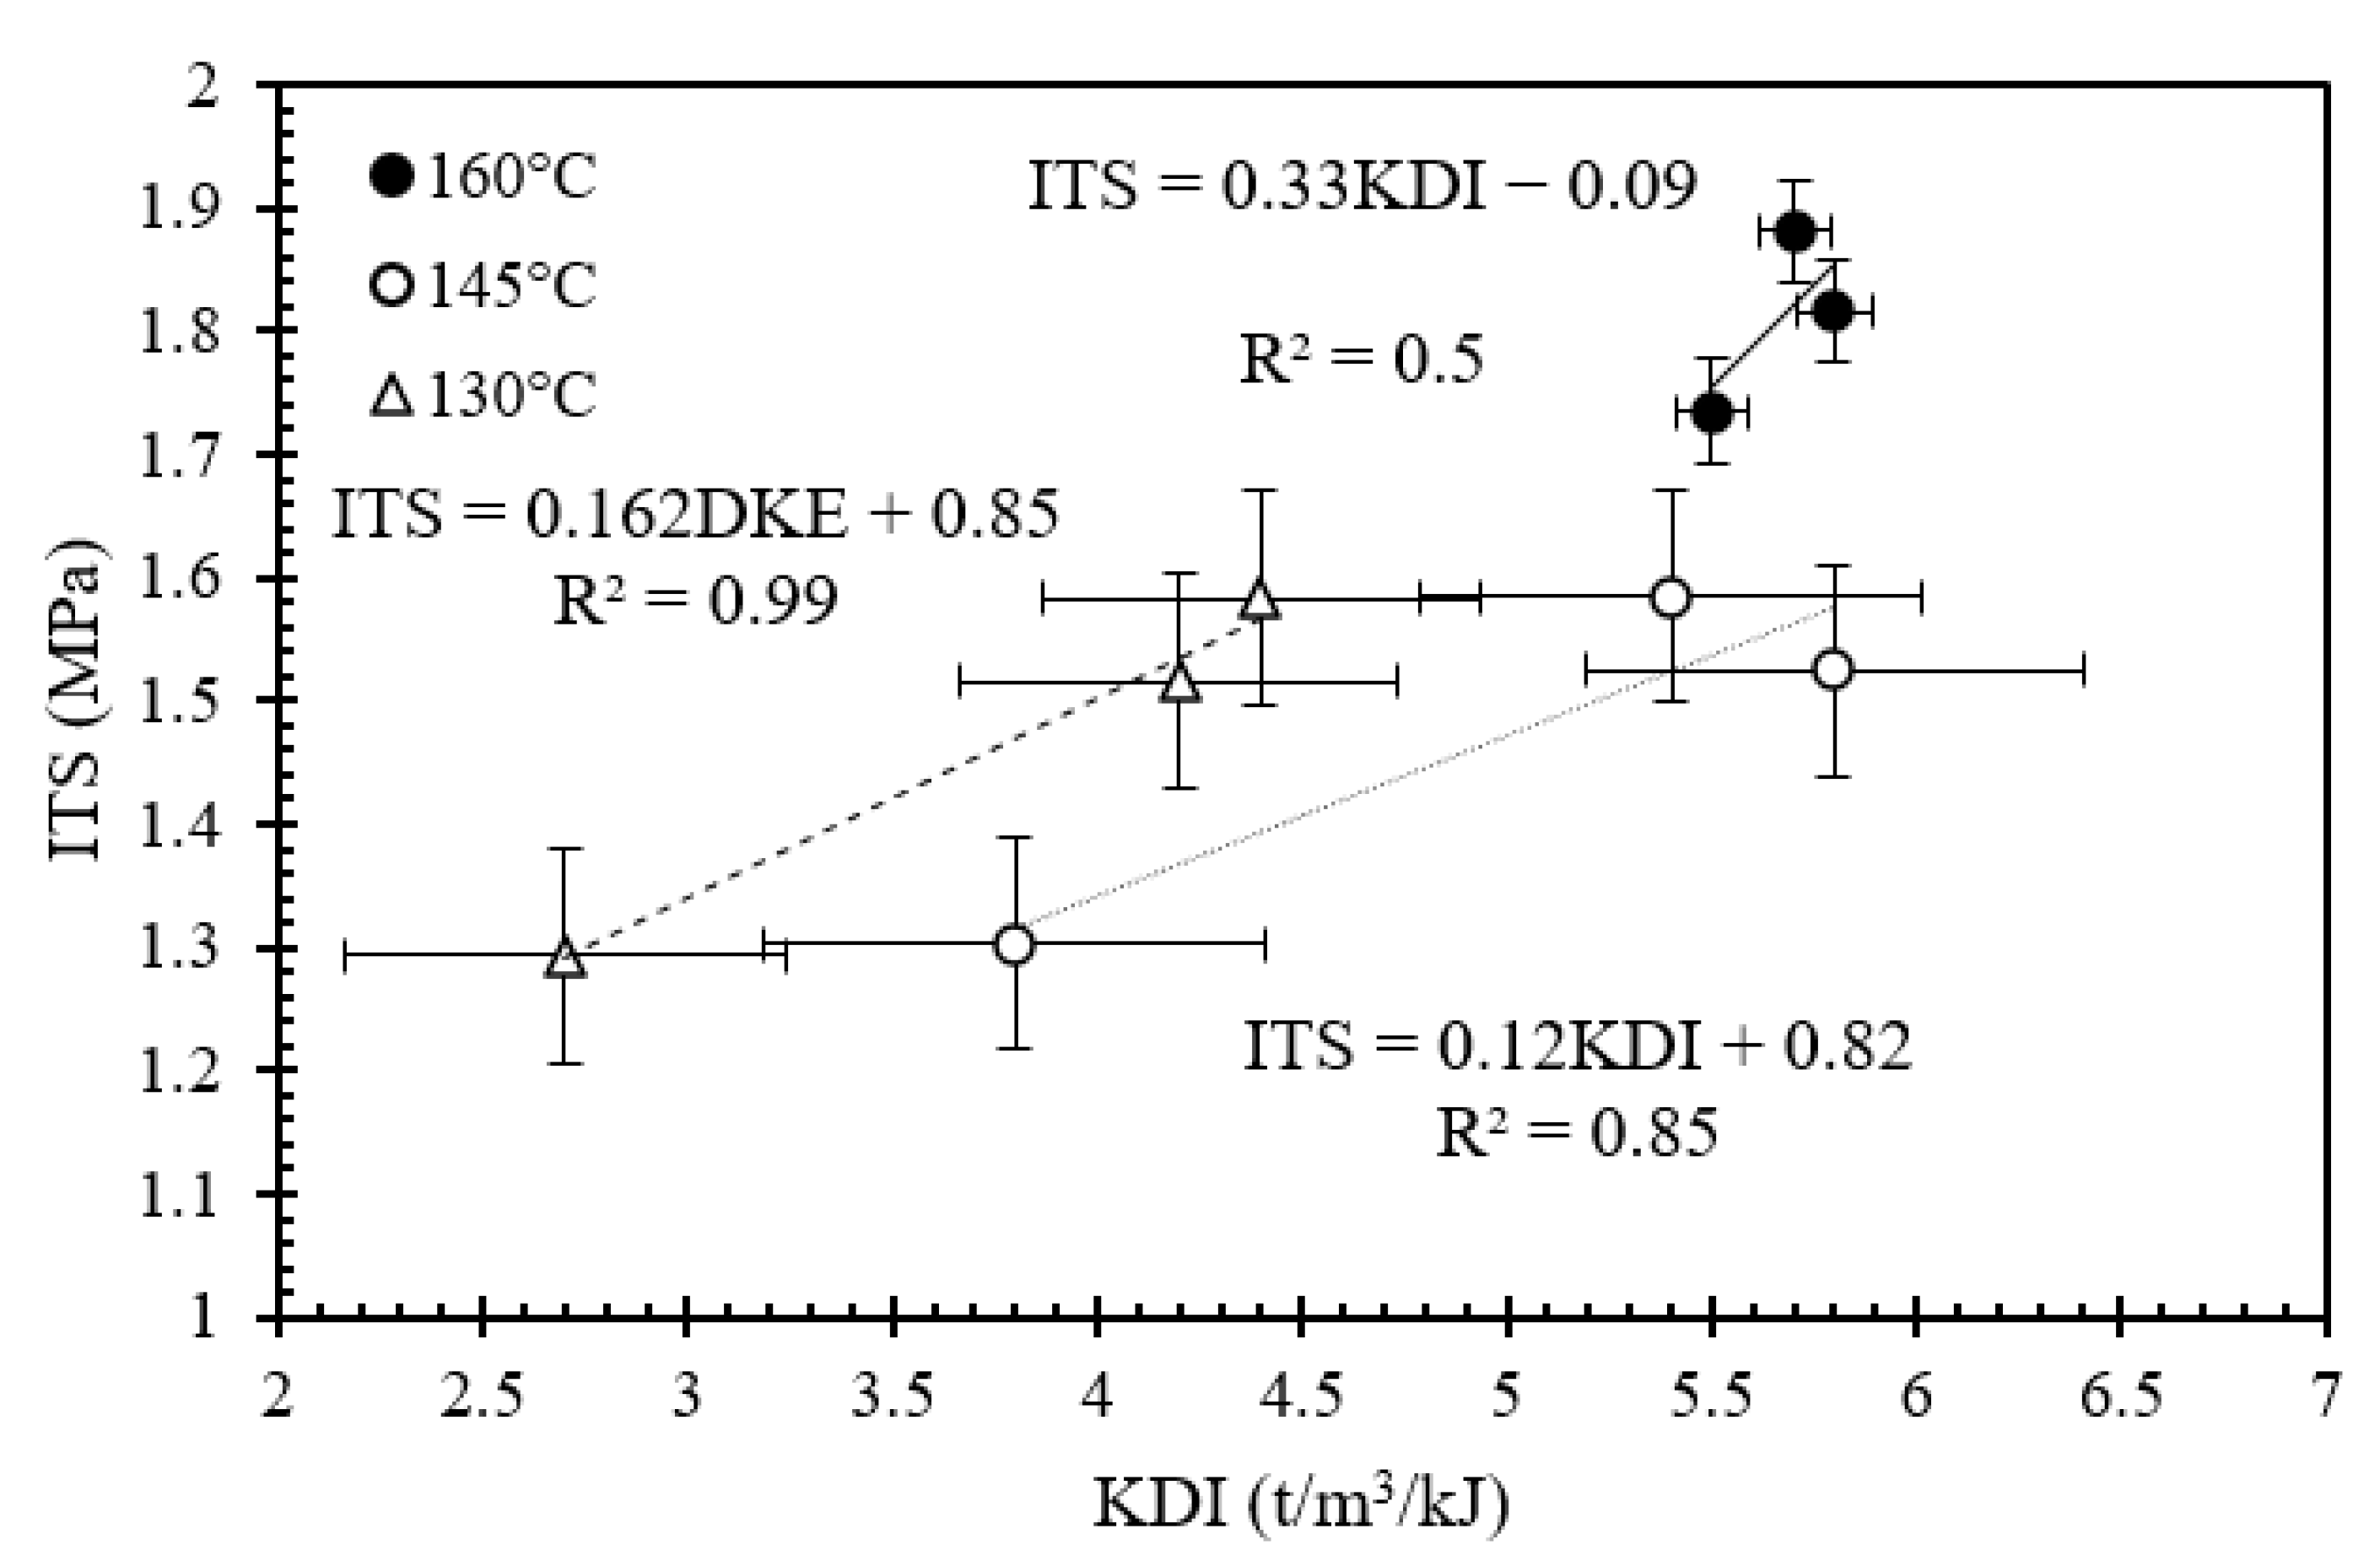
Since the KDI is proposed as an indicator of the mix compaction and workability, the following questions are raised: What is the correlation between the KDI and the engineering properties of a mixture? Which independent variables, such as Sasobit® and mixing temperature, affect this correlation. To address these questions, the correlation between the KDI and the ITS as an engineering property of a mixture is evaluated. Figure 11 shows the correlation between the KDI and the ITS of the mixtures. It can be seen that the ITS generally rises while the KDI increases because a higher KDI means a greater density, which leads to a higher cracking in the mix. A higher densification per unit of compaction energy leads to a higher mechanical stability in terms of the ITS. The higher density due to the effect of Sasobit® and its effect on the ITS can be clearly explained by the KDI.
As shown in Figure 10, the unit increase in KDI, 1 t m 3 kJ , yields a greater ITS at a lower mixing temperature. For example, an increase in 1 t m 3 kJ during compaction efforts results in 0.24 MPa in mixtures produced at 160 °C, while the corresponding values are 0.95 MPa and 1.01 MPa at 130 °C and 145 °C, respectively. Sasobit® decreases the binder viscosity, which results in more densification (Figure 7) and better workability. Note that the Sasobit® content is another variable that improves the KDI at all mixing temperatures. A greater densification, or interlocking, can be achieved via a larger addition of Sasobit®, as shown in Figure 8 (samples mixed at 130 °C were an exception in this study). Sasobit® compensates for the effect of reduced mixing temperatures. In addition, the lower mixing temperature may decrease asphalt aging, which results in a lower ITS. However, a lattice network formed due to the presence of Sasobit® in the binder compensates for the lower stiffness of the binder because of the lower temperature-related production aging.
It should be noted that, although KDI is not an engineering property of the asphalt concrete, the correlation between Sasobit® as a compaction aid, or as a WMA additive, and the KDI can be useful for characterizing the workability of a mixture. Moreover, the correlation between the KDI and the other engineering properties of asphalt concrete, such as moisture sensitivity, dynamic modulus, rutting, and fatigue, can be explored in future research.

4. Conclusions

The following conclusions are drawn in accordance with the engineering properties of the Sasobit® modified mixtures tested for this study:
  • A simple methodology was proposed to measure the workability of mixtures, incorporating various Sasobit® contents, using basic Newtonian mechanics or classic kinematic laws based on the energy conservation theory. The KDI, in accordance with the EVP-based indicator, was defined to characterize the effects of temperature and Sasobit® on the workability of asphalt mixtures. The indicator was applied to assess the densification of the mix per unit of compaction energy. The results of the analyses demonstrated that the KDI varies from 2.20 t m 3 kJ to 5.86 t m 3 kJ , depending on the Sasobit® content and mixing temperature.
  • In addition, the results showed that there is a reverse relationship between the KDI and the CEI, i.e., CEI is equal to 16 times the KDI, in a rough estimation. This ratio may change for various binder types, aggregate types, and gradation. However, the ranking of the mixtures in terms of workability was identical, irrespective of the compaction method.
  • The results demonstrated that the ITS increases proportionally as the KDI increases, due to the higher density and interlocking because of the temperature and the addition of Sasobit®.
  • The KDI is an indicator that can link the engineering property of mixtures in terms of ITS and the compaction energy using the Marshall method. This parameter can be utilized as a supplementary indicator to compare the workability of mixtures in the construction phase of pavement without requiring a complex set-up and electricity in a laboratory, which is difficult for worksites located in a remote area, without access to equipment such as gyratory compactor, a computer, and data logger software.

Suggestions for Further Research

It is recommended to evaluate the effects of various WMA types, aggregate type/gradation, binder type, filler type, and waste materials on the KDI. It is also recommended to evaluate the correlation between the KDI and other workability parameters using various mixture types.

Author Contributions

Conceptualization, Methodology, formal analysis, writing and review: A.J., G.W. and M.R.M.H. All authors have read and agreed to the published version of the manuscript.

Funding

This research received no external funding.

Conflicts of Interest

The authors declare that they have no conflict of interest.

References

  1. Mo, L.; Li, X.; Fang, X.; Huurman, M.; Wu, S. Laboratory investigation of compaction characteristics and performance of warm mix asphalt containing chemical additives. Constr. Build. Mater. 2012, 37, 239–247. [Google Scholar] [CrossRef]
  2. Li, X.; Wang, H.; Zhang, C.; Diab, A.; You, Z. Characteristics of a surfactant produced warm mix asphalt binder and workability of the mixture. J. Test. Eval. 2016, 44, 2219–2230. [Google Scholar] [CrossRef]
  3. Jamshidi, A.; Hamzah, M.O.; You, Z. Performance of warm mix asphalt containing Sasobit®: State-of-the-art. Constr. Build. Mater. 2013, 38, 530–553. [Google Scholar] [CrossRef]
  4. Yu, J.; Williams, R.C.; Buss, A.F. Laboratory evaluation of warm mix asphalt influence on theoretical maximum specific gravity. J. Test. Eval. 2012, 40, 669–676. [Google Scholar] [CrossRef]
  5. Hurley, G.C.; Prowell, B.D. Evaluation of Sasobit for Use in Warm Mix Asphalt; NCAT Report, 5(6); Auburn University: Auburn, AL, USA, 2005. [Google Scholar]
  6. Hurley, G.C.; Prowell, B.D. Evaluation of Evotherm for Use in Warm Mix Asphalt; NCAT Report, 2; Auburn University: Auburn, AL, USA, 2006. [Google Scholar]
  7. Hesami, E.; Birgisson, B.; Kringos, N. Effect of mixing sequence on the workability and performance of asphalt mixtures. Road Mater. Pavement Des. 2015, 16 (Suppl. S2), 197–213. [Google Scholar] [CrossRef]
  8. Asphalt Institute. Superpave Mix Design, 3rd ed.; Superpave Series No. 2 (SP-2); Asphalt Institute: Lexington, KY, USA, 2000. [Google Scholar]
  9. Yildirim, Y.; Ideker, J.; Hazlett, D. Evaluation of viscosity values for mixing and compaction temperatures. J. Mater. Civ. Eng. 2006, 18, 545–553. [Google Scholar] [CrossRef]
  10. Chen, F.; Jelagin, D.; Partl, M.N. Experimental and numerical analysis of asphalt flow in a slump test. Road Mater. Pavement Des. 2019, 20 (Suppl. 1), S446–S461. [Google Scholar] [CrossRef]
  11. Golchin, B. Effects of Rediset Additive on the Engineering Properties of Warm Asphalt Binders and Mixtures. Ph.D. Thesis, Univesiti Sains Malaysia, Penang, Malaysia, 2015. [Google Scholar]
  12. Jamshidi, A.; Golchin, B.; Hamzah, M.O.; Turner, P. Selection of type of warm mix asphalt additive based on the rheological properties of asphalt binders. J. Clean. Prod. 2015, 100, 89–106. [Google Scholar] [CrossRef]
  13. Bennert, T.; Reinke, G.; Mogawer, W.; Mooney, K. Assessment of workability and compactability of warm-mix asphalt. Transp. Res. Rec. 2010, 2180, 36–47. [Google Scholar] [CrossRef]
  14. Wang, C.; Hao, P.; Ruan, F.; Zhang, X.; Adhikari, S. Determination of the production temperature of warm mix asphalt by workability test. Constr. Build. Mater. 2013, 48, 1165–1170. [Google Scholar] [CrossRef]
  15. Mogawer, W.S.; Austerman, A.J. Apparatus and Methods for Testing Asphalt Mix Workability. U.S. Patent Application No. 12/503,630, 21 January 2010. [Google Scholar]
  16. Gudimettla, J.M.; Cooley, L.A., Jr.; Brown, E.R. Workability of Hot Mix Asphalt, National Center for Asphalts Technology; NCAT Report 03-03; Auburn University: Auburn, AL, USA, 2003. [Google Scholar]
  17. Gudimettla, J.M.; Cooley, L.A., Jr.; Brown, E.R. Workability of hot-mix asphalt. Transp. Res. Rec. 2004, 1891, 229–237. [Google Scholar] [CrossRef] [Green Version]
  18. Marvillet, J.; Bougault, P. Workability of bituminous mixes—Development of a workability meter. In Proceedings of the Association of Asphalt Paving Technologists Proceedings, Denver, Colorado, 19–21 February 1979; Volume 48. [Google Scholar]
  19. Abdelgalil, S.M.K.; Abdul Rahman, M.; Arshad, A.K. Development of workability measuring device for asphalt mixture using electronic transducer and temperature regulator. J. Basic Appl. Sci. Res. 2011, 1, 721–726. [Google Scholar]
  20. Yu, H.; Leng, Z.; Dong, Z.; Tan, Z.; Guo, F.; Yan, J. Workability and mechanical property characterization of asphalt rubber mixtures modified with various warm mix asphalt additives. Constr. Build. Mater. 2018, 175, 392–401. [Google Scholar] [CrossRef]
  21. Liu, Y.; Wang, H.; Tighe, S.L.; Zhao, G.; You, Z. Effects of preheating conditions on performance and workability of hot in-place recycled asphalt mixtures. Constr. Build. Mater. 2019, 226, 288–298. [Google Scholar] [CrossRef]
  22. Cabrera, J.G.; Dixon, J.R. Performance and Durability of Bituminous Material. In Proceedings of the Symposium, University of Leeds, Leeds, UK, 6–9 September 1994. [Google Scholar]
  23. Aburawi, B. Effects of Reduction in Construction Temperature on Workability of Warm Mix Asphalt Incorporating Rh-wma Additive. Ph.D. Thesis, Elmergib University, Al Khums, Lybia, 2018. [Google Scholar]
  24. European Standard BS EN 12697-10:2017; Bituminous Mixtures. Test Methods. Compactability. CEN-CENELEC Management Centre: Brussels, Belgium, 2017.
  25. Mahmoud, A.F.F.; Bahia, H. Using Gyratory Compactor to Measure Mechanical Stability of Asphalt Mixtures; Wisconsin Highway Research Program: Madison, WI, USA, 2004. [Google Scholar]
  26. JKR/SPJ/2008-S4; Standard Specifications for Road Works, Section 4, Flexible Pavements. Public Work Department (PWD): Kuala Lumpur, Malaysia, 2008.
  27. Button, J.W.; Estakhri, C.; Wimsat, A. A Synthesis of Warm-Mix Asphalt. USA; Texas Transportation Institute and Texas A&M University System: Bryan, TX, USA, 2007. [Google Scholar]
  28. ASTM D204; Standard Test Method for Theoretical Maximum Specific Gravity and Density of Asphalt Mixtures. ASTM: West Conshohocken, PA, USA, 2006.
  29. ASTM D2726; Standard Test Method for Bulk Specific Gravity and Density of Non-Absorptive Compacted Asphalt Mixtures. ASTM: West Conshohocken, PA, USA, 2006.
  30. ASTM D6931-17; Standard Test Method for Indirect Tensile (IDT) Strength of Asphalt Mixtures. ASTM: West Conshohocken, PA, USA, 2006.
  31. Ji, J.; Xu, S. Study on the impact of Sasobit on asphalt's properties and micro-structure. In Pavements and Materials: Testing and Modeling in Multiple Length Scales; American Society of Civil Engineers: West Conshohocken, PA, USA, 2010; pp. 182–194. [Google Scholar]
  32. Hurley, G.C. Evaluation of New Technologies for Use in Warm Mix Asphalt. Master’s Thesis, University of Auburn, Auburn, AL, USA, 2006. [Google Scholar]
  33. Akisetty, C.K.; Lee, S.J.; Amirkhanian, S.N. High temperature properties of rubberized binders containing warm asphalt additives. Constr. Build. Mater. 2009, 23, 565–573. [Google Scholar] [CrossRef]
  34. Kristjonesdottir, O. Warm Mix Asphalt for Cold Weather Paving. Master’s Thesis, University of Washington, Washington, MD, USA, 2006. [Google Scholar]
  35. Diefenderfer, S.; McGhee, K.; Donaldson, B.M. Installation of Warm Mix Asphalt Projects in Virginia; Research Report No: FHWA/VTRC 07-R25; Transport Research Council: Knoxville, TN, USA, 2007. [Google Scholar]
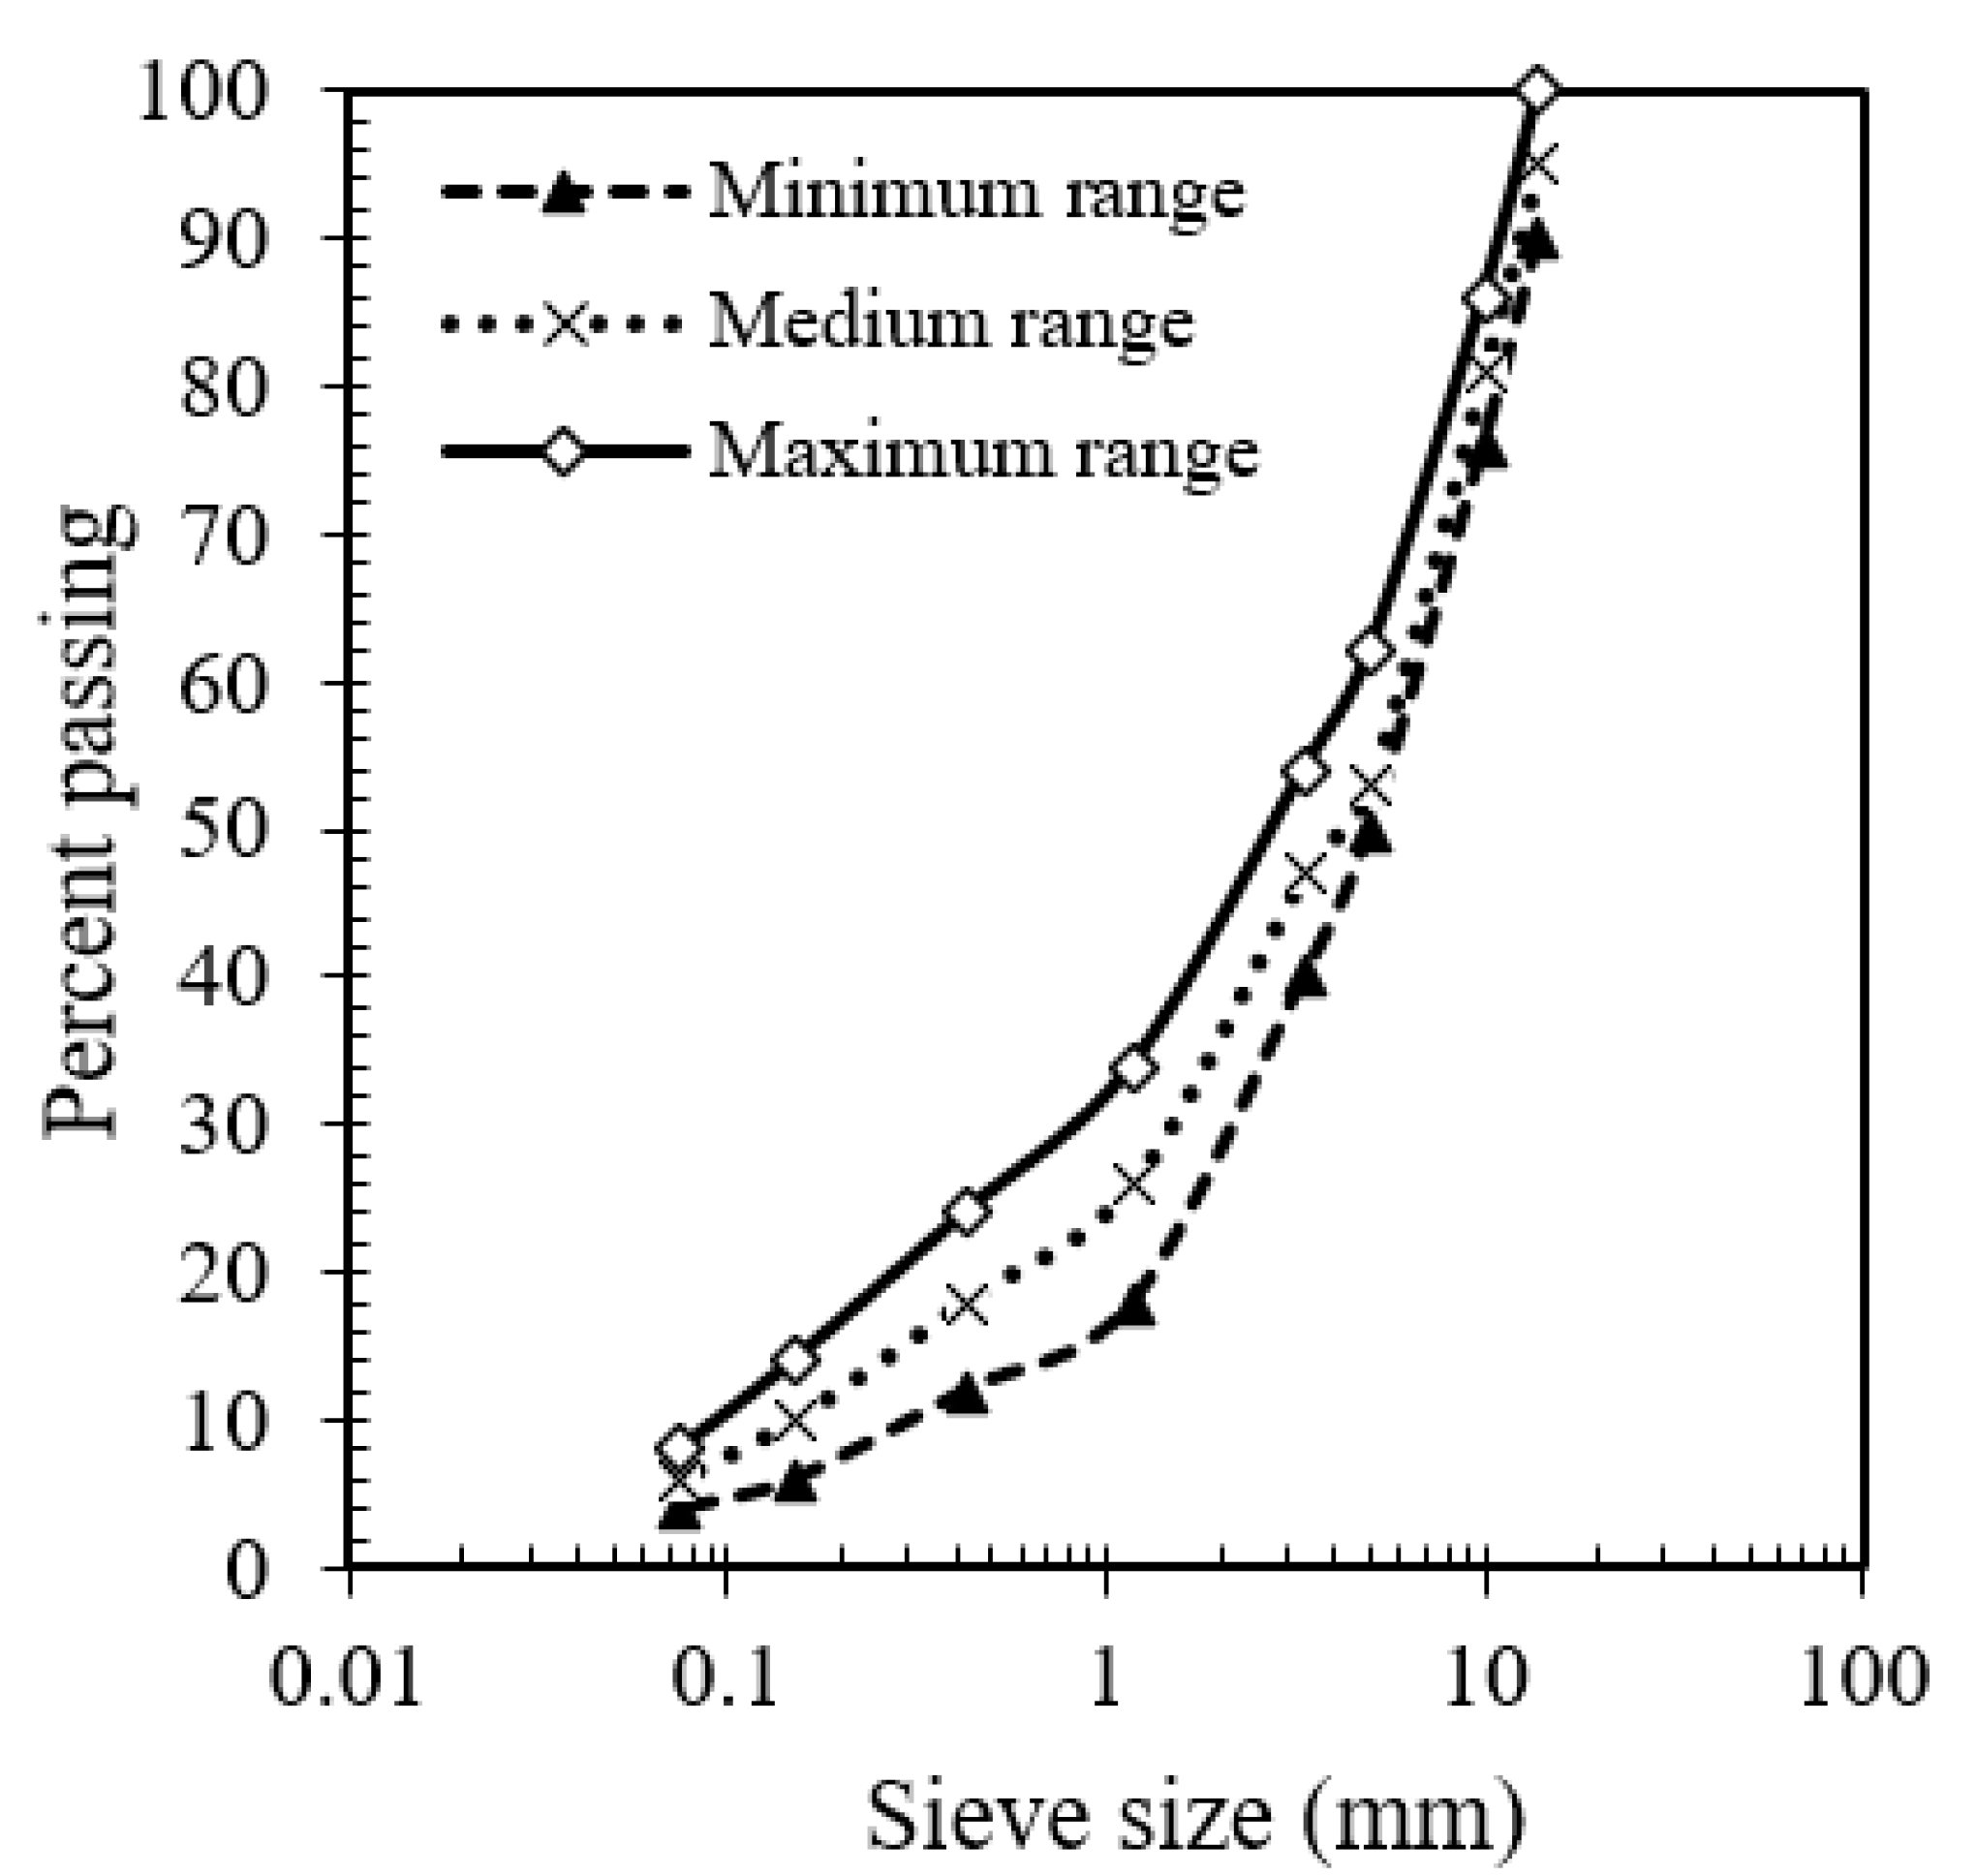
Figure 1. Aggregate gradation for asphalt mixture type.
Sustainability 14 06550 g001
Figure 2. Schematic of the Marshall compaction setup.
Sustainability 14 06550 g002
Figure 3. Different phases of compaction in the Marshall procedure.
Sustainability 14 06550 g003
Figure 4. Concepts of KDI and CEI.
Sustainability 14 06550 g004
Figure 5. Series of samples prepared by means of a Marshal hammer to calculate KDI. Note: h1 > h2 > h3 > h4 > h5.
Sustainability 14 06550 g005
Figure 6. Flowchart to illustrate the experimental design process.
Sustainability 14 06550 g006
Figure 7. Compaction energy and density at different mixing temperatures.
Sustainability 14 06550 g007
Figure 8. Compaction energy and air void at different mixing temperatures.
Sustainability 14 06550 g008
Figure 9. KDI of the mixtures.
Sustainability 14 06550 g009aSustainability 14 06550 g009b
Figure 10. Comparison between CEI and KDI.
Sustainability 14 06550 g010
Figure 11. Correlation between ITS and KDI.
Sustainability 14 06550 g011
Table 1. Basic and rheological properties of PG 64-22 binder.
Rheological PropertyAging StateUnitValue
Penetration@ 25 °Cunaged(0.1 mm)88
Softening point°C46
Viscosity @ 135 °CmPa s340
G*/sin δ @ 64 °CkPa1.14
Viscosity @ 135 °CShort-term agedmPa s580
G*/sin δ @ 64 °CkPa2.68
G*sin δ @ 25 °CLong-term agedMPa2.68
m-value @ −18 °C-1.50
Stiffness @ −18 °CMPa277
Table 2. Mixture specimens produced using the Marshall and gyratory method.
Mixture DesignationConstruction TechnologySasobit (%)Construction Temperature (°C)Compaction Method
MixingCompaction
H160S0HMA0160150Marshall
H160S22
H160S44
W145S0WMA0145135
W145S22
W145S44
W130S00130120
W130S22
W130S44
H160S00160150Gyratory
W145S22145135
W145S44
W130S22130120
W130S44
Table 3. Ranking of mixtures according to workability based on KDI.
MixtureRanking KDI   ( t m 3 kJ )
H160S215.85
W145S425.80
H160S435.70
H160S045.50
W145S255.40
W130S264.40
W130S474.20
W145S083.80
W130S092.20
Table 4. Comparison of ranking of mixtures according to workability based on CEI and KDI.
MixtureCEIKDI
RankingValuesRankingValues
W145S416415.80
W145S2263.8025.40
W130S2379.6634.40
W130S4481.3544.20
Publisher’s Note: MDPI stays neutral with regard to jurisdictional claims in published maps and institutional affiliations.