Article

Smart Services in Smart Cities: Insights from Science Mapping Analysis

1
International Political Economy Department (ZMPE), Institute of International Studies (ISM), SGH Warsaw School of Economics, Al. Niepodległości 162, 02-554 Warsaw, Poland
2
Effat College of Business, Effat University, Jeddah 21551, Saudi Arabia
3
Department of Business Science-Management and Innovation Systems (DISA-MIS), University of Salerno, Via Giovanni Paolo II, 132, 84084 Fisciano, Italy
*
Author to whom correspondence should be addressed.
Sustainability 2022, 14(11), 6506; https://doi.org/10.3390/su14116506
Submission received: 14 February 2022 / Revised: 29 April 2022 / Accepted: 24 May 2022 / Published: 26 May 2022
(This article belongs to the Topic Sustainable Smart Cities and Smart Villages)

Abstract

:
Against the backdrop of the expanding debate on smart cities, the objective of this paper is to examine to what extent and to what end the connection between smart services and smart cities has been explored in the literature, and what to make of it. It is argued that smart services, including demand- and innovation-driven service development, constitute an essential part of the broad concept of smart city. Viewed in this way, smart services serve as one of the key levers through which smart cities grow, develop, and build their resilience. By placing the analysis in the broader context of the smart city as smart service system, this paper sheds light on the still underexplored fields of research and suggests how they could be examined. For the purpose of the analysis, the Science Mapping (SciMat) method is employed as it allows to quantify and to visualize research output featured in Scopus and Web of Science (WoS), thus aiding the analysis. The added value of this paper is two-fold, i.e., (i) the SciMat analysis identifies the key dimensions of the nascent smart services in smart cities debate, and consequently, (ii) allows for suggesting topics that should be further investigated to detect the drivers for cities’ growth, resilience, and sustainability.

1. Introduction

Research on smart cities has turned into one of the most vibrant fields of research today [1,2], engaging scholars from several disciplines, including computer science, urban studies and architecture, geography, and social science. For this reason alone, several—to a great extent overlapping—definitions of smart cities exist in the literature. Interestingly, these are echoed in the emerging regulatory frameworks [3,4,5]. Accordingly, a smart city may be defined as “a place where the traditional networks and services are made more efficient through the use of digital and telecommunication technologies, for the benefit of its inhabitants and businesses” [3]. In addition, the definition-of-smart-city constituent of the ISO family of standards related to smart cities places emphasis not only on the uses of “data information and modern technologies to deliver better services and quality of life to those in the city (residents, businesses, visitors)” [4], but also on the leadership and management practices in place. What brings these two definitions of smart cities together is the engagement with the end-users, i.e., citizens, businesses, and other stakeholders. The temporal dimension is very important in this context. That is, while there is a tendency in the literature to talk about smart cities’ sustainability and resilience, both terms make only an implicit reference to a timeframe. In contrast to that, the ISO standard is very explicit in this regard in that it defines the timeframe as “now and for the foreseeable future” [4].
In brief, while in the debate on smart cities information and communication technology (ICT) is seen as the major enabler, it is the application and utilization of this technology in the form of (smart) services available to all stakeholders that—in line with the definitions outlined above [3,4,5]—bears the greatest promise for smart cities’ sustainable growth and development. A very strong normative component is discernible in the smart cities debate, i.e., the use and application of ICT-based solutions is associated with positive outcomes. Clearly, this is not always the case [6]. What follows is that—in the multilayered context of a smart city—leadership and managerial practices play a fundamental role in ensuring that the benefits of ICT are used for good and are shared evenly [7]. Presumably, smart services may contribute to that. In this view, it is useful to reinterpret smart cities as smart services’ systems. As such, smart cities represent an ecosystem where people, technology, organizations, and information, are synergistically integrated through connection, communication, collection of data, and communication [8]. Smart services play a fundamental role of being the nodal points of this ‘synergistic integration’.
Incidentally, smart services, next to smart cities, represent a yet another example of a widely used, yet largely under-understood concept. For the sake of the analysis presented here, let it be stressed that, first, smart services are pre-emptive, and second, the ICT component is an important aspect of a smart service delivery. That is, smart services are “fundamentally pre-emptive, rather than reactive” [9]. Pre-emptive means that—based on the real-time field data, i.e., evidence, analyzed by a machine—it is possible to offer a service regardless of an incident, failure, etc., that is taking place. As a result, the value of a service increases. Consider the simplest example of GPS navigation in the smart-city context. Based on the real-time evidence of heavy traffic ahead, you will be redirected to optimize the route. While research on smart services flourishes [10,11,12], it tends to be approached from the complementary consumer and marketing perspectives [13]. Surprisingly, the explicit connection between smart service delivery and smart cities, including questions of growth, development, sustainability, and citizens’ wellbeing, has not been addressed sufficiently enough in the literature [8].
Clearly, as the evolution of cities progresses and is matched by corresponding advances in ICT, a new generation of (smart) services apt to meet the evolving demands of all stakeholders is not only necessary, but also possible [14,15,16]. The objective of this paper is tap into this topic by examining the academic debate on smart cities in an attempt to identify to what extent and how the notion of smart services has been dealt with in the smart cities debate and what to make of it. By supporting the analysis using Science Mapping (SciMat) software and corresponding methodology [17], the following research questions are addressed:
Q1: What are the key research themes that emerge at the intersection of smart cities and smart services?
Q2: Which specific (smart) services are discussed in the so-delineated research field?
Q3: How do we operationalize the research findings and make them usable for the smart cities debate?
The reminder of the paper is structured as follows. In the following section, the Science Mapping (SciMat) software and methodology are elaborated. Section 3 offers a detailed insight into the subsequent steps of the analysis undertaken. Discussion and conclusions follow.

2. Materials and Methods

Science mapping analysis is employed in this article to examine the research field related to services in a smart city. Science mapping is a type of bibliometric analysis that uses authors’ keywords and their co-occurrence to graphically represent structural characteristics of a research field. This relatively novel method is usually deployed to analyse large and complex research topics that would be challenging to cover with other scientific methods [18]. It is often used as prerequisite to or supplement of various types of literature reviews, including systematic literature reviews and metanalysis [19]. Science mapping analysis tools and techniques employed in this paper have been recently used to review large research fields such as: consumer financial services [20], gig economy [17], lean supply chain management [21], future of work [22], and big data [23]. This section provides an insight into the place of science mapping analysis in bibliometric studies and discusses the strategic diagram and thematic network analysis as the specific science mapping tools used in this study.

2.1. Science Mapping in Bibliometrics

Bibliometric methods are well-established analytical tools that are an integral part of research evaluation methodology within the scientific and applied fields [24]. Bibliometric methods have been long used for providing quantitative analysis of scientific publications with the use of statistical methods to develop an unbiased insight into a research area [25,26]. The value of bibliometric analysis is frequently associated with the prospect of uncovering emerging trends and collaboration patterns [27], exploring the intellectual structure of a specific research domain [28,29] as well as of retrieving information [30]. In brief, bibliometric analysis is a tool that enables a one-stop overview of a specific research field, identifying underdiscussed topics, and thus identifying new areas of research [19].
Science mapping and performance analysis are recognized as two of the main bibliometric techniques. While a performance analysis examines predominately contributions of research constituents (documents, authors, journal, key words) to a given field, the primary aim of science mapping is the examination of the relationships that emerge among these research constituents (documents, authors, journal, keywords) [19]. Moreover, science mapping is becoming increasingly recognized as a tool to visualize research concepts. To this end, the concepts’ physical proximity and relative locations are used [31]. Therefore, it has been acknowledged that science mapping combined with network analysis (e.g., measures of centrality and density) are instrumental in presenting the intellectual structure of the research field [32].

2.2. Science Mapping with the Use of Keywords’ Co-Occurrence

The structure of knowledge of the research field tends to be explored by means of co-citation and keyword co-occurrence analysis. The co-citation analysis examines the structure of scientific communication by analyzing links between/among citations in the literature. The keyword co-occurrence analysis assesses the knowledge components and a structure of a research field by investigating the links between and among keywords [33]. In particular, the keywords co-occurrence analysis examines the frequency of pairs of any two keywords that occur together in articles in the research field, thus providing an assessment of the interaction strength between keywords in the research field [34].
The SciMat analysis employed in this study relies on the keywords’ co-occurrence analysis. As such, it consists of six stages: data search; data refinement; network creation; map creation; analysis and visualization; performance analysis [35]. In the data search phase, the pool of research articles with a full set of bibliometric data in the analyzed research field is derived from databases such as WoS and Scopus. In the data-refinement stage, several procedures are applied to ensure the high quality of the dataset for further quantitative analysis. In this phase, the articles’ pool is checked for duplications, data gaps, such as publishing years, plural and singular keywords are grouped, abbreviations and full terms are clustered, and British and American spellings of keywords are combined. The remaining four phases of the SciMat analysis are performed with specialized software, e.g., VOSviewer, SciMAT, bibliometrix R-package [36].

2.3. Strategic Diagram and Thematic Network Analysis in Science Mapping

In this study, the SciMAT software is used to perform science mapping analysis based on keywords’ co-occurrence analysis as it enables strategic diagram and thematic network analysis. Based on the results of keywords’ co-occurrence analysis, SciMAT facilitates the visualization of thematic networks of main research themes and allocates them on the strategic diagram based on two metrics: centrality and density. The assessed centrality and density enable allocating the leading themes in the research field, to be allocated to one of four groups: motor, basic, specialized, and emerging/declining themes [37]. Measures of centrality and density are well-established concepts in the bibliometric analyses and in science mapping in particular [38]. While the centrality evaluates the degree of interaction of a thematic network with all other thematic networks (external ties), the density captures the internal strength of the thematic network, that is, the strength of links between the co-occurring keywords that create the thematic network (internal ties) [39]. Therefore, centrality and density can be recognized, respectively, as a measure of theme importance and as a measure of theme development in the research field [40]. Figure 1 offers a strategic diagram example where themes identified in the research field are allocated based on their centrality and density.
Motor themes are characterized by high centrality (strong ties with other themes) and high density (strong ties within their thematic networks), thus are recognized as primary contributors to the research field (e.g., theme A in Figure 1). Basic themes feature crucial but not well-developed contributions to the research field as they have high centrality (strong external ties), meaning they are well-connected with other themes but have low density (weak internal ties), which indicates low internal development of these themes (e.g., theme B in Figure 1). Specialized themes are characterized by high density and low centrality, which indicates well-developed themes that are, however, only sparsely linked with other themes in the research field (e.g., theme C in Figure 1). Themes that are defined by low centrality and low density, having weak internal and external ties, feature emerging or declining themes in the research field (e.g., theme D in Figure 1) [37]. Their allocation to emerging or declining themes requires additional analysis that looks into their performance over the subsections of the analysed timeframe, which is especially important in analysing publications over a long period (e.g., several years). The sphere size may variously represent bibliometric indicators, such as number of articles, number of citations or H-index of articles in the theme or in its entire thematic network [22].
The use of SciMat software for the science mapping analysis of keywords’ co-occurrence provides insight into the structure (thematic network) of each theme plotted in the strategic diagram. Each theme consists of a number of keywords that frequently co-occurred in the research field, and their maximum and minimum number in the thematic network can be predefined in the software as a dimension of the analysis. The most significant keyword in the thematic network occurs in the centre of the graph and the theme is named after this central keyword, as shown on Figure 2 (A is the most significant keyword in thematic network and the name of the motor theme shown in Figure 1).
The thickness of a line connecting the keywords is proportional to the frequency of the co-occurrence of these keywords, measured by the metric selected in the analysis. Thus, the thicker the line the more frequently a pair of keywords appears together in the research field (e.g., the A and N keywords on the diagram co-occurred more frequently than A and K, whereas the N and K did not co-occur more than a predefined minimum number of times, thus there is no connecting line between them). Similarly to the visualization in the strategic diagram, the size of the sphere is proportional to the value of predefined bibliometric indicator, such as number of articles, number of citations or H-index [38].

3. Results

The initial phase of the science mapping analysis, i.e., data search, was performed with the use of the WoS database. The pool of documents was downloaded on November 15, 2021. The following queries were used to identify academic papers about services in the smart-city research field: “smart cit*” AND “service*” (Abstract) or “smart cit*” AND “service*” (Title) or “smart cit*” AND “service*” (Author Keyword). The query returned 4397 records and the scope of the dataset was subsequently limited to 2132 research articles published between 2009 and 2022 by eliminating conference proceedings, book chapters and other types of documents. The reason for limiting the scope of dataset was to ensure high quality of research texts and robustness of the following quantitative analysis, e.g., consistent use of keywords in the analyzed texts.
The bibliometric data of the extracted pool of articles contained 6997 various keywords. The data-refinement procedures performed as a part of second phase of science mapping analysis limited the number of keywords to 6580 in 2132 research articles. This dataset was used as an input for the next stages of science mapping analysis performed with the application of SciMAT software to deliver strategic diagram and thematic networks on the research themes significant for the service and smart-cities-related research field. For the purpose of the analysis, the minimum threshold co-occurrence of keywords was set as three (if keywords co-occurrence less than in three articles, the connecting line is absent) and the size of the thematic network was set between 5 and 12 keywords to ensure the adequate clustering of large datasets.

3.1. Strategic Diagram Results

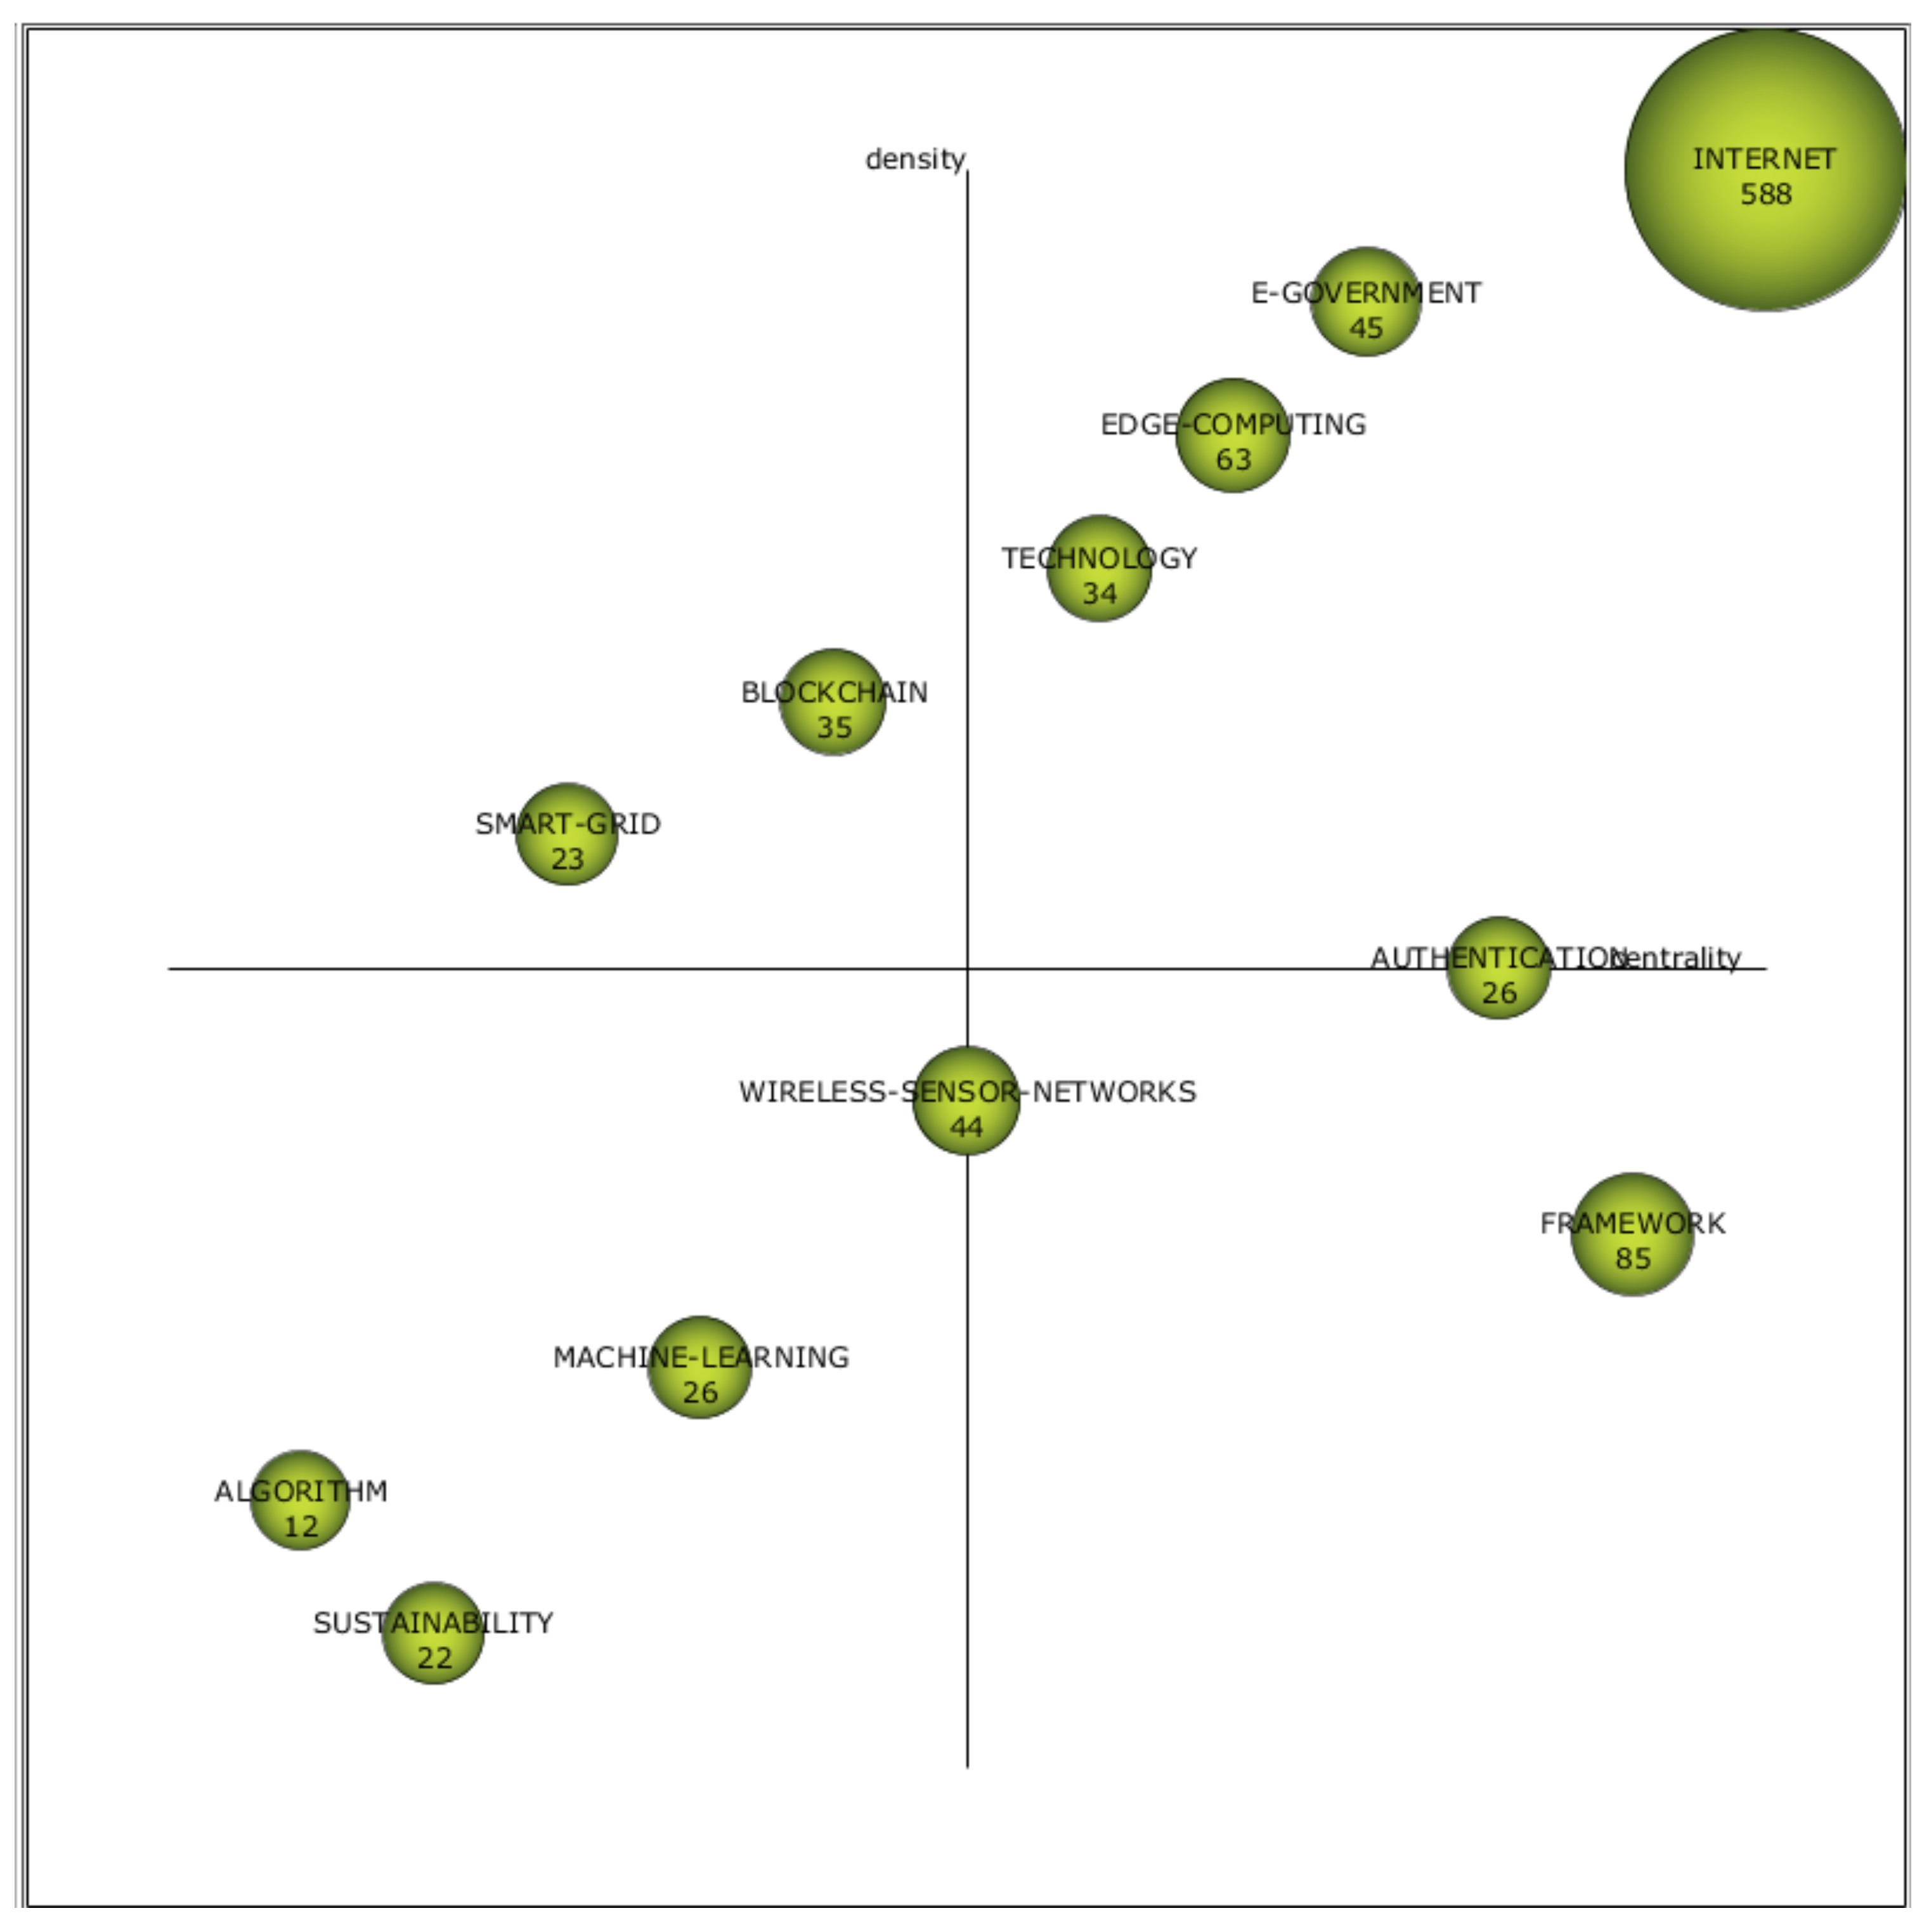
The strategic diagram in science mapping analysis of services in smart cities includes 12 themes. The bibliometric indicator used to determine the size of the sphere is a number of documents where the most significant keyword in a given thematic network was used. This keyword occurs as a label of the sphere and is further referred to as a theme. The value of the indicator is shown inside each sphere. The highest number of keyword occurrences (588) was attributed to Internet. Moreover, this theme turned out to have by far the highest centrality and density, which is indicated by its position in the right upper corner of the strategic diagram, as shown in Figure 3.
Out of twelve themes identified in the strategic diagram, there are four motor themes, which suggests their largest contribution to the research field, and these are: internet, e-government, edge-computing, and technology. There is one basic theme “framework”, which indicates that this theme is well-connected with other themes in the diagram, but internal ties of its thematic network are poorly developed, which is revealed by its relatively low density. There is one theme on the verge between motor and basic themes, “authentication”. There have been two themes identified as specialized themes and these are: “smart-grid” and “blockchain”. Their position in the strategic diagram illustrates that the research on these themes is relatively well-developed, as suggested by their high density, but the research on these themes has been cultivated in relative isolation from other themes in the diagram, which is indicated by their low centrality.
Three themes have been attributed to the lower left part of the strategic diagram which means they are characterized by relatively low centrality and density, and these are: “sustainability”, “algorithm” and “machine-learning”. These themes required more detailed analysis to be univocally attributed to emerging or declining themes due to the relatively long period of the analysis that covered articles published between 2009 and 2022. The theme “wireless-sensor-networks” is located on the border between emerging/declining themes and basic themes, which indicates its higher centrality and strong internal connections between keywords in its thematic network.
The review of the strategic diagram shows that themes directly related to services—such as specific services, types of services or their characteristic features—are not represented on the diagram, which suggests their relative underrepresentation and, consequently, a possible underdevelopment in the research fields. This finding justified the more fine-grained approach, that is, the investigation of thematic networks of themes in the strategic diagram.
The analysis of thematic networks of themes from the strategic diagram shows that 128 are keywords included in the themes’ networks. However, these keywords seldom refer directly to services. The notable exceptions include cloud-computing, medical services, and smart-city services. The positions and relations of service-related keywords in the thematic networks are discussed in the next section.

3.2. Services in Thematic Networks

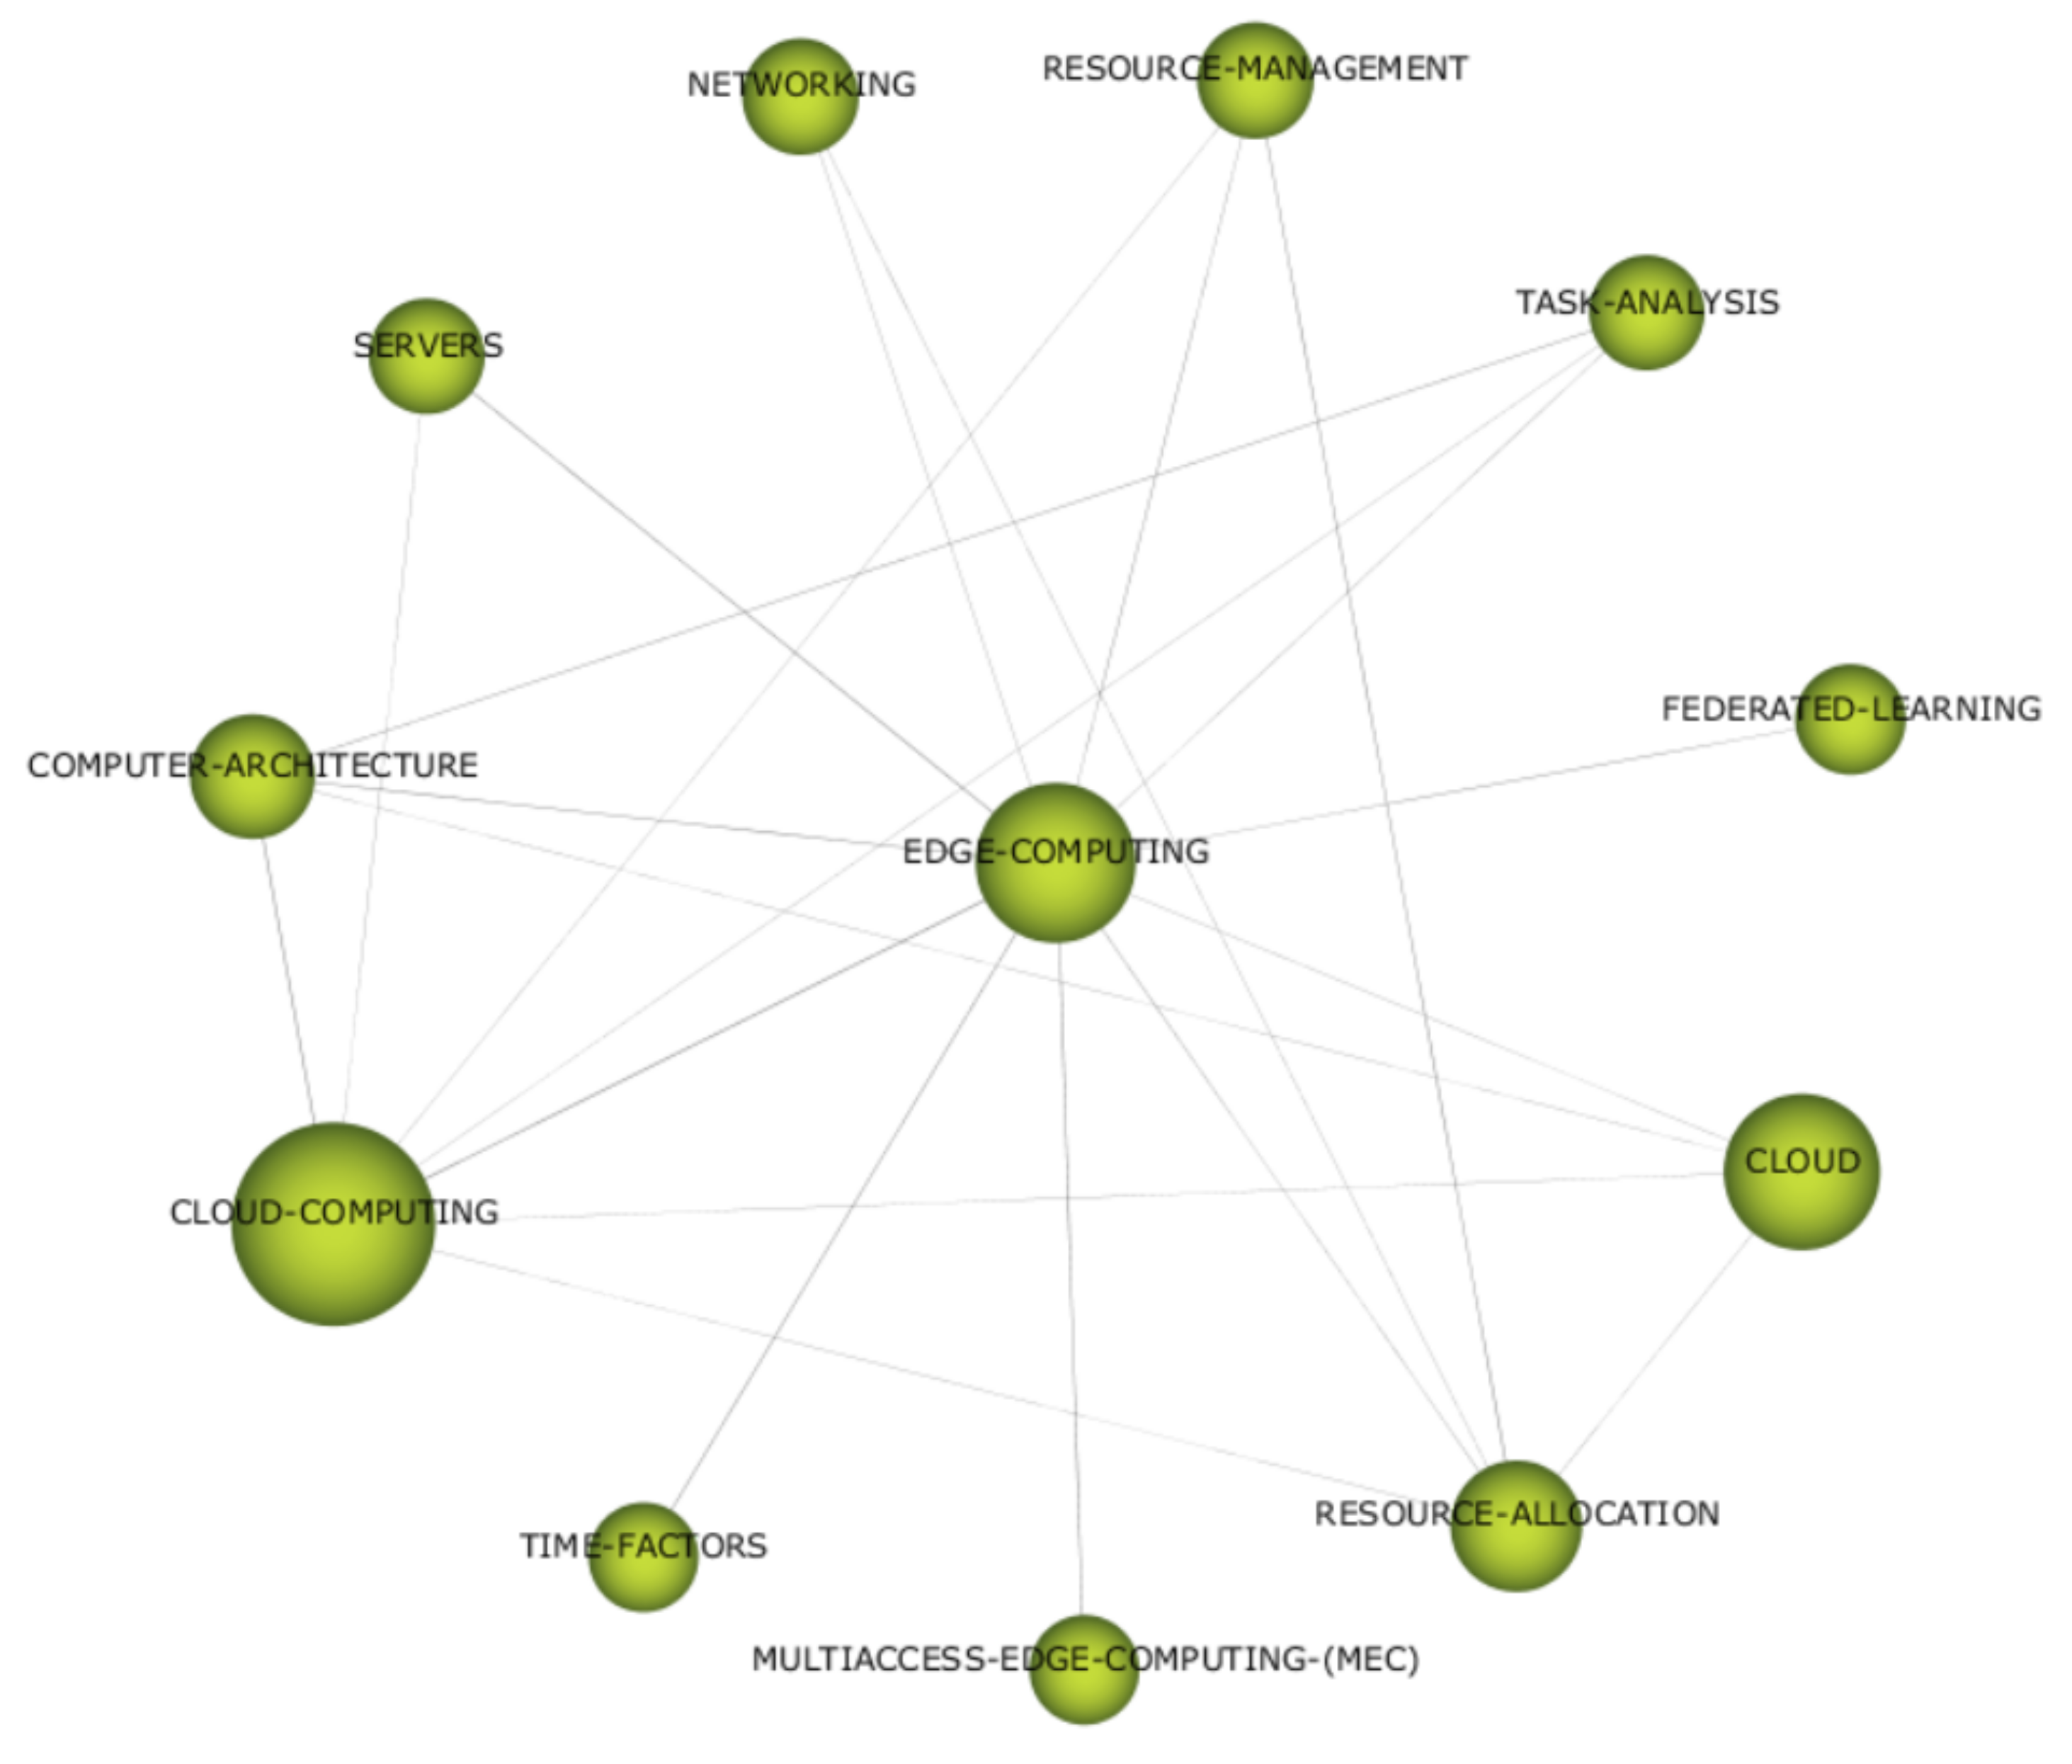
Cloud-computing has been shown as a part of the thematic network of motor theme “edge-computing”, as presented on Figure 4. Apart from research connections with edge-computing, the cloud-computing was jointly discussed in the research field with several other components of the thematic network, which is shown by the connecting lines generated based on keywords’ co-occurrence.
In detail, in the research field of services in smart cities, cloud-computing occurs in association with technical concepts such as: servers, computer-architecture, and the cloud. Moreover, cloud-computing frequently appears as a part of management-orientated discussions which cover resource management, task analysis, and resource allocation, and is indicated by the lines connecting these keywords. Furthermore, it should be recognized that the sizes of spheres in the edge-computing thematic network suggest the prominent position of cloud-computing in the research field in terms of number of documents (higher than edge-computing and the highest in this thematic network). On the other hand, cloud-computing’s moderate linkage with other topics (smaller number of lines than edge-computing) may indicate an area for potential new research directions.
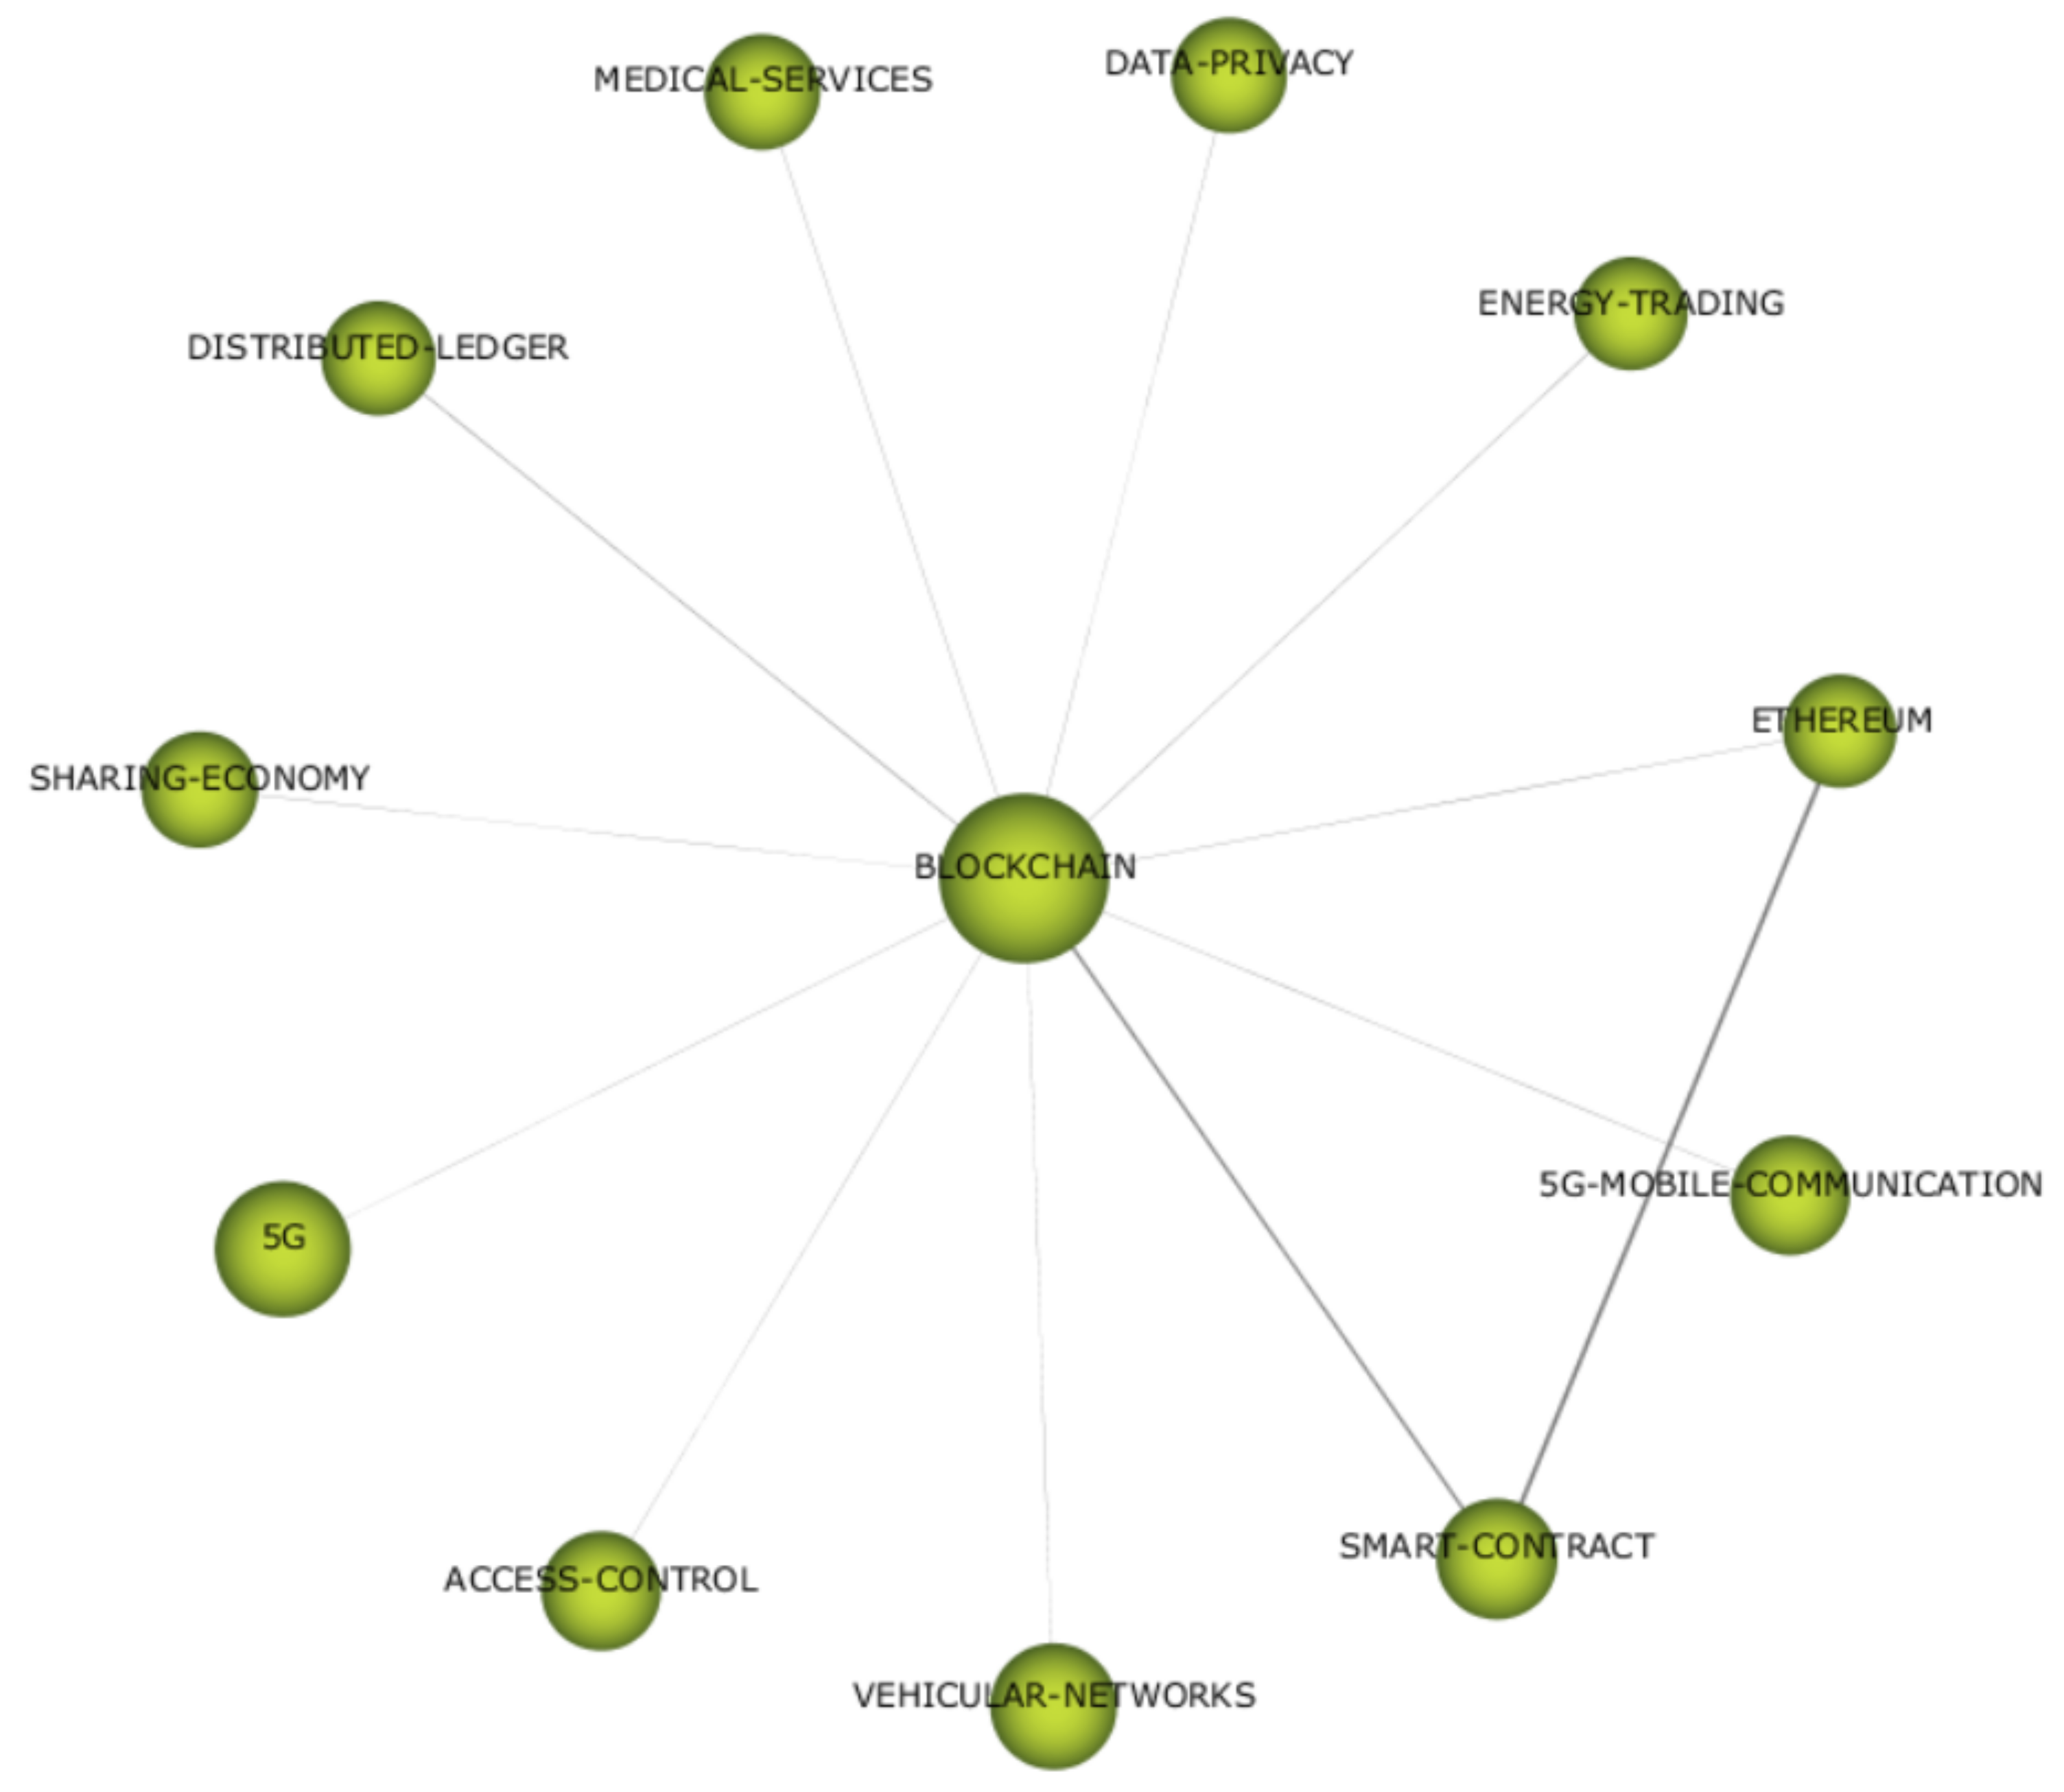
There is one keyword directly related to services in the blockchain-specialized theme, and this is “medical-services”, as shown on Figure 5.
Although blockchain is a specialized theme which indicates its overall low centrality and relatively high density, it can be observed that the connecting lines between keywords are characterized by comparatively low density, which suggests moderately strong ties between its components in the research field. This observation proves to be adequate with reference to Figure 3, where it can be seen that a position of blockchain theme is close to the average value on the density axis of the strategic diagram. This structure of the blockchain theme in the service and smart-city research field explains the low degree of connection between “medical-services” and other components of the thematic network. The research on “medical-services” seems to be undertaken in conjunction with blockchain only. Therefore, their association with other topics in the blockchain theme may be viewed as a research gap, and its potential for future research should be evaluated with the use of a literature review.
Smart-city services are recognized as part of thematic network of “sustainability” in the service and smart-city research filed. Within the strategic diagram, the “sustainability” theme stands out as that with the lowest density of the thematic network (as shown on Figure 3). This is further supported by the analysis of its thematic network (Figure 6 below), which, apart from smart-city services, consists of only seven other loosely connected research components, a number lower than in previously analysed thematic networks.
Smart-city services as a research topic appeared in the discussed research domain in connection with sustainability, similarly to other components of the theme network: “policy”, “indicators”, “communities”, “policy-making”, “government”, “quality-of-life”, “strategy”. Consequently, smart-city services have not been well-connected with other components of the sustainability thematic network. This is indicated by the absence of the connecting lines between smart-city services and other thematic components, which means that, based on keywords’ co-occurrence, there were not more than two articles focused on a pair of topics. Due to the long-time span of published articles included in the analysis (from 2009 to 2022), the attribution of the sustainability theme to emerging or declining themes cannot be confirmed at this level of analysis, as this would require breaking down the body of research into subperiods and examining the themes’ evolution over time. In particular, addressing this limitation involves applying additional science mapping tools, namely temporal or longitudinal analysis using an evolution map and an overlapping-items graph [37], which exceeds the objective of paper. Nevertheless, the development of smart-city-services research with a greater number of papers connecting it to other thematic concepts within the sustainability thematic network would increase the density of the theme and elevate it to a specialized theme in the strategic diagram of services in the field.

4. Discussion

In this section three influential themes related to specific services are elaborated. In this vein, the discussion covers texts that contributed to the research, as indicated by “cloud-computing”, “medical-services” and “smart-city-services” keywords used in the examined research field.

4.1. Cloud-Computing

Cloud-computing has been viewed as instrumental to enabling a data-centric smart-city development [41] and extending the benefits of smart cities to improve quality of life of their citizens [42]. In particular, the cloud-computing and Internet of Things (IoT) convergence is expected to transform availability and quality of services in smart cities [43].
However, it has been shown that for cloud-computing to realize its transformational potential, improvement of capabilities of the devices deployed in cloud computing are essential for enforcing intelligent environments through mobility and geo-localization [44]. Moreover, the data flows generated by interconnected devices create constrains that should be addressed by optimized machined-learning models to improve the service efficiency [45]. Furthermore, the resilience of the underlining ICT infrastructure is viewed as a risk to cloud-computing service delivery in smart cities, but the risk could be mitigated by improved system architecture, automatically recovering services in case of faults [42].
The increased demand for services powered by cloud-computing in smart cities has been recognized as a driver of energy consumption that would result in a surge of greenhouse gases emission. This calls for measures to achieve adequate levels of environmental sustainability [46]. Research attempts to tackle this challenge by developing more efficient cloud-computing algorithms [47], cloud service-selection mechanisms that facilitate reduced energy consumption by cloud servers [48] and more efficient schemes for energy management in cloud data centres [49]. Moreover, optimizing task scheduling in cloud-computing has been identified as key challenge in the improvement of applications’ efficiency, leading to optimization of performance time, carbon emission rate and energy usage in smart cities [50].
Cloud-computing enhances the delivery of services in smart cities; however, its use generates a number of security and privacy risks that can be analyzed with the use of security- and privacy-issue-related taxonomy of smart cities [51]. As indicated by the research, these risks could be addressed en masse at nascent stages of development of cloud-computing enabled smart city applications by utilizing the framework which encompasses privacy-preserved stakeholder analysis, security requirement modelling and validation, and secure cloud assistance [52]. However, other research points out other specific risks areas related to application of cloud-computing in service delivery in smart cities, and calls for the construction of cross-platform secure communication schemes to enhance services related to industrial IoT platforms [53]. Moreover, a variety of other highly technical risk-mitigation approaches have been developed to support cloud-computing usage in smart city ecosystems, which covers general use procedures, e.g., to enhance auditing protocols to check the storage correctness and data integrity [54]; specific use technologies, e.g., to manage attribute-based access control systems to prevent corrupting intelligent transportation system in smart cities [55].

4.2. Medical Services

Medical services have been identified as a notable area of study in the research intersection of smart services and smart cities. Medical services applied to smart city environments are viewed as a potent enabler of disease prevention and treatment monitoring that can improve the citizens’ quality of life [56]. However, data privacy and security related to the provision of these services have been a mounting concern due to susceptibility to cybercrime and data mismanagement [57]. Thus, researchers and practitioners have been searching for novel ways to leverage benefits of medical services in smart cities by applying innovative tools and procedures such as Federated Learning (FL), that enables artificial-intelligence-based medical services to be improved by limiting threats of sensitive data malpractice [58].
The research shows that many medical services in the area of disease prevention hinge upon the deployment of wearable sensor-rich devices that allow for physical activity recognition, detecting unhealthy behaviors and medical risks [59]. However, data analysis applied to ensure benefits of these disease-prevention systems is not easy [60]. It has been shown that efficiency gains and quality advancement in medical services in a smart city can be further extended with the application of Federated Learning (FL) [58]. Its application allows for improved digital medical service provision by enhancing artificial intelligence learning quality and improved privacy of sensitive patient data, while supporting the cooperation of healthcare providers, medical institutions and users of medical services [61].
The research into medical services in the smart city domain discusses the architecture of these services, including challenges related to access control [62] and service prioritizing for emergency reasons [56]. Blockchain-based frameworks to safeguard patients’ personal information and insurance policy have been indicated as possible solutions to accurate and effective methods of patient identity identification prior to the provision of service [57]. Furthermore, virtual decentralized service platforms have been shown as adequate service enablers for healthcare remote monitoring purposes, which requires substantial service reliability under various circumstances and broad availability in a smart city environment [63].

4.3. Smart-City Services

The smart-city-services keyword has been shown in science mapping analysis as a part of the sustainability thematic network. It has turned out to be one of a few keywords directly related to services in the research field encompassing smart services and smart cities, thus related research texts are included in the discussion.
The research on smart-city services shows that such services demand significant interaction and collaboration between the users and the service providers [64], and that users express concerns regarding the utility, safety, accessibility and efficiency of smart city services [65]. Users’ satisfaction with smart city services has been shown to depend on perceived characteristics of the service delivery channel, such as: benefits, ease of use, complexity, and dependency. Moreover, the users’ personal characteristics, namely user innovativeness and control-seeking behavior, have also been shown as crucial in determining their satisfaction and intention to continue using the smart-city service-delivery channels [64].
Research on developing smart-city services has indicated the crucial role of active involvement of users in the successful designing of sustainable smart-city services, early-stage service prototyping and users’ evaluation at every step of the service development and deployment process [66]. Other research points out that smart-city services require effective integration of technological and social innovation. This confirms the importance of early stakeholder engagement, including establishing the baselines against which stakeholders’ perceptions of success can be assessed [67].
Early research attempts regarding smart-city services advocated that such services need to be aligned with an effective incentive system to reinforce motivation and participation of the users [68]. Further attempts to empirically verify the perception of smart city services found that respondents acknowledged their importance and usefulness and shared that smart city services were useful to their existence, relatedness, and growth needs [69]. However, their views differ between specific service areas, as they expressed relatively higher preferences for services where tangible benefits could be achieved, such as smart energy, smart transport, or smart safety, than in more subjective domains such as smart living [69].
The research attempts to operationalize the link between smart-city services and sustainability by developing an index to assess smart-city characteristics from the sustainability perspective, with the emphasize on the quality of citizens’ lives, efficient management of urban utilities and services’ functions [70]. The progress of the research on conceptualizing smart-city services has led to development of more fine-grained typologies, e.g., those based on data-protection dimensions, enabling the clustering of services based on data-protection needs. This encompasses the evaluation of various related criteria such as the number of data streams, data ownership, number of use cases, privacy invasiveness, and ease of scrutinizing the service [71].

5. Conclusions

The objective of this paper was to review the scope of research on services in the smart-city research field. Recognizing the recent proliferation of the smart-city concept, rapid development of the scientific debate and increase in the number of research papers, science mapping was employed as a research method to identify the place of services in this research field. The findings suggest that the research field of services in a smart city is dominated by the technology-orientated debate, implied by the prevalence of technology-related research themes such as: internet, edge-computing, technology, blockchain, smart grid, machine-learning, algorithm, wireless sensor networks, and authentication. The remaining significant areas of studies in the researched field covered three additional themes identified in the strategic diagram analysis: e-governance, sustainability and framework. While the e-governance research theme can be easily associated with the leading technology-focused research axis, sustainability seems to remain a separate research line, which discusses envisaged benefits of services in the smart-city domain. The framework as a significant research theme stands out, and seems to demonstrate the search for research structure in this novel and swiftly advancing line of research.
Against the backdrop of the research themes identified by the SciMat analysis employed in this research, the scarcity of research focused on services appears conspicuous. Within the research field of services in smart cities, the findings of the analysis revealed only three notable exceptions, i.e., cloud-computing, medical services, and smart-city services. The absence of themes directly related to the service sector suggests that more research is needed in the—as-yet emerging—field of ‘smart services in smart cities research’. Indeed, the findings of the analysis performed and elaborated on this paper suggest that several research avenues remain to be explored at the interface between smart cities and smart services.
The classification of the different topics that connect smart-city and smart-services research can help identify the key issues that need to be explored to shed light on the strategic factors that can improve urban services effectiveness. The themes identified in the analysis (edge-computing, blockchain, sustainability) and the thematic components of the three networks show that smart cities can be reread as service systems in which technology, interactions and human components should be harmonized to balance social development, economic growth and environmental safeguarding [72].
Hence, from a theoretical standpoint, this analysis can provide future research with useful suggestions on the topics to be further analyzed to explore the key levers for the enhancement of service quality in smart cities, and for the co-development of sustainability through citizens’ engagement. It can be hypothesized that the dynamic combination of technology, interactions and resources can give birth to the co-delivery of services and to the co-creation of innovation and growth for the city through the active participation of citizens in decision-making [8,73]. For this reason, the emergence of sustainability in smart cities can be defined as a complex process through which innovation is co-created by the different stakeholder groups across multi-levelled contexts of relationships, by enveloping economic, technological, social and cultural dimensions [1]. Moreover, the study can enhance managers’ understanding of the strategies to manage smart cities’ infrastructure, to increase actors’ engagement, strengthen resources and to use technologies properly by offering useful insights for the pursuit of sustainable innovation.
The limitation of this research is that not all publications, many of which may have had a substantial value in context of this research, have been included in the SciMat analysis performed for the purpose of this study. That is, not all academic papers are indexed in WoS, a limitation (and its implications) highlighted in prior research [29]. In a similar manner, the SciMat analysis is limited to publications in English. Accordingly, it is feasible that a number of contributions to the debate in languages other than English have been omitted in the analysis.
The novelty of this research can be derived from the following. First, the analysis presented in this paper adds to the growing body of literature that seeks to validate the relevance of new research methods. Here, the case for the SciMat analysis is made. Second, the findings of this paper reveal that while research on services and smart cities proliferates, more frequently than not, these two debates develop only in parallel. On the rare occasions that the debates overlap, third, it occurs in contexts heavily influenced by considerations very closely related to information and communication technology (ICT). What follows, fourth, is that relatively little has been written about the economic and managerial aspects of the provision of smart services in smart cities. This suggests, fifth, that substantial fields remain open for insights from economics and managerial studies. In this sense, this paper makes a case that these research avenues be explored.

Author Contributions

Conceptualization, R.M., A.V., O.T., M.G.; methodology, R.M., A.V., O.T., M.G.; software, R.M.; validation, R.M., A.V., O.T., M.G.; formal analysis, R.M., A.V., O.T., M.G.; investigation, R.M., A.V., O.T., M.G.; resources, R.M., A.V., O.T., M.G.; data curation, R.M., A.V., O.T., M.G.; writing—original draft preparation, R.M., A.V., O.T., M.G.; writing—review and editing, R.M., A.V., O.T., M.G.; visualization, R.M.; supervision, A.V.; project administration, A.V.; funding acquisition, AV. All authors have read and agreed to the published version of the manuscript.

Funding

Research presented in this paper constitutes a part of the implementation of the following grant: ‘Smart cities: Modelling, Indexing and Querying Smart City Competitiveness’, National Science Centre (NCN), Poland, grant OPUS 20, Nr DEC-2020/39/B/HS4/00579.

Institutional Review Board Statement

Not applicable.

Informed Consent Statement

Not applicable.

Data Availability Statement

The full data set obtained for the analysis presented in this paper is available upon request.

Acknowledgments

The authors would like to thank the participants of the International Seminar titled ‘Smart cities & the global digital transformation: issues, caveats, and the way forward’, held at the SGH Warsaw School of Economics, on 11 January 2022, for their useful comments and feedback on the earlier version of this paper. Usual disclaimers apply.

Conflicts of Interest

The authors declare no conflict of interest.

References

  1. Visvizi, A.; Lytras, M. Rescaling and refocusing smart cities research: From mega cities to smart villages. J. Sci. Technol. Policy Manag. 2018, 9, 134–145. [Google Scholar] [CrossRef]
  2. Visvizi, A.; Perez del Hoyo, R. (Eds.) Smart Cities and the UN SDGs; Elsevier: Amsterdam, The Netherlands, 2021; ISBN 9780323851510. Available online: https://www.elsevier.com/books/smart-cities-and-the-un-sdgs/visvizi/978-0-323-85151-0 (accessed on 13 February 2022).
  3. European Commission. Digital Agenda for Europe: Rebooting Europe’s Economy; Directorate-General for Communication (European Commission): Brussels, Belgium, 2014. [Google Scholar]
  4. ISO 37120:2018; Sustainable Cities and Communities—Indicators for City Services and Quality of Life. ISO: Geneva, Switzerland, 2018.
  5. De Santana ED, S.; de Oliveira Nunes, É.; Santos, L.B. The use of ISO 37122 as standard for assessing the maturity level of a smart city. Int. J. Adv. Eng. Res. Sci. 2018, 5, 309–315. [Google Scholar] [CrossRef]
  6. Anttiroiko, A.-V.; Valkama, P.; Bailey, S.J. Smart cities in the new service economy: Building platforms for smart services. AI Soc. 2014, 29, 323–334. [Google Scholar] [CrossRef]
  7. Visvizi, A.; Troisi, O. Effective Management of the Smart City: An Outline of a Conversation. In Managing Smart Cities; Visvizi, A., Troisi, O., Eds.; Springer: Cham, Switzerland, 2022. [Google Scholar] [CrossRef]
  8. Kashef, M.; Visvizi, A.; Troisi, O. Smart city as a smart service system: Human-computer interaction and smart city surveillance systems. Comput. Hum. Behav. 2021, 124, 106923. [Google Scholar] [CrossRef]
  9. Allmendinger, G.; Lombreglia, R. Four strategies for the age of smart services. Harv. Bus. Rev. 2005, 83, 131. [Google Scholar]
  10. Fischer, M.; Heim, D.; Hofmann, A.; Janiesch, C.; Klima, C.; Winkelmann, A. A taxonomy and archetypes of smart services for smart living. Electron. Mark. 2020, 30, 131–149. [Google Scholar] [CrossRef]
  11. Timeus, K.; Vinaixa, J.; Pardo-Bosch, F. Creating business models for smart cities: A practical framework. Public Manag. Rev. 2020, 22, 726–745. [Google Scholar] [CrossRef] [Green Version]
  12. Chouk, I.; Mani, Z. Factors for and against resistance to smart services: Role of consumer lifestyle and ecosystem related variables. J. Serv. Mark. 2019, 33, 449–462. [Google Scholar] [CrossRef]
  13. Mani, Z.; Chouk, I. Impact of privacy concerns on resistance to smart services: Does the ‘Big Brother effect’ matter? J. Mark. Manag. 2019, 35, 1460–1479. [Google Scholar] [CrossRef]
  14. Lytras, M.D.; Visvizi, A. Information management as a dual-purpose process in the smart city: Collecting, managing and utilizing information. Int. J. Inf. Manag. 2020, 56, 102224. [Google Scholar] [CrossRef]
  15. Alkhammash, E.H.; Jussila, J.; Lytras, M.D.; Visvizi, A. Annotation of Smart Cities Twitter Micro-Contents for Enhanced Citizen’s Engagement. IEEE Access 2019, 7, 116267–116276. [Google Scholar] [CrossRef]
  16. Lytras, M.D.; Visvizi, A.; Sarirete, A. Clustering Smart City Services: Perceptions, Expectations, Responses. Sustainability 2019, 11, 1669. [Google Scholar] [CrossRef] [Green Version]
  17. Malik, R.; Visvizi, A.; Skrzek-Lubasińska, M. The Gig Economy: Current Issues, the Debate, and the New Avenues of Research. Sustainability 2021, 13, 5023. [Google Scholar] [CrossRef]
  18. Chen, C. Science Mapping: A Systematic Review of the Literature. J. Data Inf. Sci. 2017, 2, 1–40. [Google Scholar] [CrossRef] [Green Version]
  19. Donthu, N.; Kumar, S.; Mukherjee, D.; Pandey, N.; Lim, W.M. How to conduct a bibliometric analysis: An overview and guidelines. J. Bus. Res. 2021, 133, 285–296. [Google Scholar] [CrossRef]
  20. Molina-Collado, A.; Salgado-Sequeiros, J.; Gómez-Rico, M.; García, E.A.; De Maeyer, P. Key themes in consumer financial services research from 2000 to 2020: A bibliometric and science mapping analysis. Int. J. Bank Mark. 2021, 39, 1446–1478. [Google Scholar] [CrossRef]
  21. Garcia-Buendia, N.; Moyano-Fuentes, J.; Maqueira-Marín, J.M.; Cobo, M.J. 22 Years of Lean Supply Chain Management: A science mapping-based bibliometric analysis. Int. J. Prod. Res. 2020, 59, 1901–1921. [Google Scholar] [CrossRef]
  22. Santana, M.; Cobo, M.J. What is the future of work? A science mapping analysis. Eur. Manag. J. 2020, 38, 846–862. [Google Scholar] [CrossRef]
  23. López-Robles, J.R.; Rodríguez-Salvador, M.; Gamboa-Rosales, N.K.; Ramirez-Rosales, S.; Cobo, M.J. The last five years of Big Data Research in Economics, Econometrics and Finance: Identification and conceptual analysis. Procedia Comput. Sci. 2019, 162, 729–736. [Google Scholar] [CrossRef]
  24. Ellegaard, O.; Wallin, J.A. The bibliometric analysis of scholarly production: How great is the impact? Scientometrics 2015, 105, 1809–1831. [Google Scholar] [CrossRef] [Green Version]
  25. Broadus, R.N. Toward a definition of “bibliometrics”. Scientometrics 1987, 12, 373–379. [Google Scholar] [CrossRef]
  26. Waheed, H.; Hassan, S.-U.; Aljohani, N.R.; Wasif, M. A bibliometric perspective of learning analytics research landscape. Behav. Inf. Technol. 2018, 37, 941–957. [Google Scholar] [CrossRef]
  27. Hassan, S.-U.; Haddawy, P.; Zhu, J. A bibliometric study of the world’s research activity in sustainable development and its sub-areas using scientific literature. Scientometrics 2014, 99, 549–579. [Google Scholar] [CrossRef]
  28. Santa Soriano, A.; Lorenzo Álvarez, C.; Torres Valdes, R.M. Bibliometric analysis to identify an emerging research area: Public Relations Intelligence—A challenge to strengthen technological observatories in the network society. Scientometrics 2018, 115, 1591–1614. [Google Scholar] [CrossRef]
  29. Hassan, S.-U.; Visvizi, A.; Waheed, H. The ‘who’ and the ‘what’ in international migration research: Data-driven analysis of Scopus-indexed scientific literature. Behav. Inf. Technol. 2019, 38, 924–939. [Google Scholar] [CrossRef]
  30. Safder, I.; Hassan, S.-U. Bibliometric-enhanced information retrieval: Aa novel deep feature engineering approach for algorithm searching from full-text publications. Scientometrics 2019, 119, 257–277. [Google Scholar] [CrossRef]
  31. Cobo, M.J.; López-Herrera, A.G.; Herrera-Viedma, E.; Herrera, F. An approach for detecting, quantifying, and visualizing the evolution of a research field: A practical application to the Fuzzy Sets Theory field. J. Informetr. 2011, 5, 146–166. [Google Scholar] [CrossRef]
  32. Gutiérrez-Salcedo, M.; Martínez, M.A.; Moral-Munoz, J.A.; Herrera-Viedma, E.; Cobo, M.J. Some bibliometric procedures for analyzing and evaluating research fields. Appl. Intell. 2018, 48, 1275–1287. [Google Scholar] [CrossRef]
  33. Radhakrishnan, S.; Erbis, S.; Isaacs, J.; Kamarthi, S. Novel keyword co-occurrence network-based methods to foster systematic reviews of scientific literature. PLoS ONE 2017, 12, e0172778. [Google Scholar] [CrossRef] [Green Version]
  34. Su, H.-N.; Lee, P.-C. Mapping knowledge structure by keyword co-occurrence: A first look at journal papers in Technology Foresight. Scientometrics 2010, 85, 65–79. [Google Scholar] [CrossRef]
  35. Boyack, K.; Klavans, R.; Börner, K. Mapping the backbone of science. Scientometrics 2005, 64, 351–374. [Google Scholar] [CrossRef]
  36. Aria, M.; Cuccurullo, C. bibliometrix: An R-tool for comprehensive science mapping analysis. J. Informetr. 2017, 11, 959–975. [Google Scholar] [CrossRef]
  37. Cobo, M.J.; López-Herrera, A.G.; Herrera-Viedma, E.; Herrera, F. SciMAT: A new science mapping analysis software tool. J. Am. Soc. Inf. Sci. Technol. 2012, 63, 1609–1630. [Google Scholar] [CrossRef]
  38. Cobo, M.J.; López-Herrera, A.G.; Herrera-Viedma, E.; Herrera, F. Science mapping software tools: Review, analysis, and cooperative study among tools. J. Am. Soc. Inf. Sci. Technol. 2011, 62, 1382–1402. [Google Scholar] [CrossRef]
  39. Callon, M.; Courtial, J.P.; Laville, F. Co-word analysis as a tool for describing the network of interactions between basic and technological research: The case of polymer chemsitry. Scientometrics 2005, 22, 155–205. [Google Scholar] [CrossRef]
  40. Small, H. Visualizing science by citation mapping. J. Am. Soc. Inf. Sci. 1999, 50, 799–813. [Google Scholar] [CrossRef]
  41. Gharaibeh, A.; Salahuddin, M.A.; Hussini, S.J.; Khreishah, A.; Khalil, I.; Guizani, M.; Al-Fuqaha, A. Smart Cities: A Survey on Data Management, Security, and Enabling Technologies. IEEE Commun. Surv. Tutorials 2017, 19, 2456–2501. [Google Scholar] [CrossRef]
  42. Abreu, D.P.; Velasquez, K.; Curado, M.; Monteiro, E. A resilient Internet of Things architecture for smart cities. Ann. Telecommun. 2017, 72, 19–30. [Google Scholar] [CrossRef]
  43. Ali, Z.H.; Ali, H.A. Towards sustainable smart IoT applications architectural elements and design: Opportunities, challenges, and open directions. J. Supercomput. 2021, 77, 5668–5725. [Google Scholar] [CrossRef]
  44. Sánchez, M.; Aguilar, J.; Exposito, E. Fog computing for the integration of agents and web services in an autonomic reflexive middleware. Serv. Oriented Comput. Appl. 2018, 12, 333–347. [Google Scholar] [CrossRef] [Green Version]
  45. Qolomany, B.; Mohammed, I.; Al-Fuqaha, A.; Guizani, M.; Qadir, J. Trust-Based Cloud Machine Learning Model Selection for Industrial IoT and Smart City Services. IEEE Internet Things J. 2021, 8, 2943–2958. [Google Scholar] [CrossRef]
  46. Bibri, S.E. The IoT for smart sustainable cities of the future: An analytical framework for sensor-based big data applications for environmental sustainability. Sustain. Cities Soc. 2018, 38, 230–253. [Google Scholar] [CrossRef]
  47. Sohaib Ajmal, M.; Iqbal, Z.; Zeeshan Khan, F.; Bilal, M.; Majid Mehmood, R. Cost-based Energy Efficient Scheduling Technique for Dynamic Voltage and Frequency Scaling System in cloud computing. Sustain. Energy Technol. Assessments 2021, 45, 101210. [Google Scholar] [CrossRef]
  48. Sirohi, P.; Al-Wesabi, F.N.; Alshahrani, H.M.; Maheshwari, P.; Agarwal, A.; Dewangan, B.K.; Hilal, A.M.; Choudhury, T. Energy-Efficient Cloud Service Selection and Recommendation Based on QoS for Sustainable Smart Cities. Appl. Sci. 2021, 11, 9394. [Google Scholar] [CrossRef]
  49. Aujla, G.S.; Kumar, N. MEnSuS: An efficient scheme for energy management with sustainability of cloud data centers in edge–cloud environment. Futur. Gener. Comput. Syst. 2018, 86, 1279–1300. [Google Scholar] [CrossRef]
  50. Abdel-Basset, M.; Moustafa, N.; Mohamed, R.; Elkomy, O.M.; Abouhawwash, M. Multi-Objective Task Scheduling Approach for Fog Computing. IEEE Access 2021, 9, 126988–127009. [Google Scholar] [CrossRef]
  51. Sookhak, M.; Tang, H.; He, Y.; Yu, F.R. Security and Privacy of Smart Cities: A Survey, Research Issues and Challenges. IEEE Commun. Surv. Tutorials 2019, 21, 1718–1743. [Google Scholar] [CrossRef]
  52. Tariq, M.U.; Babar, M.; Jan, M.A.; Khattak, A.S.; AlShehri, M.D.; Yahya, A. Security Requirement Management for Cloud-assisted and Internet of Things–enabled Smart City. Comput. Mater. Contin. 2021, 67, 625–639. [Google Scholar] [CrossRef]
  53. Fang, L.; Zhang, H.; Li, M.; Ge, C.; Liu, L.; Liu, Z. A Secure and Fine-Grained Scheme for Data Security in Industrial IoT Platforms for Smart City. IEEE Internet Things J. 2020, 7, 7982–7990. [Google Scholar] [CrossRef]
  54. Shen, J.; Liu, D.; Liu, Q.; He, D.; Sun, X. An Enhanced Cloud Data Storage Auditing Protocol Providing Strong Security and Efficiency for Smart City. J. Inf. Sci. Eng. 2017, 33, 923–938. [Google Scholar]
  55. Gupta, M.; Awaysheh, F.M.; Benson, J.; Al Azab, M.; Patwa, F.; Sandhu, R. An Attribute-Based Access Control for Cloud Enabled Industrial Smart Vehicles. IEEE Trans. Ind. Inform. 2020, 17, 4288–4297. [Google Scholar] [CrossRef]
  56. Neves, F.; Campos, F.; Stroele, V.; Capretz, M.A.M.; Jennings, M.; Bryant, D.; Dantas, M. Heath-PRIOR: An Intelligent Ensemble Architecture to Identify Risk Cases in Healthcare. IEEE Access 2020, 8, 217150–217168. [Google Scholar] [CrossRef]
  57. Al Omar, A.; Jamil, A.K.; Khandakar, A.; Uzzal, A.R.; Bosri, R.; Mansoor, N.; Rahman, M.S. A Transparent and Privacy-Preserving Healthcare Platform with Novel Smart Contract for Smart Cities. IEEE Access 2021, 9, 90738–90749. [Google Scholar] [CrossRef]
  58. Nguyen, D.C.; Ding, M.; Pathirana, P.N.; Seneviratne, A.; Li, J.; Poor, H.V. Federated Learning for Internet of Things: A Comprehensive Survey. IEEE Commun. Surv. Tutorials 2021, 23, 1622–1658. [Google Scholar] [CrossRef]
  59. Albahri, A.S.; Alwan, J.K.; Taha, Z.K.; Ismail, S.F.; Hamid, R.A.; Zaidan, A.A.; Albahri, O.S.; Zaidan, B.B.; Alamoodi, A.H.; Alsalem, M.A. IoT-based telemedicine for disease prevention and health promotion: State-of-the-Art. J. Netw. Comput. Appl. 2021, 173, 102873. [Google Scholar] [CrossRef]
  60. Huynh-The, T.; Hua, C.-H.; Tu, N.A.; Kim, D.-S. Physical Activity Recognition with Statistical-Deep Fusion Model Using Multiple Sensory Data for Smart Health. IEEE Internet Things J. 2021, 8, 1533–1543. [Google Scholar] [CrossRef]
  61. Antunes, R.S.; da Costa, C.A.; Küderle, A.; Yari, I.A.; Eskofier, B. Federated Learning for Healthcare: Systematic Review and Architecture Proposal. ACM Trans. Intell. Syst. Technol. 2022, 13, 54. [Google Scholar] [CrossRef]
  62. Zhang, Y.; Yutaka, M.; Sasabe, M.; Kasahara, S. Attribute-Based Access Control for Smart Cities: A Smart-Contract-Driven Framework. IEEE Internet Things J. 2020, 8, 6372–6384. [Google Scholar] [CrossRef]
  63. Islam, J.; Kumar, T.; Kovacevic, I.; Harjula, E. Resource-Aware Dynamic Service Deployment for Local IoT Edge Computing: Healthcare Use Case. IEEE Access 2021, 9, 115868–115884. [Google Scholar] [CrossRef]
  64. Abu Salim, T.; El Barachi, M.; Onyia, O.P.; Mathew, S.S. Effects of smart city service channel- and user-characteristics on user satisfaction and continuance intention. Inf. Technol. People 2021, 34, 147–177. [Google Scholar] [CrossRef]
  65. Lytras, M.D.; Visvizi, A. Who Uses Smart City Services and What to Make of It: Toward Interdisciplinary Smart Cities Research. Sustainability 2018, 10, 1998. [Google Scholar] [CrossRef] [Green Version]
  66. Alam, T.; Porras, J. Architecting and Designing Sustainable Smart City Services in a Living Lab Environment. Technologies 2018, 6, 99. [Google Scholar] [CrossRef] [Green Version]
  67. Paskaleva, K.; Cooper, I. Open innovation and the evaluation of internet-enabled public services in smart cities. Technovation 2018, 78, 4–14. [Google Scholar] [CrossRef] [Green Version]
  68. Lee, J.H.; Hancock, M.G.; Hu, M.-C. Towards an effective framework for building smart cities: Lessons from Seoul and San Francisco. Technol. Forecast. Soc. Chang. 2014, 89, 80–99. [Google Scholar] [CrossRef]
  69. Ji, T.; Chen, J.-H.; Wei, H.-H.; Su, Y.-C. Towards people-centric smart city development: Investigating the citizens’ preferences and perceptions about smart-city services in Taiwan. Sustain. Cities Soc. 2021, 67, 102691. [Google Scholar] [CrossRef]
  70. Kim, N.; Yang, S. Characteristics of Conceptually Related Smart Cities (CRSCs) Services from the Perspective of Sustainability. Sustainability 2021, 13, 3334. [Google Scholar] [CrossRef]
  71. Vandercruysse, L.; Buts, C.; Dooms, M. A typology of Smart City services: The case of Data Protection Impact Assessment. Cities 2020, 104, 102731. [Google Scholar] [CrossRef]
  72. Polese, F.; Troisi, O.; Grimaldi, M.; Loia, F. Reinterpreting governance in smart cities: An ecosystem-based view. In Smart Cities and the UN SDGs; Visvizi, A., Pérez del Hoyo, R., Eds.; Elsevier: Amsterdam, The Netherlands, 2021; pp. 71–89. [Google Scholar]
  73. Visvizi, A.; Abdel-Razek, S.A.; Wosiek, R.; Malik, R. Conceptualizing Walking and Walkability in the Smart City through a Model Composite w2 Smart City Utility Index. Energies 2021, 14, 8193. [Google Scholar] [CrossRef]
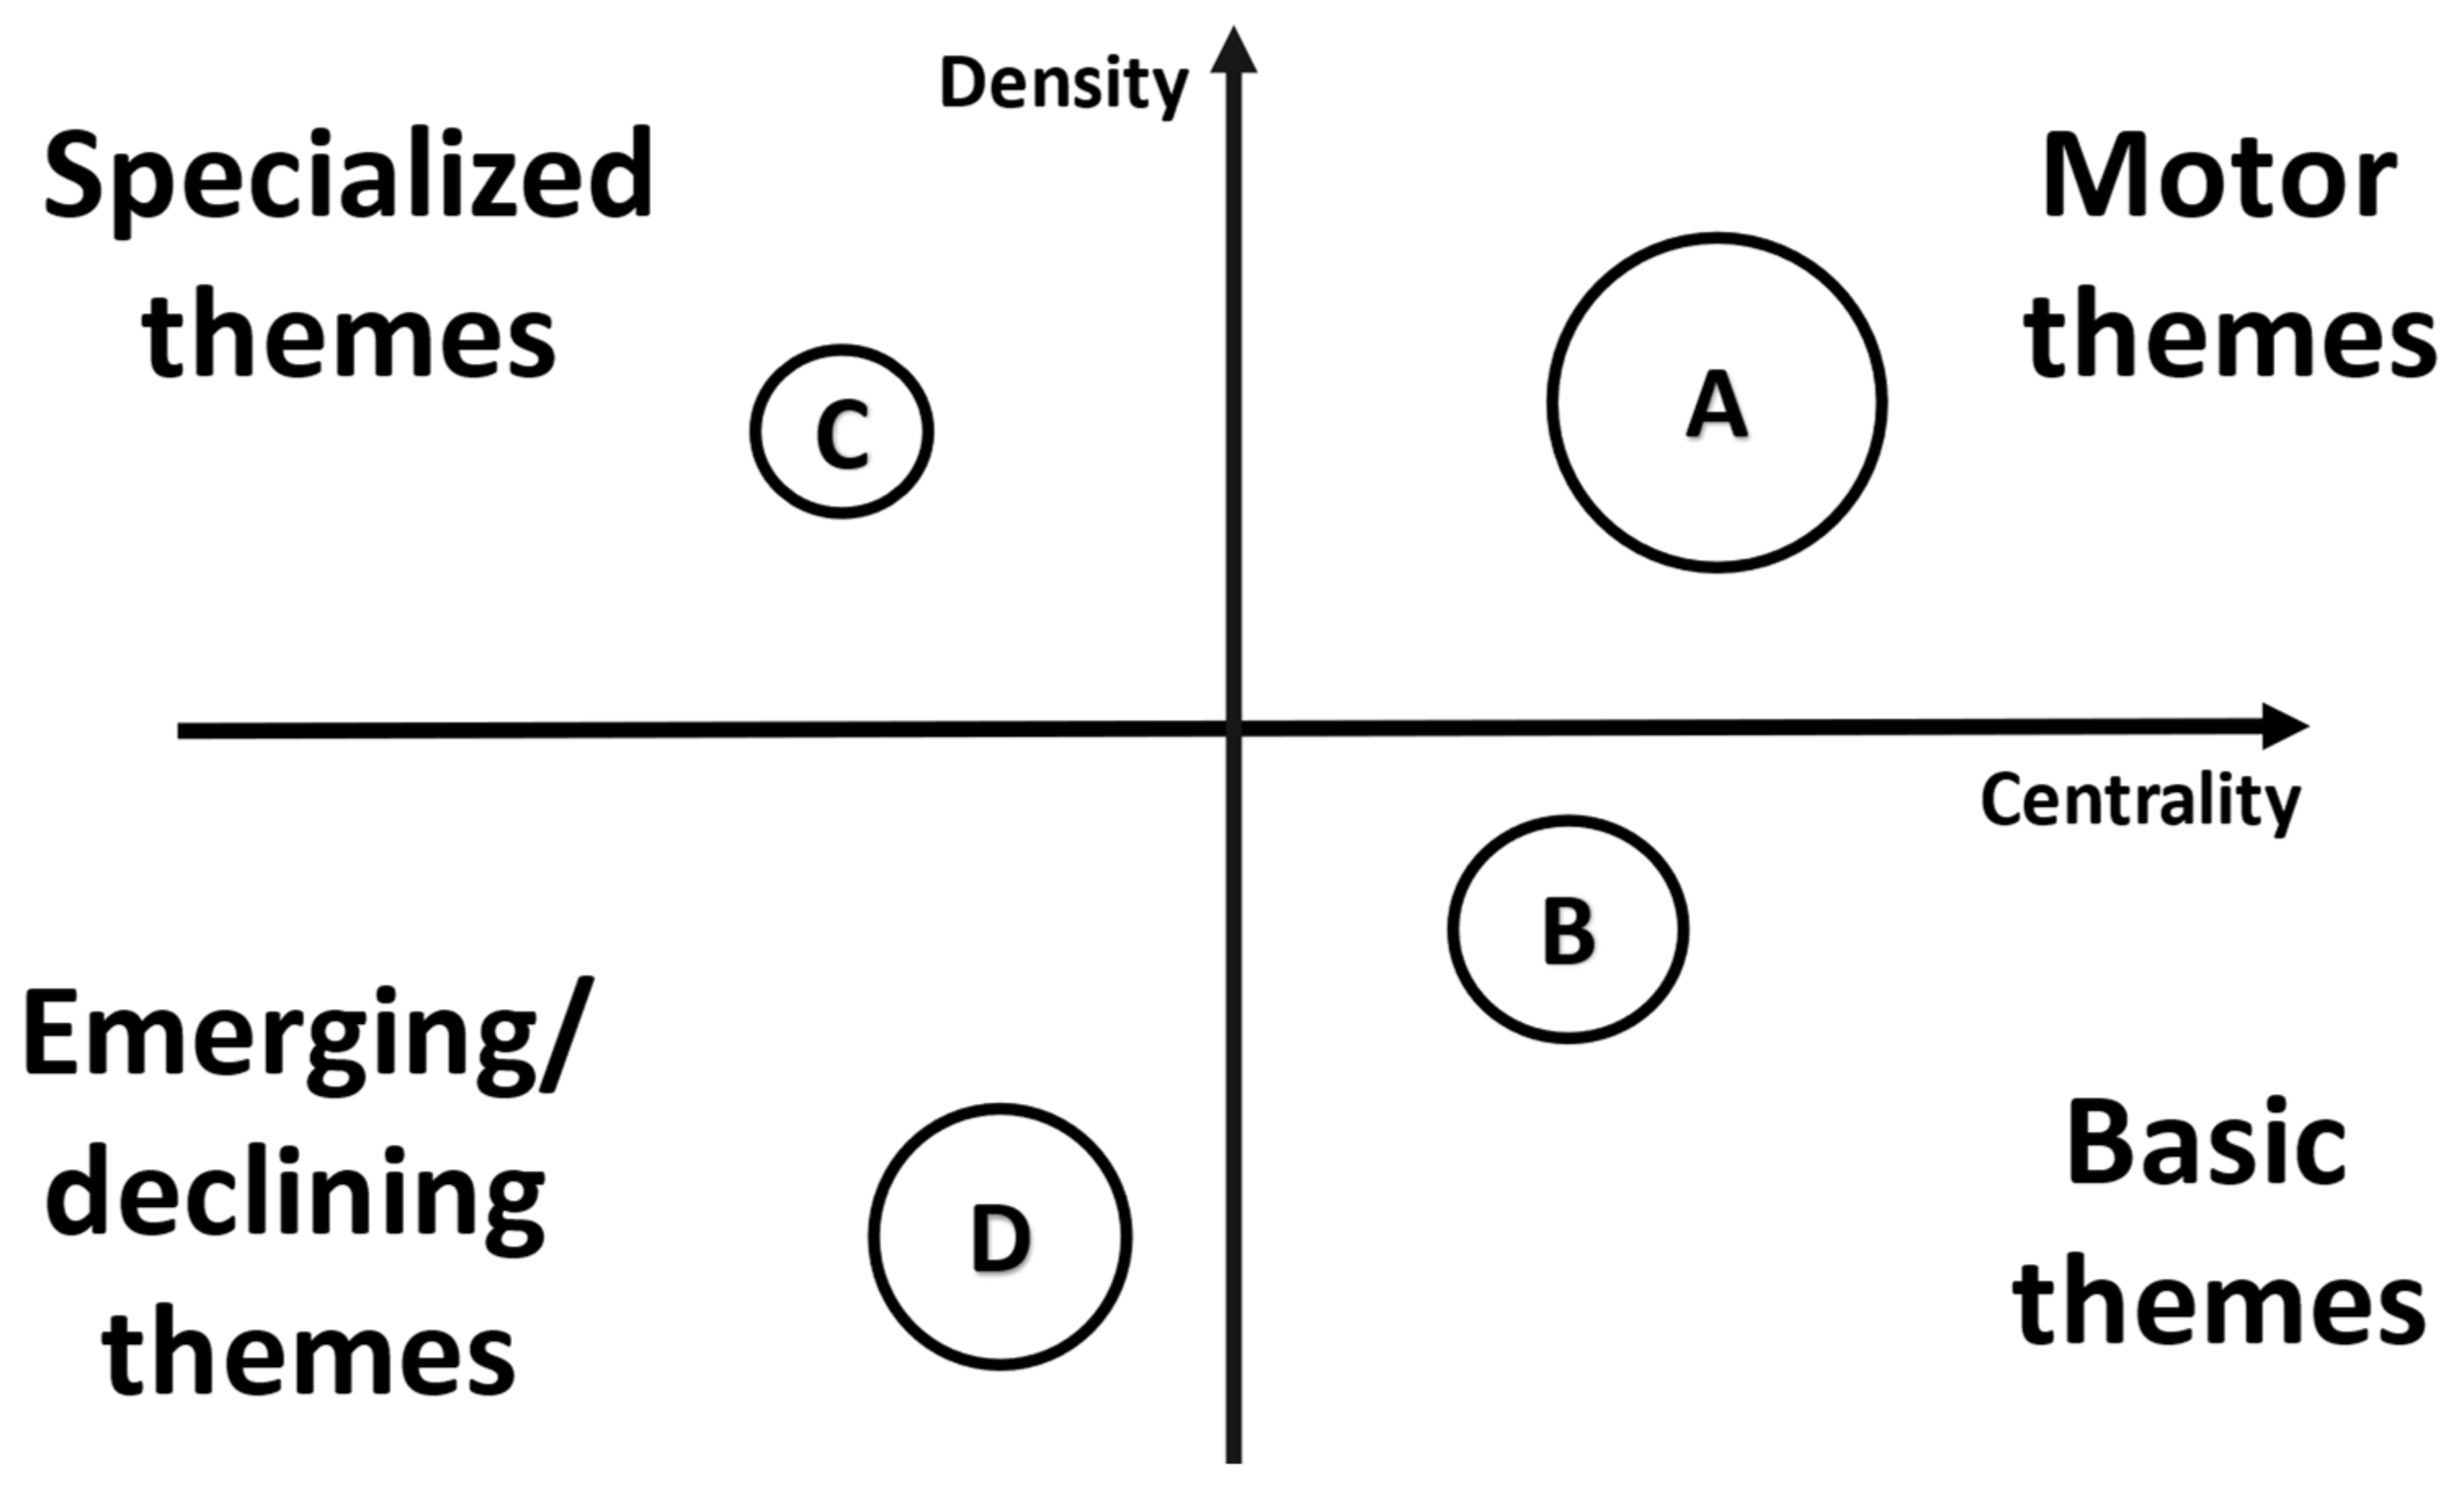
Figure 1. Strategic diagram template with example of themes (A, B, C, D) in a research field.
Sustainability 14 06506 g001
Figure 2. An example of thematic network. Theme A and other keywords (N, K, L, M, P) in its thematic network.
Sustainability 14 06506 g002
Figure 3. Strategic diagram of services in smart cities research field.
Sustainability 14 06506 g003
Figure 4. Thematic network (edge-computing) in services and smart-city research field.
Sustainability 14 06506 g004
Figure 5. Thematic network (blockchain) in services and smart-city research field.
Sustainability 14 06506 g005
Figure 6. Thematic network (sustainability) in services and smart-city research field.
Sustainability 14 06506 g006
Publisher’s Note: MDPI stays neutral with regard to jurisdictional claims in published maps and institutional affiliations.