
Optimal Design of Subway Train Cross-Line Operation Scheme Based on Passenger Smart Card Data

Abstract
:1. Introduction
1.1. Literature Review
1.2. The Main Contributions of This Paper
2. Research Methodology
2.1. Design of Train Operation Scheme of the Independent Subway Line
2.2. Design of Cross-Line Operation Scheme between Two Subway Lines
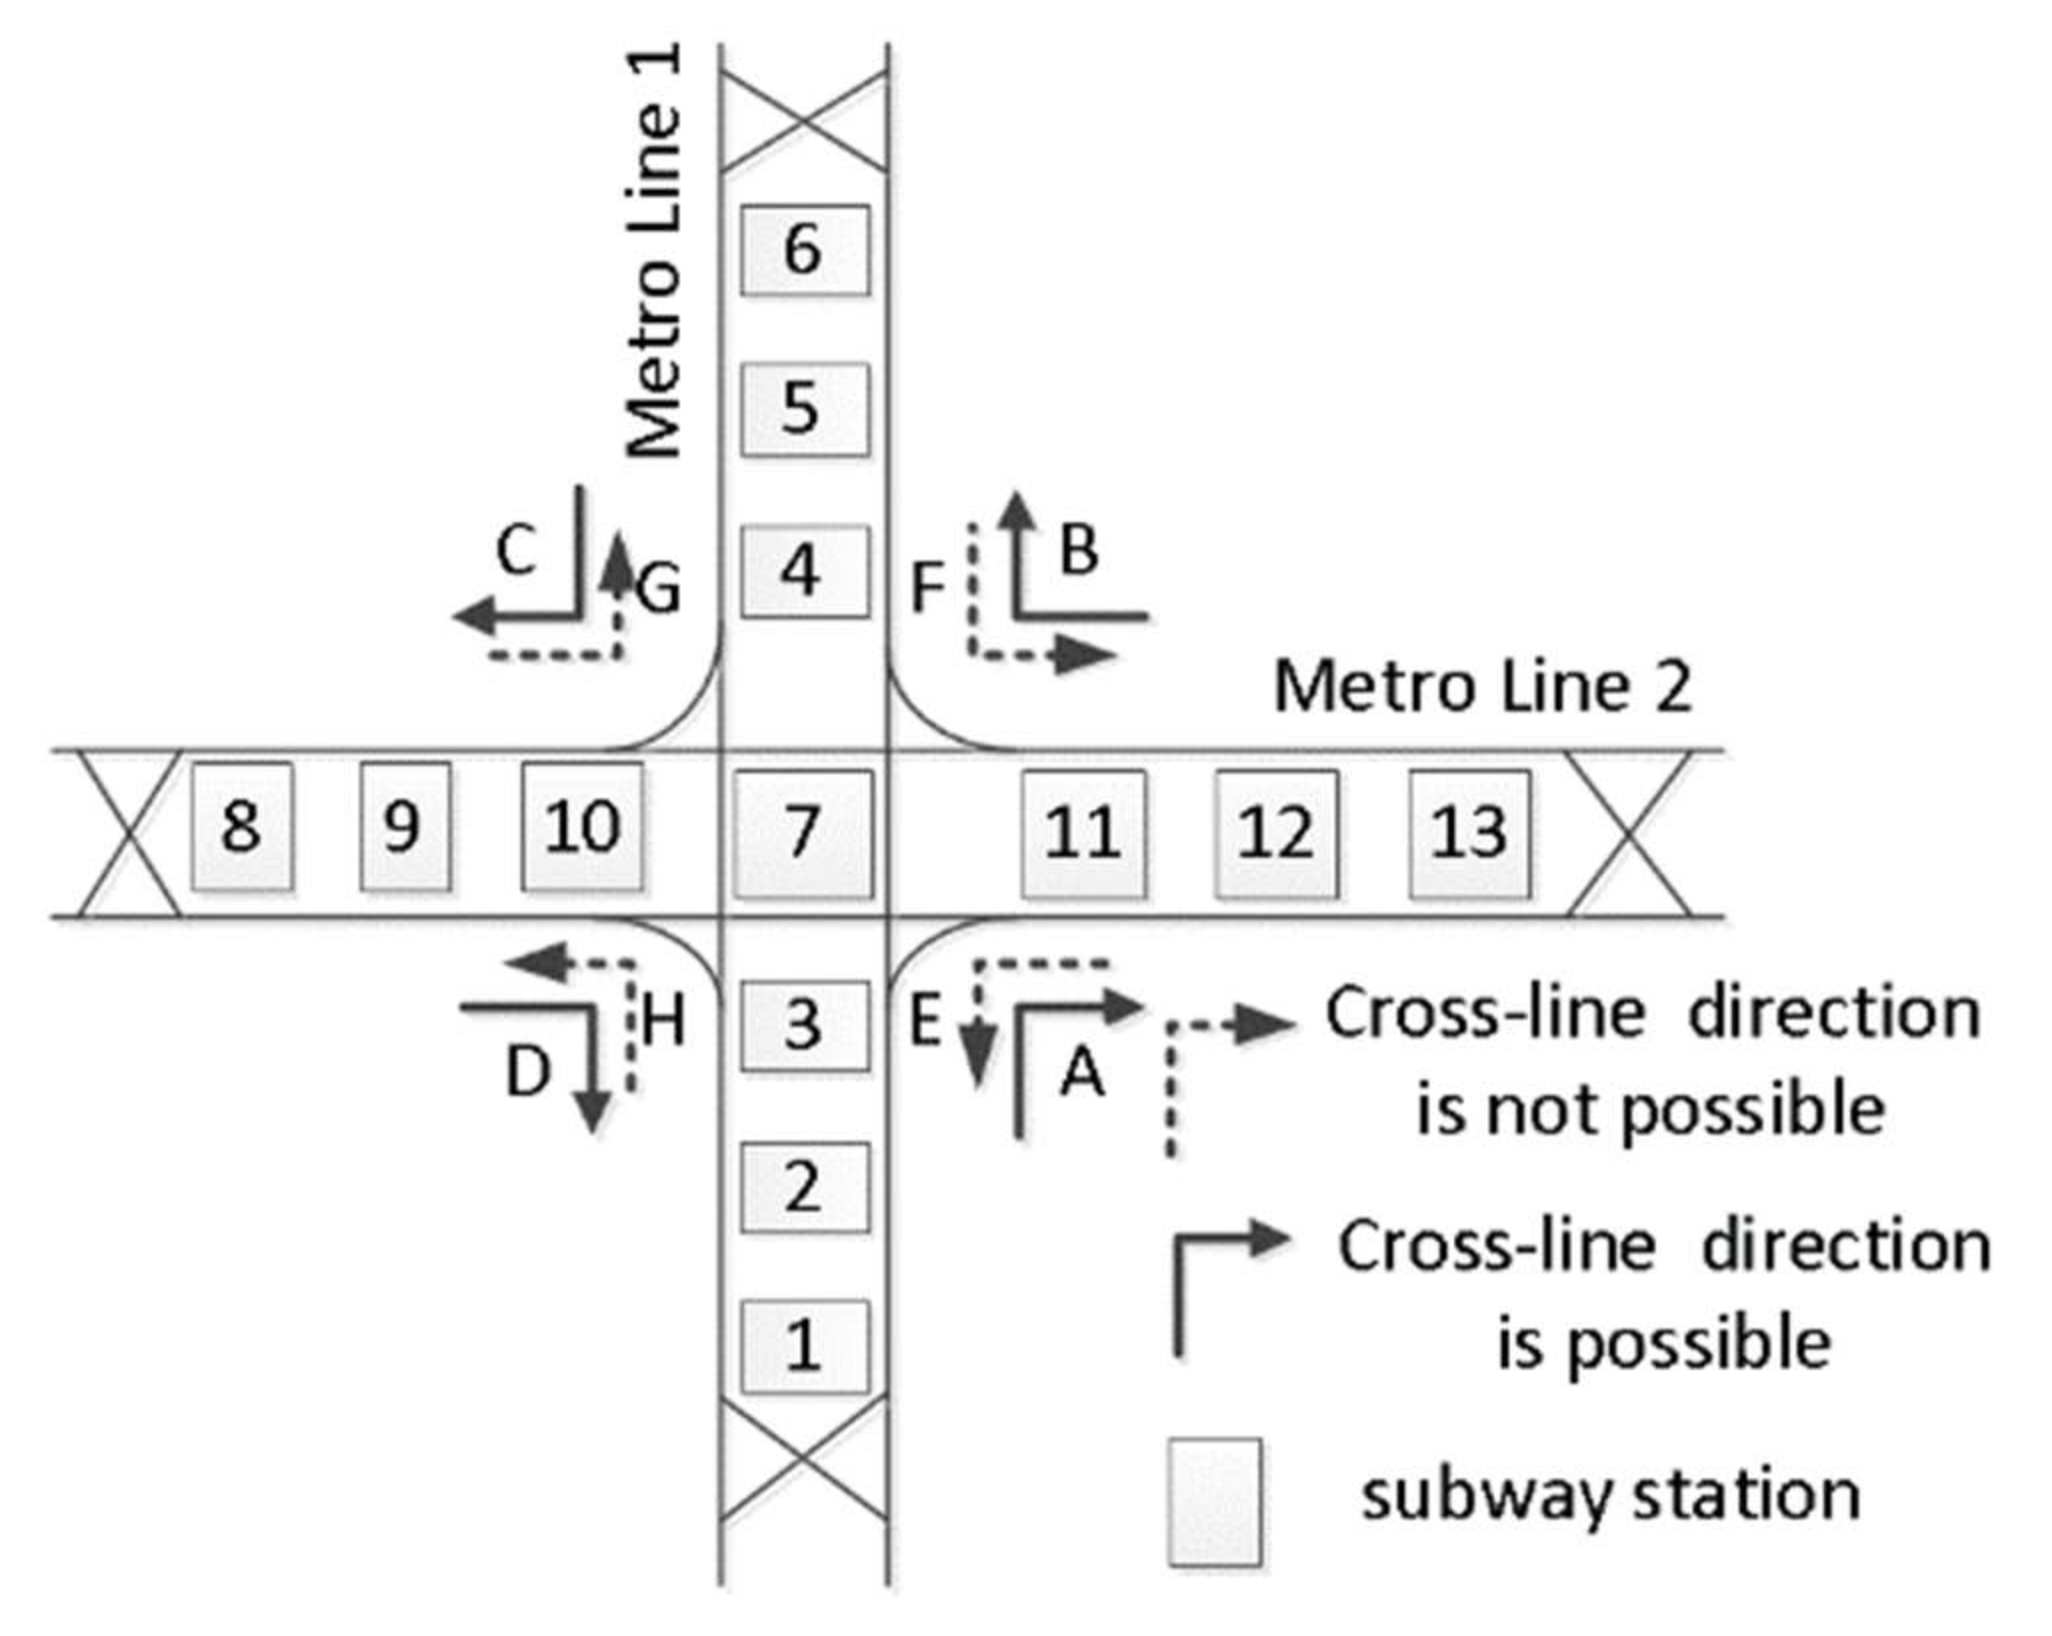
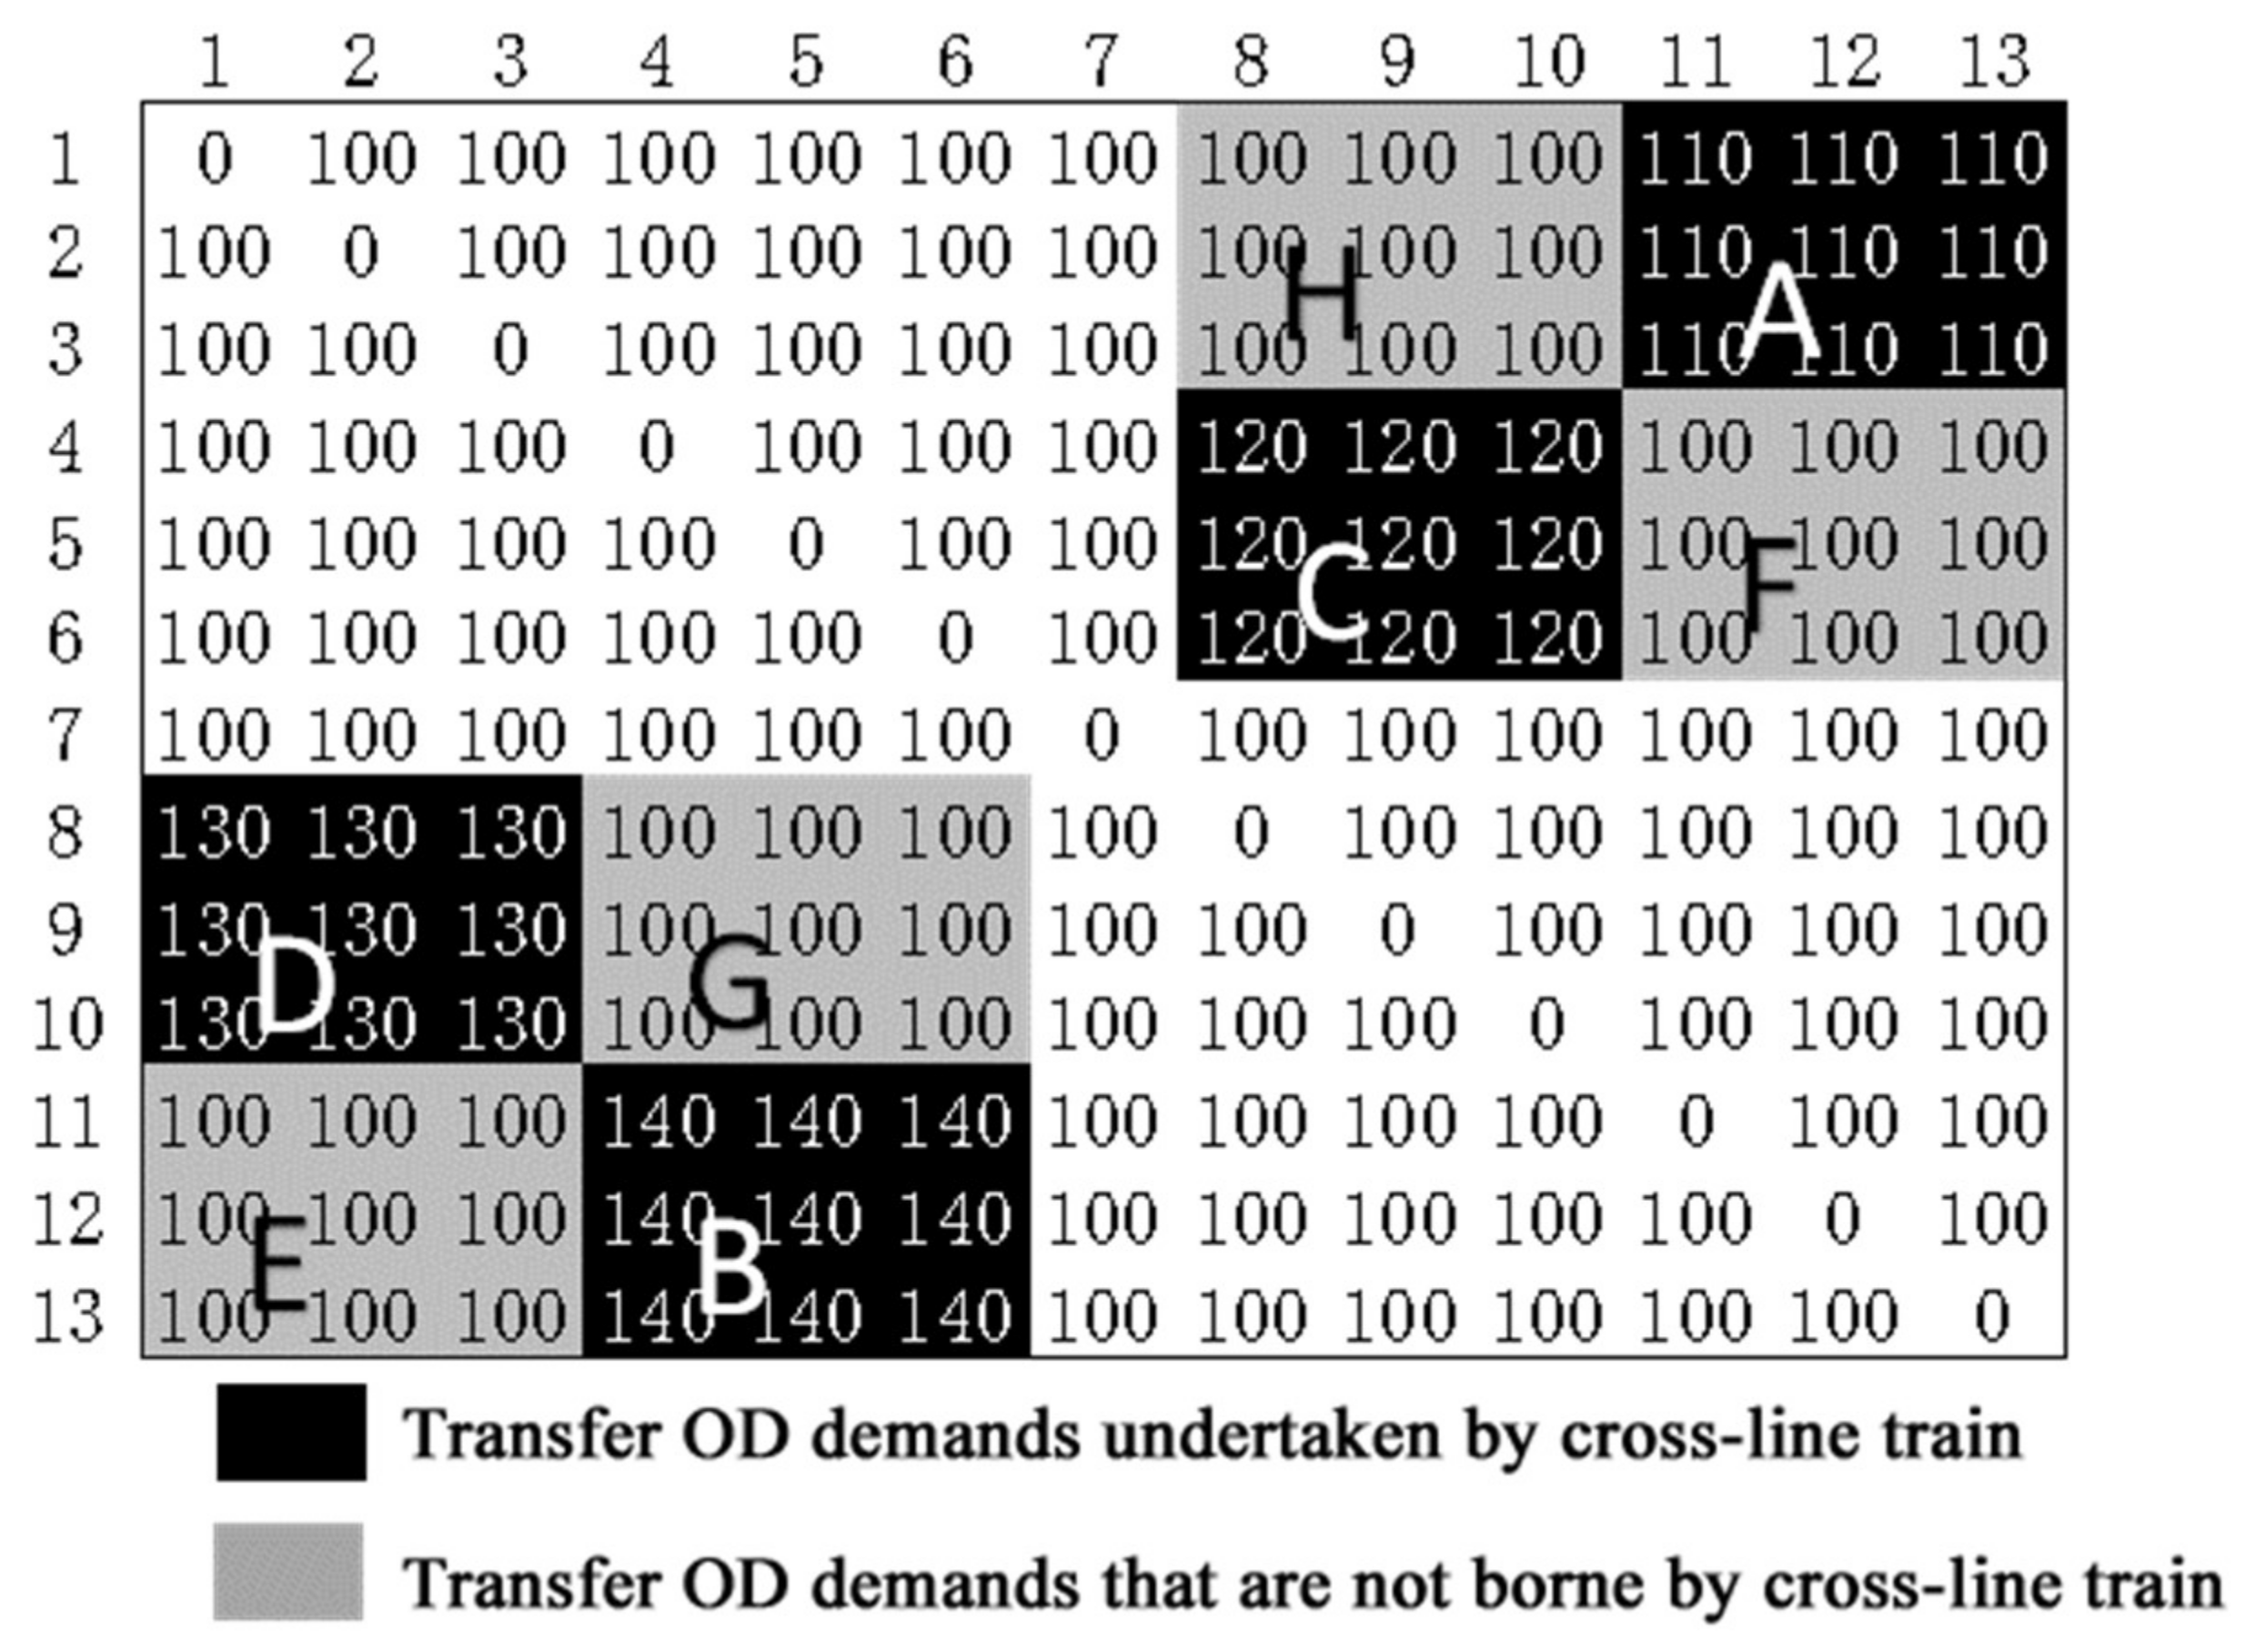
2.2.1. Calculation of Potential Traffic Demand for Cross-Line Operation
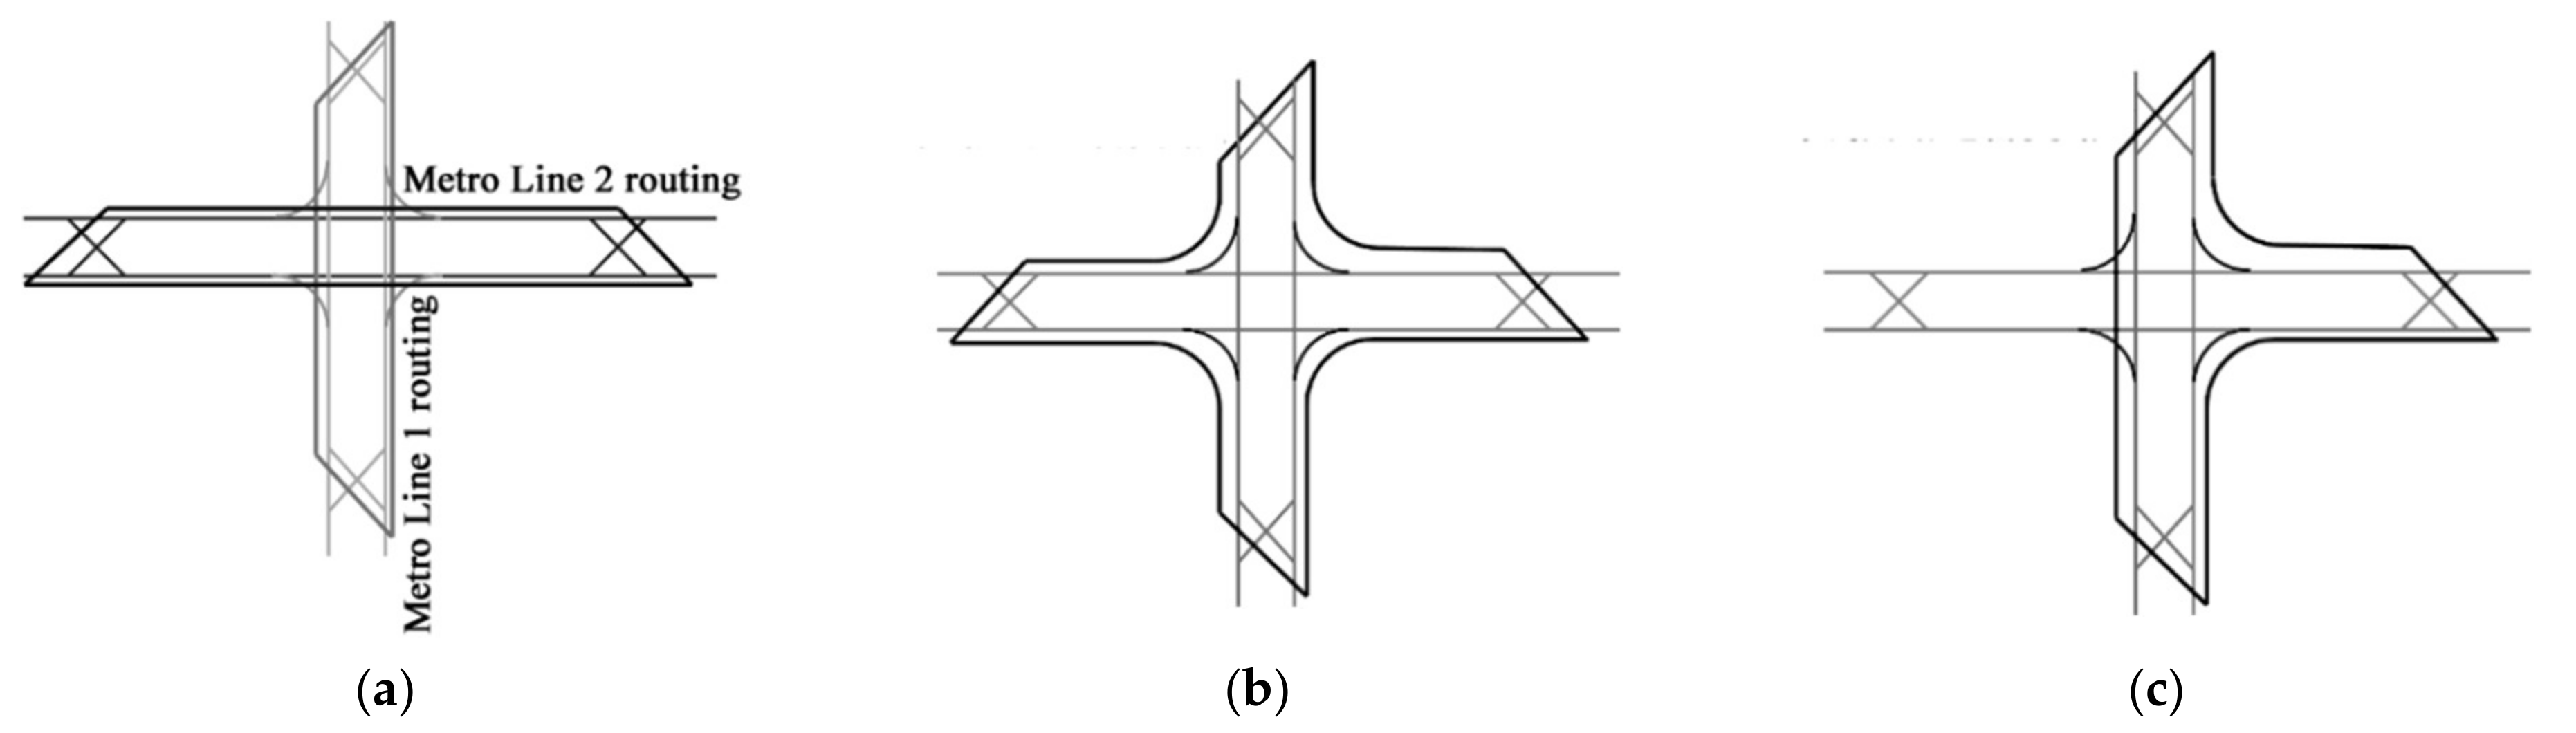
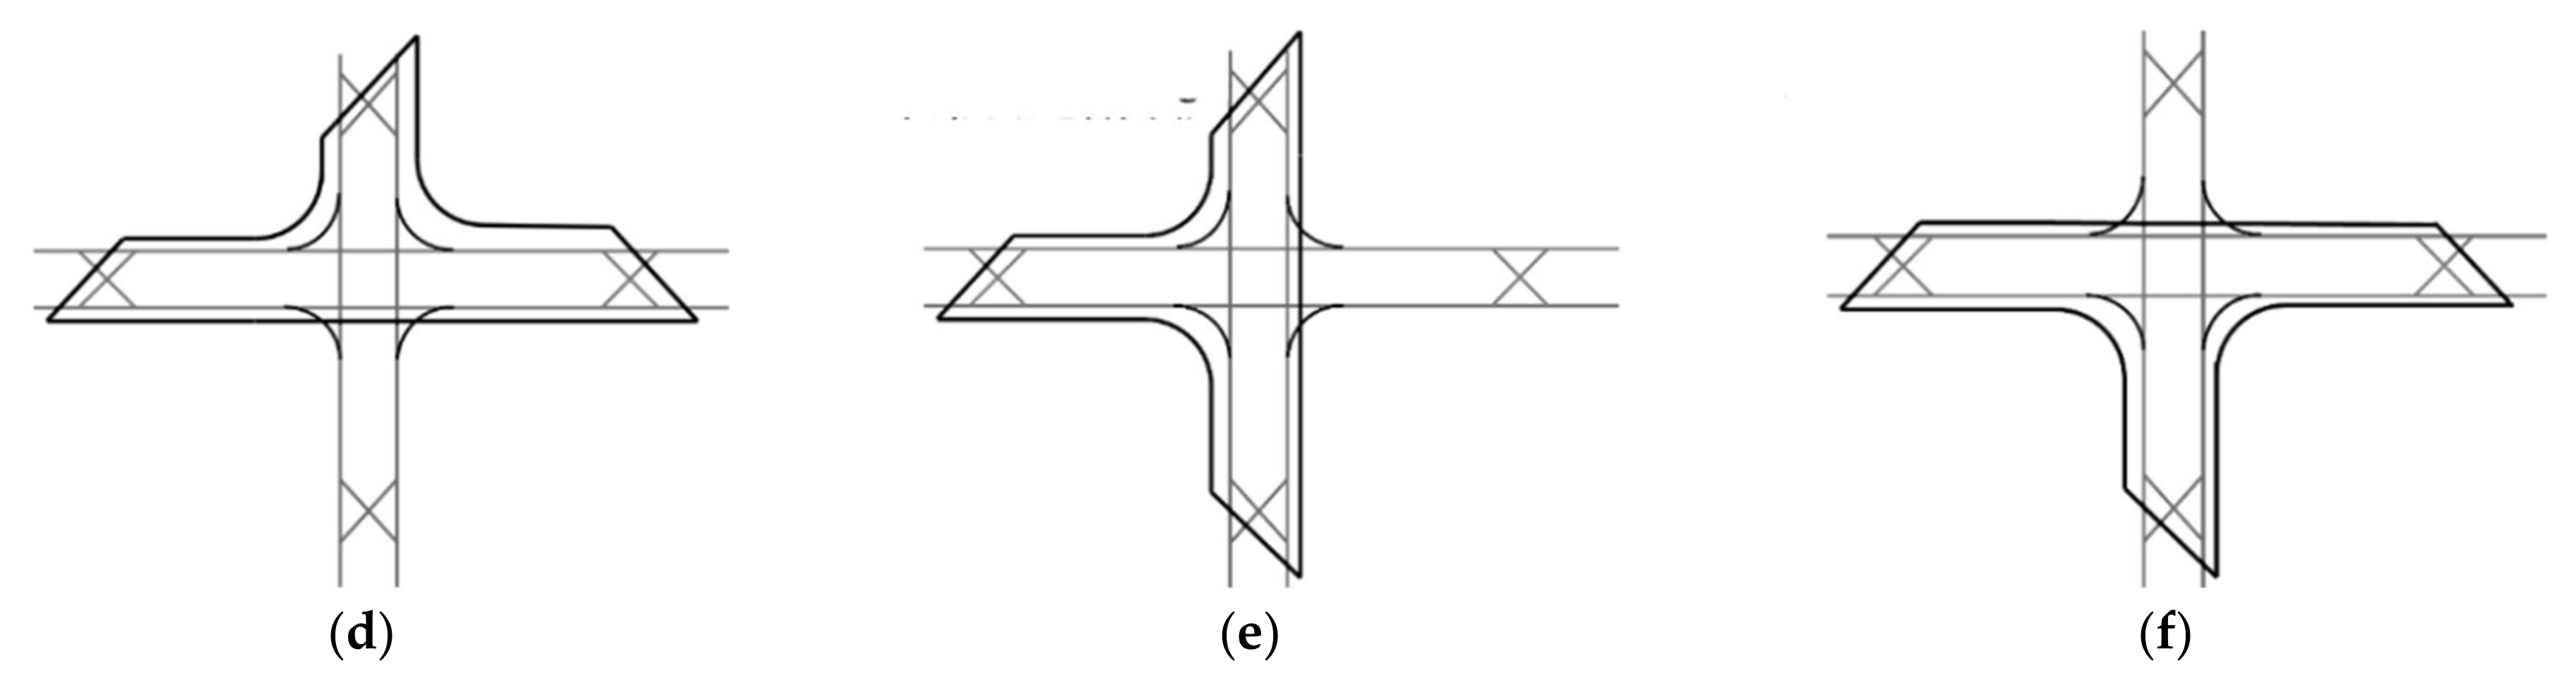
2.2.2. Routing Scheme Design of Cross-Line Operation
2.2.3. Calculate the Number of Trains for Different Routings
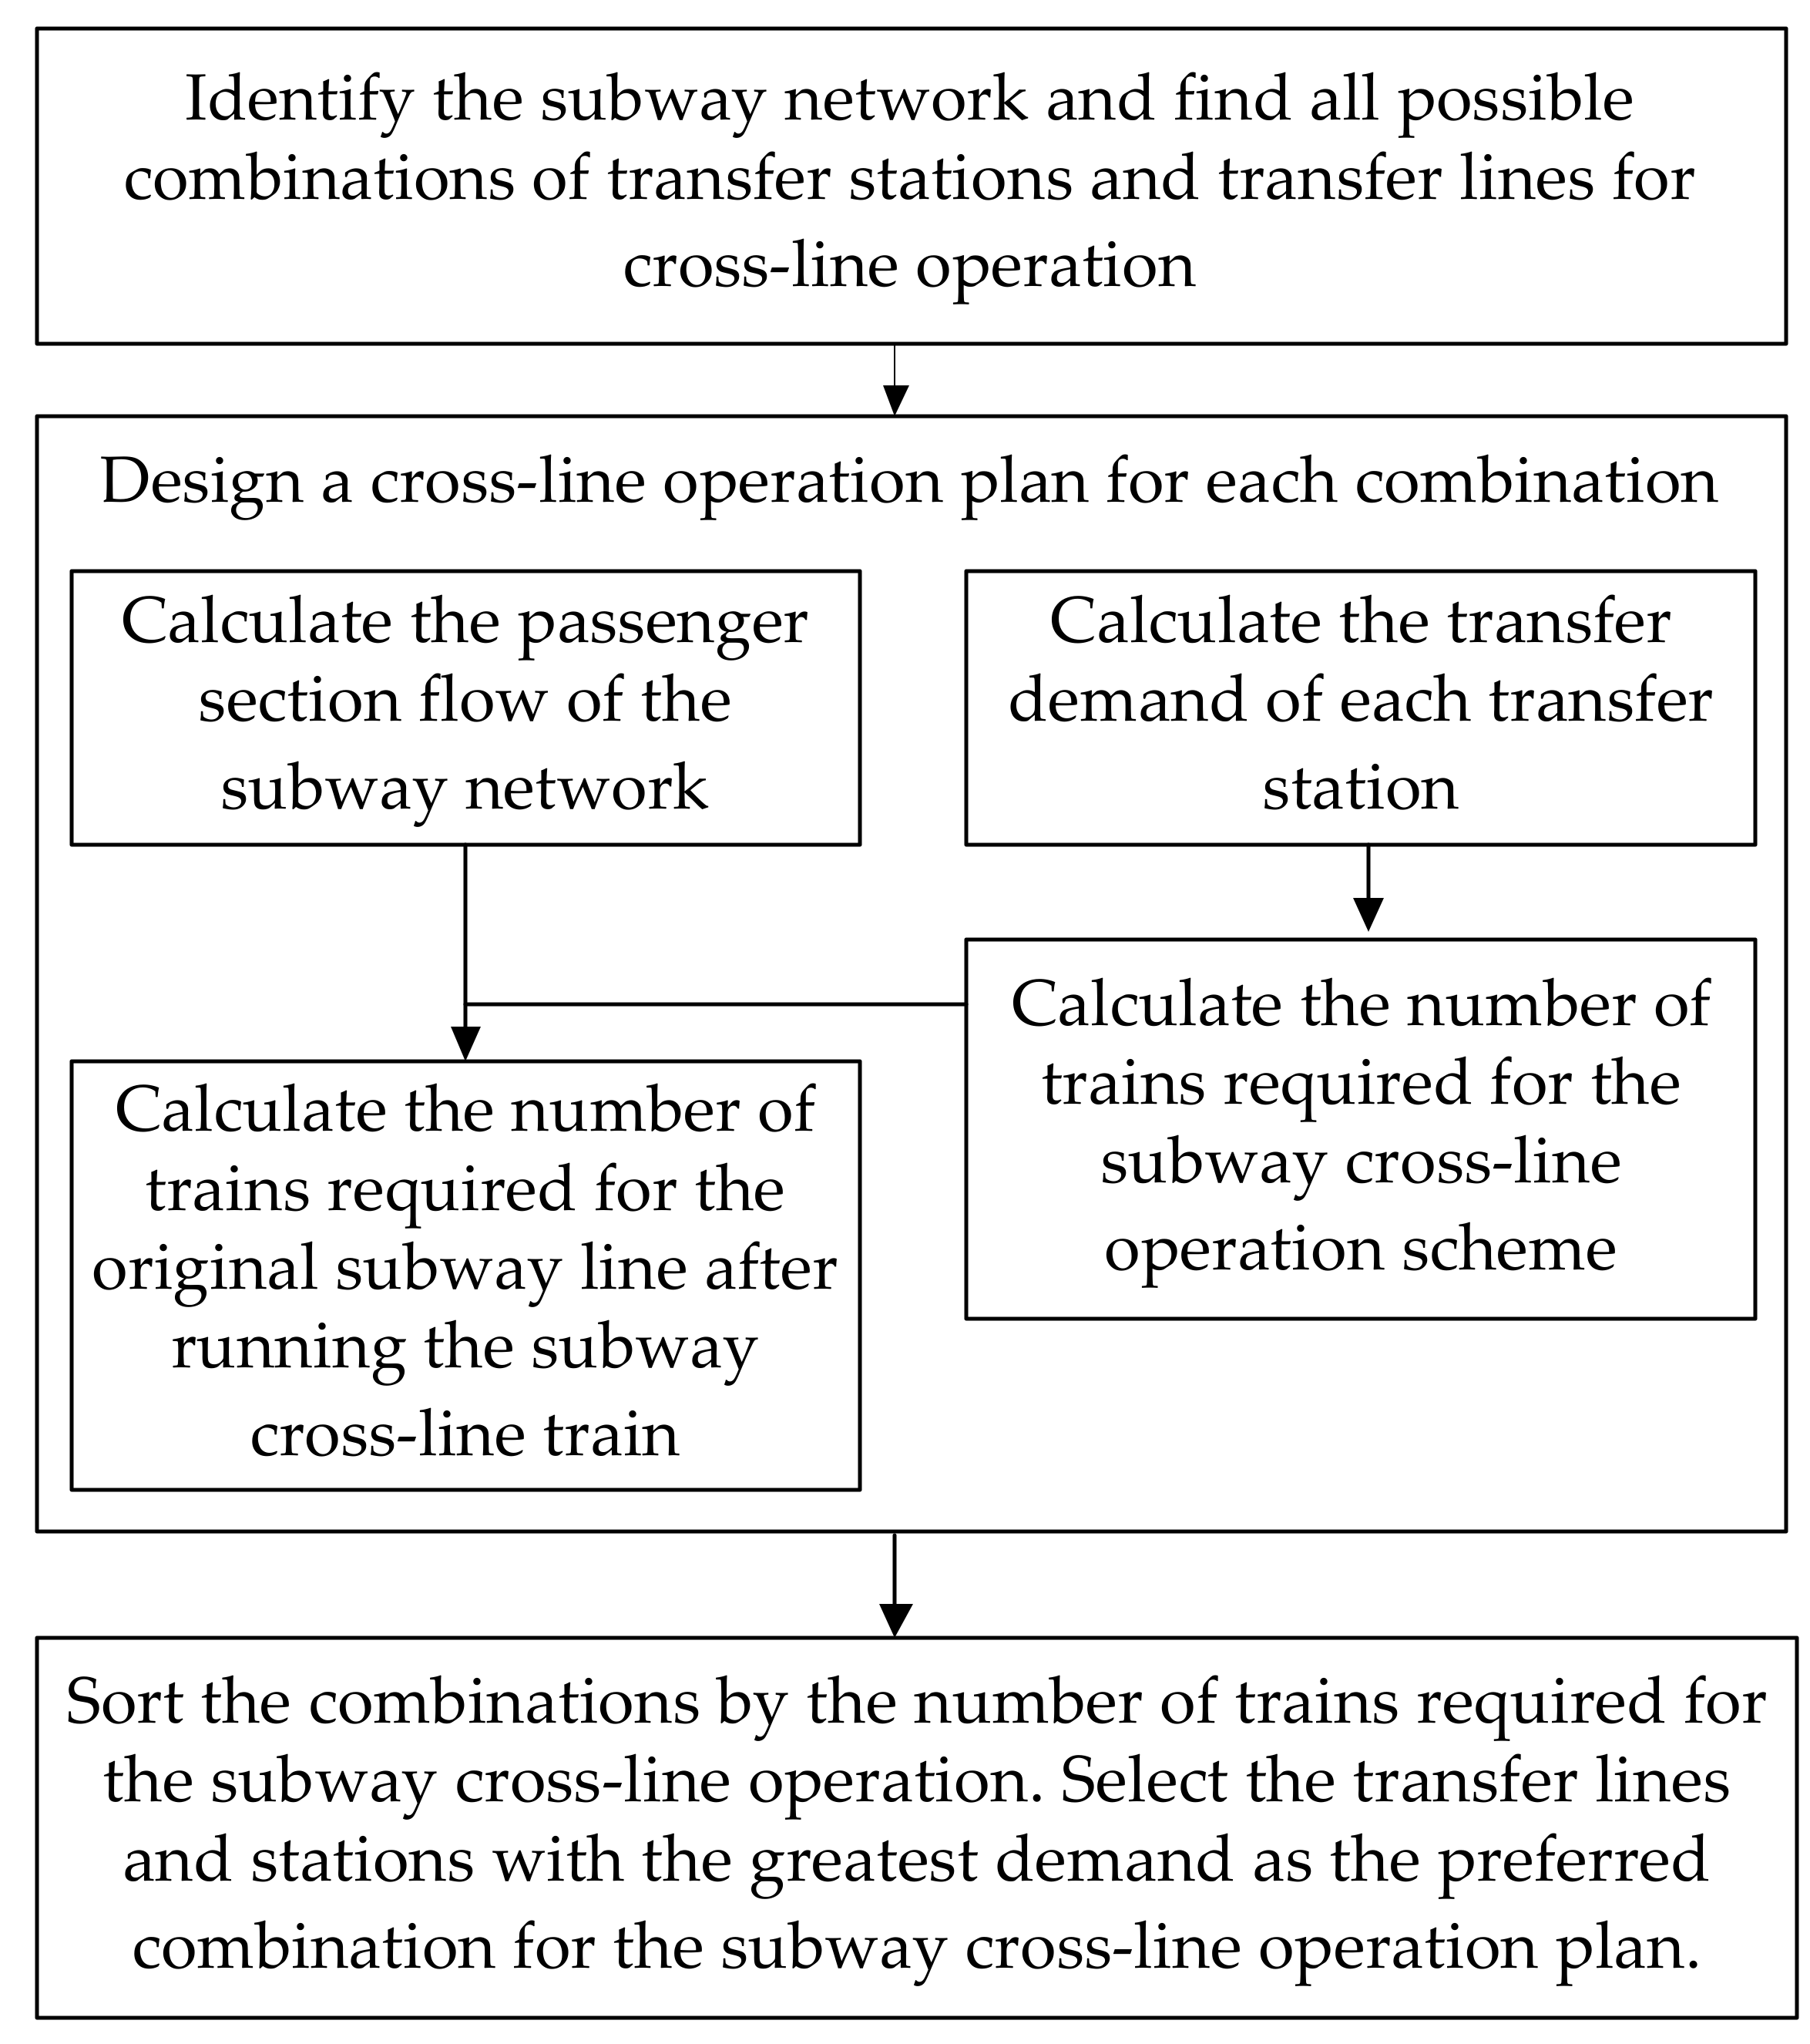
2.3. Design of Cross-Line Operation Scheme of Subway Network
3. Case Analysis
3.1. Schematic Design of Cross-Line Operation of Chengdu Metro Lines 1 and 2
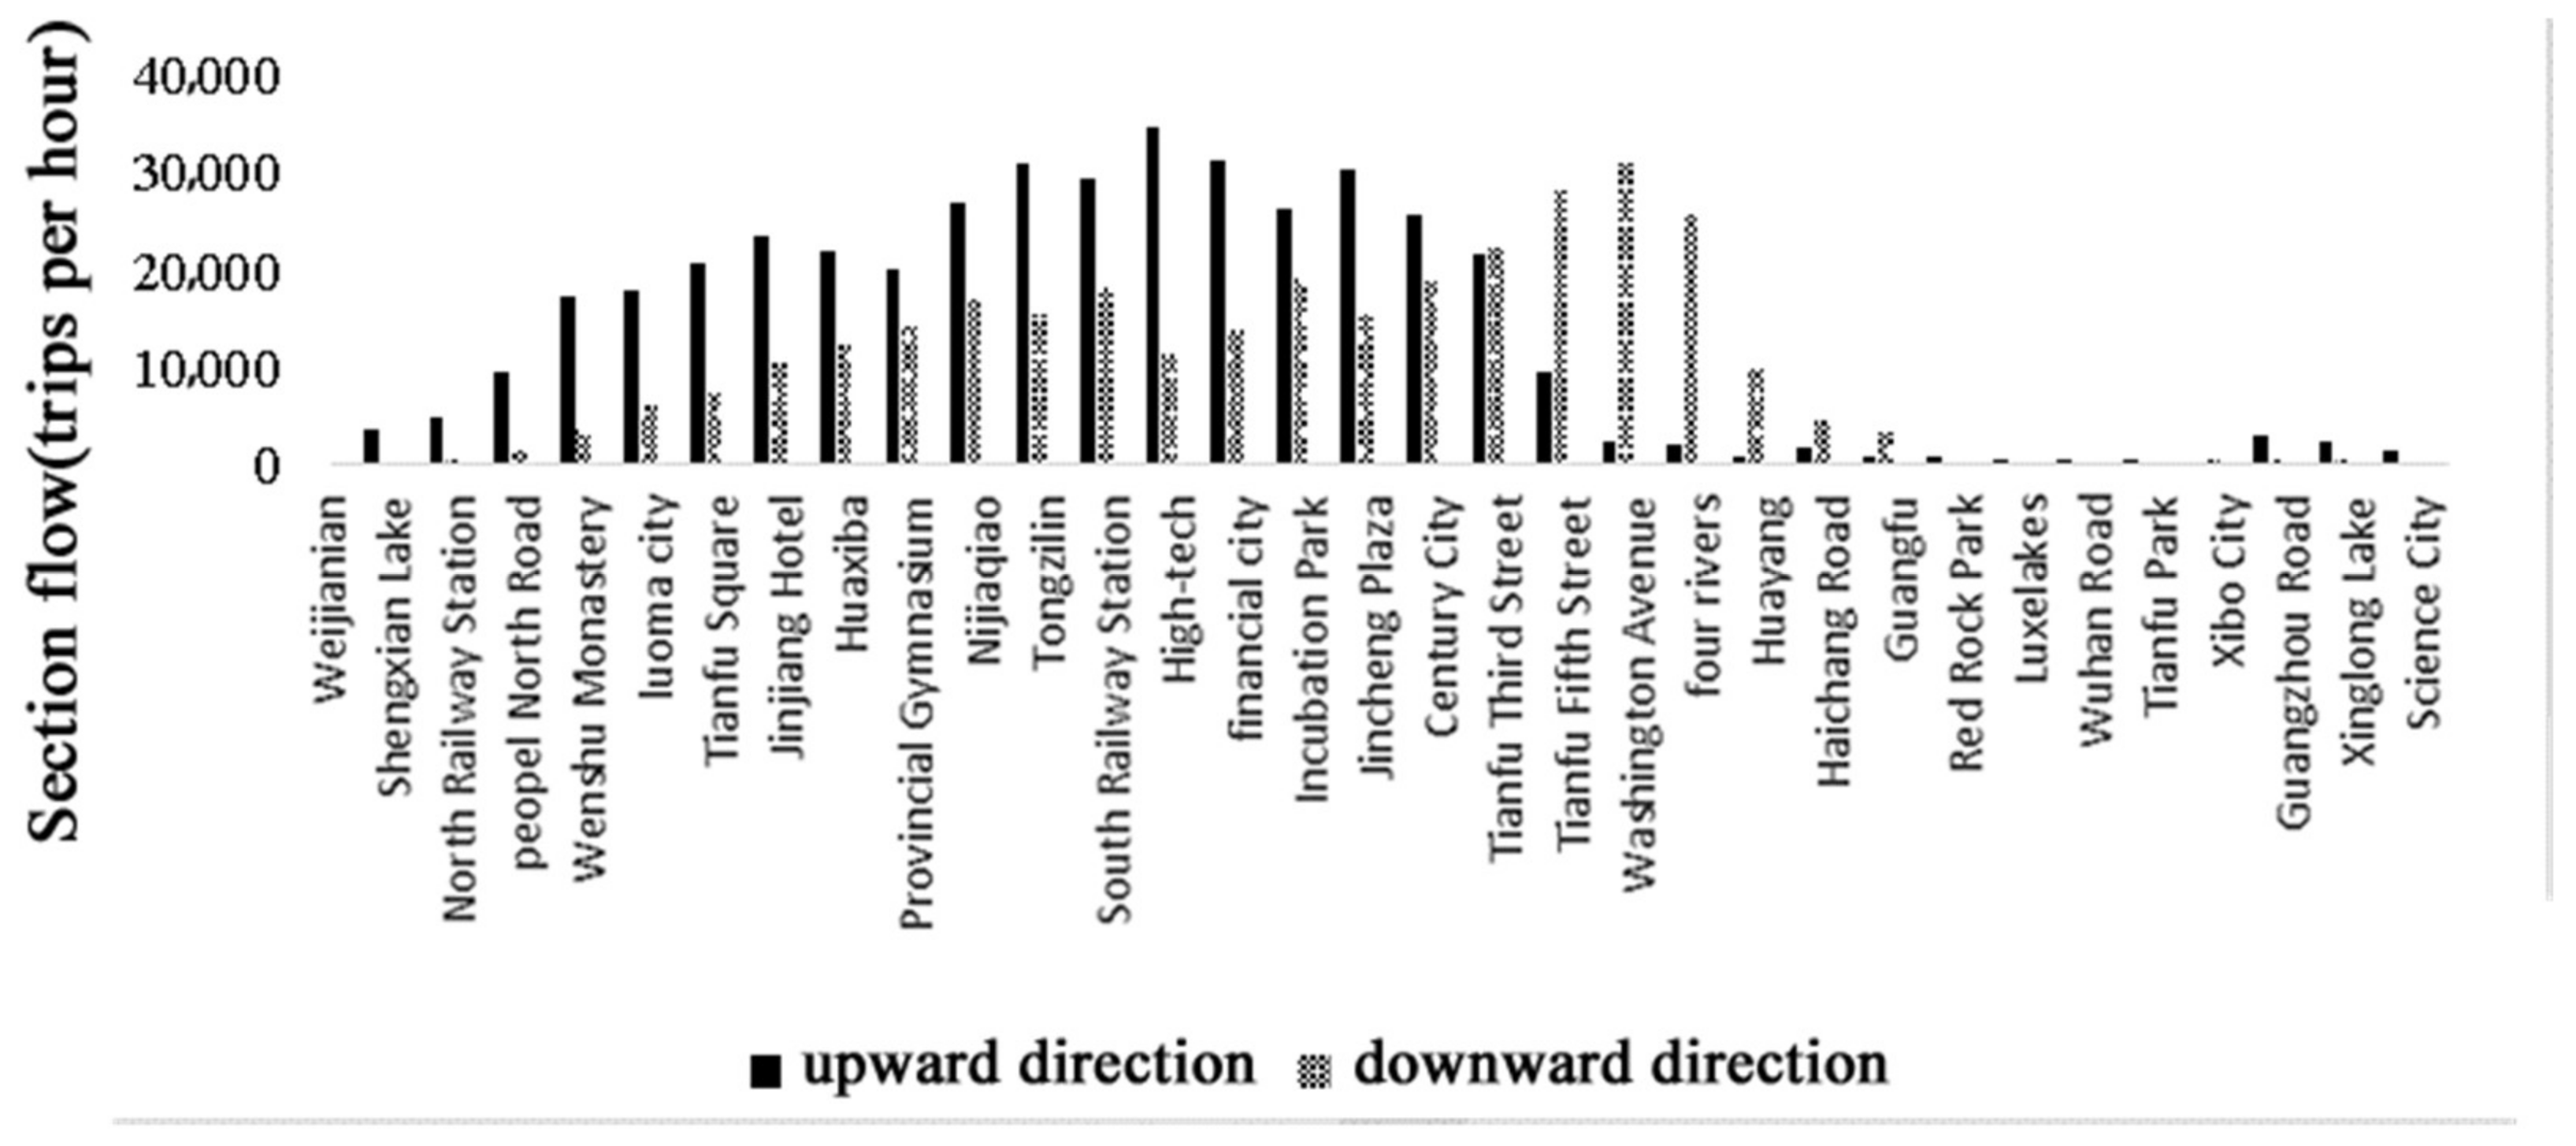
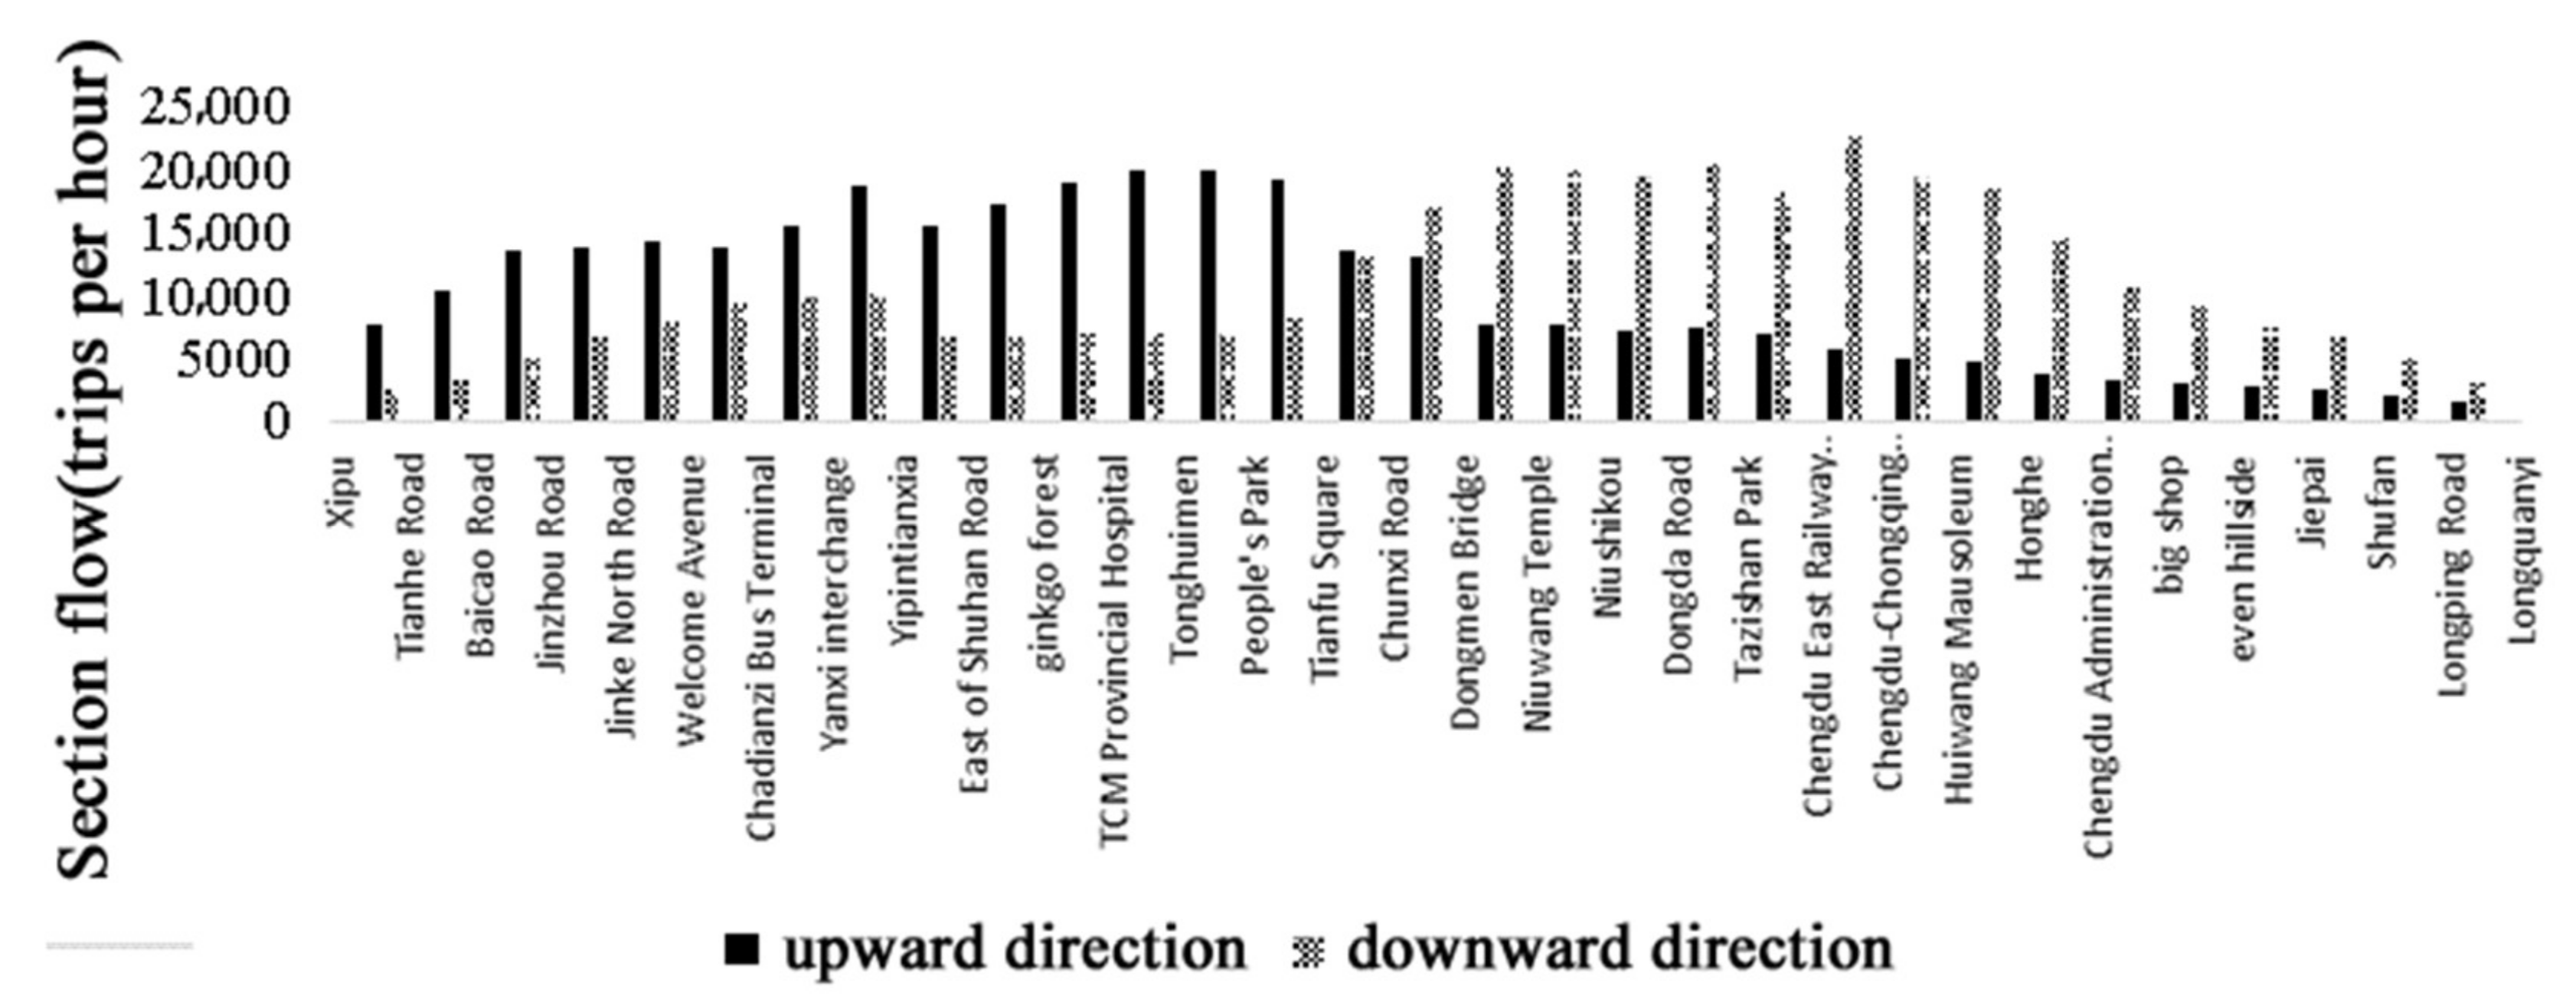
3.1.1. Traffic Demand Analysis
3.1.2. Subway Cross-Line Operation Design
3.2. Analysis of Cross-Line Operation Scheme of Chengdu Subway Network
3.2.1. Build the Subway Network
3.2.2. Subway Cross-Line Operation Design
4. Discussion
- (1)
- Taking the cross-line operation scheme design of Chengdu Metro Line 1 and Line 2 as an example comprehensively demonstrates the design process of the subway cross-line operation scheme based on passenger smart card data proposed in this paper; that is, through the analysis of passenger travel demands, determining the subway cross-line routing, the number of trains required for running cross-line trains, etc. The research results show that if Tianfu Square Station is used as the transfer station, and Metro Line 1 and Metro Line 2 are used as transfer lines, the number of trains required to implement cross-line operation is five trains per hour.
- (2)
- The analysis of the travel demand of the entire subway network in Chengdu shows that the transfer stations with the most urgent need for the implementation of the subway cross-line operation are the North Railway Station, Xibo City Station, and South Railway Station, and the numbers of trains required for implementing cross-line operation are all greater than or equal to 10 trains per hour. After the implementation of subway cross-line operation, these operation schemes can help more than 13,000 passengers save on transfer time during rush hour and improve traffic efficiency.
- (3)
- In the design process of the cross-line operation scheme of the subway network, this paper ignores the impact of the cost of subway line reconstruction. In future research directions, we aim to consider the cost of subway line reconstruction and explore more path selection models to ensure the path selection results are more in line with the actual situation.
Author Contributions
Funding
Data Availability Statement
Conflicts of Interest
References
- Li, J.; Qian, Y.; Zeng, J.; Yin, F.; Zhu, L.; Guang, X. Research on the Influence of a High-Speed Railway on the Spatial Structure of the Western Urban Agglomeration Based on Fractal Theory—Taking the Chengdu–Chongqing Urban Agglomeration as an Example. Sustainability 2020, 12, 7550. [Google Scholar] [CrossRef]
- Gong, D.; Li, G. Research on Multi-objective Optimized Target Speed Curve of Subway Operation Based on ATO System. Int. Core J. Eng. 2020, 6, 133–137. [Google Scholar]
- Griffin, T. Light rail transit sharing the railtrack system. Proc. Inst. Civ. Eng. Transp. 1996, 117, 98–103. [Google Scholar] [CrossRef]
- Drechsler, G. Light railway on conventional railway tracks in karlsruhe, germany. Proc. Inst. Civ. Eng. Transp. 1996, 117, 81–87. [Google Scholar] [CrossRef]
- Novales, M.; Orro, A.; Bugarin, M.R. The tram-train: State of the art. Proc. Inst. Mech. Eng. 2002, 216, 1–13. [Google Scholar] [CrossRef]
- Zhou, S.; Liu, H.; Wang, B.; Chen, B.; Zhou, Y.; Chang, W. Public Norms in the Operation Scheme of Urban Rail Transit Express Trains: The Case of the Beijing Changping Line. Sustainability 2021, 13, 7187. [Google Scholar] [CrossRef]
- Qian, Y.; Da, C.; Zeng, J.; Wang, X.; Zhang, Y.; Xu, D. A bidirectional quasi-moving block cellular automaton model for single-track railways. Phys. A Stat. Mech. Its Appl. 2022, 598, 127327. [Google Scholar] [CrossRef]
- Niu, H.; Zhou, X. Optimizing urban rail timetable under time-dependent demand and oversaturated conditions. Transp. Res. Part C Emerg. Technol. 2013, 36, 212–230. [Google Scholar] [CrossRef]
- Sun, L.; Jin, J.G.; Lee, D.H.; Axhausen, K.W.; Erath, A. Demand-driven timetable design for metro services. Transp. Res. Part C Emerg. Technol. 2014, 46, 284–299. [Google Scholar] [CrossRef]
- Zhou, W.; Oldache, M. Integrated optimization of line planning, timetabling and rolling stock allocation for urban railway lines. Sustainability 2021, 13, 13059. [Google Scholar] [CrossRef]
- Gao, Y.; Kroon, L.; Schmidt, M.; Yang, L. Rescheduling a metro line in an over-crowded situation after disruptions. Transp. Res. Part B Methodol. 2016, 93, 425–449. [Google Scholar] [CrossRef]
- Jamili, A.; Aghaee, M.P. Robust stop-skipping patterns in urban railway operations under traffic alteration situation. Transp. Res. Part C Emerg. Technol. 2015, 61, 63–74. [Google Scholar] [CrossRef]
- Lee, E.H.; Lee, I.; Cho, S.-H.; Kho, S.-Y.; Kim, D.-K. A travel behavior-based skip-stop strategy considering train choice behaviors based on smartcard data. Sustainability 2019, 11, 2791. [Google Scholar] [CrossRef] [Green Version]
- Zwaneveld, P.J.; Kroon, L.G.; Van Hoesel, S.P.M. Routing trains through a railway station based on a node packing model. Eur. J. Oper. Res. 2001, 128, 14–33. [Google Scholar] [CrossRef] [Green Version]
- Liu, W.; Zhu, X.; Kang, L. Real-time track reallocation for emergency incidents at large railway stations. Math. Probl. Eng. 2015, 296394. [Google Scholar] [CrossRef] [Green Version]
- Xu, J.; Wang, Z.; Yao, S.; Xue, J. Train operations organization in high-speed railway station considering variable configuration. Sustainability 2022, 14, 2365. [Google Scholar] [CrossRef]
- Cao, Z.; Asakura, Y.; Tan, Z. Coordination between node, place, and ridership: Comparing three transit operators in Tokyo. Transp. Res. Part D Transp. Environ. 2020, 87, 102518. [Google Scholar] [CrossRef]
- Kurosaki, F. A comparative study of passenger through train operation between Japan and Europe. J. East. Asia Soc. Transp. Stud. 2017, 12, 316–330. [Google Scholar] [CrossRef]
- Kurosaki, F.; Higashino, S. A study of IC card systems within Japanese urban railway lines: Considering the Integration of Transportation Services. J. East. Asia Soc. Transp. Stud. 2019, 13, 397–413. [Google Scholar] [CrossRef]
- Ming, R.; Ye, X. Through operations between subways and suburban lines in Tokyo. Urban Mass Transit 2009, 12, 26–30. [Google Scholar]
- Yang, A.; Wang, B.; Huang, J.; Li, C. Service replanning in urban rail transit networks: Cross-line express trains for reducing the number of passenger transfers and travel time. Transp. Res. Part C Emerg. Technol. 2020, 115, 102629. [Google Scholar] [CrossRef]
- Le, M.; Wen, C.; Wang, N.; Yang, J.; Jiang, Y. Distribution design of cross line operation between Metro Line 4 and the Circle Line in Chongqing city. Urban Mass Transit 2020, 23, 14–17. [Google Scholar]
- Wang, C. Signal system for the cross-line operation of Guangzhou Metro Line 14 and Line 21. Urban Mass Transit 2017, 20, 36–38. [Google Scholar]
- Yang, C.; Yan, F.; Ukkusuri, S.V. Unraveling traveler mobility patterns and predicting user behavior in the Shenzhen metro system. Transp. A Transp. Sci. 2018, 14, 576–597. [Google Scholar] [CrossRef]
- Yong, N.; Ni, S.; Shen, S.; Chen, P.; Ji, X. Uncovering stable and occasional human mobility patterns: A case study of the Beijing subway. Phys. A Stat. Mech. Its Appl. 2018, 492, 28–38. [Google Scholar] [CrossRef]
- Kim, K. Exploring the difference between ridership patterns of subway and taxi: Case study in Seoul. J. Transp. Geogr. 2018, 66, 213–223. [Google Scholar] [CrossRef]
- He, B. Discussion upon the Calculation of Passenger Train Quantity Launched in Passenger Dedicated Lines. Railw. Transp. Econ. 2005, 2, 61–62+65. [Google Scholar]
- Matejka, F.; Mckay, A. Rational Inattention to Discrete Choices: A New Foundation for the Multinomial Logit Model. Am. Econ. Rev. 2015, 105, 272–298. [Google Scholar] [CrossRef] [Green Version]
- Kostrzewski, M. Implementation of distribution model of an international company with use of simulation method. Procedia Eng. 2017, 192, 445–450. [Google Scholar] [CrossRef]
- Available online: https://github.com/muxian123/The-four-fundamental-pieces-of-information-about-the-Chengdu-subway-network (accessed on 17 May 2022).


| Metro Line 1 | Metro Line 2 | ||||||||
|---|---|---|---|---|---|---|---|---|---|
| Upward Direction | Downward Direction | Upward Direction | Downward Direction | ||||||
| Station | Number of Passengers Getting on | Number of Passengers Getting Off | Number of Passengers Getting On | Number of Passengers Getting Off | Station | Number of Passengers Getting On | Number of Passengers Getting Off | Number of Passengers Getting On | Number of Passengers Getting Off |
| 1 | 1230 | 0 | 0 | 1290 | 8 | 0 | 1260 | 1290 | 0 |
| 2 | 1130 | 100 | 100 | 1190 | 9 | 100 | 1160 | 1190 | 100 |
| 3 | 1030 | 200 | 200 | 1090 | 10 | 200 | 1060 | 1090 | 200 |
| 7 | 2460 | 2190 | 2370 | 2280 | 7 | 2280 | 2460 | 2190 | 2370 |
| 4 | 200 | 1120 | 1060 | 200 | 11 | 1120 | 200 | 200 | 1030 |
| 5 | 100 | 1220 | 1160 | 100 | 12 | 1220 | 100 | 100 | 1130 |
| 6 | 0 | 1320 | 1260 | 0 | 13 | 1320 | 0 | 0 | 1230 |
| Metro Line 1 Section | Section Flow of Upward Direction (Trips per Hour) | Section Flow of Downward Direction (Trips per Hour) | Metro Line 2 Section | Section Flow of Upward Direction (Trips per Hour) | Section Flow of Downward Direction (Trips per Hour) |
|---|---|---|---|---|---|
| 1–2 | 1230 | 1290 | 8–9 | 1290 | 1260 |
| 2–3 | 2260 | 2380 | 9–10 | 2380 | 2320 |
| 3–7 | 3090 | 3270 | 10–7 | 3270 | 3180 |
| 7–4 | 3360 | 3180 | 7–11 | 3090 | 3360 |
| 4–5 | 2440 | 2320 | 11–12 | 2260 | 2440 |
| 5–6 | 1320 | 1260 | 12–13 | 1230 | 1320 |
| Potential Transfer Demand of Possible Directions of Cross-Line Train | Potential Transfer Demand of Impossible Directions of Cross-Line Train | |||||||
|---|---|---|---|---|---|---|---|---|
| Direction A | Direction B | Direction C | Direction D | Direction E | Direction F | Direction G | Direction H | |
| Potential transfer demand (trips per hour) | 990 | 1260 | 1080 | 1170 | 900 | 900 | 900 | 900 |
| Transaction Date | Enter Time | Enter Station Name | Exit Time | Exit Station Name |
|---|---|---|---|---|
| 20210423 | 10:53:02 | Xipu | 11:17:08 | Tianfu square |
| 20210423 | 19:37:08 | Xipu | 20:14:03 | Tianfu square |
| 20210423 | 11:15:07 | Tianfu square | 11:22:21 | Xipu |
| 20210423 | 08:15:16 | Tianfu square | 08:50:02 | Xipu |
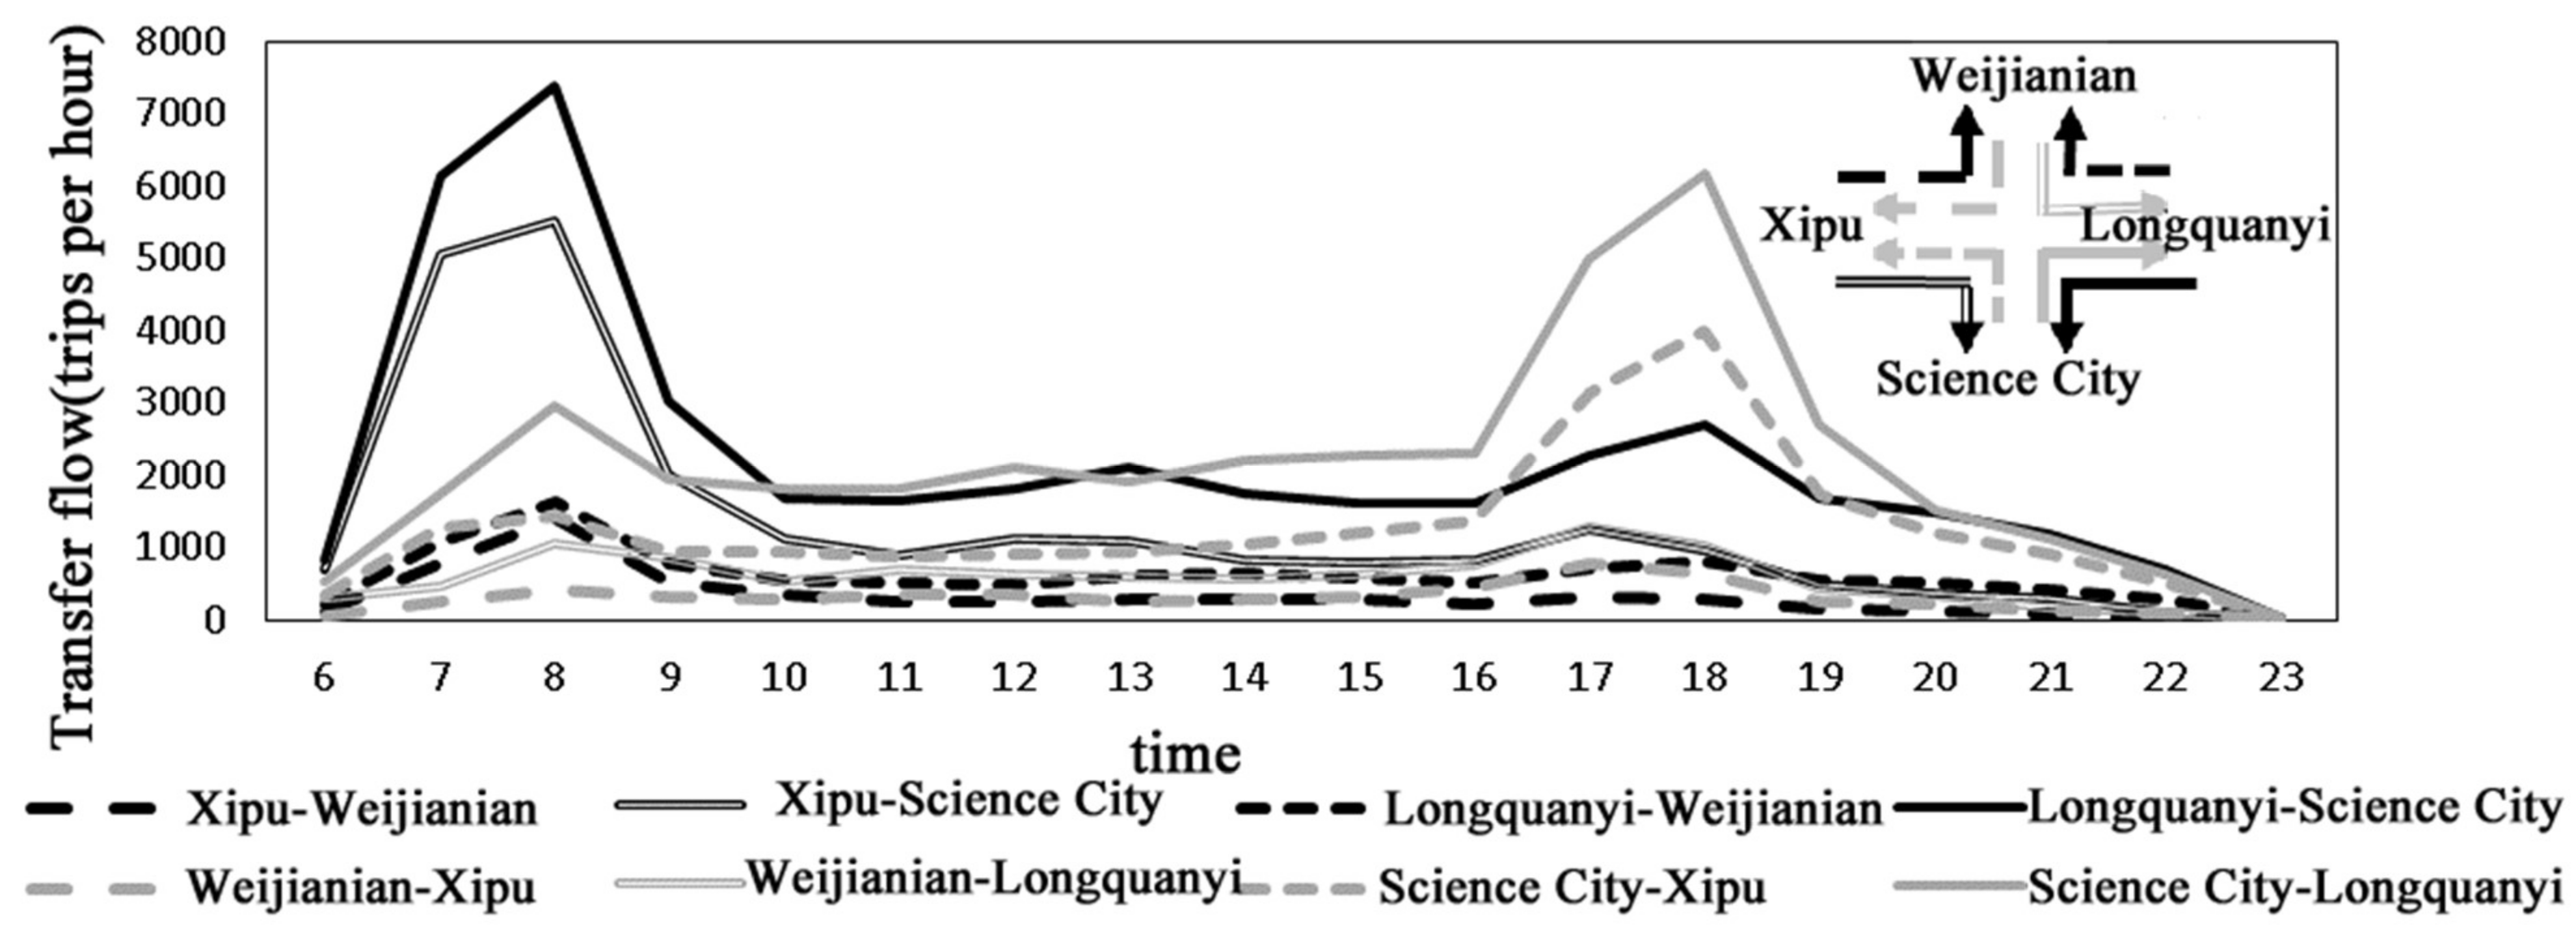
| Transfer Flow during Morning Rush Hour (Trips per Hour) | Transfer Flow during Evening Rush Hour (Trips per Hour) | |
|---|---|---|
| Xipu-Weijianian | 1403 | 288 |
| Xipu-Science City | 5520 | 974 |
| Longquanyi-Weijianian | 1633 | 808 |
| Longquanyi-Science City | 7394 | 2700 |
| Weijianian-Xipu | 415 | 662 |
| Weijianian-Longquanyi | 1054 | 1031 |
| Science City-Xipu | 1440 | 3985 |
| Science City-Longquanyi | 2966 | 6171 |
| Number of Trains (Trains per Hour) | Running Time Interval (min) | ||
|---|---|---|---|
| Metro Line 1 | Before operating cross-line | 26 | 2.3 |
| After operating cross-line | 21 | 2.9 | |
| Metro Line 2 | Before operating cross-line | 17 | 3.5 |
| After operating cross-line | 12 | 5 | |
| Cross-line routing | Before operating cross-line | - | - |
| After operating cross-line | 5 | 12 | |
| Subway Station Name | Subway Station Location |
|---|---|
| Mian shang yin xing zhan | POINT(104.538370 30.410898) |
| San yuan wai guo yu xue xiao zhan | POINT(104.153051 30.789908) |
| Da yuan | POINT(104.043775 30.552330) |
| Mu hua lu | POINT(104.008817 30.487746) |
| Nan xun da dao | POINT(103.849654 30.692276) |
| Xiang cheng xiao xue zhan | POINT(104.180097 30.805446) |
| Guang zhou lu | POINT(104.074757 30.421508) |
| Subway Line | Direction | Subway Line location |
|---|---|---|
| Metro Line 10 | 0 | LINESTRING(104.019205 30.627921,104.018534 30.627220,...) |
| Metro Line 10 | 1 | LINESTRING(103.779287 30.411013,103.781375 30.413648,...) |
| Metro Line 17 | 0 | LINESTRING(103.976043 30.647566,103.974564 30.647177,...) |
| Metro Line 17 | 1 | LINESTRING(103.791832 30.758752,103.792310 30.758067,...) |
| Metro Line 18 | 1 | LINESTRING(104.065209 30.606333,104.065229 30.605643,...) |
| Metro Line 18 | 0 | LINESTRING(104.452430 30.336950,104.451925 30.335890,...) |
| Stations of Chengdu Metro Line 2 | |||
|---|---|---|---|
| Subway Station Name | ID | Subway Station Name | ID |
| Xi pu | 1 | Dong men da qiao | 17 |
| Tian he lu | 2 | Niu wang miao | 18 |
| Bai cao lu | 3 | Niu shi kou | 19 |
| Jin zhou lu | 4 | Dong da lu | 20 |
| Jin ke bei lu | 5 | Ta zi shan gong yuan | 21 |
| Ying bin da dao | 6 | Cheng dong dong ke zhan | 22 |
| Cha dian zi ke yun zhan | 7 | Cheng yu li jiao | 23 |
| Yang xi li jiao | 8 | Hui wang ling | 24 |
| Yi pin tian xia | 9 | Hong he | 25 |
| Shu han lu dong | 10 | Cheng dong xing zheng xue yuan | 26 |
| Bai guo lin | 11 | Da mian pu | 27 |
| Zhong yi da sheng yi yuan | 12 | Lian shan po | 28 |
| Tong hui men | 13 | Jie pai | 29 |
| Ren min gong yuan | 14 | Shu fang | 30 |
| Tian fu guang chang | 15 | Long ping lu | 31 |
| Chun xi lu | 16 | Long quan yi | 32 |
| Section Name (Downward Direction) | Travel Time (min) | Section Name (Upward Direction) | Travel Time (min) |
|---|---|---|---|
| Xi pu—Tian he lu | 3 | Tian he lu—Xi pu | 3 |
| Tian he lu—Bai cao lu | 3 | Bai cao lu—Tian he lu | 3 |
| Bai cao lu—Jin zhou lu | 3 | Jin zhou lu—Bai cao lu | 3 |
| Jin zhou lu—Jin ke bei lu | 2 | Jin ke bei lu—Jin zhou lu | 2 |
| Transfer Station | Transfer Line 1 | Transfer Line 2 | Maximum Section Flow (Trips per Hour) | Number of Trains for Cross-Line Operation (Trains per Hour) | Number of Trains for Transfer Line 1 after Running Cross-Line Train (Trains per Hour) | Number of Trains for Transfer Line 2 after Running Cross-Line Train (Trains per Hour) |
|---|---|---|---|---|---|---|
| North railway station | Metro line 1 | Metro line 7 | 23,934 | 18 | 8 | 1 |
| Xibo city | Metro line 1 | Metro line 6 | 16,710 | 13 | 13 | 1 |
| Xibo city | Metro line 1 | Metro line 18 | 14,902 | 11 | 15 | 1 |
| South railway station | Metro line 1 | Metro line 7 | 13,024 | 10 | 16 | 9 |
| South railway station | Metro line 1 | Metro line 18 | 11,727 | 9 | 17 | 3 |
| Chengdu east railway station | Metro line 2 | Metro line 7 | 10,277 | 8 | 9 | 11 |
| Haichang road | Metro line 1 | Metro line 18 | 10,253 | 8 | 18 | 4 |
| Yipintianxia | Metro line 2 | Metro line 7 | 10,088 | 8 | 9 | 11 |
| Peopel north road | Metro line 1 | Metro line 6 | 9948 | 8 | 18 | 6 |
| Sima bridge | Metro line 3 | Metro line 7 | 9855 | 7 | 11 | 12 |
| Luoma city | Metro line 1 | Metro line 4 | 9384 | 7 | 19 | 4 |
| Kuishudian | Metro line 4 | Metro line 7 | 8994 | 7 | 4 | 12 |
| North station west second road | Metro line 5 | Metro line 7 | 8463 | 6 | 9 | 13 |
| Taiping garden | Metro line 3 | Metro line 7 | 8160 | 6 | 12 | 13 |
| Xipu | Metro line 2 | Metro line 6 | 7585 | 6 | 11 | 8 |
| Incubation park | Metro line 1 | Metro line 18 | 7451 | 6 | 20 | 6 |
| Niuwang temple | Metro line 2 | Metro line 6 | 7065 | 5 | 12 | 9 |
| Huilong | Metro line 5 | Metro line 6 | 6693 | 5 | 10 | 9 |
| Palace of culture | Metro line 4 | Metro line 7 | 6442 | 5 | 6 | 14 |
| Provincial gymnasium | Metro line 1 | Metro line 3 | 6248 | 5 | 21 | 13 |
| Tianfu square | Metro line 2 | Metro line 1 | 6171 | 5 | 12 | 21 |
| Tcm provincial hospita | Metro line 2 | Metro line 4 | 5510 | 4 | 13 | 7 |
| South railway station | Metro line 18 | Metro line 7 | 5476 | 4 | 8 | 15 |
| Southwest jiaotong university | Metro line 6 | Metro line 7 | 5346 | 4 | 10 | 15 |
| The Top 3 Transfer Stations with the Largest Number of People Entering and Exiting | Maximum Section Flow (Trips per Hour) | The Top 3 Transfer Stations with the Largest Passenger Section Flow | Maximum Section Flow (Trips per Hour) |
|---|---|---|---|
| North railway station | 23,934 | Shiji city station | 5113 |
| Xibo city | 16,710 | Fuhuayuan station | 7451 |
| South railway station | 13,024 | Chunxi road station | 2653 |
Publisher’s Note: MDPI stays neutral with regard to jurisdictional claims in published maps and institutional affiliations. |
© 2022 by the authors. Licensee MDPI, Basel, Switzerland. This article is an open access article distributed under the terms and conditions of the Creative Commons Attribution (CC BY) license (https://creativecommons.org/licenses/by/4.0/).
Share and Cite
Li, M.; Li, H. Optimal Design of Subway Train Cross-Line Operation Scheme Based on Passenger Smart Card Data. Sustainability 2022, 14, 6420. https://doi.org/10.3390/su14116420
Li M, Li H. Optimal Design of Subway Train Cross-Line Operation Scheme Based on Passenger Smart Card Data. Sustainability. 2022; 14(11):6420. https://doi.org/10.3390/su14116420
Chicago/Turabian StyleLi, Maosheng, and Hangcong Li. 2022. "Optimal Design of Subway Train Cross-Line Operation Scheme Based on Passenger Smart Card Data" Sustainability 14, no. 11: 6420. https://doi.org/10.3390/su14116420
APA StyleLi, M., & Li, H. (2022). Optimal Design of Subway Train Cross-Line Operation Scheme Based on Passenger Smart Card Data. Sustainability, 14(11), 6420. https://doi.org/10.3390/su14116420