Next Article in Journal
Water Footprint as a Tool for Selection of Alternatives (Comments on “Food Recommendations for Reducing Water Footprint”)
Next Article in Special Issue
Correction: Nasiri et al. Impact of Policy Instruments in the Implementation of Renewable Sources of Energy in Selected European Countries. Sustainability 2022, 14, 6314
Previous Article in Journal
Towards Sustainable Road Safety in Saudi Arabia: Exploring Traffic Accident Causes Associated with Driving Behavior Using a Bayesian Belief Network
 
 
Correction published on 26 August 2022, see Sustainability 2022, 14(17), 10636.
Article

Impact of Policy Instruments in the Implementation of Renewable Sources of Energy in Selected European Countries

1
Department of Law, Faculty of Humanities, Islamic Azad University, Tehran North Branch, Vafadar Blvd., Shahid Sadoughi St., Hakimiyeh Exit, Shahid Babaee Highway, Tehran 1651153311, Iran
2
Biomass & Bioenergy Research Group, Center for Sustainable Energy and Power Systems Research, Research Institute of Sciences and Engineering, University of Sharjah, Sharjah 27272, United Arab Emirates
3
Institute of Forestry and Engineering, Chair of Biosystems Engineering, Estonian University of Life Sciences, Kreutzwaldi 56, 51006 Tartu, Estonia
4
Department of Sustainable and Renewable Energy Engineering, University of Sharjah, Sharjah 27272, United Arab Emirates
*
Authors to whom correspondence should be addressed.
These authors contributed equally to this work.
Sustainability 2022, 14(10), 6314; https://doi.org/10.3390/su14106314
Submission received: 8 April 2022 / Revised: 18 May 2022 / Accepted: 19 May 2022 / Published: 22 May 2022 / Corrected: 26 August 2022
(This article belongs to the Special Issue The Role of Biorefineries in Circular Economy)

Abstract

:
Nowadays, great attention has been paid to alternative sources of energy that can be used as a replacement for fossil fuels and help to reduce their utilization in the overall energy mix. In Europe, the development and implementation of renewable sources of energy is regulated and supported by legal frameworks. This paper investigates the impact of European Directives and its transposition to national policies on the share of renewable sources of energy in electricity, heating and cooling, and transport in Denmark, Ireland, the Netherlands, Estonia, Latvia, and Lithuania. For this, quantitative and qualitative data were utilized. The quantitative data refer to the gross energy consumption, energy consumption for heating and cooling purposes (by category), and energy consumption in the transportation sector, while the qualitative data refer to the main directives and legal frameworks utilized to regulate the utilization and implementation of renewable energy in the selected countries. The results of this study show that the European Directives are not as effective as expected in the promotion and adoption of renewable sources of energy. Although none of the countries investigated in this paper were able to achieve the 10% share of energy produced from renewable sources for the transportation sector, certain goals were still achieved. For instance, in 2018, 6.57% of the energy utilized in the transportation sector in Denmark was from renewable sources, while in Estonia it was 3.29%, in Ireland 7.17%, in Latvia 4.73%, in Lithuania 4.33%, and in the Netherlands 9.59%. These results suggest that the current regulations should be revised and that clear, accountable, and predictable regulations should be put in place to ensure the energetic independence in Europe.

1. Introduction

In the past decade, environmental pollution has risen due to the increased consumption of fossil fuels and non-renewable natural resources. The dire consequences of continuing such behavior are well known. Thus, as an alternative source of energy, renewable energy representatives are expanding and playing a major role in the global energy trend.
The worldwide additions in renewable energy capacity can outstrip those in fossil-based energy generation [1,2]. However, this transformation of the energy system requires phasing out the predominant energy sources, including fossil fuels, which will ensure a low-carbon and clean future for everyone on the planet [3].
Most of this transition needs additional attention and perspective to guide the process and to make sure to complete the transition from a centralized towards a decentralized energy system. In a centralized energy system, the focus is on the fossil fuels that are produced in limited countries around the world. Natural, renewable sources however, are decentralized and can be produced anywhere, using the local resources. The transition to renewable energy (RE) also shows the need for new roles and opportunities for governments and countries to advance their energy resources [4]. Nevertheless, the growth of renewable energy markets remains a policy-driven phenomenon. [5]. New developments always need standards, rules, and legislation to help this transition in the best possible way and lead it to satisfactory results. However, decision-making can be diverse in different organizational forms [6,7]. In some countries around the world, the use of renewable energies is a must rather than the fossil fuel. Meanwhile, the number of countries that have supported these policies varies, and it is not possible to point out a common rule among them. This shows that the continuous need for making policies towards promoting renewables should not be forgotten [8] and still requires great attention.
As the generation and use of biofuels are increasing day by day, policy dismantling in the renewable energy sector represents an important knowledge gap. Meanwhile, the EU is promoting renewable energy usage, primarily towards the reduction of greenhouse gas (GHG) emissions [9,10]. Given the recast of European Union (EU) Directives, under bioenergy which leads to clean energy, each member state has created their national legislations, which should be enclosed as a framework promoting the existing regulations the best way possible to come up with united and effective rules [11,12]. This will provide a starting point to implement an act and/or remove the existing regulations to improve the legal framework for each EU member state.
It has been reported by Bórawski et al. [13] that energy policy is the most important factor when it comes to climate change and Europe will be able to achieve its transportation sector targets only by developing consistent support schemes, and by allowing the countries to have independent policies and support schemes. An empirical study developed by Marques & Fuinhas [14] on the effectiveness of public policies in the deployment of renewable sources of energy. The authors concluded that policies, such as quotas and tradable certificates are not effective in the implementation of renewables, while subsidies and feed-in tariffs are effective. However, the adoption of renewable sources of energy depends on the country’s energetic dependence. The research done by Papież et al. [15] showed that countries without local fossil fuels invested more in the development and implementation of renewable sources of energy. However, emphasize done by Tutak & Brodny [16] on the importance of developing new financial and support schemes for specific economic sectors and countries with similar characteristics, and Brodny et al. [17] highlighted the need of educating local communities for the adoption of renewables, since some countries still face social resistance.
Several gaps identified by Singh et al. [18] when it comes to the biomass value chain and their implications in meeting the bioeconomy objectives, such as decreasing the dependence on non-renewable sources of energy. The authors reported that some of the biomass, bioprocessing, and bio-based products policies are not consistent with the bioeconomy goals and are not interconnected with each other. Policy gaps were identified in the land use, biomass production, feedstock conversion, and end use. Panoutsou et al. [19] identified challenges and policy gaps that limit the decarbonization of the European transportation sector, as well as the adoption and utilization of advanced biofuels. The authors reported that advances biofuels still have policy gaps concerning feedstock production and conversion, and end use. Investigation on the effectiveness of the European Renewable Directive II done by Mai-Moulin et al. [20]. The authors concluded that not all the sustainability risks on bioenergy are addressed on this directive, and that further clarifications and criteria are required, especially when it concerns biomass feedstocks.
Another challenge that Europe is facing refers to energy security and high energy costs, caused mainly by the invasion of Ukraine by Russia. With this, a significant number of countries worldwide have imposed, among others, sectoral sanctions on energy imports from Russia. This has led to a search for alternative, secure, and reliable sources of energy that will ensure energetic independence in the entire European continent, while also achieve the climate change goals. This research is of especially interest to all European stakeholders, policy makers, government entities, and the European Commission, since in 2020, 57.5% of the European energy sector was still highly dependent on imports. For instance, the import dependency rate for crude oil was 96.2%, and for natural gas 83.6% [21]. As a result, this research highlights the gaps and limitations of the energetic legal frameworks in Europe and their impact in achieving energetic independence. A concrete analysis of energetic legal framework in Europe is carried out, and an identification of their relevance to the transition to an independent and low carbon society is provided.
This paper aims to investigate the influence of European and National regulatory frameworks in the production and consumption of renewable sources of energy in six EU member states, three located in the Baltic region (Estonia, Latvia, and Lithuania) and three located in Western Europe (Denmark, Ireland, and Netherlands). For this, a qualitative analysis of the directives and legal frameworks was performed, as well as a quantitative analysis of the amount of energy used for electricity, heating and cooling, and transport sectors. This study aims to:
(1) identify the key support schemes and regulation mechanisms that are currently being used in Estonia, Latvia, Lithuania, Denmark, Ireland, and Netherlands for the promotion and implementation of renewable sources of energy.
(2) analyze the effectiveness and relevance of these legal frameworks in the introduction of renewable sources of energy in the overall energy mix.
Although there is some research available on the challenges and policy related gaps, none of the papers reported in the literature, effectively compare the effect of the policies and/or support schemes available for the electricity, heating and cooling, and transport sectors with changes in the energy consumption and supply. Table 1 highlights the novelty of this paper, when compared to other studies found in the literature.

2. Legal Framework

When it comes to the legal framework of renewable energy production, political factors are the most important component for the development of renewable energy policies. These policies are directly connected to the ideologies of the government and how strongly they support the implementation of RES. Besides the national political vision, the implementation of legal frameworks for the development and support of RES will depend on the international obligations and agreements (e.g., the Paris Agreement) that each country has. Finally, the availability of natural resources and technologies in each country will also influence the amount of energy that will be generated from RES. This means that countries with plentiful natural resources are expected to have a higher RES production [24,25,26,27,28,29].
To achieve the goals set in the European legal framework towards energy security and sustainability, the European Commission envisions that all the different sectors of the economy must efficiently produce their energy, coupled with a decrease in the overall consumption. As a result, there is a search for renewable sources of energy, and low-carbon conversion technologies for production of electricity, heating, and cooling. The transportation sector is also expected to follow this trend and switch to alternative fuels that will contribute to the decarbonization of the transportation sector [30,31]. Table 2 summarizes the main support schemes currently available in Estonia, Latvia, and Lithuania, Denmark, Ireland, and Netherlands to produce electricity, heating and cooling, and transport.

2.1. Electricity

The main European policies that are used to regulate the electricity sector in the European Union are: (1) Directive 2009/28/EC [32]; (2) Directive 2015/1513/EC [33] Amending Directive 98/70/EC relating to the quality of petrol and diesel fuels and amending Directive 2009/28/EC on the promotion of the use of energy from renewable sources; (3) and Directive 2018/2001/EC [34], on the promotion of the use of energy from renewable sources (recast). This last Directive (2018/2021) has as a main target objective the production of 32% of the energy from renewable sources of energy by 2030. In addition, it promotes the utilization of biofuels in the transportation sector, encourages the adoption of heat pumps, geothermal energy, and solar technologies, and supports the consumers to become prosumers [35]. When transported to the national level, these Directives are promoted using mainly seven different schemes: premium tariff, feed-in tariff, net-metering, loan (climate change special program), sliding feed-in premium, subsidy, and tax regulation mechanisms.

2.1.1. Premium Tariff

Premium tariff is a scheme used to promote the production of electricity from renewable sources of energy. In Denmark, premium tariff and net-metering are the main initiatives schemes used for this end. The premium tariff uses the Decree on the Promotion of Renewable Energy Act (Bekendtgørelse af lov om fremme af vedvarende energi, LBK No. 1194 of 28 Sepetember 2018) as the national legal framework for the promotion of the generation of electricity from renewable sources of energy. This Law covers offshore and onshore wind plants, solar, biogas conventional hydro-electric power plants, wave power plants, and biomass technologies. Premium tariff is awarded through maximum bonus or guaranteed bonus, in different amounts depending on the type of commissioning, installed capacity and grid connection date. This tariff is paid to the owners of the plants.
In the Netherlands, the legal framework that regulates the premium tariff is the Renewable Energy Production Incentive Scheme 2007 (SDE+, Besluit stimulering duurzame energieproductie 2007). This scheme supports the producers of renewable electricity and remunerates the price difference between the cost of producing electricity, heat, and gas, from non-renewables and the price of producing them from renewable sources of energy. The premium tariff in the Netherlands is available for wind plants (onshore wind plants, wind in dams, wind in lake, and offshore wind plants), solar, biogas (biogas fermentation, biomass gasification, RWZI Improved Sludge Fermentation), hydro-electric power plants (with a head of at least 50 cm, hydro-electric power plants with a head lower than 50 cm, osmosis), and biomass technologies (fermentation combined heat and power, RWZI Improved Sludge Fermentation combined heat and power, and Thermal Conversion CHP). Depending on the type of technology, and installed capacity, the premium tariff can provide a support between €ct 4.6 per kWh and €ct 13.0 per kWh to private individuals, companies, or institutions that fit the requirements. This scheme is obligatory provided by the Netherlands Enterprise Agency.
The Estonian premium tariff is regulated by the Electricity Market Act (ELTS, Elektrituruseadus RT I 2003, 25, 153 ELTS) and it supports wind energy, solar energy, geothermal energy, biogas, hydropower, and biomass. However, when compared to Denmark and the Netherlands, the premium tariff in Estonia seems to be less complex, and it has a fixed amount of support for all the technologies (€ct 5.37 per kWh). This tariff is paid to energy producers by the transmission system operator.
According to this research, Ireland, Latvia, and Lithuania do not have premium tariff implemented.

2.1.2. Feed-In Tariff

The feed-in tariff, also called renewable energy feed-in-tariff (REFIT), was a scheme that supported the purchase of electricity produced from renewable sources of energy. It was suspended in Latvia and discontinued in Ireland from 2015. A new support scheme was introduced in Ireland in 2019.

2.1.3. Net-Metering

In Denmark, net-metering and premium tariff are the most common schemes used to encourage the production of electricity from renewable sources of energy. This scheme is supported by the Decree on Net-metering for the Producers of Electricity for Own Needs (BEK 999/2016, Bekendtgørelse om nettoafregning for egenproducenter af elektricitet). In net-metering, some renewable energy plants are exempt of paying levies, or have lower taxes. Energy producers that use electricity produced by their own plants can be partially or totally exempt from levies. This scheme supports wind energy (with an installed capacity inferior of superior to 25 kW), solar energy (with an installed capacity inferior of superior to 50 kW), biogas (with an installed capacity inferior of superior to 11 kW), hydropower (with an installed capacity inferior of superior to 11 kW), and energy from biomass (with an installed capacity inferior of superior to 11 kW). The costs of the net-metering system are covered by the budget managed by Danish Energy Agency.
The Dutch net-metering scheme is supported by the Electricity Act (Elektriciteitswet 1998), and it regulates the production, transmission, and sale of electricity. All small-scale energy technologies (≤3 × 80A) are eligible in this scheme (wind energy, solar energy, geothermal energy, biogas, hydropower, and biomass). The amount of money to be paid to the producers will depend on the amount of electricity added to the grid and the amount of electricity consumed by the producers.
The Latvian net-metering is promoted by the Electricity Market Law (Elektroenerģijas tirgus likums) and similarly to the Netherlands, it supports all the small-scale connection technologies; however, in practice, this scheme applies mainly to photovoltaic installations. Net-metering in Latvia is not supported through financial compensations but by deducting the kW of injected electricity from the overall electricity bill.
In Lithuania, the Law on Energy from Renewable Sources (Atsinaujinančių išteklių energetikos įstatymas) establishes a general legal framework for the promotion of RES and it supports wind energy, solar energy, and biomass technologies. This scheme exempts electricity producers from levies, although they are still required to pay the fee for the use of the electricity grid.
Ireland and Estonia do not have net-metering schemes.

2.1.4. Loan (Climate Change Special Programme)

The European Commission Implementing Regulation (EU) 2018/1999 regarded of governance of the Energy Union and Climate actions has set necessary legislative foundations for a cost-efficient shift to achieve the 2030 goals. The aim is to support the renewable energy development across the member states to enable the frameworks, by providing supports in the form of financial instrument such as low interest loans [36].
The loan scheme is available only in Denmark, Netherlands and Lithuania. In Denmark, this scheme is specifically designed for the construction of onshore wind-energy plants with an installed capacity inferior to 25 kW, or eligible offshore wind energy plants. Solar energy is also an eligible technology for this scheme, which supports projects up to 500,000 DKK (approx. €67,260). This scheme is supported by the Danish Decree on the Electricity Supply Act (1009/2018) (Bekendtgørelse af lov om elforsyning). In the Netherland, the loan scheme is broader than in Denmark, and it supports all the RES-E technologies with exception of biomass and biogas. The loan in the Netherlands is supported by the Regulation Green Projects 2016 (Regeling Groenprojecten 2016) and it authorizes banks to provide loans with lower interest rate.
Finally, the Lithuanian loan for climate change special programme supports geothermal energy, wind energy, solar energy, biogas, hydropower, and biomass through the Law on Financial Instruments for Climate Change Management (Klimato kaitos valdymo finansinių instrumentų įstatymas), and the Order No. D1-275/20 that establishes the guidelines for the use of the fund (Klimato kaitos specialiosios programos lėšų naudojimo tvarkos aprašas). The loan scheme does not have a maximum amount of credit, but the credit institutions should provide at least 20% of the loan under this regulation.

2.1.5. Sliding Feed-In Premium

The sliding feed-in premium is a scheme available only in Lithuania under the Law of the Republic of Lithuania on Energy from Renewable Sources (Atsinaujinančių išteklių energetikos įstatymas), Resolution No. 916/2012 that establishes the rules for the provision of services in the electricity sector (Viešuosius interesus atitinkančių paslaugų elektros energetikos sektoriuje teikimo tvarkos aprašas), Resolution No. 827/2012 that rules the produce for the use of renewable sources of energy (Atsinaujinančių energijos išteklių naudojimo energijai gaminti skatinimo tvarkos aprašas), and Resolution No. O3E-171/2018 that defines the tariffs for electricity produced from renewable sources of energy (Dėl elektros energijos, pagamintos naudojant atsinaujinančius energijos išteklius, tarifų nustatymo 2018 metų II pusmečiui). Wind energy, solar energy, biogas, hydropower, and biomass are the eligible technologies under this scheme, with a paid market price between €0.052 per kWh and €0.169 per kWh, depending on the type of technology, and installed capacity.

2.1.6. Subsidies

The subsidy scheme is only available in Ireland and Lithuania. In Ireland this subsidy only supports the purchase and installation of solar energy technology, Solar PV systems are supported in the total amount of €700/kWp (up to 2 kWp) and battery storage in the total amount of €1000 (up to 4 kWp). In Lithuania, the subsidy scheme (LEIF) is regulated by the Statutes of the LEIF, and the Order No. 437/2003, and it incentivizes the production of electricity from wind energy, solar energy, biogas, hydropower, and biomass, in a total amount of €200,000.

2.1.7. Tax Regulation Mechanisms

Tax regulation mechanisms are currently available in the Netherlands and Lithuania. In the Netherlands there are two different tax regulation mechanisms (I—for reduction of environmental protection tax, and II—Energy Investment Allowance, EIA scheme. The tax regulation mechanism I exempts electricity consumers from paying tax regulation mechanism in case they consume their own renewable electricity. The eligible technologies for this mechanism are solar energy, geothermal energy, biogas, hydropower, and biomass. The incentive can vary between €ct 0.06 per kWh and €ct 10.46 per kWh, depending on the amount of electricity consumed. The tax regulation mechanism II allows entrepreneurs to get the investments in renewable energy deducted for tax purposes. In this scheme only wind energy, solar energy, and biomass technologies are eligible. Tax regulation mechanism I and II are supported by the Act on the Environmental Protection Tax (WBM, Wet belastingen op milieugrondslag), Act on the Income Tax (Wet IB 2001, Wet inkomstenbelasting 2001), and Energy List 2018 (Energielijst 2018).
In Lithuania there is only one tax regulation mechanism supported by the Law of the Republic of Lithuania on Excise Taxes (Akcizų įstatyma). This scheme exempts wind energy, solar energy, geothermal energy, biogas, hydropower, and biomass from excise duty and it subsidises the generated renewable energy between €0.52 per MWh and €1.01 per MWh, depending on the end uses (personal or business).

2.1.8. Tenders

Tenders are the last support scheme that is currently used to promote the usage and production of renewable electricity. In Denmark, the tender scheme supports only pilot windmills, in which the Government of Denmark has allocated DKK 150 million (approx. €20 million) distributed on a first-come, first-served basis as long as the tender requirements are respected. This scheme is regulated by the Political Agreement about new wind and solar support model in 2018–2019 (Stemmeaftale Mellem Regeringen (Venstre, Liberal Alliance, Det Konservative Folkeparti) og Dansk Folkeparti om ny støttemodel for vind og sol i 2018–2019), and the Decree on the Promotion of Renewable Energy Act (Ve-Lov, Bekendtgørelse af lov om fremme af vedvarende energi). In the Netherlands, the tender scheme supports only offshore wind energy in which the subsidy to be paid to the producers is the difference between the tender amount and the basic energy price. The Government is aiming to increase the offshore wind production from 1000 MW in 2013 to 4500 MW in 2023. This scheme is supported by the Dutch Renewable Energy Production Incentive Scheme 2007 (SDE+, Besluit stimulering duurzame energieproductie 2007).
Finally, in Lithuania this scheme subsidizes wind energy, solar energy, biogas, hydropower, and biomass, under the Law of the Republic of Lithuania on Energy from Renewable Sources (Atsinaujinančių išteklių energetikos įstatymas), Resolution No. O3-229/2011, Resolution No. O3E-171/2018, Resolution No. 827/201, and Resolution No. 916/201. The operator that submits a proposal with the lowest tariff rate will be the winner of the tender.

2.2. Heating and Cooling System

2.2.1. Premium Tariff

Similarly to the electricity sector, the utilization of renewable sources of energy for heating and cooling systems (RES-H&C) are supported by premium tariff price-based mechanisms, subsidy, tax regulation mechanisms, and loan. The premium tariff is available in Denmark, Lithuania, and Netherlands.
In Denmark, this scheme is regulated by the Decree on the Promotion of Renewable Energy Act (VE-Lov, Bekendtgørelse af lov om fremme af vedvarende energi) and it supports only biogas technologies for heating purposes. The users of biogas for heating purposes will be paid between DKK 26 (€3.5) per gigajoule biogas and DKK 10 (€1.34) per gigajoule biogas.
In Lithuania, this scheme supports independent producers of aerothermal energy, hydrothermal energy, biogas, biomass, geothermal energy, and solar energy. Eligible producers should meet at least one of the following conditions: building of the heat plant was financed by the National, municipal grants or subsidies; the electricity produced by individual heat producers is incentivized by the fixed tariff to encourage the utilization of RES; the heat producer makes more than one third of the yearly amount of heat using only one heat supply system.
The Dutch premium tariff (SDE+) is supported by three different legal sources: the Renewable Energy Production Incentive Scheme 2007 (Besluit stimulering duurzame energieproductie 2007), the regulation designating sustainable energy production categories (RAC 2018, Regeling aanwijzing categorieën duurzame energieproductie 2018) and the Regulation implementing sustainable energy production (RISEP, Algemene uitvoeringsregeling stimulering duurzame energieproductie). This scheme supports biogas (between €ct 4.6 per kWh and €ct 9.2 per kWh), biomass (between €ct 3.3 per kWh and €ct 10 per kWh), geothermal energy (between €ct 3.4 per kWh and €ct 6.0 per kWh), and solar thermal energy (between €ct 8.3 per kWh and €ct 9.4 per kWh).

2.2.2. Feed-In Tariff

The feed-in tariff for heating and cooling systems is available only in Lithuania. This mechanism is reinforced by the Law of the Republic of Lithuania on Energy from Renewable Sources (Atsinaujinančių išteklių energetikos įstatymas) that creates the legal framework for the support of RES, and the Resolution No. O3E-524/2017 (Nutarimas dėl biodujų supirkimo į gamtinių dujų sistemas tarifų galiojimo pratęsimo 2018 metams) that establishes the feed-in tariff charges for the biogas supplied to the natural gas system. This scheme only supports the production of biogas and it allows producers to inject their biogas into the natural gas systems. This tariff is set in annually for biogas produced from landfills (with a plant capacity inferior to 1300 kWh/hour: 0.034 per kWh, and with a plant capacity superior to 1300 kWh/hour: 0.026 per kWh), or from biogas produced from anaerobic digestion (with a plant capacity inferior to 1300 kWh/hour: 0.072 per kWh; with a plant capacity between 1300 kWh/hour and 2600 kWh/hour: 0.062 per kWh; with a plant capacity between 2600 kWh/hour and 5200 kWh/hour: 0.059 per kWh; and with a plant capacity superior to 5200 kWh/hour: 0.057 per kWh).

2.2.3. Subsidies

Subsidies are very common schemes to support the promotion of RES-H&C. At the moment, this scheme is available only in Ireland, the Netherlands, Estonia, and Lithuania. In Ireland there are two different subsidies: Subsidy I—Better Energy Homes Scheme-Solar Water Heating Grant, and Subsidy II—Support Scheme Renewable Heat. Subsidy I is managed by the Sustainable Energy Authority of Ireland (SEAI) and it is a €1200 grant used to support the installation of solar thermal energy. Subsidy II, is a scheme from the Department of Communications, Climate Change and the Environment (DCCAE) regulated by the SSRH Terms & Conditions and the SSRH Grant Scheme Operating Rules and Guidelines. This subsidy supports up to 30% of the eligible costs associated to aerothermal energy, hydrothermal energy, and geothermal energy.
In the Netherlands the available subsidy is regulated by the Investment Subsidy Renewable Energy (ISDE, Investeringssubsidie Duurzame Energie) and it incentivizes the production of solar energy (solar thermal boilers with a maximum total surface of 200 m2), geothermal energy (heat pumps with a maximum capacity of 70 kW), and biomass (boilers and pellet stoves).

2.2.4. Tax Regulation Mechanisms

With exception of Estonia, all the other countries (Denmark, Ireland, Netherlands, Latvia, and Lithuania) have tax regulation mechanisms. In Denmark, these mechanisms are regulated by the Act 1118/2014 (Act on the Energy Tax on Mineral Oil Products—Bekendtgørelse af lov om energiafgift af mineralolieprodukter m.v.), Act 321/2011 (Act on the Carbon Dioxide Tax on Certain Energy Products—Lov om kuldioxidafgift af visse energiprodukter), and Act 1080/2015 (Act on the Taxes on Coal, Lignite and Coke—Lov om afgift af stenkul, brunkul og koks m.v.). All the renewable energy technologies (aerothermal energy, hydrothermal energy, biomass, biogas, geothermal energy, and solar thermal energy) qualify for tax exemption under this scheme.
The Irish tax regulation mechanism (also called Accelerated Capital Allowance scheme) is regulated by the S.I. 446/2016 (Taxes Consolidation Act 1997 (Allowances for Energy Efficient Equipment) (Amendment) (NO. 2) Order 2016) and the TCA 1997 (Taxes Consolidation Act 1997). These legal sources cover and support aerothermal energy (heat pumps), hydrothermal energy (heat pumps), geothermal energy (heat pumps), and solar thermal energy (solar thermal collectors). This mechanism allows businesses paying taxes in Ireland to claim 100% of the acquisition cost of the eligible energy equipments in the first year. For this, the companies should have minimum costs of at least €1000 for heating equipment.
In the Netherlands, the local tax regulation mechanism is also called Energy Allowance, EIA scheme. This scheme is regulated by two legal frameworks: the Wet IB 2001 (Act on the Income Tax—Wet inkomstenbelasting 2001), and the Energy List 2018 (Energy List 2018, Energielijst 2018). This tax benefit supports up to 54.5% of the total investment cost of aerothermal energy, hydrothermal energy, biogas, biomass, geothermal energy, and solar thermal energy. Only investments greater than €450 are eligible for tax credit, and the total sum of the investment should reach €2300 within one year. Eligible companies should invest in plants that use renewable sources of energy, energy saving developments, or technologies that increase energy efficiency.
In Latvia there are two different tax regulation mechanisms. The first one is supported by the Law on the value added tax (Pievienotās vērtības nodokļa likums), while the second one is regulated by the Law on excise duties (Par akcīzes nodokli). The tax regulation mechanism I reduces the tax rate only for biogas and biomass technologies. In this scheme, the tax rate is reduced from the current 21% to 12%. The tax regulation mechanism II supports the use of natural gas produced by biogas technologies, at a tax rate of €1.65 per MWh.
In Lithuania, the local tax regulation mechanism (Exemption from the Environmental Pollution Tax) is regulated by the Law on Environmental Pollution Taxes (Mokesčio už aplinkos teršimą įstatymas), Law on Energy from Renewable Sources (Atsinaujinančių išteklių energetikos įstatymas), First Document of Order No. D1-370/1K-230 (Mokesčio už aplinkos teršimą iš mobilių taršos šaltinių apskaičiavimo ir mokėjimo tvarkos aprašas), Order No. D1-259/2014 (Taršos leidimų išdavimo, pakeitimo ir galiojimo panaikinimo taisyklės), First Document of Order No. D1-370/1K-230, and Second Document of Order No. D1-370/1K-230 (Mokesčio už aplinkos teršimą iš stacionarių taršos šaltinių apskaičiavimo ir mokėjimo tvarkos aprašas). Under this support scheme, biomass (solid and liquid) and biogas technologies are exempt from environmental pollution taxes if the eligible technologies have thermal input is between 20 MW and 50 MW, of a thermal efficiency between 0.5 MW and 20 MW.

2.2.5. Loan

At the moment, loan support scheme is available only in the Netherlands, and Lithuania. In the Netherlands, this support scheme is regulated by the Regulation Green Projects 2016 (Regeling Groenprojecten 2016) and it allows banks to give loans with lower interest rate to eligible projects that use biogas, geothermal, and solar thermal energy technologies. The interest rate is reduced by 1%.
In Lithuania, this scheme is regulated by the Law on Financial Instruments for Climate Change Management (Klimato kaitos valdymo finansinių instrumentų įstatymas), and Order No. D1-275/2010 (Klimato kaitos specialiosios programos lėšų naudojimo tvarkos aprašas). Under this scheme, geothermal energy, wind energy, solar energy, biogas, hydro-power, and biomass technologies are eligible. The loan is provided by credit institutions to all the eligible individuals and companies in the amount of at least 20%.

2.3. Transport

The RES for the transportation (RES-T) sector supported using biofuel quotas, price-based mechanisms, tax regulation mechanisms, and subsidies.

2.3.1. Biofuel Quotas

In Denmark, the biofuel quotas scheme is regulated by the Act on Sustainable Biofuels and the Reduction of Greenhouse Gases (Biofuels Act) (Lov om bæredygtige biobrændstoffer og om reduktion af drivhusgasser (biobrændstofloven)) and it obliges distributers and producers of gasoline and diesel to sell (annually) at least 5.75% of biofuels and 0.9% of advanced biofuels. Providers that do not fulfil the biofuel quota will be fined.
The Irish biofuels quotas scheme is regulated by the BOS 2010 (Energy (Biofuel Obligation and Miscellaneous Provisions) Act 2010), and the NORA 2007 (National Oil Reserves Agency Act 2007 (Biofuel Obligation Rate) Order 2018). Similar to the Danish biofuel quota scheme, the Irish biofuel quota scheme obliges companies to sell 11.11% of biofuels annually.
In the Netherlands, the biofuel quotas are legislated by the Energy in transport order (ETO, Regeling energie Vervoer), and the Energy in transport decree (ETD, Besluit energie vervoer), and it obliges companies that import or produce more than 500,000 L of gasoline, gas, or diesel to sell a well-defined percentage of biofuels. Instead companies can also present biotickets that can be acquired from other obligated parties.
In Latvia, this scheme is regulated by the Requirements for Conformity Assessment of Petrol and Diesel Fuel (Noteikumi par benzīna un dīzeļdegvielas atbilstības novērtēšanu), and it obliges fuel traders to sell gasoline and diesel containing 4.5% to 7% of biofuels. The expenses of the quota tax relief are compensated by the state.
Lithuania regulates the biofuel quota mechanism through the Law on Energy from Renewable Sources (Atsinaujinančių išteklių energetikos įstatymas), and it requires that fuel traders sell gasoline containing 5% to 10% biofuels, and diesel containing at least 7% biofuels.

2.3.2. Premium Tariff

Currently, the price-based mechanism (premium tariff) is only available in Denmark. The legal source that establishes this scheme is the Decree on the Promotion of Renewable Energy Act (VE-Lov, Bekendtgørelse af lov om fremme af vedvarende energi). This tariff supports only biogas sold for transportation purposes, and the support can vary between DKK 10 (€1.34) and DKK 39 (€5.23) per gigajoule biogas. Sellers and consumers of biogas for transport purposes are eligible for this support.

2.3.3. Tax Regulation Mechanisms

Besides the biofuel quota, tax regulation mechanism is the second most common support scheme for the RES-T. Currently, it is available in Denmark, the Netherlands, Latvia, and Lithuania.
The Danish tax regulation mechanisms for RES-T is regulated by the Act 1118/2014 (Act on the Energy Tax on Mineral Oil Products—Bekendtgørelse af lov om energiafgift af mineralolieprodukter m.v.), and Act 321/2011 (Act on the Carbon Dioxide Tax on Certain Energy Products—Lov om kuldioxidafgift af visse energiprodukter). These mechanisms give lower taxes rates to companies that produce, process, possess, receive, or dispatch energy products as long as they blend gas, diesel, or gasoline with biofuels. The incentive can vary between 274.2 øre/litre (approximately €26.84) and 426.5 øre/litre (approximately €41.75), depending on the type of energy product.
The Netherlands has two different tax regulation mechanisms. The tax regulation mechanisms I is regulated by the Act on the Income Tax (Wet IB 2001—Wet inkomstenbelasting 2001), and the Energy List 2018 (Energielijst 2018). According to the legislation, it can support installations for the production solid, liquid, or gas biofuels, by means of pyrolysis, gasification, torrefaction, thermal degradation, chemical degradation, or enzymatic degradation. The incentive is made in the form of tax credit up to 54.5% of the total amount of the investment. The Dutch tax regulation mechanism II is regulated by the MIA/Vamil 2018 (Environmental Investment Allowance/Random depreciation of environmental investments scheme—MIA/Vamil 2018—Brochure en Milieulijst) and it supports the production of biofuels and hydrogen. For the production of biofuels, this tax regulation mechanism supports the development of delivery stations for the delivery and buffer stock of one of these fuels: B30, B100, E85, E95, biomethanol, PPO or fuel consisting of at least 30% Hydrotreated vegetable oils (HVO) (No. B 3730). These stations have a tax reduction of 13.5% MIA tax, and 75% depreciation for high blend biofuels, and 36% MIA tax, and 75% depreciation for fuel cell systems. Hydrogen production is also incentivized through the installation of delivery stations for hydrogen fuel. Companies can get a maximum of €50,000 of tax credit, as well as 36% MIA tax, and 75% depreciation.
The Latvian tax regulation mechanism is supported by the Law on Excise Duties (Par akcīzes nodokli) and it gives tax benefits to companies that mix biofuels in diesel or gasoline. For diesel or gasoline, with a blend of 70–85% biofuels, 30% of the tax rate applies.
In Lithuania there are two tax regulation mechanisms. The first one is regulated by the Law on Energy from Renewable Sources, Law on Environmental Pollution Taxes, Law on State Environmental Control, Order No. 2B-290/2008, and First Document of Order No. D1-370/1K-230, while the second mechanism is regulated by the Law on Excise Taxes, Order No. VA-37/2014, and Order No. VA-75/2004. Tax regulation mechanism I supports the production of liquid and gaseous biofuels produced from biomass, and the amount of the subsidy corresponds to the amount of tax that the natural or legal person is exempt from. Tax regulation mechanism II supports biofuels produced from biomass by providing tax relief to the producer. In this mechanism it is possible to obtain a tax relief of at least 30%, since the tax relief is relative to the percentage of organic additives blends. When the biofuels are produced fully from substances of organic origin, they are fully exempt from excise duty.

2.3.4. Subsidies

Subsidies for the promotion and use of biofuels are available only in Estonia and Lithuania. Estonia has two different subsidies for the support of biomethane production. Subsidy I is regulated by the Act on Biomethane Subsidies (Biometaani transpordisektoris tarbimise toetamise tingimused RT I, 25.11.2015, 9) and it supports the construction of infrastructures for biomethane gasoline stations (up to 35% of the costs, and maximum of €350,000 per project) and promotes the use of biomethane in the public transport sector (up to 30%, and maximum amount of €4,000,000 per project). Subsidy II is regulated by the Act on Biomethane Market Development Support (Biometaanituru arendamise toetamise toetuse kasutamise tingimused ja kord RT I, 15.09.2017, 9) and it establishes that biomethane producers whose installed capacity does not surpass 50,000 tonnes per year can get a subsidy between €93 per megawatt-hour and €100 per megawatt-hour, if the biomethane distributed to the consumer is in the gas system, or as transport fuel, respectively.
In Lithuania, the National subsidy for the RES-T is regulated by the Order No. 3D-417/2008 (Biodegalų gamybos plėtros finansavimo taisyklės), and it reimburses rapeseed oil producers for the production of rapeseed methyl (ethyl) ester, and for the purchase of rapeseed grains (€46.34 per tonne) and cereal grains (€33.02 per tonne) to produce dehydrated ethanol.

3. Materials and Methods

3.1. Data Collection

The qualitative data (list of directives and legal frameworks) used in this paper was collected from the Renewable energy policy database and support tool from the European Commission, available online at http://www.res-legal.eu/search-by-country/ (accessed on 8 June 2020). Further details about the regulations at country level were accessed and collected from national legal information systems (Table 3).
Quantitative data about the amount of energy used for electricity, heating and colling, and transport sectors was collected from the SHARES tool (Short Assessment of Renewable Energy Sources), from Eurostat, available online at: https://ec.europa.eu/eurostat/web/energy/data/shares (accessed on 8 June 2020). The list of quantitative parameters utilized in this study is shown below:
  • Share of energy from renewable sources in transport, in the European Union, Estonia, Latvia, and Lithuania, Denmark, Ireland, and Netherlands, between 2004–2018 (%)
  • Share of energy from renewable sources in gross electricity consumption, in the European Union, Estonia, Latvia, and Lithuania, Denmark, Ireland, and Netherlands, between 2004–2018 (%)
  • Share of energy from renewable sources for heating and cooling, in the European Union, Estonia, Latvia, and Lithuania, Denmark, Ireland, and Netherlands, between 2004–2018 (%)
  • Total RES, in the European Union, Estonia, Latvia, and Lithuania, Denmark, Ireland, and Netherlands, between 2004–2018 (%)
  • Gross energy consumption in Estonia, Latvia, and Lithuania, Denmark, Ireland, and Netherlands by category (total, solid fossil fuels, oil and petroleum products, natural gas, hydro, solid biofuels, and others) (KTOE/106)
  • Total energy supply in the electricity & heat sector in Estonia, Latvia, and Lithuania, Denmark, Ireland, and Netherlands by category (total, solid fossil fuels, natural gas, hydro, solid biofuels, nuclear heat, and others) (KTOE/106)
  • Final energy consumption in the transport sector in Estonia, Latvia, and Lithuania, Denmark, Ireland, and Netherlands by category (total, oil and petroleum products, liquid biofuels, and others) (KTOE/106)

3.2. Data Analysis

The data and statistical analysis were performed in the software GraphPad Prism version 9. The normality of the data set was examined with the Shapiro-Wilk test, in which the null hypothesis proposes that there are no differences in the distribution of the samples. The Friedman test was further applied to investigate the differences between the groups, and the Dunn’s multiple comparisons test was used to study which of the groups differ from each other. Spearman correlation was used to determine the level of correlation between two variables. The level of statistical significance between the results was 95%, for a confidence interval of 0.05 (p < 0.05).
The timeline with all the legal frameworks was designed in Microsoft PowerPoint using the office timeline pro add-in.

4. Results and Discussion

4.1. European Union

In Figure 1, the evolution in the share of renewable energy in the European Union between 2004–2018 (a) gross energy generation; (b) heating and cooling; (c) transport is presented. As it can be seen from the Figure, 72–80% of the gross energy generation in the European Union still comes from fossil fuels (solid fossil fuels, oil and petroleum products, and natural gas). Over the past 14 years (between 2004 and 2018), the share of fossil fuels in the gross energy generation decreased only by 7%, which means that the share of renewable energy increased by only 7%. A similar trend was followed by the heating and cooling sectors and transportation sector, in which the decrease in the utilization of fossil fuels was only 8% and 4.3%, respectively.
The gross energy generation, heating and cooling, and transport sectors in the European Union are regulated by six main directives: EU1—Directive 98/70/EC establishes guidelines for the quality of petrol and diesel fuels, EU2—Directive 2001/77/EC defines the rules for the promotion of electricity produced from renewable energy sources, EU3—Directive 2003/30/EC describes the directions for the promotion of the use of biofuels or other renewable fuels for transport, EU4—Directive 2009/28/EC designates the guidelines for the promotion of the use of energy from renewable sources, EU5—Directive 2015/1513/EC amends Directive 98/70/EC and Directive 2009/28/EC, EU6—Directive 2018/2001/EC defines the legal framework for the promotion of the use of energy from renewable sources (recast). These results show that the implementation of these regulations are not correlated with the changes in the energy consumption patterns (p > 0.05). Supplementary Material contains a timeline with an implementation date of all the regulations used in this paper.

4.2. Western Europe and Baltic Countries

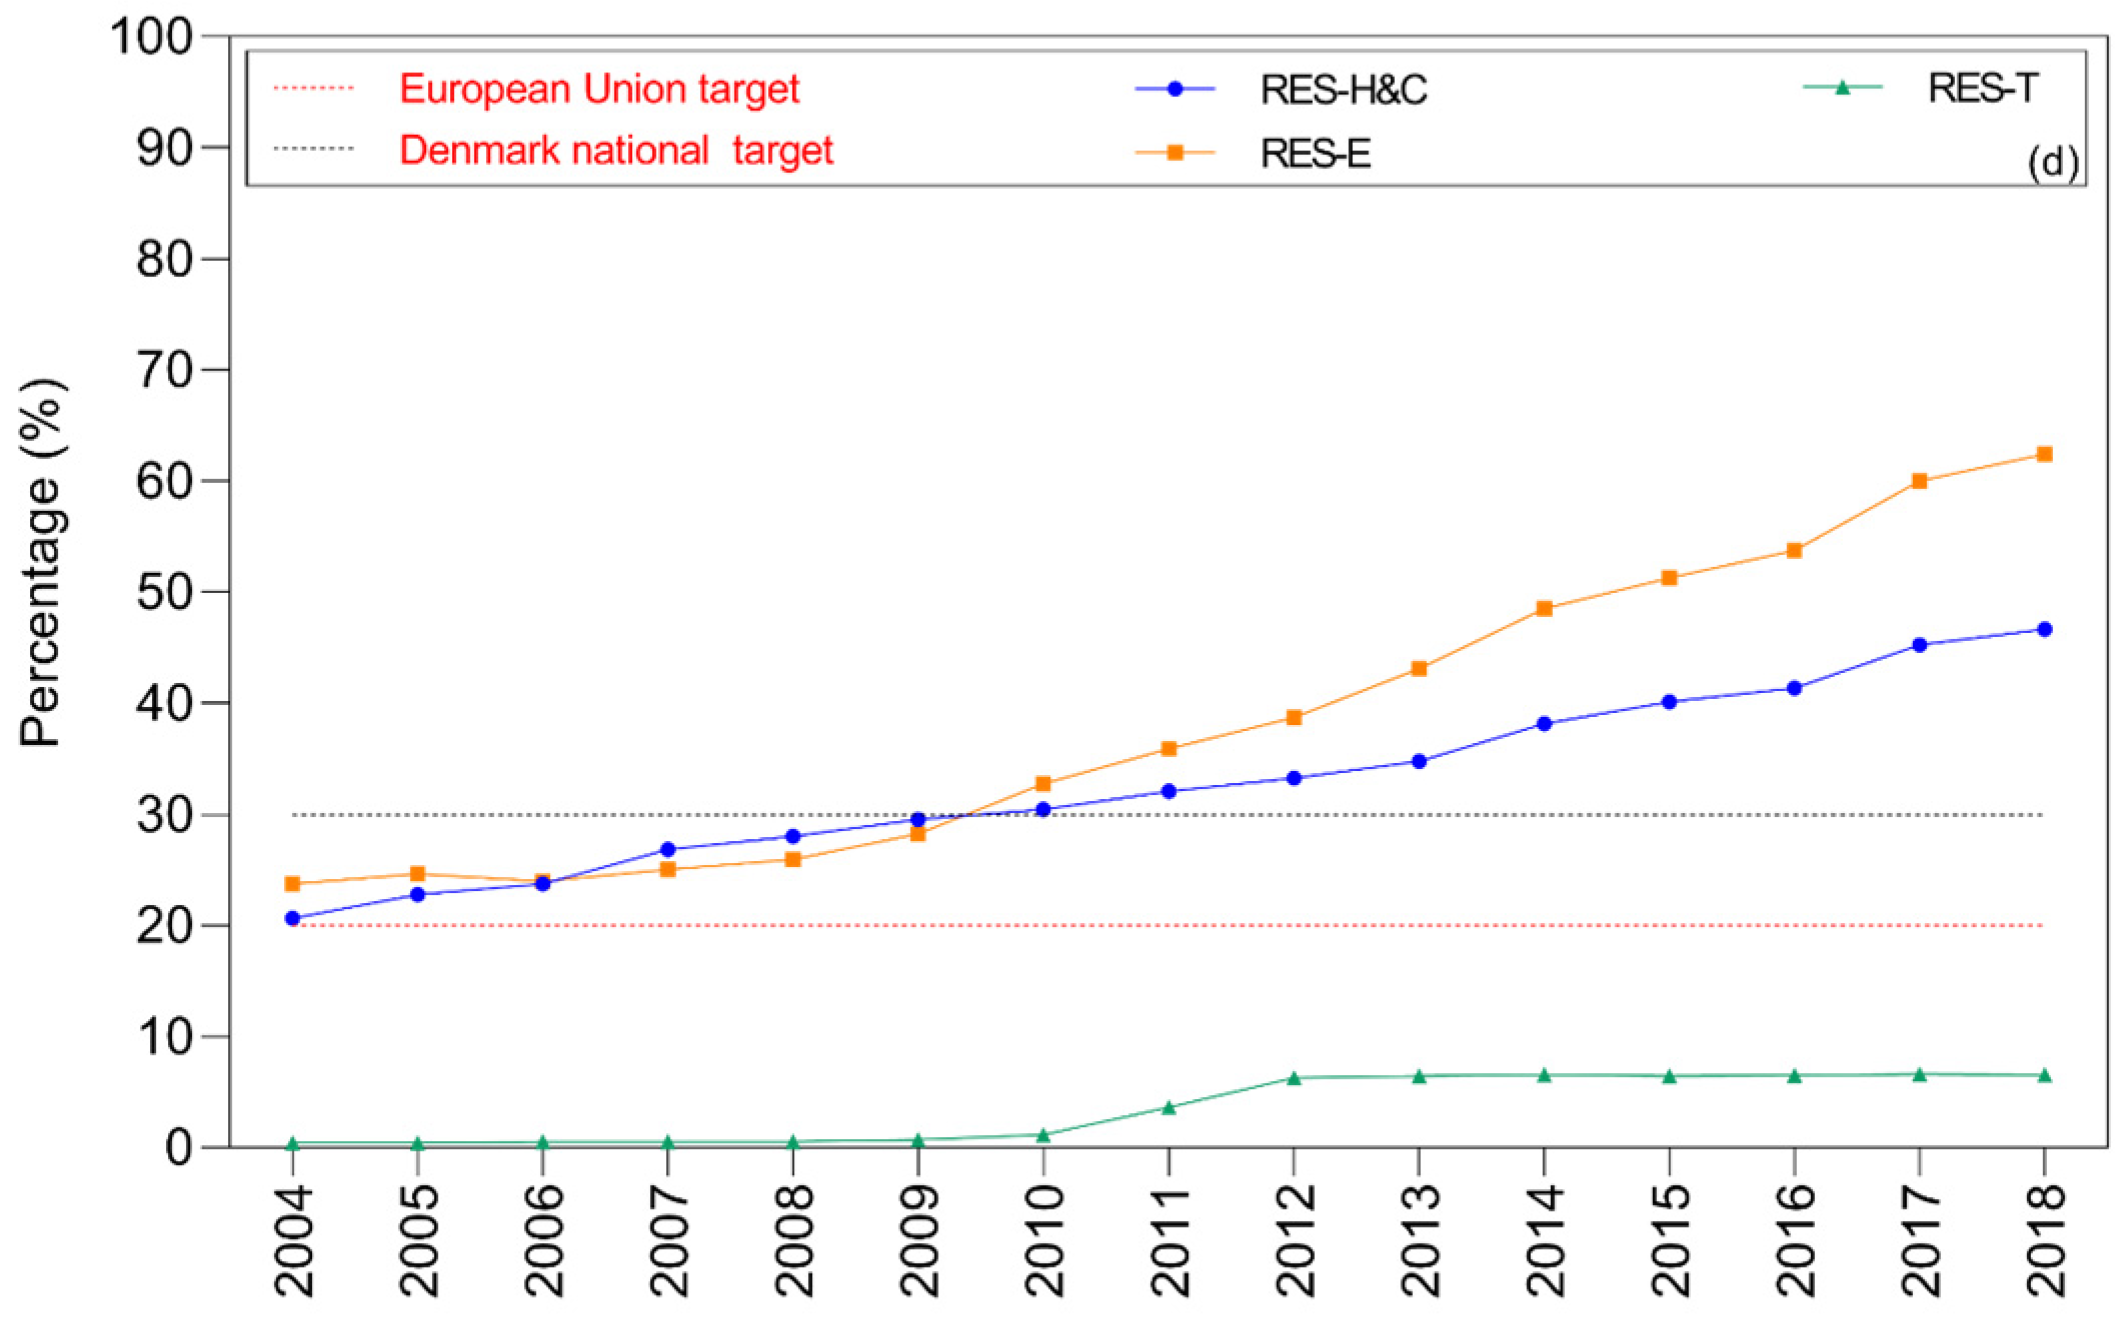
The percentage of energy produced from renewable sources in Europe, Denmark, Ireland, Estonia, Latvia, Lithuania, and Netherlands in the time period 2004–2018 is shown in Figure 2. The target that the European Union has established for the share of renewable energy in the gross energy consumption is 20%. As it can be seen from the figure, since 2004 only Latvia and Denmark are above the target, and above the European Union average. In 2018 these countries were 34–42% above the target, while Estonia, Lithuania, and the Netherlands were 0.3–5% under the target. Statistically significant differences (p < 0.05) were found between the percentages of the gross energy consumption in Estonia/Lithuania/Netherlands and the European Union average/European Union target.
When it comes to the share of energy from renewable sources in the heating and cooling sector, the European target is also 20%. In this case, the Netherlands and Ireland were 3.5–3.8% below the European Union average and European Union target, while all the other countries were 26–36% above the target in 2018. Statistically significant differences (p < 0.05) were found between the percentages of the gross energy consumption in Estonia/Latvia/Lithuania and the European Union average, between and Estonia/Latvia/Netherlands and the European Union target.
The European Union target for the share of energy from renewable sources in the transportation sector is 10%. As it can be seen from the figure, in 2018 all the countries were lagging 0.4–6.7% behind the target.
Overall, in 2018, Estonia, Denmark, Latvia, and the Netherlands were the countries with the highest share of renewable sources in their energy mix, while Ireland and the Netherlands were below the European Union target and average.

4.2.1. Denmark

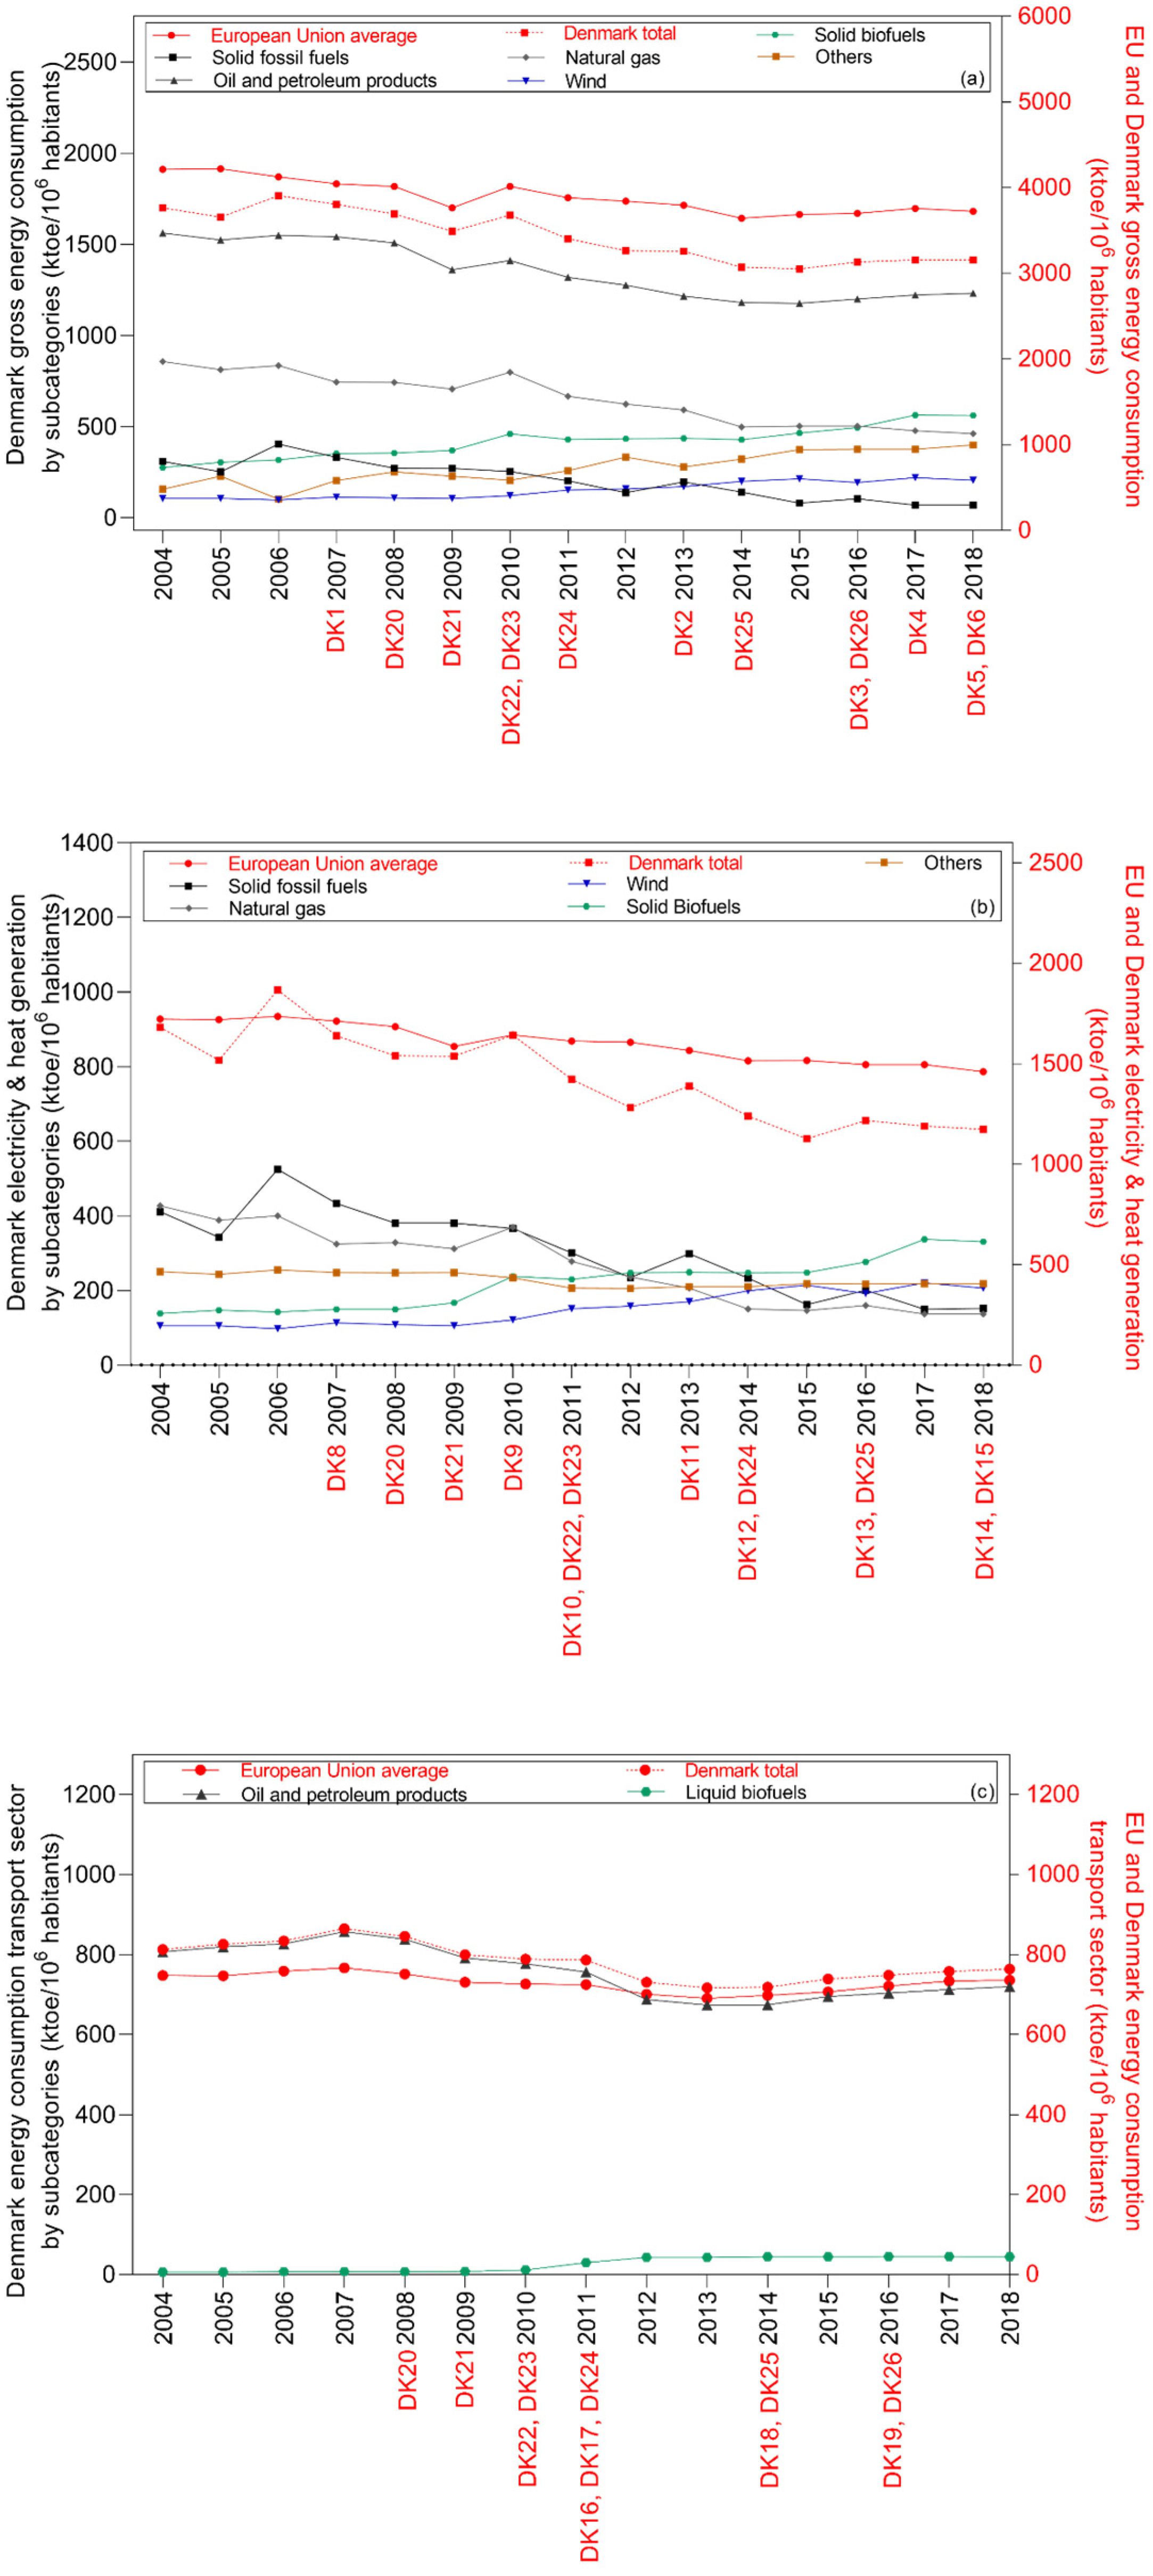
In 2018, oil and petroleum products and natural gas were still the main sources of energy used in the Danish gross energy sector. Alternative sources of energy such as solid biofuels and wind represented only 24% of the energy used (Figure 3). A negative weak to moderate correlation (−0.1 r −0.5; 0.0989 p 0.594) and a positive weak to moderate correlation (0.2 r 0.4; 0.129 p 0.448) were found between the introduction of National or European frameworks and the amount of energy used in the gross energy production. When it comes to the heating and cooling sector, there has been a considerable decrease in the amount of solid fossil fuels and natural gas used, which was replaced by wind and solid biofuels. However, these changes are not strongly correlated with the implementation of legal frameworks since a negative weak correlation (−0.2 r −0.4; 0.130 p 0.550) and a positive very weak to weak correlation (0.0 r 0.3; 0.345 p 1.00) were found.
The Danish transportation sector is also dominated by oil and petroleum products. In 2018, liquid biofuels represented only 5.8% of the total share of energy used in the transportation sector. A negative weak correlation (−0.1 r −0.2; 0.456 p 0.840) and a positive very weak correlation (0.1 r 0.2; 0.446 p 0.697) were found between the introduction of European frameworks and National or the amount of energy used in the transportation sector. Although the overall share of renewable energy in the gross energy generation, heating and cooling, and transport sectors has been increasing in the past few years in Denmark, the transportation sector is still lagging the National and European Union target by 67–78%. However, in 2004 Denmark had already achieved the European Union targets for the heating and cooling sector and electricity sectors. In 2010 the country achieved the national targets for the same sectors.
When it comes to the gross energy generation in Denmark, the premium tariff, and the net metering are the main incentives used to promote the utilization of RES in the gross energy generation. Tax regulation mechanisms are used as support schemes in the heating and cooling sector, while the quota system is used in the transportation sector. Overall, more than two-thirds of Denmark’s renewable energy comes from bioenergy that is produced mainly from organic material or biomass [37]. It should be mentioned that many Danish power plants are switching from fossil fuels to biomass (such as wood pellets, wood chips, or straw). Overall, Denmark’s greenhouse gas emissions in 2030 are expected to be reduce by 46% when compared to the United Nations base year 1990 in the absence of new measures. The RES-E is expected to exceed 100% from 2028 and reach 109% by 2030 [38]. This is due to the deployment of offshore wind, onshore wind, and solar PV. Although Denmark’s renewable energy and biofuel production have doubled in the past few years in the gross energy generation and heating and cooling, the country is still lagging in the transportation sector. The changes in the amounts of renewable energy produced in the country seem not to be related neither with the implementation of European Directives, nor National legislation. This can be explained by the fact that the Danish Government has been committed to decrease the share of fossil fuels in their energy mix even long before the introduction of renewable energy directives by the European Union. Denmark started their low-carbon economy in the 90s, while the first European renewable energy directive was implemented only in 2001 [39]. Denmark started utilizing renewable sources of energy such as wind and solid biofuels already in the 90s, which might explain the current performance of the country specially when it comes to the share of renewable sources of energy in the final energy consumption, and heating and cooling sectors. The results obtained in this paper suggest that the policies and vision of the Danish Government for the implementation of renewable sources of energy in their energy mix were so effective that the European policies did not play a role in their green economy. In 2019, the share of renewable energy in the Danish primary energy supply was 26% higher the OECD average, and 22.6% higher than the European Union average [40].

4.2.2. Ireland

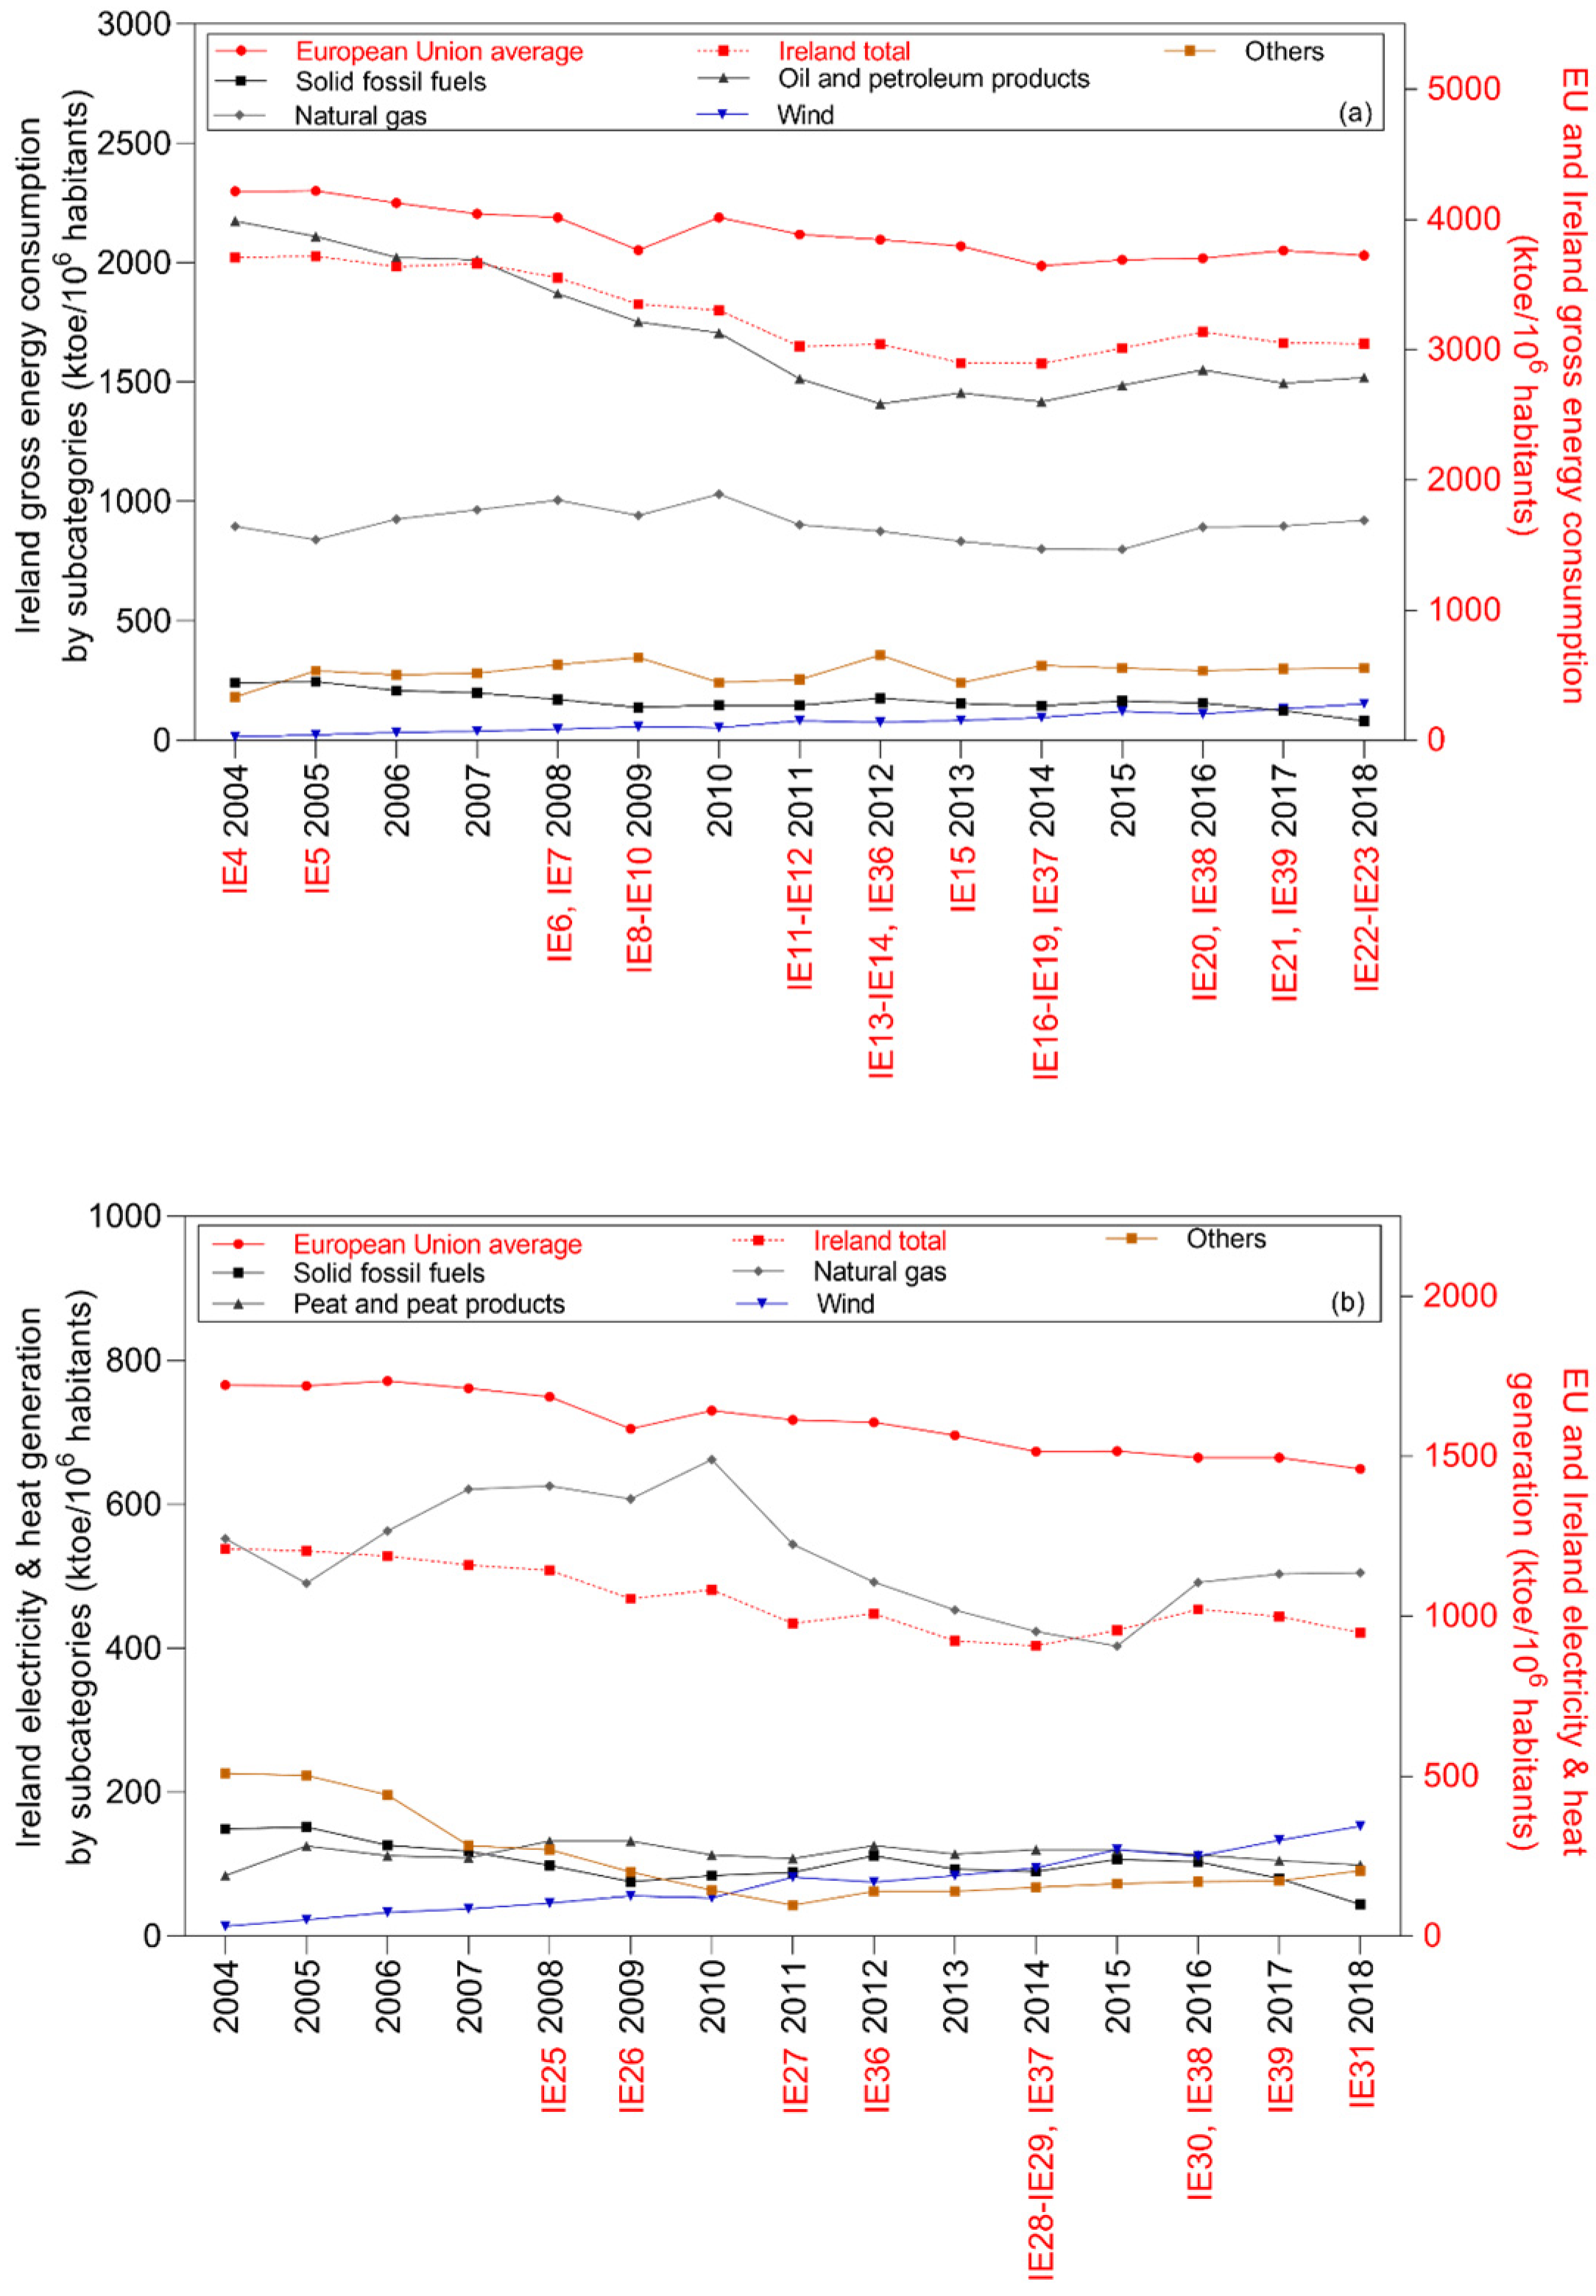
As it can be seen from Figure 4, from 2004 to 2018, the Irish gross energy generation was 12–18% below the European Union average. However, almost 50% of the gross energy generation still comes from oil and petroleum products. Wind energy represents only 5% of the mix. A negative very weak to moderate correlation (0.0 r −0.5; 0.0989 p 0.945) and a positive weak correlation (0.2 r 0.4; 0.132 p 0.489) were found between the introduction of legal frameworks in Europe and Ireland and changes in the share of renewable energy in the gross energy generation. When it comes to the heating and cooling sector, more than 50% of its production comes from natural gas, followed by wind energy (16%), other fossil fuels (11%), and peat products (10%). A negative very weak to moderate correlation (0.0 r −0.6; 0.0277 p 0.955) and a positive very weak to moderate correlation (0.0 r 0.5; 0.0540 p 0.925) were found between the implementation of National legislation and the changes in the share of solid fossil fuels in the Irish heating and cooling sectors. In the last fourteen years the Irish transportation sector has also been dominated by oil and petroleum products. In 2014, 99.8% of the energy used in the transportation sector was from oil and petroleum products, while in 2018 it was 95.6%. Surprisingly, in the last fourteen years, the decrease in the share of fossil fuels in the Irish transportation sector was only 3%, which means an increase in the share of liquid biofuels by only 3%. A positive moderate correlation (r = 0.6; p 0.0369) was found between the introduction of National legal frameworks and changes in the share liquid biofuels in the transportation sector. From the three sectors in the study (gross energy generation, heating and cooling, and transport), Ireland only accomplished its targets for the gross energy generation. In 2010 the country had achieved its national targets for the energy sector and in 2012 achieved the European Union target for the same sector. Although Ireland has incorporated the European legislation concerning the implementation of renewable sources of energy in the gross energy generation, heating and cooling, and transportation sectors, in 2018 the country was still lagging its own targets and the European Union targets for the heating and cooling and transportation sectors by more than 56–70%.
In Ireland, the main scheme promoting electricity production by renewables was the feed-in-tariff scheme (REFIT) until 31 December 2015. Currently, there is one support scheme i.e., subsidy for the purchase and installation of PV and battery storage. Renewable energy sources for heating purposes are promoted through subsidies and a tax return, while operational support is foreseen by specific technologies. The quota system promotes renewable energy use in transport [41].
Due to its geographic characteristics, Ireland has a high potential wind generation, which can justify the high share of wind energy in the heating and cooling sectors. Policy and legal frameworks for the implementation of wind energy in Ireland have also contributed to the development of this technology. However, the Irish energy mix still has a very poor performance when it refers to the implementation of renewable sources of energy. This can be explained by the history of the Irish energy sector. In the beginning of the 90s the country was using mainly natural gas and peat products as sources of energy for the production of electricity, and only then the Government started expanding, liberalizing and restructuring its energy sector [42]. Contrary to Denmark, Ireland started focusing on the implementation of renewable sources of energy only the 2000s which might explain why the country was not able to achieve the targets either for heating and cooling or for transport sectors. Overall, Ireland had a very slow transition to low-carbon technologies, and it seems that the Irish government has not put enough emphasis on the implementation of support schemes for electricity, heating and cooling, and transport sectors. As reported by the International Energy Agency (IEA), they identified very critical gaps and challenges in Irish energy policies that can once again justify the mediocre performance of the country concerning the implementation of renewable sources of energy. Some of the recommendations proposed by the IEA include the need for transparency and the accountability to achieve Ireland’s emission targets; continuity in the energy policies; and clear and predicable decarbonization policies for the transportation sector. Overall, the Irish energetic regulatory framework is neither stable nor predictable and it lacks a clear trajectory [43]. In 2019, the share of renewable energy in the Irish primary energy supply was 3.2% lower than the European Union average, and only 0.2% higher than the OECD average [40].

4.2.3. Netherlands

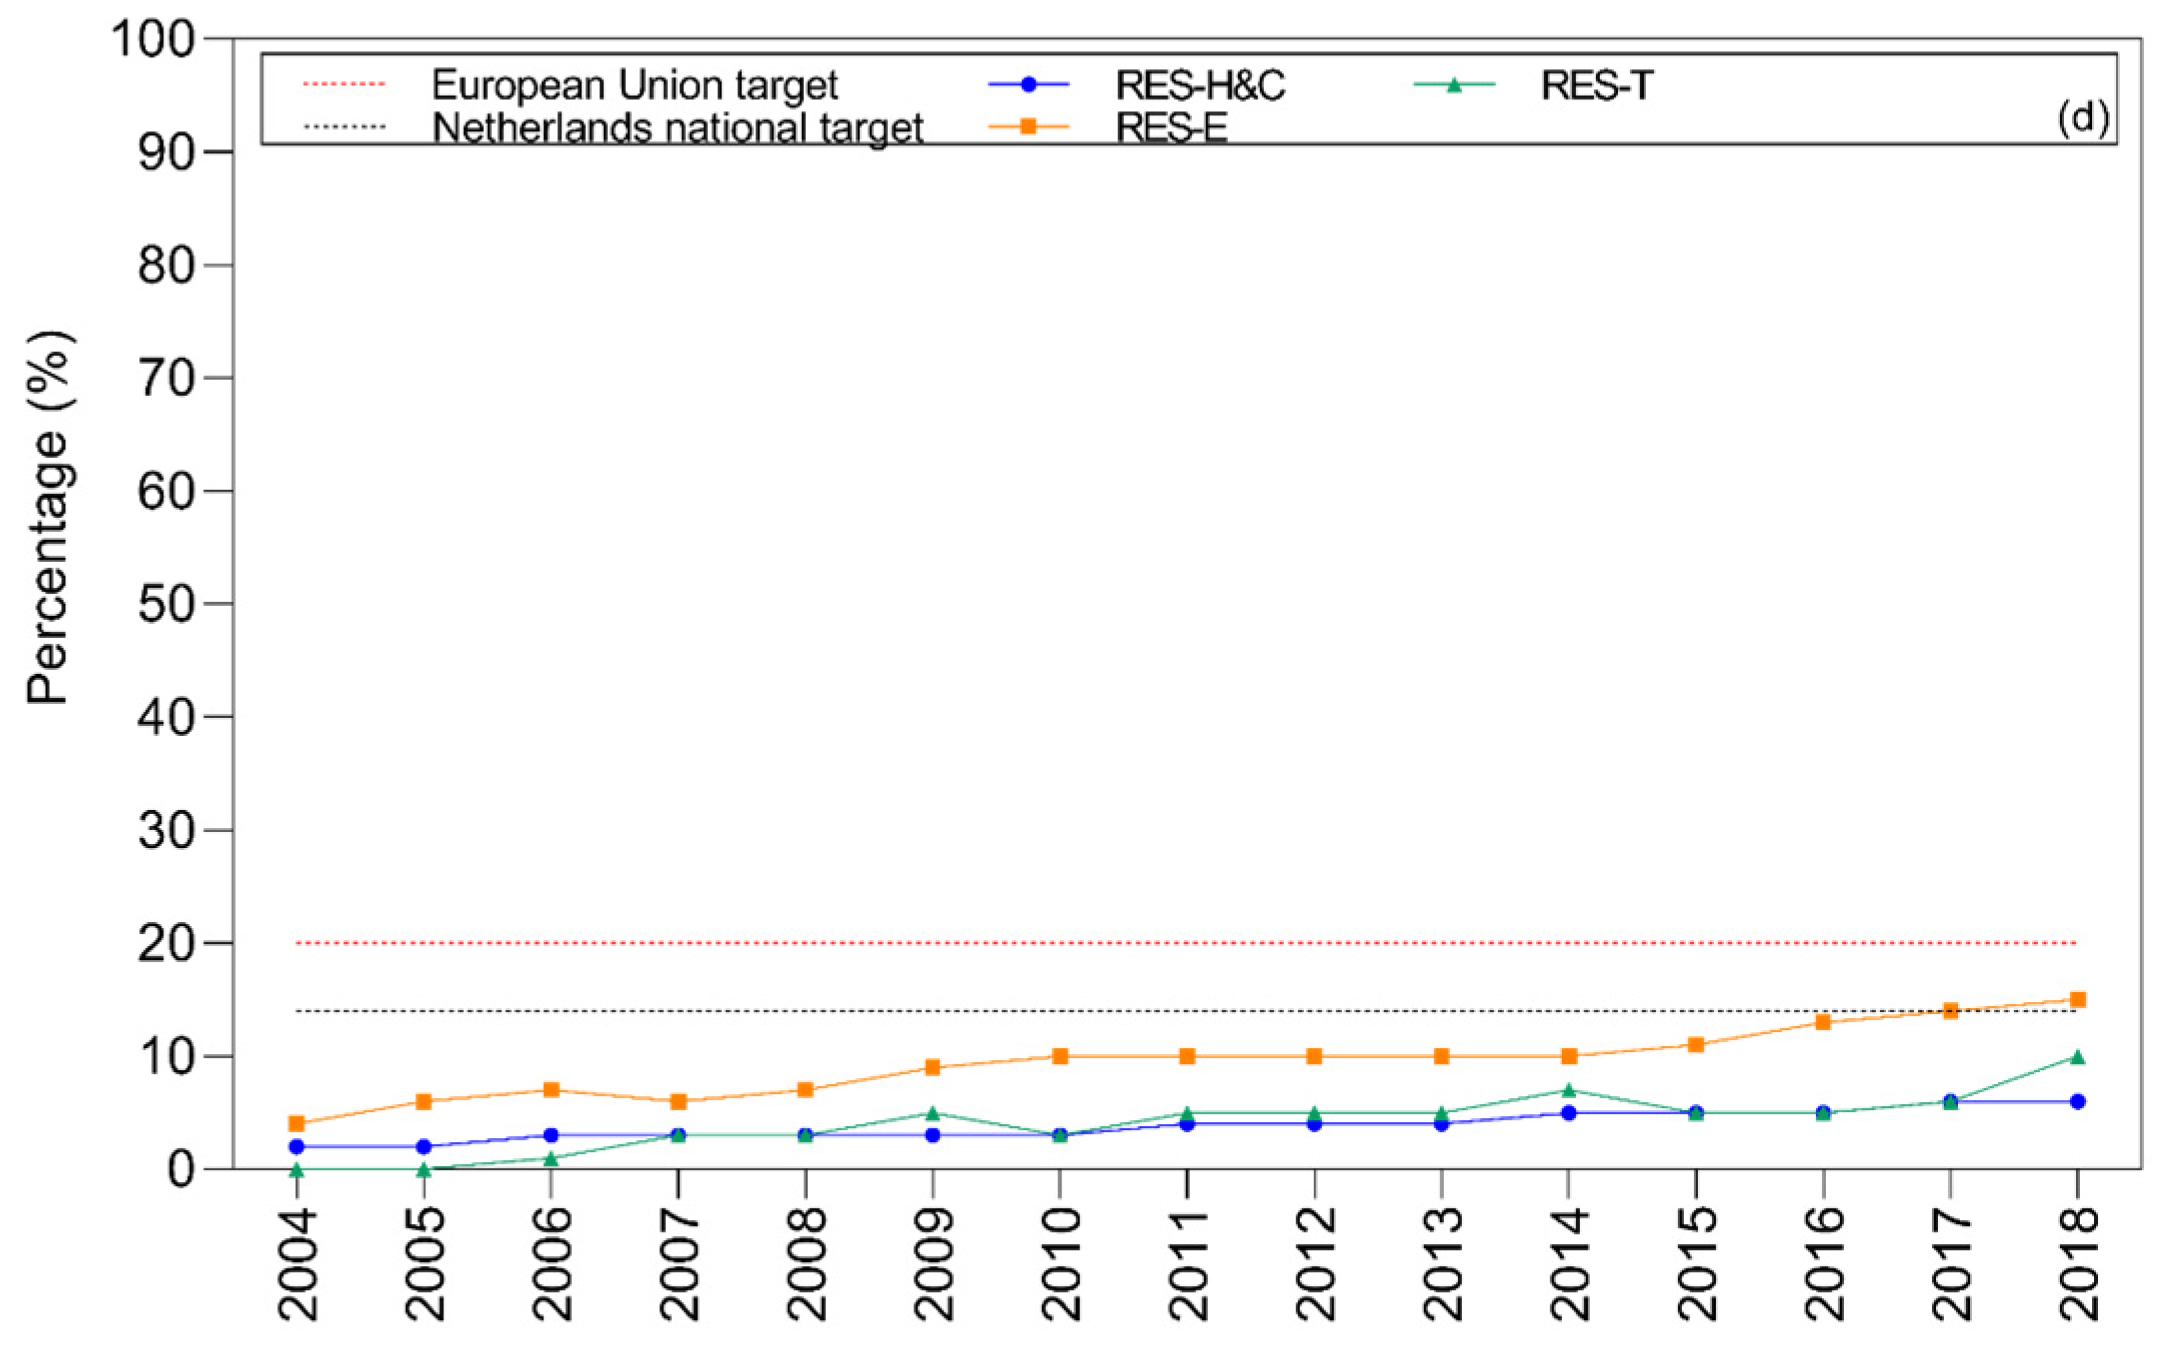
Similar to the previously discussed countries, fossil fuels (mainly oil and petroleum products, and natural gas) are still the main source of energy used in the Dutch energy generation (Figure 5). The share of oil and petroleum products utilized the gross energy generation in the Netherlands decreased by only 0.1% between 2004 and 2014, and the share of natural gas by only 3.9%. When it comes to heating and cooling, the sector is supplied mainly by natural gas, which represented 54% of the total energy used 2004, and 46% in 2018. The Dutch transportation sector also had a very poor performance when it comes to the utilization of renewable sources of energy. In 2018, about 93% of the sector used oil and petroleum products, which was a decrease of only 5.7% when compared to 2004 numbers. In 2018, the Netherlands still had not achieved its European Union targets for the electricity, heating and cooling, and transportation sectors. The country was 70% below the European targets in the heating and cooling sector, 25% below in the electricity sector, and 50% below in the transportation sector. Despite this very poor performance, the Netherlands achieved their national targets for the electricity sector in 2017. A negative very weak to moderate correlation (−0.1 r −0.5; 0.0747 p 0.734) and a positive very weak correlation (0.0 r 0.2; 0.545 p 0.977) were found between the introduction of legal frameworks in the European Union and the Netherlands and changes in the share of energy used in the heating and cooling sectors. A negative very weak to weak correlation (−0.1 r −0.4; 0.173 p 0.840) and a positive moderate correlation (0.5 r 0.6; 0.0352 p 0.0637) were found between the introduction of legal frameworks in the European Union and the Netherlands and changes in the share of energy used in transport sector. These results suggests that the performance of the Dutch energy sector does not rely on the implementation of European directives, but rather on the political vision that has been shaping the country in the last years. These results are supported by the findings reported by Papież et al. [15]. The authors concluded that although European countries have substantially changed their energy patterns since the 90s, the development and implementation of renewable sources of energy are influenced mainly by the energy policy objectives of each member state.
The main renewable energy support scheme in the Netherlands is the SDE+ premium feed-in, which supports energy sources used in transport, renewable gas, and heating and cooling systems. SDE+ promotes a system of phased admission with escalating base tariffs, which favors low-cost RES options. In the Netherlands, renewable energy technologies are supported by loans and various tax benefits. Moreover, the ISDE premium feed-in scheme and net-metering apply to small installations. For offshore wind, a tendering scheme is available under the SDE+. The grid provides a sufficient capacity for the access and transmission of electricity from renewable energy sources which are developed by grid operators. Heat production from renewable sources is promoted through Premium tariff (bonuses on top of the wholesale price) and tax benefits. The Netherlands planned to increase 10% RES share of energy consumption in the transport sector so biofuel and hydrogen-related RES-T investments have Tax credits [44]. Although the Netherlands has very ambitious targets to make a substantial contribution to the Paris Agreement (49% reduction in greenhouse gases in 2030, compared with 1990) and has a vast number of legal policies for the implementation of renewable sources of energy in their energy mix, in 2018 the country still had not reached the European Union targets. This can be explained by the fact that the Netherlands relies very heavily on its natural gas reserves since the 70s and perhaps the Dutch reforms, policies, and support schemes currently in place for the energy sector are not effective in increasing the share of renewable sources of energy in the National energy mix. As reported by the IEA, they identified several gaps and challenges in the Dutch energy policies. In this report, it was recommended (among other things) that the Netherlands should amend its regulatory framework for the electricity sector, create extra policies to tackle the barriers to meet the 2030 climate agreement targets, develop and reinforce the actions for the reduction of emissions in the transportation sector and to ensure that the renewable energy targets are achieved, and make policy adjustments [45]. In 2019, the share of renewable energy in the Dutch primary energy supply was 3.7% lower than the OECD average, and 7.1% lower than the European Union average [40].

4.2.4. Estonia

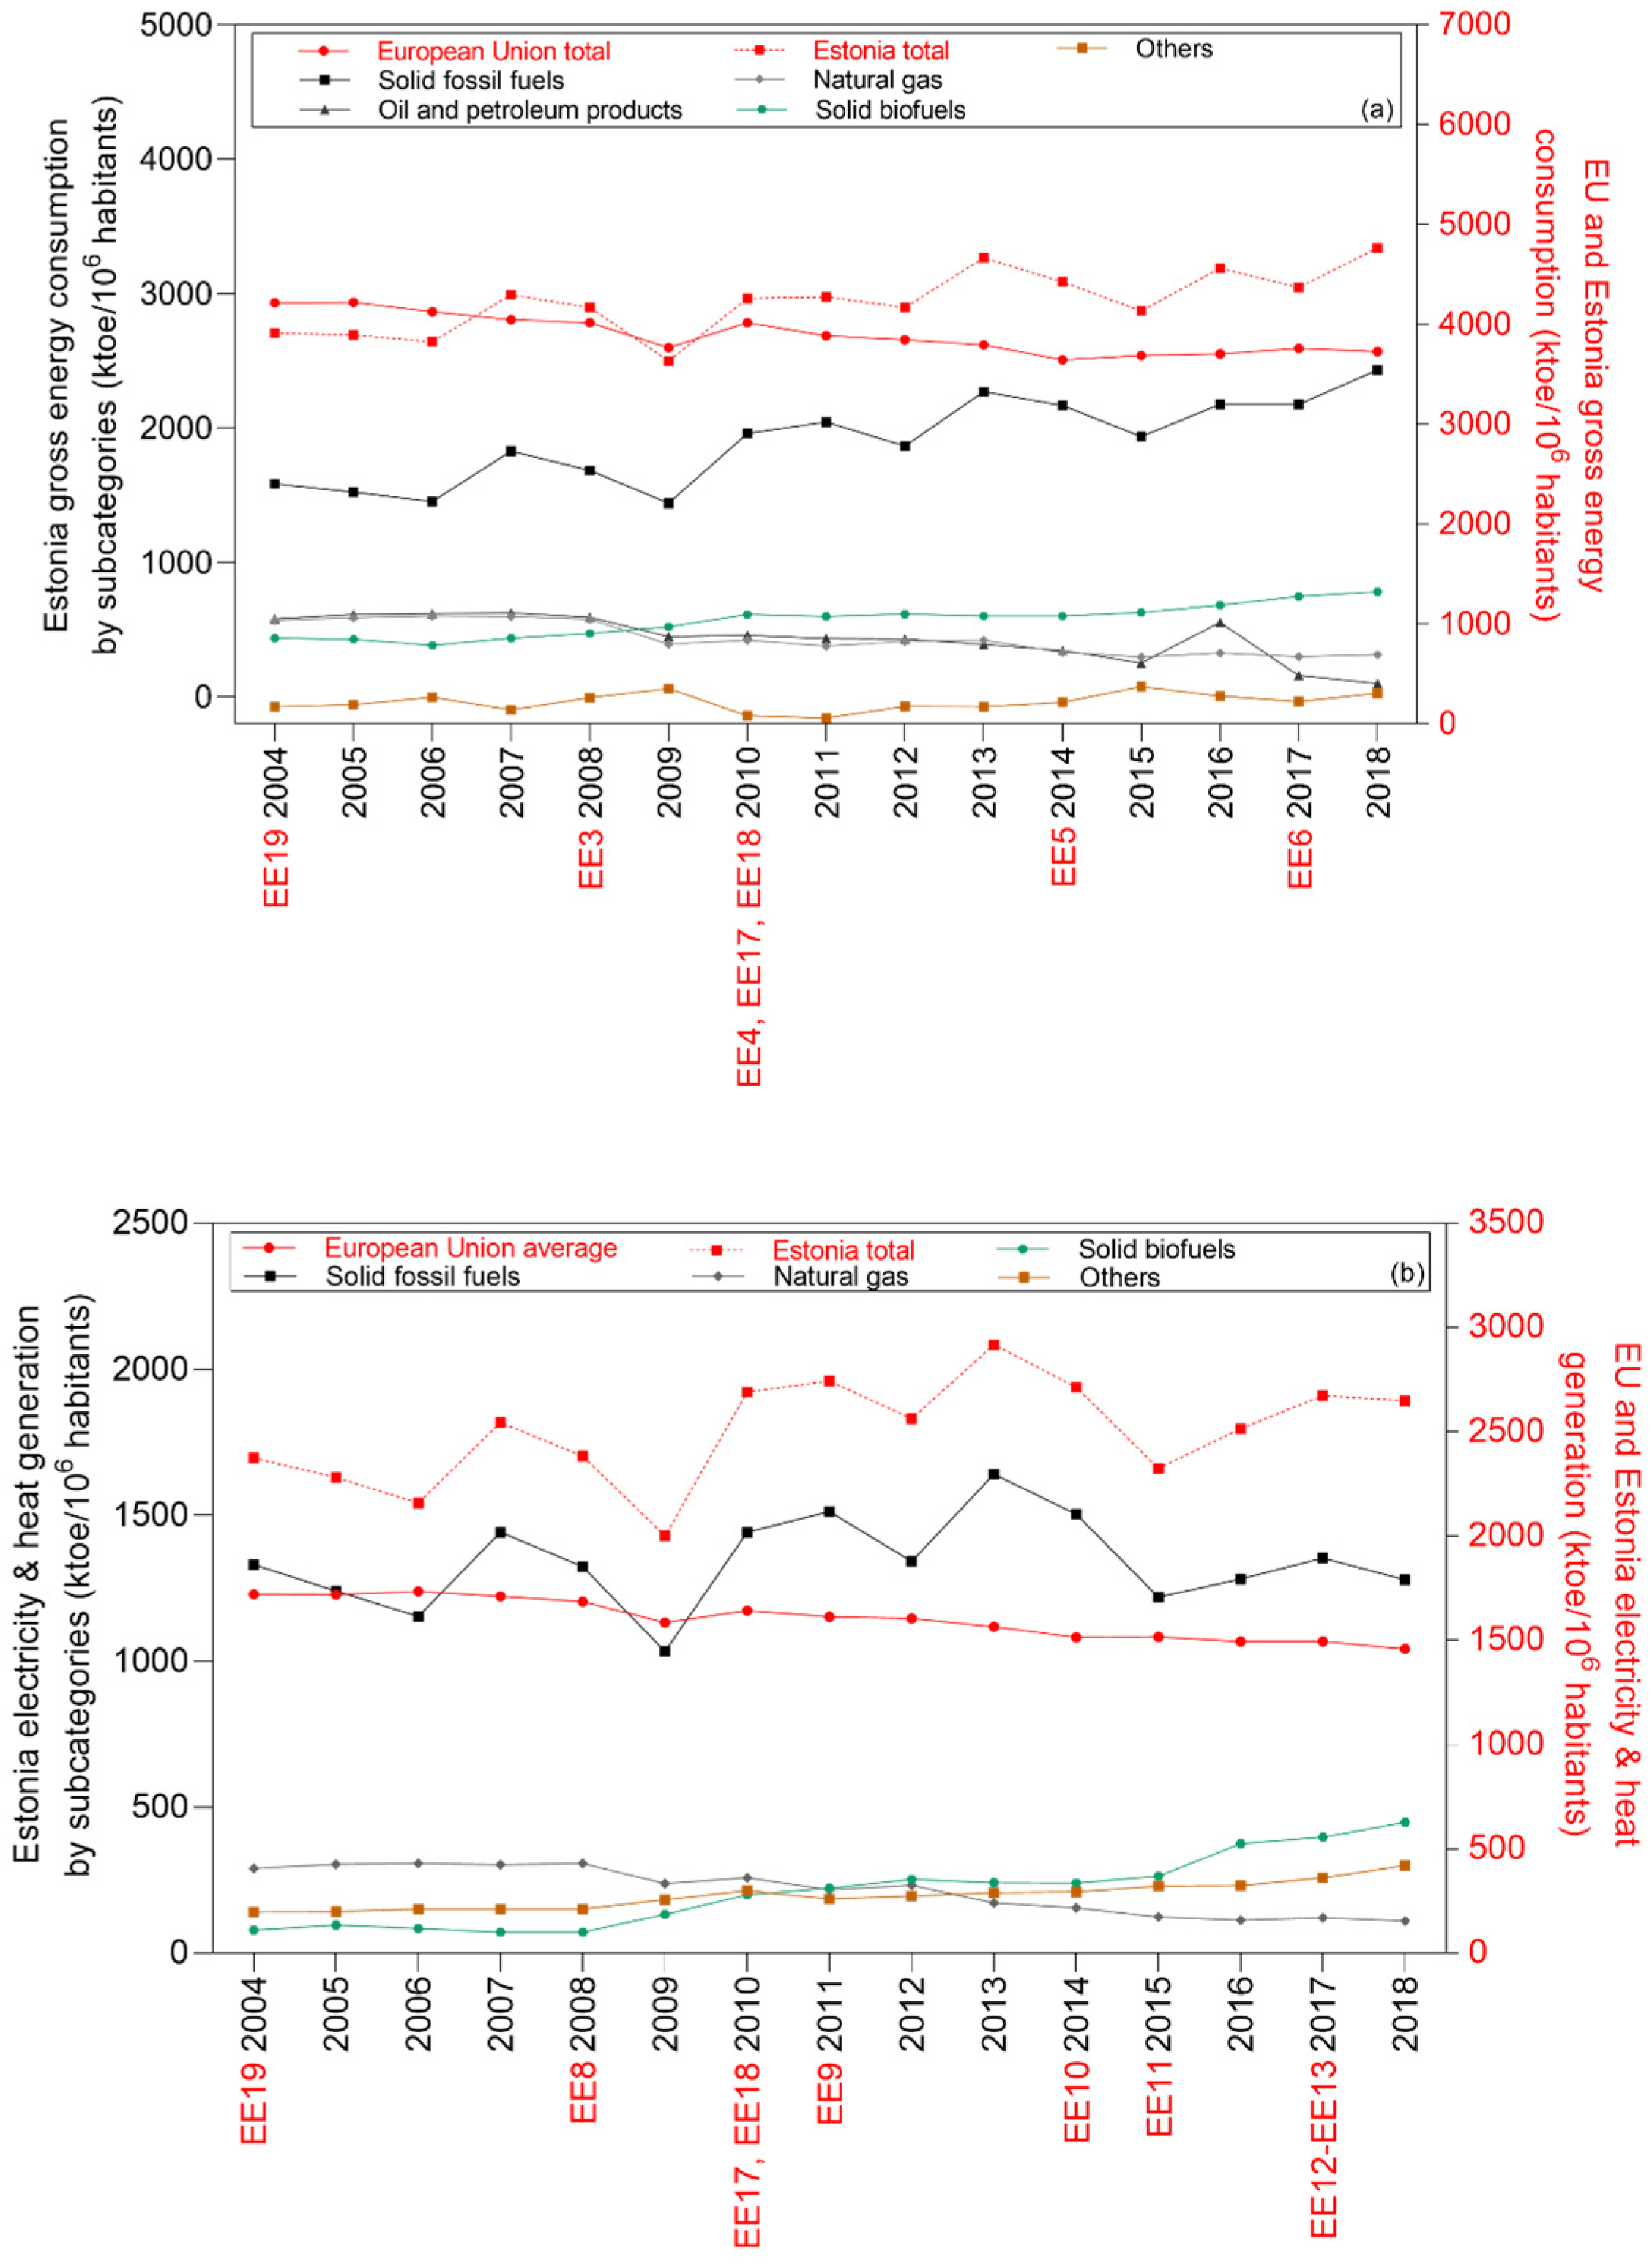
The Estonian gross energy production has been very volatile between 2004 and 2018. As it can be seen from Figure 6, in the years 2007–2008 and 2010–2018 the total gross energy production in Estonia was higher than the European Union average by 4–28%. Similarly to Western European countries, the Estonian electricity sector utilized mainly solid fossil fuel, oil and petroleum products, and natural gas. However, the utilization of solid biofuels in this sector increased from 11% in 2010 to 16% in 2018. Comparable to the gross energy sector, the Estonian heating and cooling sector also presented a very high volatility between 2010 and 2018. Although this sector has been supplied mainly by solid fossil fuels and natural gas, the utilization of solid fossil fuels in the heating and cooling sector increased almost 14% between 2010 and 2018. In 2016 about 96.6% of the energy used in the transportation sector was still supplied by oil and petroleum products. In 2018 Estonia had already surpassed the National targets for the heating and cooling sector by almost 29%, and the European Union targets by almost 37%. In the same year the share of renewable energy in the electricity sector was only 0.3% below the European Union target, and 5.3% below the Estonian targets. Only the transportation section is having a very poor performance. The share of renewable energy in the transportation sector was 0.2% in 2010 and 3.3% in 2018, which is 22–25% below the Estonian national targets, and 17–20% below the European Union targets. A negative very weak to moderate correlation (−0.1 r −0.5; 0.0703 p 0.859) and a positive very weak to strong correlation (0.0 r 0.7; 0.00440 p 1.00) were found between the introduction of legal frameworks in the European Union and in Estonia and changes in the share of energy used in the electricity sector. A negative very weak to moderate correlation (−0.1 r −0.6; 0.0286 p 0.982) and a positive very weak to weak correlation (0.1 r 0.3; 0.224 p 0.842) were found between the introduction of legal frameworks in the European Union and in Estonia and changes in the share of energy used in the heating and cooling sectors. A negative very weak correlation (0.0 r −0.1; 0.828 p 0.949) and a positive very weak (r = 0.1; 0.635 p 0.866) were found between the introduction of legal frameworks in the European Union and in Estonia and changes in the share of energy used in the transport sector.
Estonia is a country with a fast development in the bioenergy sector mainly due to its abundant biomass resources. In Estonia, the premium tariff is the main policy on electricity production from renewable sources of energy. Throughout recent years, major changes in the regulations concerning RES funding schemes have taken place. In June 2018 an auction-based approach was launched as the first contracts in the process to promote RES development, which would replace the previous premium tariffs. Another change in the Estonian regulatory framework included renewable energy trading with other EU member states, which were not on track to accomplish their RES 2020 targets. In the heating sector, investment supports were made to encourage the utilization of RES. These policies are accessible to build combined heat and power plants and for private consumers. In the transportation sector, RES usage is primarily supported through biomethane use and building of biomethane fueling stations [46].
In 2017, Estonia had already exceeded the 2020 renewable energy target, and in the same year non-ETS emissions were below the 2005 level. Although in 2019, the share of renewable energy in the Estonian primary energy supply was 12.3% higher than the OECD average, and 8.9% higher than the European Union average [40], the country has only four schemes for the support and implementation of RES, which suggests that these policies are very effective for the utilization and implementation of RES, specially in the electricity sector. A report by the International Energy Agency [47] established a group of recommendations to the Government of Estonia in order to address their energy policies gaps. Some of these suggestions included a need to clarify the country’s energy and climate goals for 2030 and 2050; development of specific policy actions and discontinue the utilization of oil shale in the country. Estonia was able to achieve its targets only for the heating and cooling sectors. This can be explained by the fact that the heating and cooling sectors used mainly natural gas imported from Russia. In order to increase its energy security, Estonia started decreasing the natural gas imports from Russia, which potentially justified the constant decrease in the share of natural gas and a respective increase in the share of renewable sources of energy. Estonia was not able to achieve its targets neither for the heating and cooling nor for the transport sector, possibly due to a lack of policies and legal frameworks. In addition, similar to Ireland the transformation of the Estonian energy sector started quite late (in 2000s).

4.2.5. Latvia

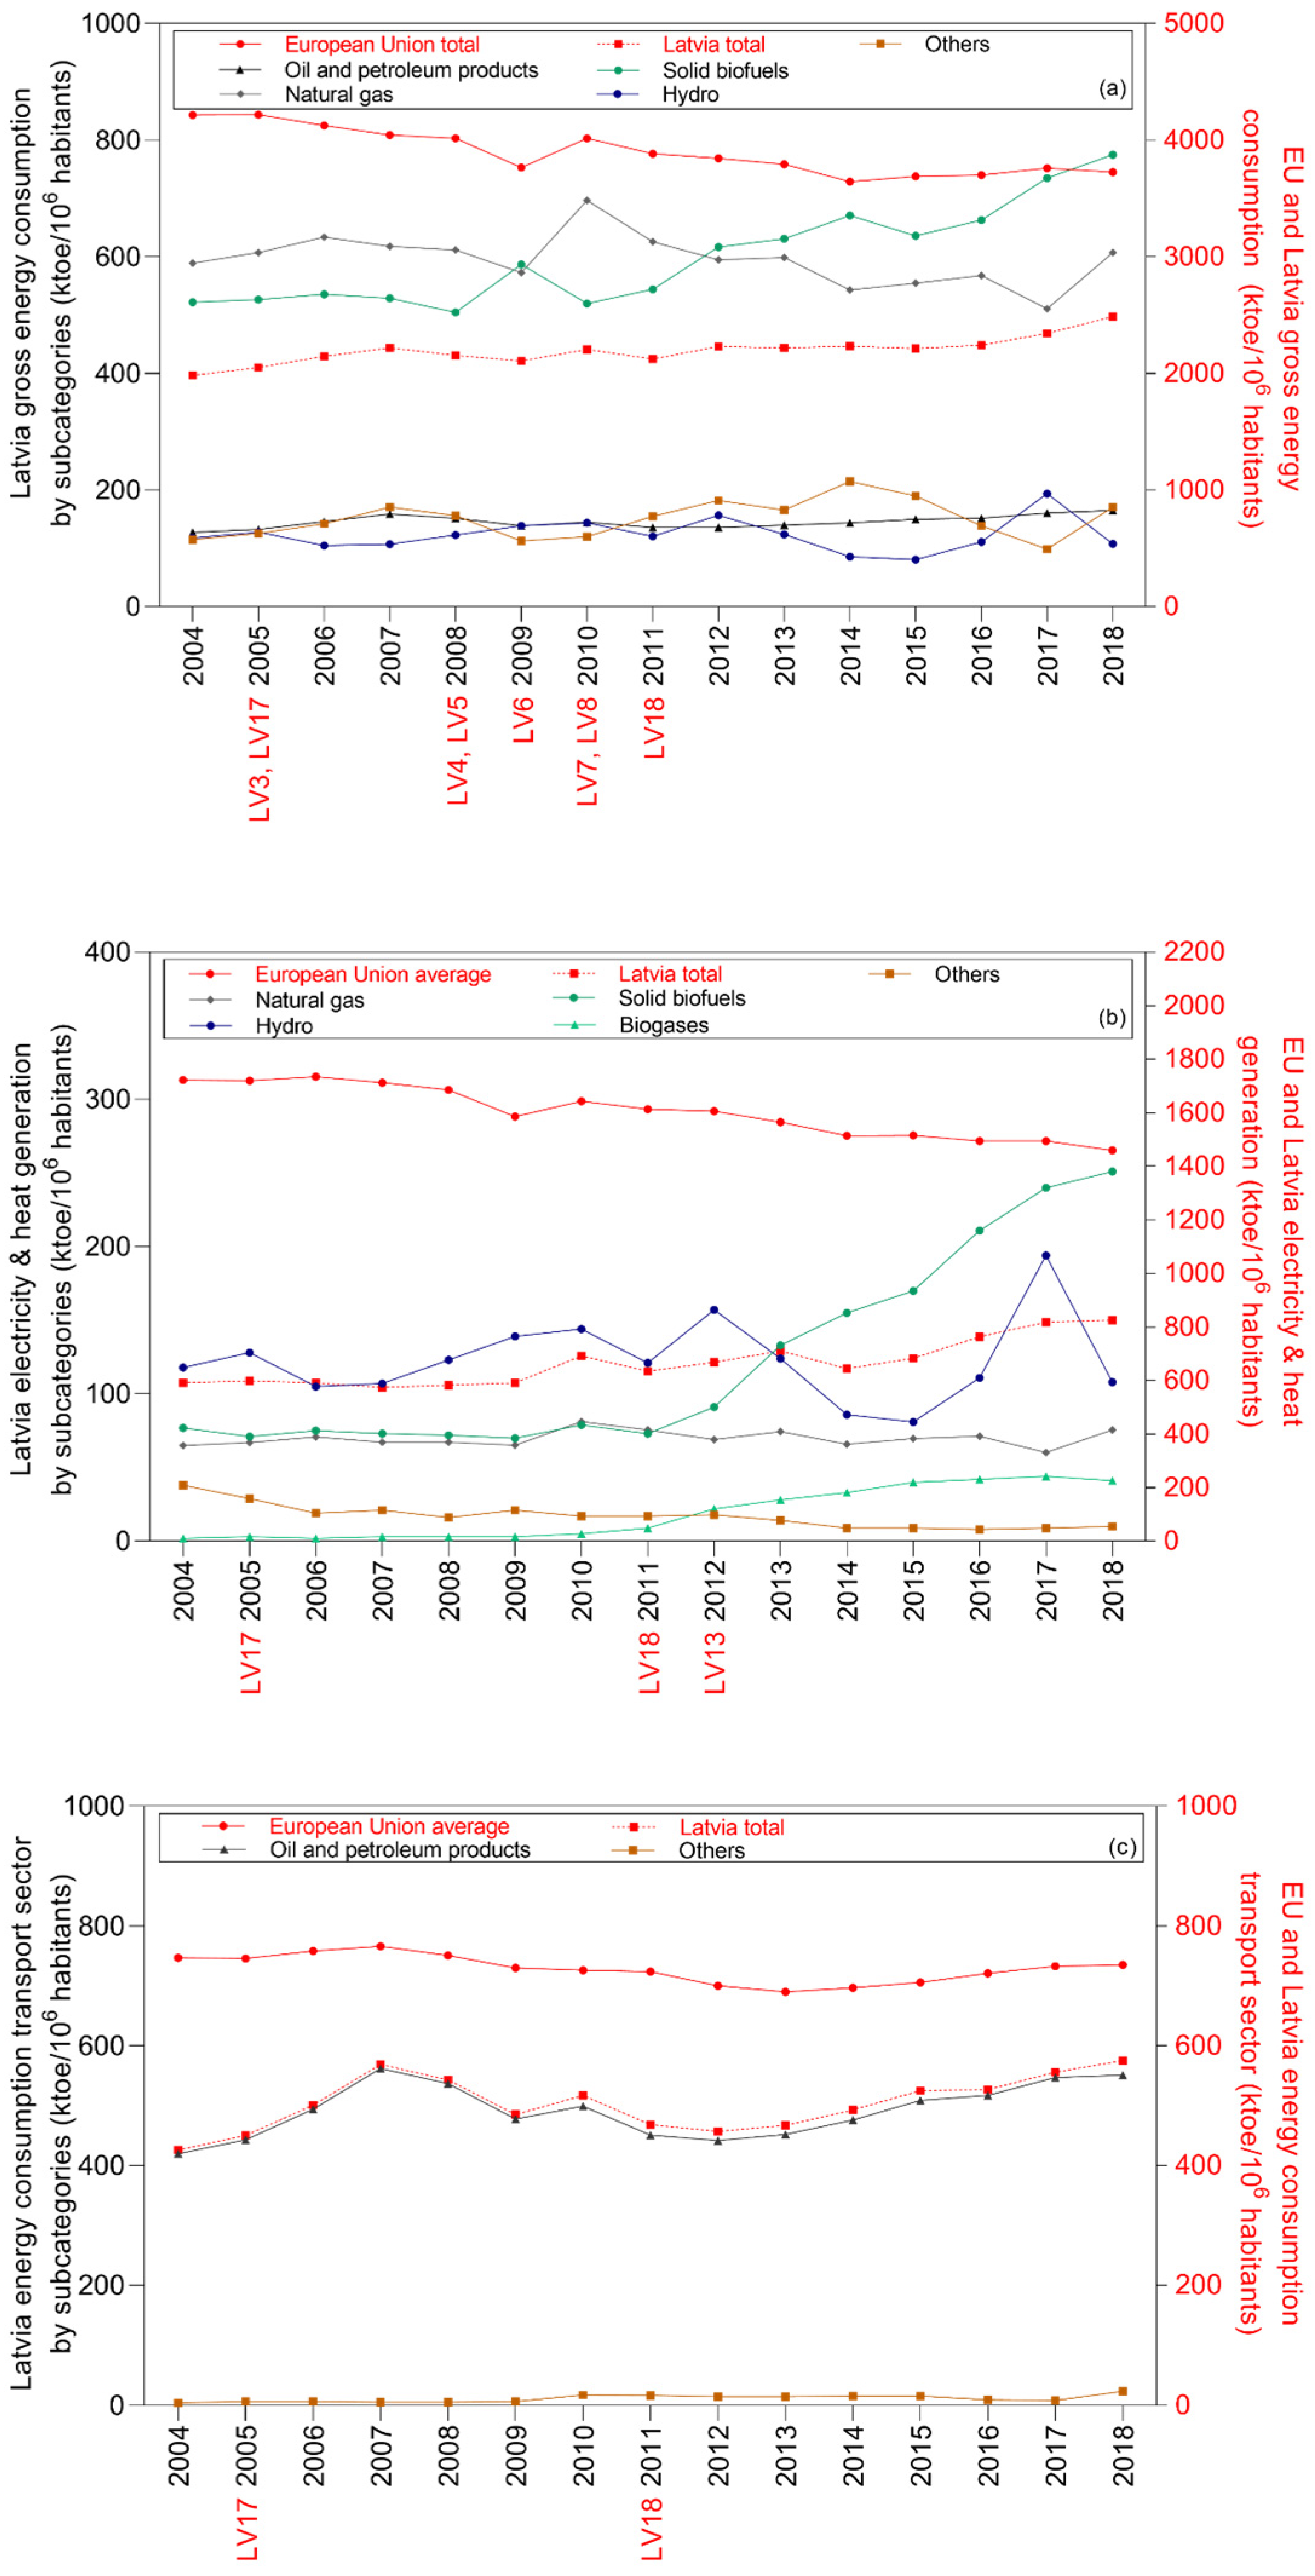
Similar to Estonia, the Latvian gross energy consumption and heating and cooling sectors also presented some instability (Figure 7). Although the overall gross energy consumption of the country was 33–53% below the European Union average, the main source of energy utilized in this sector is still oil and petroleum products. Unlike the countries discussed before, solid biofuels play an important role in the gross energy consumption. In 2010, about 26% of the Latvian gross energy was produced from solid biofuels, while in 2018 this number increased to 31%. A negative weak to moderate correlation (−0.2 r −0.6; 0.0193 p 0.448) and a positive very weak to weak correlation (0.1 r 0.4; 0.0180 p 0.653) were found between the introduction of legal frameworks in the European Union and in Latvia and changes in the share of energy used in the total gross energy production. Although natural gas is the main source of energy utilized in the Latvian the heating and cooling sector (about 50%), in 2018 the share of solid fuels, hydro, and biogas in this sector was, 30%, 13%, and 5% respectively. A negative very weak to weak correlation (−0.1 r −0.4; 0.130 p 0.820) and a positive very weak to weak correlation (0.0 r 0.3; 0.232 p 0.925) were found between the introduction of legal frameworks in the European Union and in Latvia and changes in the share of energy used in the heating and cooling sectors. When it comes to the transportation sector, about 95.8% of the energy utilized in this sector still comes from oil and petroleum products. Between 2004 and 2018 this value decreased by only 2.79%, which shows that additional strategies need to be put in place in order to increase the share of renewable energy in the Latvian transportation sector. A negative very weak to weak correlation (−0.1 r −0.4; 0.171 p 0.840) and a positive very weak to weak correlation (0.0 r 0.3; 0.305 p 0.762) were found between the introduction of legal frameworks in the European Union and in Latvia and changes in the share of energy used in the transportation sector. The Latvian national targets for the share of renewable energy in the electricity, heating and cooling, and transportation sectors are quite ambitious. Their national target was 40%, while the European Union target was 20%. In 2004, the share of renewable energy used in the Latvian electricity sector was already 46%, and by 2018 this value increased to 53% (33% higher than the European Union target). A similar trend was reported in the heating and cooling sectors. In 2004, the share of renewable energy utilized in this sector was 42%, and in 2018 it was 56% (36% higher than the European Union target).
The share of renewable sources of energy in the Latvian electricity sector is supported by two main schemes feed-in-tariff and net-metering. In 2019, the share of renewable energy in the Latvian primary energy supply was 30.5% higher than the OECD average, and 27.1% higher than the European Union average [40], which suggests that the legal frameworks that Latvia has in place for the electricity sector are effective for the production and adoption of RES in this sector. Several tax benefits are applied to the heating and cooling sectors in Latvia. However, heat from RES is not given priority connection to the grid, which can justify the high percentage of natural gas (about 50%) that is still being utilized in the heating and cooling sectors [48]. The Latvian tax regulation mechanism and biofuel quota is not effective in increasing the share of RES in the transportation sector, since in 2018 about 95.8% of the energy utilized in the sector still comes from fossil fuels. Although Latvia has very few regulation mechanisms, the existing schemes seem to be very effective in increasing the share of RES in the electricity and heating and cooling sectors, since the country had achieved the European Union targets fourteen years ago. This can also be explained by the geographical characteristics of Latvia. The country has more than 12,500 rivers, which have been used since the beginning of the 1990s for hydropower generation.

4.2.6. Lithuania

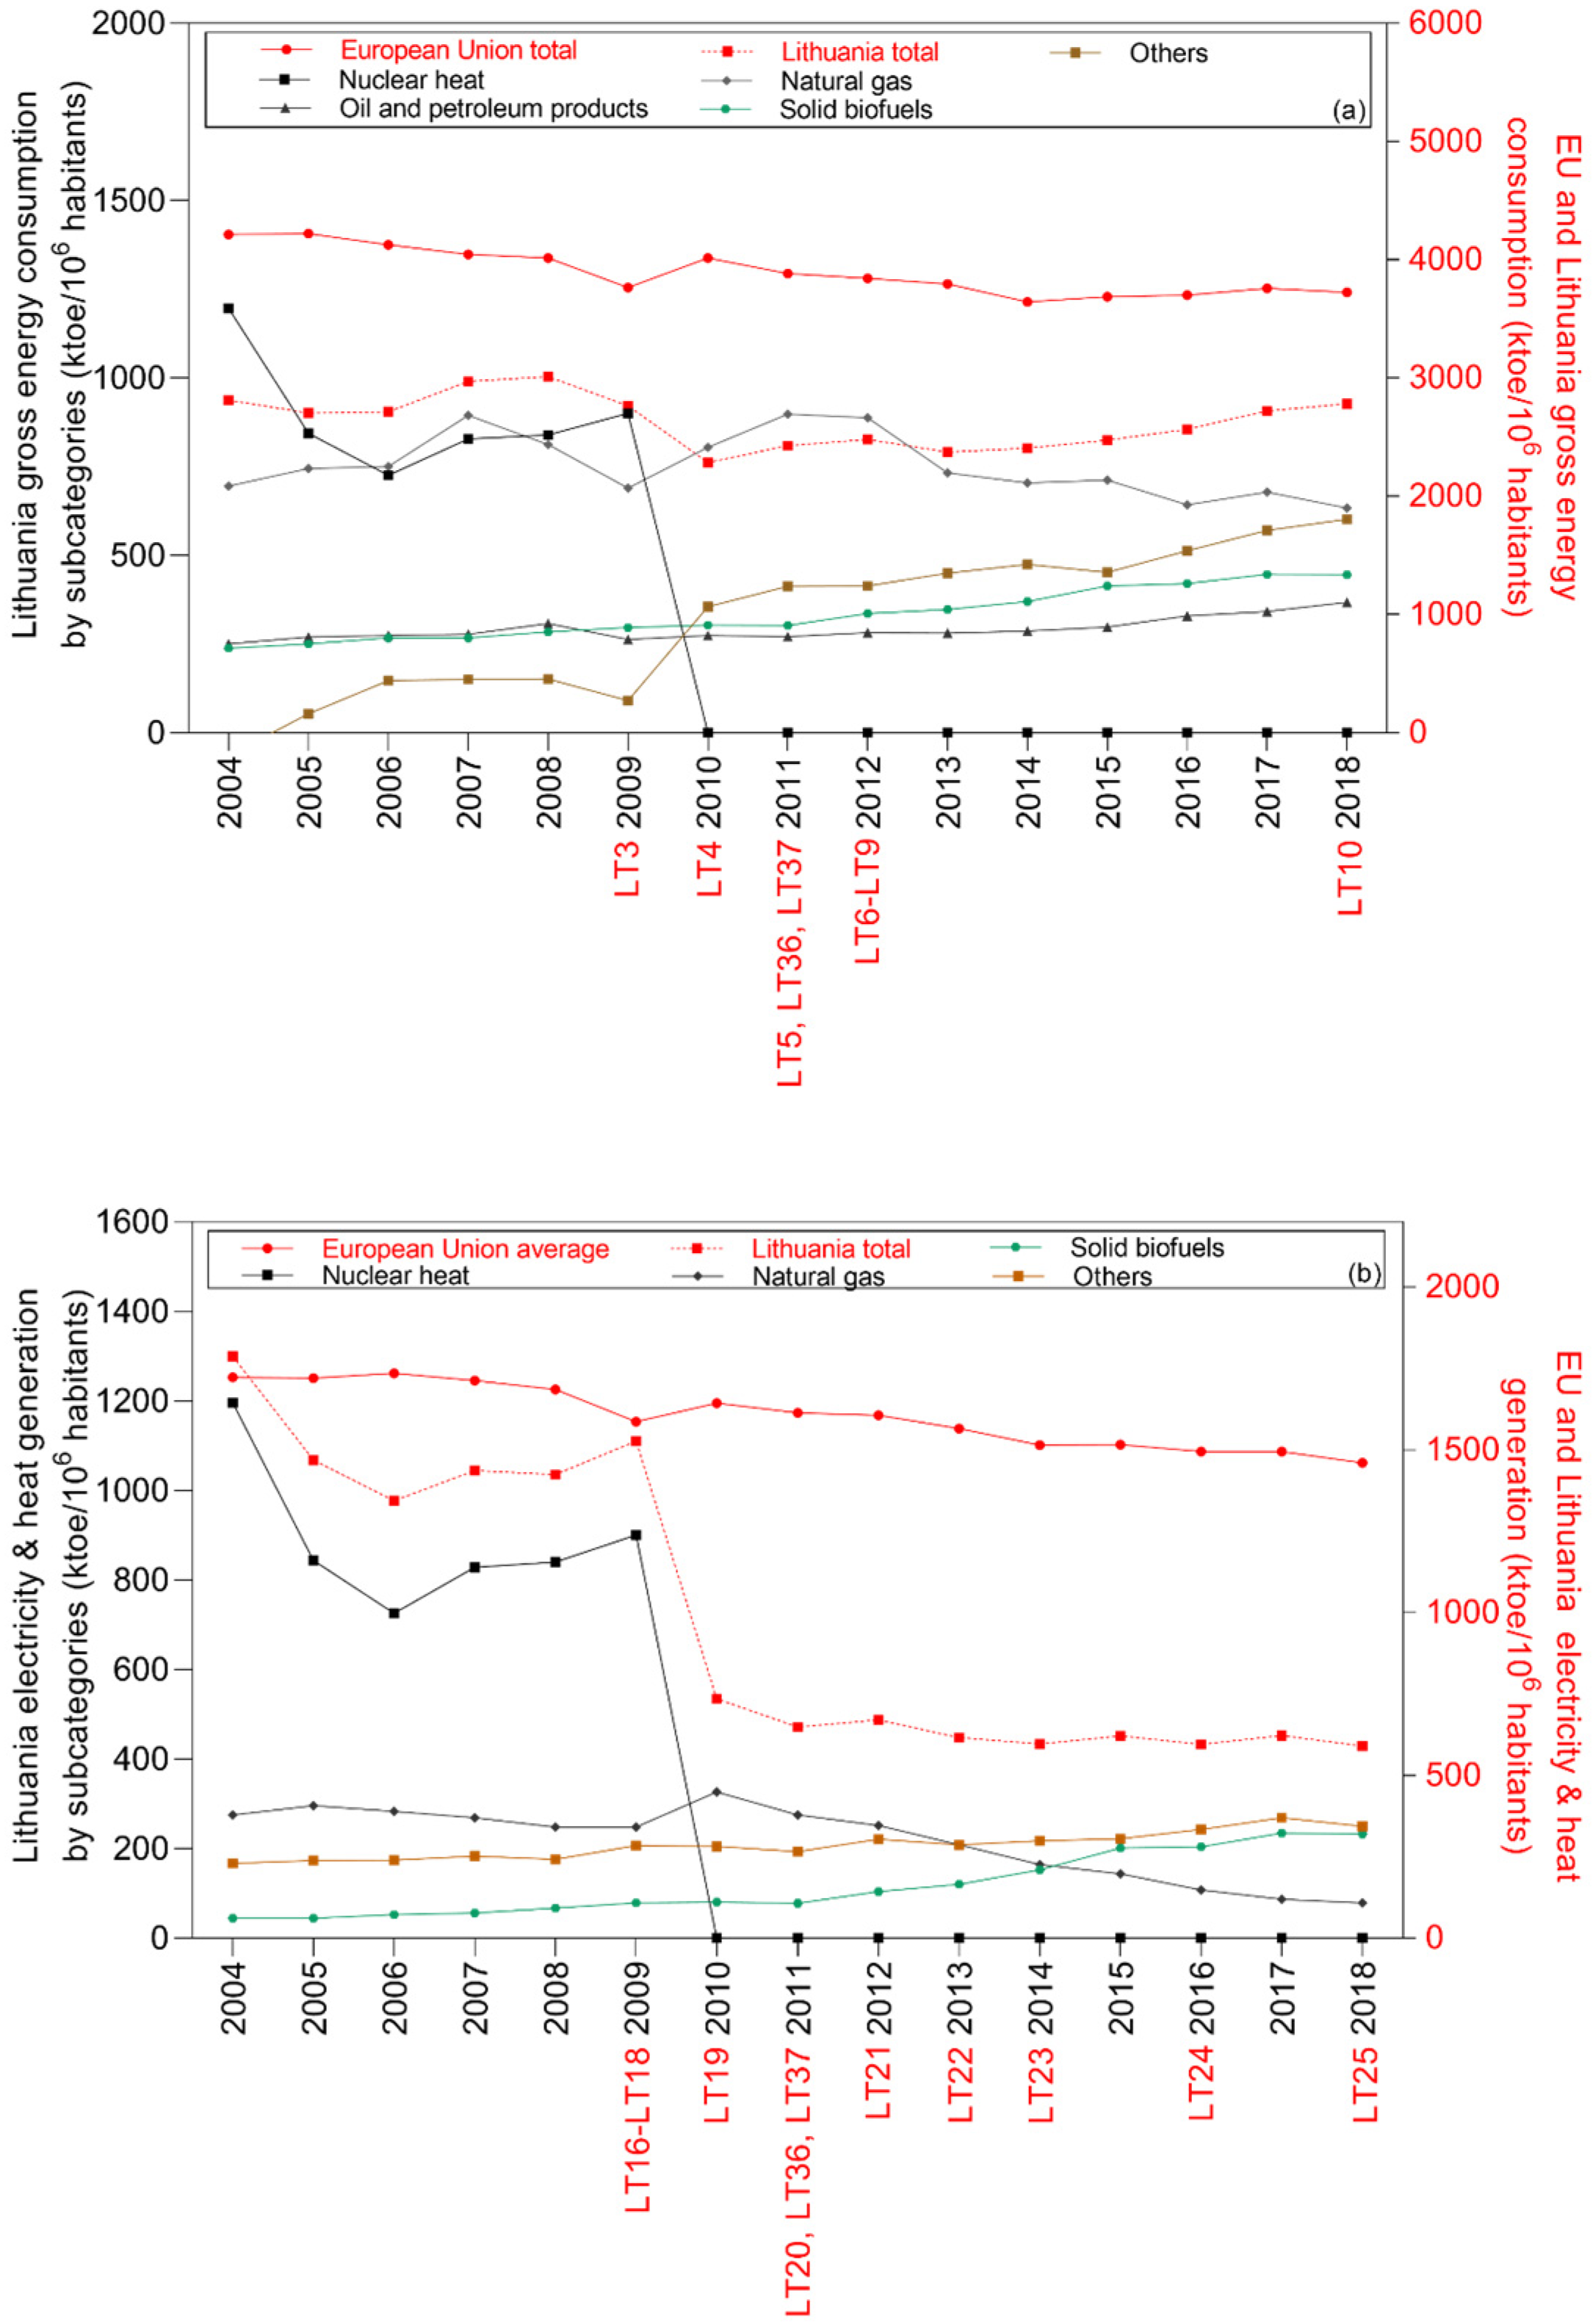
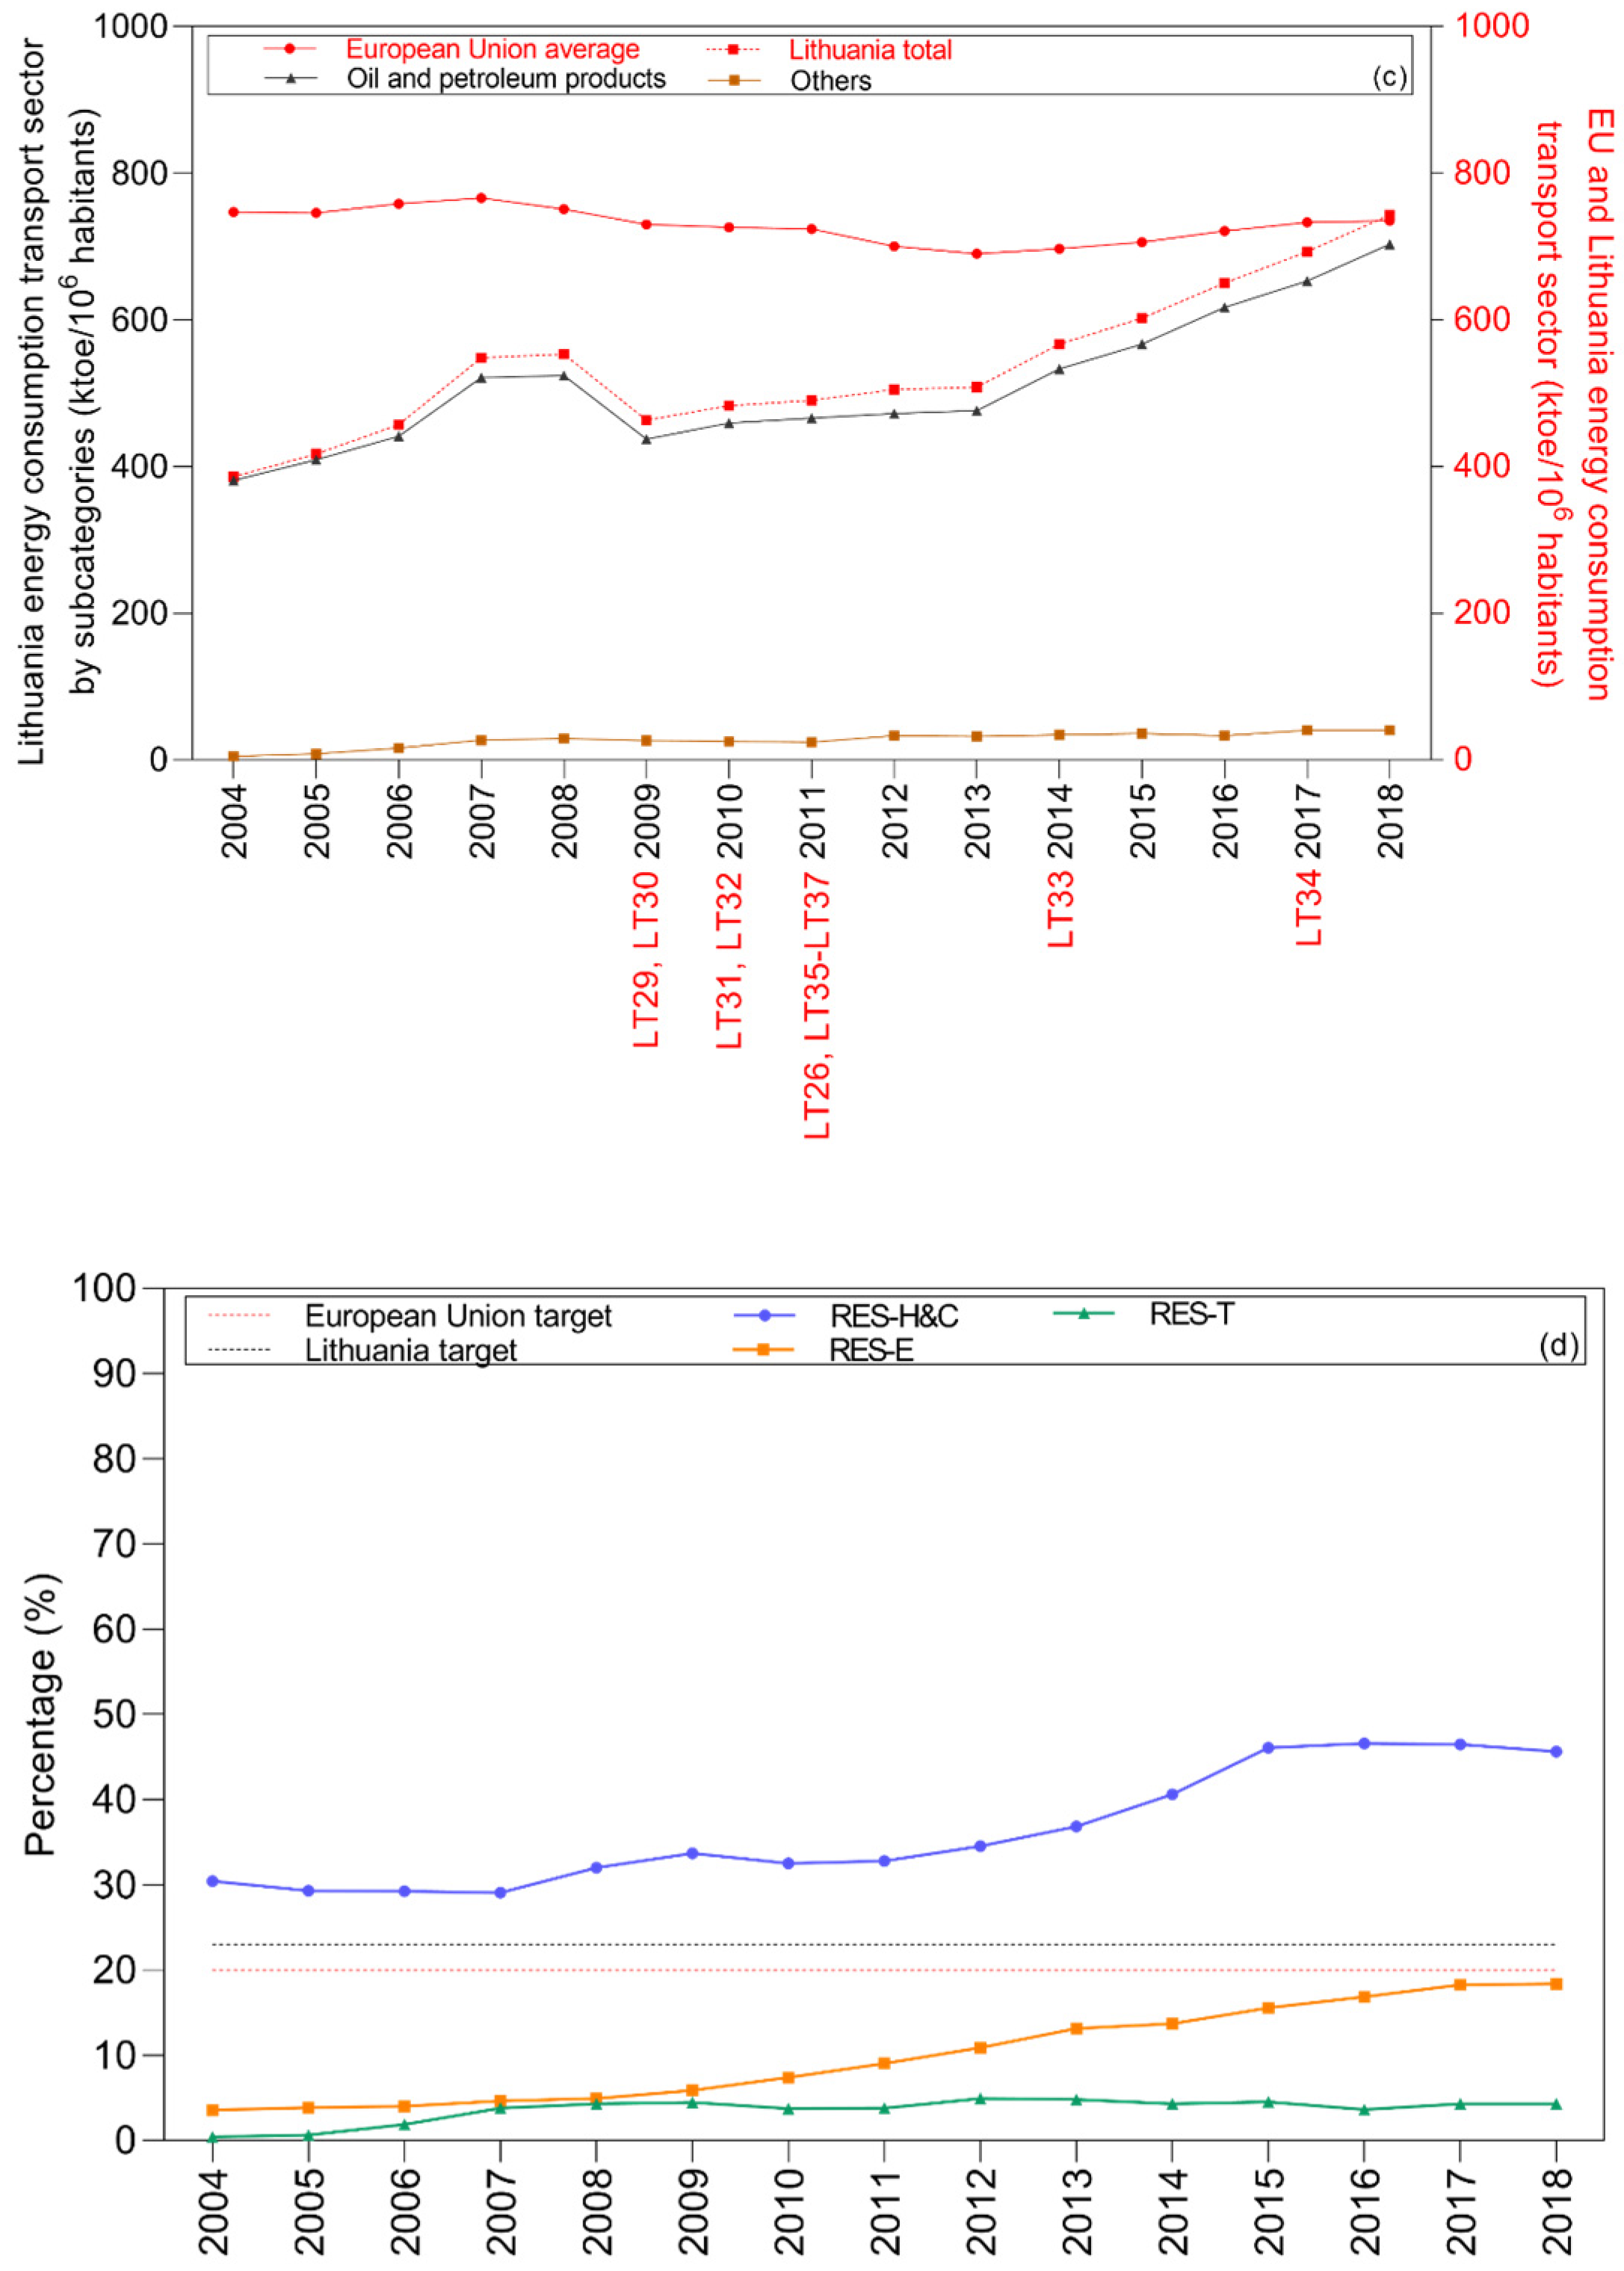
As it can be seen from Figure 8, the Lithuanian gross energy consumption between 2004 and 2018 was 25–33% below the European Union average. A clear change in this sector refers to the end of nuclear heat in 2009. In 2018, the energy utilized in the Lithuanian gross energy consumption was mainly oil and petroleum products (40%), natural gas (23%), and solid biofuels (16%). A similar trend was followed in the heating and cooling sector. In 2009, nuclear heat stopped being provided to this sector, and in 2018 solid biofuels represented 39% of the energy utilized in the heating and cooling sectors. The Lithuanian transportation sector has used mainly oil and petroleum products as a source of energy, being almost 99% of the sector in 2004 and almost 95% in 2018. This very small decrease (about 3%) in the share of fossil fuels in the Lithuanian transportation sector shows that more efforts should be put into it by the Lithuanian Government. In 2004, Lithuania had already achieved their National and European targets for the heating and cooling sector, and their overall share of renewable energy in this sector was 7.4–10.4% higher than the targets. In 2018 the country was only 1.6% below the European Union targets and 4.6% below their national targets. The transportation section was still lagging the targets by 15.7–18.7%. A negative very weak to moderate correlation (−0.1 r −0.5; 0.284 p 0.859) and a positive very weak to weak correlation (0.0 r 0.3; 0.0180 p 0.653) were found between the introduction of legal frameworks in the European Union and in Lithuania and changes in the share of energy used in the total gross energy production. A negative very weak to moderate correlation (0.0 r −0.4; 0.112 p 0.953) and a positive very weak to weak correlation (0.0 r 0.4; 0.224 p 1.00) were found between the introduction of legal frameworks in the European Union and in Lithuania and changes in the share of energy used in the heating and cooling sectors. A negative very weak to strong correlation (−0.1 r −0.7; 0.00932 p 0.840) and a positive very weak to weak correlation (0.1 r 0.4; 0.187 p 0.694) were found between the introduction of legal frameworks in the European Union and in Lithuania and changes in the share of energy used in the transportation sector.
In Lithuania, the electricity produced from renewable sources of energy is promoted mainly through a sliding feed-in premium. RES plants with the installed capacity exceeding 10 kW obtain the guaranteed tariff rate through tenders. It should be noted that only the already existing RES plants are supported under the feed-in premium scheme. For new RES installations, support is not available, and no tenders are currently being organized. However, for renewable energy technologies there is a new support scheme, which was introduced from 2019-technology-neutral tenders in combination with a fixed feed-in premium. Moreover, the production of renewable electricity may apply for subsidies and loans from the Environmental Project Management Agency (EPMA) under the Climate Change Special Program and are excused from excise duty. Net-metering is placed for solar, wind, and biomass power installations. The production of RES-H&C is released from environmental pollution tax, and it is also eligible for loans and subsidies from the EPMA under the Climate Change Special Program. Furthermore, heat suppliers are compelled to buy all the heat generated from renewable energy sources (priority acquisition), except if the renewable heat production surpasses the heat requirements. Finally, feed-in tariffs are set by the National Commission for Energy Control and Prices (NCC) for biogas that is injected into the natural gas system [49]. In 2019, the share of renewable energy in the Lithuanian primary energy supply was 9.5% higher than the OECD average, and 6.1% higher than the European Union average [40]. In 2018, the country had successfully achieved its RES-H&C goals. Although Lithuania has 14 supports schemes to promote the development of renewable sources of energy, the country was not able to achieve its targets for the electricity and transport sectors. This can be explained by the fact that 30 years ago, nuclear heat was the main source of energy used in the Lithuanian heat and cooling sectors. By the end of 2009, the country closed its last nuclear reactor, and nuclear heat was replaced by solid fossil fuels.
Table 4 summarizes the performance of the six countries in achieving their National and EU targets. In 2018, only Denmark and Latvia had achieved two-thirds of their targets for the electricity and heating and cooling sectors. All the other countries had achieved the targets for only one sector (electricity or heating and cooling). None of the countries was able to achieve their targets for the transportation sector, which shows that further research and policies are required in this area.

4.3. Overview

Based on the legal framework provided for each country in Section 2, the data gathered about the case study in Section 3, and the legislative analysis and results achieved in Section 4, it is understood that the better the national legislations are implemented and taken seriously by the governments, the higher the energy efficiency level of the State Member will be. For instance, in Estonia, the total gross energy between the years 2007–2018 was even higher than the European Union average (4–28%). This is of particular importance since the increase of solid biofuels usage instead of fossil fuels affects the carbon emissions and the overall energy efficiency of the country. All these factors are related and depend on the legal framework of the country.
In this research, by comparing a wider range of EU member countries and comparing eastern Europe to the western part, it was possible to show how implementing policies will affect the countries’ contribution to the EU directives. While previous studies have mostly focused on either decarbonization or comparing much-limited state members, this study goes further and gets in touch with the core legal system of six EU countries located in different parts of Europe. As these countries have different legal systems, it is possible and analyze how having different national laws and procedures affect the EU goals and the transition to a low carbon society.
Most researchers in this field have focused for example on the sustainable bioeconomy, rather than on the policy instruments and their relationship with the increase of re-newable sources of energy in the final energy mix. There has also been research focusing on reduction of geopolitical risks by increasing the domestic energy production and the steps that need to be taken towards this end. The authors reported the importance of creating new alternatives to centralized restructure for combining different type of interests. Another research emphasizes on the awareness of different approaches to-wards different countries toward sustainability. It was reported that the systems must be modified for each country and legal frameworks cannot be applied to all countries without modifications regarding the cost of producing bioenergy energy and trans-porting the product.

5. Conclusions and Policy Implications

Although the European Commission has established several legal frameworks for the implementation and promotion of renewable sources of energy in the electricity, heating and cooling, and transportation sector, this study shows that some of these regulations have not been effective at the national level. None of the countries investigated in this paper (Denmark, Ireland, Netherlands, Estonia, Latvia, and Lithuania) were able to achieve their renewable energy targets for the transportation sector, which suggests that further attention should be paid to the European and National legal frameworks currently in place to allow the countries to achieve their obligations. In 2018, only Denmark and Latvia were able to achieve the renewable energy targets for two sectors (electricity, and heating and cooling). Ireland and Estonia achieved the renewable energy National and European targets only for the electricity sector, while Lithuania achieved the targets only for the heating and cooling sector. In 2018, the Netherlands had a very poor performance in the implementation of renewable sources of energy in its energy mix, and in achieving the European targets for all the sectors. Very weak correlations were found between the introduction of national or European legal frameworks and changes in the share of energy used for gross energy production, heating and cooling, and the transportation sector in Denmark, the Netherlands, and Lithuania. A very weak to moderate correlation was found between the implementation of national legislation and the changes in the share of solid fossil fuels in the Irish heating and cooling sectors; of liquid biofuels in the Irish transportation sector; of solid fossil fuels in the Latvian gross energy generation; and of total energy production in the Latvian gross energy generation. The results obtained in this paper suggest that only countries that have a very well-established political vision for their energy sector and political willingness have good performances when it comes to the implementation of renewable sources of energy in their energy mix. Countries without a well-defined trajectory only implement short-term measures that are neither accountable nor reliable. The European Union Directives for the promotion and implementation of renewable sources of energy in the energy mix are not as effective as expected.
The countries using EU support systems, such as loans, and being pressured by their government to reach EU standards by 2030, as in the case of Estonia, have made a huge contribution. They have tried to reduce fossil fuels in every sector as much as possible. Replacing renewable sources for a country such as Estonia with biomass and bioenergy is the best source while there are fewer sunny days and less wind to generate solar energy or wind power, even though they are trying even to use those sources in every corner of the country that has the potential.
One of the limitations of this study was getting in touch with the policymakers and governmental agencies to get the legal framework of the countries available in English. This has limited the research to the utilization of credible Internet databases, relevant laws regarding renewable energies on this matter, and previous research in this field.
Future studies can include a thorough analysis of more state members or even cover all 27 EU members. Then it would be possible to analyze the overall efficiency of the EU Directive goals at the national and micro-level. The identification of prominent and successful national frameworks can then be further analyzed by the European Commission and transposed to the entire EU in order to ensure a fast transition to a low carbon society.
As for future predictions, the authors strongly believe that the utilization of renewable sources of energy will increase in Europe mainly because the countries need energy independence, especially from Russia, now that there are sanctions due to the Ukraine invasion. Thus more and more, Europe will focus on decreasing energy imports, especially from non-renewable sources of energy. A unification of the European energy sector is expected to take place in the near future, and very likely this will also lead to changes in the current regulations. Therefore, countries can increase the amount of renewable sources of energy in their energy mix, and increase the overall support schemes as well.

Supplementary Materials

The following supporting information can be downloaded at: https://www.mdpi.com/article/10.3390/su14106314/s1.

Author Contributions

Conceptualization, E.N., L.R.-M. and T.K.; methodology, E.N. and L.R.-M.; software, L.R.-M.; validation, L.R.-M.; formal analysis, E.N., L.R.-M. and T.K.; investigation, E.N. and L.R.-M.; resources, E.N., L.R.-M. and T.K.; data curation, E.N. and L.R.-M.; writing—original draft preparation, E.N., L.R.-M. and T.K.; writing—review and editing, E.N., L.R.-M., A.I. and T.K.; visualization, E.N., L.R.-M. and T.K.; supervision, L.R.-M. and T.K.; project administration, T.K.; funding acquisition, T.K. All authors have read and agreed to the published version of the manuscript.

Funding

This research received no external funding.

Institutional Review Board Statement

Not applicable.

Informed Consent Statement

Not applicable.

Data Availability Statement

Not applicable.

Acknowledgments

The research for this article was conducted with the support from the Dora Plus program and the European Regional Development Fund.
Sustainability 14 06314 i001

Conflicts of Interest

The authors declare no conflict of interest.

List of Abbreviations

EESEuropean Energy System
EUEuropean Union
FQDFuel Quality Directive (2009/30/EC)
GHGGreenhouse Gas
ILUCIndirect Land Use Change
RERenewable Energy
REDRenewable Energy Directive
RESRenewable Energy Source
RES-ERenewable Energy Source for electricity
RES-H&CRenewable Energy Source for heating and cooling
RES-TRenewable Energy Source for transport

References

  1. OECD/IEA. Medium-Term Renewable Energy Market Report 2016: Market Analysis and Forecasts to 2021; International Energy Agency: Paris, France, 2016. [Google Scholar]
  2. OECD/IEA. Renewables 2017: Analysis and Forecasts to 2022; International Energy Agency: Paris, France, 2017. [Google Scholar]
  3. Sovacool, B.K. How long will it take? Conceptualizing the temporal dynamics of energy transitions. Energy Res. Soc. Sci. 2016, 13, 202–215. [Google Scholar] [CrossRef]
  4. Hisschemöller, M.; Sioziou, I. Boundary organisations for resource mobilisation: Enhancing citizens’ involvement in the Dutch energy transition. Environ. Politics 2013, 22, 792–810. [Google Scholar] [CrossRef]
  5. REN21. Renewables 2018 Global Status Report; REN21 Secretariat: Paris, France, 2018. [Google Scholar]
  6. Ruotsalainen, J.; Karjalainen, J.; Child, M.; Heinonen, S. Culture, values, lifestyles, and power in energy futures: A critical peer-to-peer vision for renewable energy. Energy Res. Soc. Sci. 2017, 34, 231–239. [Google Scholar] [CrossRef]
  7. Gui, E.M.; MacGill, I. Typology of future clean energy communities: An exploratory structure, opportunities, and challenges. Energy Res. Soc. Sci. 2018, 35, 94–107. [Google Scholar] [CrossRef]
  8. Gürtler, K.; Postpischil, R.; Quitzow, R. The dismantling of renewable energy policies: The cases of Spain and the Czech Republic. Energy Policy 2019, 133, 110881. [Google Scholar] [CrossRef]
  9. European Union. The Future of Road Transport; Publications Office of the European Union: Luxembourg, 2019. [Google Scholar]
  10. European Commission. Biofuels; European Commission: Brussels, Belgium, 2020; Available online: https://ec.europa.eu/energy/topics/renewable-energy/biofuels/overview_en (accessed on 18 July 2021).
  11. European Commission. Communication from the Commission to the European Parliament, the European Council, the Council, the European Economic and Social Committee, the Committee of the Regions and the European Investment Bank COM/2018/773 A Clean Planet for All a European Strategic Long-Term Vision for a Prosperous, Modern, Competitive and Climate Neutral Economy; European Commission: Brussels, Belgium, 2019. [Google Scholar]
  12. International Renewable Energy Agency. Advanced Biofuels. What Holds Them Back? International Renewable Energy Agency: Abu Dhabi, United Arab Emirates, 2019. [Google Scholar]
  13. Bórawski, P.; Bełdycka-Bórawska, A.; Szymańska, E.J.; Jankowski, K.J.; Dubis, B.; Dunn, J.W. Development of renewable energy sources market and biofuels in The European Union. J. Clean. Prod. 2019, 228, 467–484. [Google Scholar] [CrossRef]
  14. Marques, A.C.; Fuinhas, J.A. Are public policies towards renewables successful? Evidence from European countries. Renew. Energy 2012, 44, 109–118. [Google Scholar] [CrossRef]
  15. Papież, M.; Śmiech, S.; Frodyma, K. Determinants of renewable energy development in the EU countries. A 20-year perspective. Renew. Sustain. Energy Rev. 2018, 91, 918–934. [Google Scholar] [CrossRef]
  16. Tutak, M.; Brodny, J. Renewable energy consumption in economic sectors in the EU-27. The impact on economics, environment and conventional energy sources. A 20-year perspective. J. Clean. Prod. 2022, 345, 131076. [Google Scholar] [CrossRef]
  17. Brodny, J.; Tutak, M.; Bindzár, P. Assessing the Level of Renewable Energy Development in the European Union Member States. A 10-Year Perspective. Energies 2021, 14, 3765. [Google Scholar] [CrossRef]
  18. Asha, S.; Thomas, C.; Calliope, P. Policy review for biomass value chains in the European bioeconomy. Glob. Transit. 2021, 3, 13–42. [Google Scholar] [CrossRef]
  19. Calliope, P.; Sonja, G.; Paraskevi, K.; Stavros, P.; Yuri, K.; Michal, W.; Kyriakos, M.; Philippe, M.; Ingvar, L. Advanced biofuels to decarbonise European transport by 2030: Markets, challenges, and policies that impact their successful market uptake. Energy Strategy Rev. 2021, 34, 100633. [Google Scholar] [CrossRef]
  20. Mai-Moulin, T.; Hoefnagels, R.; Grundmann, P.; Junginger, M. Effective sustainability criteria for bioenergy: Towards the implementation of the european renewable directive II. Renew. Sustain. Energy Rev. 2021, 138, 110645. [Google Scholar] [CrossRef]
  21. Eurostat. EU’s Energy Import Dependency Decreased in 2020; Eurostat: Luxembourg, 2022. Available online: https://ec.europa.eu/eurostat/web/products-eurostat-news/-/EDN-20220209-1 (accessed on 20 January 2022).
  22. John Matthew, C.; John, C.; Brian, Ó.G. Modelling national policy making to promote bioenergy in heat, transport and electricity to 2030–Interactions, impacts and conflicts. Energy Policy 2018, 123, 579–593. [Google Scholar] [CrossRef]
  23. Cotella, G.; Crivello, S.; Karatayev, M. Chapter 2-European Union Energy Policy Evolutionary Patterns. In Low-Carbon Energy Security from a European Perspective; Academic Press: Cambridge, MA, USA, 2016; pp. 13–42. [Google Scholar] [CrossRef]
  24. Danyel, R.; Mischa, B. Policy differences in the promotion of renewable energies in the EU member states. Energy Policy 2004, 32, 843–849. [Google Scholar] [CrossRef]
  25. European Commission. Communication from the Commission Energy for the Future Renewable Sources of Energy-White Paper for a Community Strategy and Action Plan COM(97)599; European Commission: Brussels, Belgium, 1997. [Google Scholar]
  26. Haas, R.; Eichhammer, W.; Huber, C.; Langniss, O.; Lorenzoni, A.; Madlener, R.; Menanteau, P.; Morthorst, P.E.; Martins, A.; Oniszk, A.; et al. How to promote renewable energy systems successfully and effectively. Energy Policy 2004, 32, 833–839. [Google Scholar] [CrossRef]
  27. Jefferson, M. Chapter 12. Energy Policies for Sustainable Development. In World Energy Assessment: Energy and the Challenge of Sustainability; United Nations Development Programme: New York, NY, USA, 2000. [Google Scholar]
  28. Mitchell, C. The Political Economy of Sustainable Energy. In Energy, Climate and the Environment; Elliott, D., Wood, G., Eds.; Palgrave Macmillan UK: London, UK, 2008. [Google Scholar]
  29. United Nations Development Programme. Promotion of Wind Energy: Lessons Learned from International Experience and UNDP-GEF Projects; United Nations Development Programme: New York, NY, USA, 2008. [Google Scholar]
  30. European Commission. Commision Decision of 30 June 2009 Establishing a Template for National Renewable Energy Action Plans under Directive 2009/28/EC of the European Parliament and of the Council; European Commission: Brussels, Belgium, 2009. [Google Scholar]
  31. European Commission. Knowledge Centre for Bioeconomy; European Commission: Brussels, Belgium, 2020; Available online: https://knowledge4policy.ec.europa.eu/bioeconomy_en (accessed on 9 September 2021).
  32. European Parliament and of the Council. Directive 2009/28/EC of 23 April 2009 on the promotion of the use of energy from renewable sources and amending and subsequently repealing Directives 2001/77/EC and 2003/30/EC. Off. J. Eur. Union 2009, 140, 16–47. [Google Scholar]
  33. European Parliament and of the Council. Directive (EU) 2015/1513 of 9 September 2015 amending Directive 98/70/EC relating to the quality of petrol and diesel fuels and amending Directive 2009/28/EC on the promotion of the use of energy from renewable sources. Off. J. Eur. Union 2015, 239, 1–29. [Google Scholar]
  34. European Parliament and of the Council. Directive (EU) 2018/2001 of 11 December 2018 on the promotion of the use of energy from renewable sources. Off. J. Eur. Union 2018, 328, 82–209. [Google Scholar]
  35. Elena, L.; Isabella, D.O.; Alessia, P.; Linda, T.; Martina, P.; Polo López, C.; Giulia, G. Photovoltaic technologies in historic buildings and protected areas: Comprehensive legislative framework in Italy and Switzerland. Energy Policy 2022, 161, 112772. [Google Scholar] [CrossRef]
  36. European Parliament and of the Council. Commission Implementing Regulation (EU) 2020/1294 of 15 September 2020 on the Union renewable energy financing mechanism. Off. J. Eur. Union 2020, 303, 1–17. [Google Scholar]
  37. European Commission. Denmark: Overall Summary; European Commission: Brussels, Belgium, 2012; Available online: http://www.res-legal.eu/search-by-country/denmark/ (accessed on 17 August 2021).
  38. Danish Energy Agency. Denmark’s Energy and Climate Outlook 2019-Baseline Scenario Projection Towards 2030 With Existing Measures (Frozen Policy); Danish Energy Agency: Copenhagen, Denmark, 2019; pp. 1–87.
  39. The Danish Energy Agency. The Danish Energy Model Innovative, Efficient and Sustainable; The Danish Energy Agency: Copenhagen, Denmark, 2021.
  40. OECD. Renewable Energy (Indicator); OECD: Paris, France, 2021. [Google Scholar]
  41. European Commission. Ireland: Overall Summary; European Commission: Brussels, Belgium, 2012; Available online: http://www.res-legal.eu/en/search-by-country/ireland/ (accessed on 17 August 2021).
  42. Energy Institute. Our Energy History; Energy Institute: London, UK, 2021. [Google Scholar]
  43. OECD/IEA. Energy Policies of EIA Countries-Ireland 2019 Review; European Commission: Brussels, Belgium, 2019. [Google Scholar]
  44. European Commission. Netherlands: Overall Summary; European Commission: Brussels, Belgium, 2012; Available online: http://www.res-legal.eu/en/search-by-country/netherlands/ (accessed on 17 August 2021).
  45. OECD/IEA. The Netherlands 2020-Energy Policy Review; European Commission: Brussels, Belgium, 2020. [Google Scholar]
  46. European Commission. Estonia: Overall Summary; European Commission: Brussels, Belgium, 2012; Available online: http://www.res-legal.eu/search-by-country/estonia/summary/ (accessed on 17 August 2021).
  47. OECD/IEA. Energy Policies of EIA Countries-Estonia 2019 Review; OECD: Paris, France, 2019. [Google Scholar]
  48. European Commission. Latvia: Overall Summary; European Commission: Brussels, Belgium, 2012; Available online: http://www.res-legal.eu/search-by-country/latvia/ (accessed on 17 August 2021).
  49. European Commission. Lithuania: Overall Summary; European Commission: Brussels, Belgium, 2012; Available online: http://www.res-legal.eu/search-by-country/lithuania/ (accessed on 17 August 2021).
Figure 1. Sources of energy used in the European Union between 2004–2018 for (a) gross energy generation; (b) heating and cooling; (c) transport. EU3—Directive 2009/28/EC, EU4—Directive 2015/1513/EC, EU5—Directive 2018/2001/EC.
Sustainability 14 06314 g001aSustainability 14 06314 g001b
Figure 2. Share of energy from renewable sources in the European Union, Denmark, Ireland, Estonia, Latvia, Lithuania, and Netherlands in the time period of 2004–2018 for (a) gross energy generation; (b) heating and cooling; (c) transport; (d) overall RES share.
Sustainability 14 06314 g002aSustainability 14 06314 g002b
Figure 3. Sources of energy used in Denmark between 2004–2018 for (a) gross energy generation; (b) heating and cooling; (c) transport; (d) sectorial and overall RES share.
Sustainability 14 06314 g003aSustainability 14 06314 g003b
Figure 4. Sources of energy used in Ireland between 2004–2018 for (a) gross energy generation; (b) heating and cooling; (c) transport; (d) sectorial and overall RES share.
Sustainability 14 06314 g004aSustainability 14 06314 g004b
Figure 5. Sources of energy used in the Netherlands between 2004–2018 for (a) gross energy generation; (b) heating and cooling; (c) transport; (d) sectorial and overall RES share.
Sustainability 14 06314 g005aSustainability 14 06314 g005b
Figure 6. Sources of energy used in Estonia between 2004–2018 for (a) gross energy generation; (b) heating and cooling; (c) transport; (d) sectorial and overall RES share.
Sustainability 14 06314 g006aSustainability 14 06314 g006b
Figure 7. Sources of energy used in Latvia between 2004–2018 for (a) gross energy generation; (b) heating and cooling; (c) transport; (d) sectorial and overall RES share.
Sustainability 14 06314 g007aSustainability 14 06314 g007b
Figure 8. Sources of energy used in Lithuania between 2004–2018 for (a) gross energy generation; (b) heating and cooling; (c) transport; (d) sectorial and overall RES share.
Sustainability 14 06314 g008aSustainability 14 06314 g008b
Table 1. Novelty of this paper when compared to other studies.
Review of Policies/Support Schemes
Electricity
Review of Policies/Support Schemes: Heating and CoolingReview of Policies/Support Schemes: TransportEffect of the Policies in the Energy Consumption and SupplySource

Premium tariff, feed-in tariff, net-metering, loan, sliding feed-in premium, subsidies, tax regulation mechanisms, tenders

Premium tariff, feed-in tariff, subsidies, tax regulation mechanisms, loan

Biofuel quotas, premium tariff, tax regulation, mechanisms, subsidies

Share of energy from renewable sources, share of energy from renewable sources in gross electricity consumption, share of energy from renewable sources for heating and cooling, total RES, gross energy consumption total energy supply in the electricity & heat sector, final energy consumption in the transport sector
This study
√/✕
Loans, premium tariff, tax regulation, mechanisms, subsidies
-[19]
---√/✕
Share of energy from renewable sources, share of energy from renewable sources for heating and cooling, final energy consumption in the transport sector
[22]
---√/✕
Share of energy from renewable sources in gross energy consumption, national energy efficiency targets, energy efficiency progress
[23]
√ Complete list of parameters; √/✕ partial list of parameters; - not available.
Table 2. Summary of the support schemes currently available in Estonia, Latvia, and Lithuania Denmark, Ireland, and Netherlands to produce electricity, heating and cooling, and transport.
SectorSupport SchemeDenmarkIrelandNetherlandsEstoniaLatviaLithuania
ElectricityPremium tariffYes-YesYes--
Feed-in tariff-Yes--YesYes
Net-meteringYes-Yes-YesYes
LoanYes-Yes--Yes
Sliding feed-in premium------
Subsidy-Yes---Yes
Tax regulation mechanisms--Yes--Yes
TendersYes-YesYes-Yes
Heating and coolingPremium tariffYes-Yes--Yes
Feed-in tariff-----Yes
Subsidy-YesYesYes-Yes
Loan--Yes--Yes
Tax regulation mechanismsYesYesYes-YesYes
TransportBiofuel quotaYesYesYes-YesYes
Premium tariffYes-----
Tax regulation mechanismsYes-Yes-YesYes
Subsidy---Yes-Yes
Total amount of schemes95114514
(Yes) this scheme is available in this country (-) this scheme is not available in this country.
Table 3. Sources used in this paper to collect the list of regulations at country level.
CountryLegal Source OnlineWebsite
DenmarkRetsinformation—State legal information systemhttps://www.retsinformation.dk/ (accessed on 8 June 2020)
IrelandElectronic Irish Statute Book (eISB)—Government of Irelandhttp://www.irishstatutebook.ie/ (accessed on 8 June 2020)
NetherlandsOverheid—Ministry of the Interiorhttps://wetten.overheid.nl/zoeken (accessed on 8 June 2020)
EstoniaRiigi Teataja—State Chancellery, Ministry of Justicehttps://www.riigiteataja.ee/ (accessed on 8 June 20280)
LatviaLatvijas Vēstnesis—Official Gazette of the Republic of Latviahttps://www.vestnesis.lv/ (accessed on 8 June 2020)
LithuaniaTeisės Aktų Registras—Office of the Seimas of the Republic of Lithuaniahttps://www.e-tar.lt/ (accessed on 8 June 2020)
Table 4. Performance of the different countries in achieving their electricity, heating and cooling, and transport targets in 2018.
CountryElectricityHeating and CoolingTransportNumber of Sectors with Achieved Targets
DenmarkYesYesNo2 out of 3
IrelandYesNoNo1 out of 3
NetherlandsYesNoNo1 out of 3
EstoniaNoYesNo1 out of 3
LatviaYesYesNo2 out of 3
LithuaniaNoYesNo1 out of 3
Publisher’s Note: MDPI stays neutral with regard to jurisdictional claims in published maps and institutional affiliations.