Opinion

Water Footprint as a Tool for Selection of Alternatives (Comments on “Food Recommendations for Reducing Water Footprint”)

Výzkumný ústav Vodohospodářský T. G. Masaryka, Podbabská 2582/30, 16000 Praha, Czech Republic
*
Author to whom correspondence should be addressed.
Sustainability 2022, 14(10), 6317; https://doi.org/10.3390/su14106317
Submission received: 29 April 2022 / Revised: 13 May 2022 / Accepted: 18 May 2022 / Published: 22 May 2022
(This article belongs to the Section Sustainable Water Management)

Abstract

:
Water footprint is a new tool for assessing sustainability in terms of water use. Researchers are devising new applications that use water footprint, one of which is focused on comparing the water requirements of individual diets. Systems have been proposed to suggest tailor-made recipes that use a lower water quantity in production. This system proposes alternative recipes with lower demands for water resources based on their water footprint. The water footprint consists of three components—blue, green, and grey water footprints. However, focusing only on a reduction in the total water footprint may lead to an increase in some of its parts, such as the blue water footprint, and subsequently to water scarcity in some river basins. Therefore, it is recommended to extend the food recommendations system with sustainability criteria in order to avoid the unsustainable management of water resources. The same criteria can be used in any system for selecting alternatives based on the water footprint.

1. Introduction

In 2022, an article was published in this journal describing a system for selecting recipes with the lowest water requirements [1] and the complex analysis of the impact of diet optimization aimed at reducing the water footprint of the diet [2]. The argument for such research is that diets with low water demands for food preparation not only bring benefits to human health but are also more environmentally sustainable. The total water footprint is the indicator used in the system designed by Gallo et al. [1] to select recipes. The water footprint is one of the possible indicators that could be used for assessing the sustainability of food diets [3] as well as meeting the United Nations Sustainable Development Goals to reduce water scarcity [4]. Diet programs in different parts of the world have significantly different values of water footprints [5], and a change in diet programs could have a significant (although different) impact on the water resources used in different parts of the world [6]. However, there is no linear dependence between the healthiness and water footprint of different diets [7].
Water footprint has been proposed as an indicator of the total amount of water consumed, either directly or indirectly, by goods and services, or by one individual or the individuals of a country [8]. Since its introduction in 2002 [9], the Water Footprint Assessment (WFA) has gained considerable popularity. The popularity of the water footprint assessment is evidenced by the annual increase in the number of published articles focused on water footprint development or applications registered in the Scopus and Web of Science databases. The popularity of the water footprint is also associated with efforts to apply it in other research domains, as well as efforts to apply the term “water footprint” in other methodological concepts. The Life Cycle Assessment (LCA) community uses the term of “water footprint” for analyses aimed at the impacts assessment of water usage, which leads to discussions between these two scientific communities on methodological water footprint issues [10]. The existence of two different methodological approaches sometimes leads to the inappropriate confusing of these approaches [11]. Some authors dealing with the ecological footprint have begun to use the simplified term “water footprint” to express the water component of the ecological footprint, which further increases the confusion when using the term of “water footprint” [12]. The term “water footprint“ then has the same issue as the term “carbon footprint”, for which there are a number of methodological definitions and approaches [13].
Though the application of the water footprint may have various purposes and it can be applied in different contexts, [14] both a detailed knowledge of the methodology and a clear definition of the application objectives are important for the correct application. Gallo et al. [1] states that the goal of their system is to gradually reduce the amount of water consumed in the diets of the users of their system. However, the use of the total water footprint may (in some cases) lead to a higher consumption of blue water resources and thus to a worsening of the water scarcity in certain river basins, as described in a study from the UK [15]. Another study showed that switching to fruit- and vegetable-based diets [16] can lead to an increase in society’s blue water footprint, associated with the higher consumption of such food. Therefore, this article discusses and proposes water footprint criteria for decision-making systems on alternatives to increase water use sustainability in compliance with the UN Sustainable Development Goals, in particular with SDG target 6.4—‘By 2030, substantially increase water-use efficiency across all sectors and ensure sustainable withdrawals and supply of freshwater to address water scarcity and substantially reduce the number of people suffering from water scarcity’.

2. Significance of Individual “Color” Components of the Water Footprint in Terms of Food Production Sustainability

The water consumption associated with food production varies greatly depending on factors such as geographical area, season, gastronomic culture, the authenticity of recipes, etc. The strength of the water footprint indicator lies in the easy interpretability of the results by the general public. Therefore, the water footprint can be used as a proxy for the comparison of food production in different conditions. The water footprint consists of blue, green, and grey water footprints [14]. The blue water footprint is a measure of the consumption of surface water or groundwater (blue water resources). The green water footprint is a measure of rainwater consumption (green water resources). These two parts represent the quantitative part of water consumption. The grey water footprint is a measure of how much water is needed to assimilate pollution from human activities. The grey water footprint is a qualitative part of the water footprint assessment. Sustainability assessment is the comparison of the water footprint with the available water resources.
Food production and agriculture require huge amounts of water. In humid areas, rainfall-based agriculture predominates (i.e., with a predominant green water footprint), while in arid and semi-arid areas, agriculture is based on irrigation (i.e., with a predominant blue water footprint). Although it cannot always be known whether each crop consumes green or blue water resources, the need for irrigation is crucial, both from the point of view of the sustainability of agricultural production and from the point of view of the sustainable management of water resources. For example, Milner et al. [17] state that small changes in diets could help to address the projected reduction in the availability of freshwater for irrigation in India. While precipitation is free of charge or has minimal cost for farmers, the use of blue water resources is associated with the need to build irrigation infrastructure and cover its operating costs. Garrido et al. [18] describe that the scarce blue water resources are mainly used to irrigate high-value crops. Typical crops grown in irrigation due to their high value are fruits and vegetables [19].
Additionally, from the point of view of the river basin total water balance, there is a significant difference between the consumption of blue and green water resources in agriculture. The use of green water resources has only limited effects on worsening water stress because evaporation from the natural vegetation would occur even if the agricultural crops were not grown on that site [20]. The green water footprint is determined mainly because the green water resources used for food production cannot be used in bioenergy production, nor can they participate in the outflow from the river basin [21]. The failure to include green water resources would lead to a bias in the results of analyses focused on the water balance in the life cycle of food and the water resource balance in river basins. Natural vegetation such as forests, etc. have an even higher evaporation rate than cultivated crops, and, due to the expansion of agriculture in the past few centuries, there has been a decrease in evaporation from agricultural land and an increase in river basin runoff [22]. In contrast to this, irrigation with blue water resources increases relative evapotranspiration worldwide [23]. De Graaf et al. [24] estimate that by 2050, groundwater abstraction will affect environmental sustainability in approximately 42-79% of river basins where irrigation water is abstracted. From the water protection point of view, the use of green water resources for food production and agricultural production should be preferred to the use of blue water resources.
The use of blue water resources for irrigation has a significant impact on the total water balance of a river basin, as most of the water used for irrigation evaporates and cannot be used by others in that river basin. The consumption of blue water resources in agriculture represents about 84% of the total consumption of blue water resources, while agriculture contributes to the consumption of blue water resources by only about 2/3 [25]. At the same time, it is expected that the share of consumption for agriculture will increase from the level of 3/4 up to 4/5 by the middle of the century [25]. The consumption of blue water resources is also important from the point of view of the grey water footprint, due to blue water resources being used to dilute discharged pollution. While spent blue water resources (blue water footprint) can no longer be used for dilution of the discharged pollution downstream in the river basin, polluted water (grey water footprint) can still be used downstream in the river basin as blue water resources.

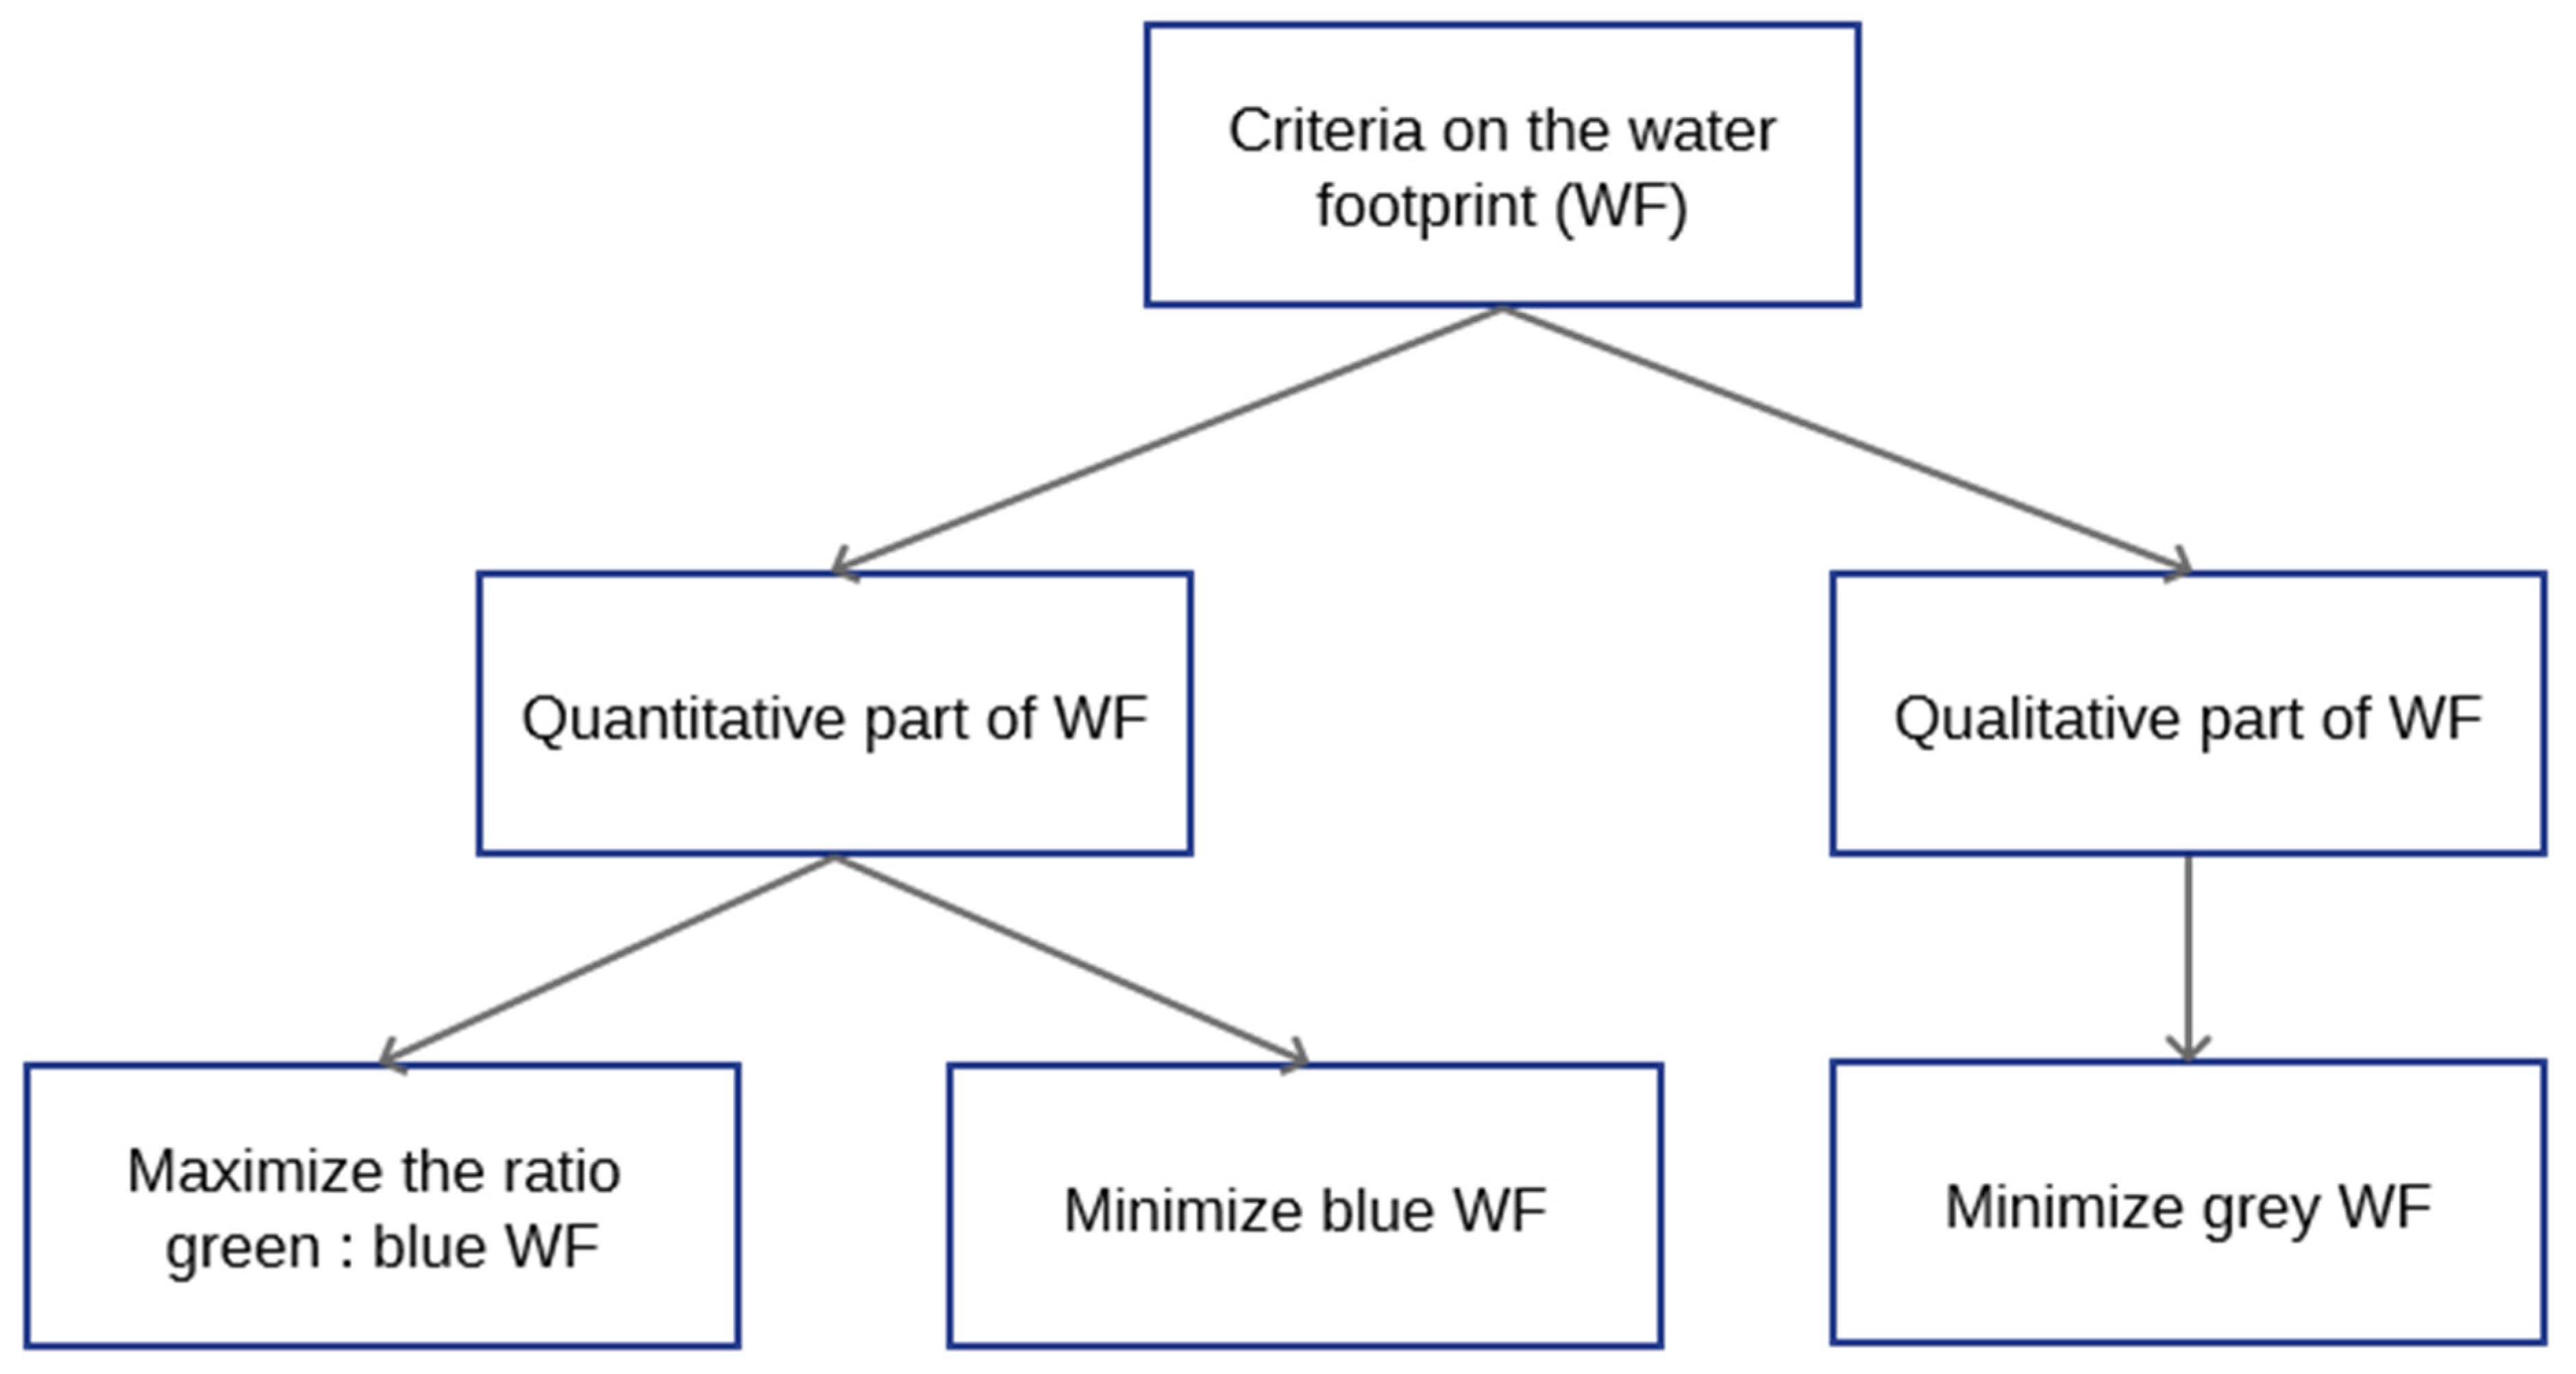
3. Criteria for Food Sustainability Assessment from the Water Footprint Perspective

Based on the significance of individual “color” components of the water footprint (see previous Section) in terms of impacts on the SDG target 6.4 fulfillment, three criteria have been proposed. We recommend taking these criteria into account when choosing alternatives for the water footprint applications, such as a food recommendation system [1]. Each of the criteria focuses on one component of the water footprint (Figure 1).

3.1. Green to Blue Water Footprints Ratio

This is a maximization criterion: the higher the use of green water resources compared to the use of blue water resources is, the better. The optimal situation occurs when blue water resources are not needed for food production. This is a criterion that favors the location of the food production. If a crop is grown in localities A and B with the same value of the quantitative components of the water footprint (blue + green water footprint), it is more sustainable to grow the crop in the locality with the higher use of green water resources. When comparing different foods, the food which causes less changes to the hydrological cycle and to the water resources balance in the river basin is preferred.

3.2. Blue Water Footprint

This is a minimization criterion: if food A uses less blue water resources than food B, then food A is preferred, regardless of the total value of the quantitative water footprint. This is an addition to the previous mentioned criterion—i.e., both criteria should be considered together.

3.3. Grey Water Footprint

This is a minimization criterion: if food A needs less blue water resources to dilute discharged pollution than food B, then it is considered to be more sustainable. This criterion is independent of the previous two criteria, as it is a criterion focused on the qualitative component of the water footprint.

4. Discussion

Current optimization tools prefer a reduction in the total water footprint or its individual components, or a reduction in other environmental footprints [26]. Vanham [27] states that for a comprehensive sustainability assessment of water footprint of diets, the following is needed: “assessment of (1) equity of total WF; (2) efficiency for each food in the diet; and (3) impact (blue water stress and green water deficiency) for each food in the diet“. In the case of the grey and blue water footprints, minimization criterions are proposed focusing on the total value of the water footprint, whereas in the case of the green water footprint the use of rainfed agriculture is preferred over irrigated agriculture. This approach is reasonable in view of achieving SDG 6.4; however, it can be considered as problematic in terms of SDG 2 ‘End hunger, achieve food security and improved nutrition and promote sustainable agriculture’. Agriculture and food security are considered a sensitive issue in terms of climate impact and irrigation has been deemed effective if it does not lead to unsustainable water withdrawal [28]. Siebert and Döll calculated that at the turn of the millennium the global value of total crop water use was 6685 km3 yr−1, of which the value of blue water use was 1180 km3 yr−1, the green water use of irrigated crops was 919 km3 yr−1, and the green water use of rainfed crops was 4586 km3 yr−1 [29]. Irrigated agriculture represents 20% of the total cultivated land but produces 40% of the world’s food [30]. With the continuing effects of climate change, it is clear that ensuring food security will not be possible without irrigated agriculture.
If multiple criteria are used in the decision-making process, there is always a problem with setting the weights of individual criteria. There are many approaches to setting the criteria weights in multi-criteria decision-making. Multi-criteria decision-making allows a wide range of categorically different criteria to be included in the evaluation [31], but the decision-making requires the consideration of trade-offs between socio-political, environmental, and economic impacts, and that is often complicated due to various stakeholders‘ views [32]. The Web of Science analysis [33] has shown that the most common multi-criteria decision analysis (MCDA) techniques are Analytic Hierarchical Process (AHP) and Collaborative Decision Making. The Analytic Hierarchical Process was developed by Professor Saaty [34] and uses mathematics and psychology to define the significance of individual members in different problem hierarchies and for the selection of the alternative that best meets the stated goal. Other advanced methods are: Multi-Attribute Utility Theory (MAUT), Technique for Order Preference by Similarity (TOPSIS), ELimination Et Choix Traduisant La REalité (ELECTRE), Preference Ranking Organization Method for Enrichment Evaluation (Promethee), Vlse Criterion Optimization and Compromise Solution in Serbian (VIKOR), and others [35,36].
In this paper, we do not seek to recommend appropriate MCDA techniques or to suggest weights for individual criteria. We assume that this will be a subject of further analyses and scientific discussions. For example, the AHP technique has been already used in water footprint analyzes, although in a different context. Specifically, it was the allocation task of assigning the water footprint (water losses from the water reservoir) to the individual benefits associated with the water reservoir [37,38]. Another application of MCDA and water footprint is the selection of an optimal supply mix of chemical pulps from different countries to minimizes the water footprint accounting and costs [39], in which a linear multi-objective function approach was used [40]. Three MCDA techniques were applied in the study of cropping sustainability at the aggregate (country) level [41], where the water footprint was used as one criterion of sustainability.
The basic problem in setting the weights of individual criteria lies in the different temporal and spatial availability of water resources across the planet. In the case of areas with sufficient water resources of poor quality, the criterion of minimizing the grey water footprint may be of the highest weight. On the contrary, in areas with insufficient water resources, the highest weight can be assigned to the criterion of minimizing the blue water footprint. It was the high demands on water resources for agriculture that led prof. Allan in the 1990s to create the concept of virtual water [42] which was the first impulse for the water footprint concept creation.
Setting the weights of the individual criteria will also be related to the objectives of the recommendations of individual alternatives, as reducing the water footprint associated with each of the alternatives is a way of achieving a specific objective, but it is not the objective itself. If the objective of food recommendations is to reduce the environmental burden in specific river basins, then it is relevant to discuss whether it is not more appropriate to use water footprint methods based on LCA principles. The LCA approach has shown advantages in searching the environmental impacts of water use [43]; however, its physical significance and usefulness for achieving SDG 6.4 are questionable [44].
As an alternative to the LCA approach, the “net consumption” approach (originally created to assess the water footprint of the hydropower industry) could be considered [45]. The LCA principle of the “net consumption” approach is based on the idea that “change in evaporation caused by land-use change is considered water consumption“ [46]. This calculation method has often been used and recommended [47]. However, a methodological analysis of the “net consumption” approach [48] has shown that the approach is not in accordance with the WFA principles, as it does not calculate the change in the water footprint related to the reservoir and its benefits, but rather the change in the water balance at the reservoir site. Although the theoretical assumption of the principle of calculating the “net consumption” is logical, the change in the water balance in a certain area may not be the same as the change in the water footprint. For the same reasons, we assume that this is not an appropriate procedure in systems for recommending the alternatives based on the water footprint.
A significant problem for the application of the proposed criteria is the availability of data on individual components of the water footprint with appropriate temporal and spatial resolution. The water footprint associated with food production changes over the seasons and also depends on the place of food production. One of the newer data sources is the CWASI database [49]; yet, this database does not distinguish between the blue and green components of the water footprint and does not contain grey water footprint data in a time step of at least 1 month, which is the recommended time step for water footprint assessment [50].
Water, energy, and food are interconnected systems, and a change in one system will affect the remaining systems. For example, water used for irrigation cannot be used for cooling circuits in power plants, and land used for bioenergy cannot be used for growing crops. Therefore, these systems need to be approached in complex, in the context of the Water–Energy–Food (WEF) Nexus approach [51,52]. The nexus thinking represents the transition of scientific thought and policies towards integrative thinking to address global changes and challenges [53]. The WEF Nexus provides a conceptual framework for achieving many SDGs. If criteria for the water footprint only are included in a system for selecting alternatives, the application of such a decision-making system may improve the situation in the water sector only, but at the same time, the situation in other sectors may worsen. Therefore, the criterion of minimizing the green water footprint is intentionally not proposed. The main objective of agriculture is to ensure nutritional needs and food security while ensuring the sustainability of agriculture in accordance with SDG 2. Setting the minimization criteria for all components of the water footprint could favor the crop which minimizes the impact on water resources use; however, it may not ensure food safety and nutritional needs. Therefore, decisions regarding suitable alternatives should not be based on a single environmental indicator, as different indicators have different purposes. Even the optimization of diet programs can lead to a failure in achieving environmental goals [54]. A number of sustainability indicators that can be used for the assessment of diet programs have been described in the literature [55]. Food selection based on the integrative models that contain nutritional, physical, environmental, economic and cultural indicators can help to provide a better understanding of the complex interactions in dietary patterns considering multiple aspects of sustainability [56,57].

5. Conclusions

The water footprint is one of the possible indicators for monitoring the fulfillment of the UN’s sustainable development goals. This is why applications where the water footprint is used to decide on the selection of suitable alternatives are appearing. A significant component of the total water footprint of agricultural products is the green water footprint. However, the consumption of green water resources (rainwater and soil moisture) has a very low environmental impact. Minimizing the total water footprint criterion (which consists of the blue, green, and grey water footprint) can lead to the selection of alternatives that prefer taking water from water resources (which have a higher blue water footprint) and thus may worsen water stress in some river basins. Therefore, three criteria have been proposed focusing on different components (colors) of the water footprint in order to minimize the consumption and pollution of blue water resources and prefer rainfed agriculture to irrigated agriculture. Applying the proposed criteria to food production will reduce impacts on water resources, reduce the over-exhaustion of blue water resources, and lower water stress. It will also increase the sustainability of food production and agriculture, as the preference for using green water sources reduces the need for investment in irrigation equipment and the electricity needed to pump irrigation water. Such targeted criteria have been proposed in the knowledge that food security cannot be achieved without irrigated agriculture. After all, none of these environmental indicators can (in themselves) represent the sustainability of a complex system, such as food production, with all its impacts on water resources, land demands, etc. Water footprint-based alternative selection systems should take into account the selection objectives and the specificities of each water footprint component. At the same time, they should not be the only basis for deciding on sustainable alternatives, or they must include more sustainability indicators.

Author Contributions

Conceptualization, L.A. and L.S.; writing—original draft preparation, L.A.; writing—review and editing, L.S. and L.A. All authors have read and agreed to the published version of the manuscript.

Funding

This research was funded by Výzkumný ústav vodohospodářský T. G. Masaryka, Praha, Czech Republic; Grant Number 3600.52.01/2022.

Conflicts of Interest

The authors declare no conflict of interest.

References

  1. Gallo, I.; Landro, N.; La Grassa, R.; Turconi, A. Food Recommendations for Reducing Water Footprint. Sustainability 2022, 14, 3833. [Google Scholar] [CrossRef]
  2. Tompa, O.; Kiss, A.; Maillot, M.; Sarkadi Nagy, E.; Temesi, Á.; Lakner, Z. Sustainable Diet Optimization Targeting Dietary Water Footprint Reduction—A Country-Specific Study. Sustainability 2022, 14, 2309. [Google Scholar] [CrossRef]
  3. Leach, A.M.; Emery, K.A.; Gephart, J.; Davis, K.F.; Erisman, J.W.; Leip, A.; Pace, M.L.; D’Odorico, P.; Carr, J.; Noll, L.C.; et al. Environmental Impact Food Labels Combining Carbon, Nitrogen, and Water Footprints. Food Policy 2016, 61, 213–223. [Google Scholar] [CrossRef] [Green Version]
  4. Hoekstra, A.Y.; Chapagain, A.K.; van Oel, P.R. Advancing Water Footprint Assessment Research: Challenges in Monitoring Progress towards Sustainable Development Goal 6. Water 2017, 9, 438. [Google Scholar] [CrossRef] [Green Version]
  5. Harris, F.; Moss, C.; Joy, E.J.M.; Quinn, R.; Scheelbeek, P.F.D.; Dangour, A.D.; Green, R. The Water Footprint of Diets: A Global Systematic Review and Meta-Analysis. Adv. Nutr. 2020, 11, 375–386. [Google Scholar] [CrossRef]
  6. Jalava, M.; Kummu, M.; Porkka, M.; Siebert, S.; Varis, O. Diet Change—A Solution to Reduce Water Use? Environ. Res. Lett. 2014, 9, 074016. [Google Scholar] [CrossRef]
  7. Tompa, O.; Lakner, Z.; Oláh, J.; Popp, J.; Kiss, A. Is the Sustainable Choice a Healthy Choice?—Water Footprint Consequence of Changing Dietary Patterns. Nutrients 2020, 12, 2578. [Google Scholar] [CrossRef]
  8. Hoekstra, A.Y. Water Footprint Assessment: Evolvement of a New Research Field. Water Resour. Manag. 2017, 31, 3061–3081. [Google Scholar] [CrossRef] [Green Version]
  9. Hoekstra, A.Y.; Hung, P.Q. Virtual Water Trade—A Quantification of Virtual Water Flows between Nations in Relation to International Crop Trade; Value of Water Research Report Series; UNESCO-IHE Institute for Water Education: Delft, The Netherlands, 2002; p. 120. [Google Scholar]
  10. Gerbens-Leenes, W.; Berger, M.; Allan, J.A. Water Footprint and Life Cycle Assessment: The Complementary Strengths of Analyzing Global Freshwater Appropriation and Resulting Local Impacts. Water 2021, 13, 803. [Google Scholar] [CrossRef]
  11. Ansorge, L. Water Footprint: Two Different Methodologies. Tecnura 2020, 24, 119–121. [Google Scholar] [CrossRef]
  12. Ansorge, L. Comments on “Analysis of Water–Carbon–Ecological Footprints and Resource–Environment Pressure in the Triangle of Central China” by Yizhong Chen, Hongwei Lu, Pengdong Yan, Yiyang Yange, Jing Li and Jun Xia [Ecological Indicators, 125, 107448]. Ecol. Indic. 2021, 127, 107803. [Google Scholar] [CrossRef]
  13. Matuštík, J.; Kočí, V. What Is a Footprint? A Conceptual Analysis of Environmental Footprint Indicators. J. Clean. Prod. 2021, 285, 124833. [Google Scholar] [CrossRef]
  14. Hoekstra, A.Y.; Chapagain, A.K.; Aldaya, M.M.; Mekonnen, M.M. The Water Footprint Assessment Manual: Setting the Global Standard; Earthscan: London, UK; Washington, DC, USA, 2011; ISBN 978-1-84971-279-8. [Google Scholar]
  15. Hess, T.; Andersson, U.; Mena, C.; Williams, A. The Impact of Healthier Dietary Scenarios on the Global Blue Water Scarcity Footprint of Food Consumption in the UK. Food Policy 2015, 50, 1–10. [Google Scholar] [CrossRef]
  16. Tom, M.S.; Fischbeck, P.S.; Hendrickson, C.T. Energy Use, Blue Water Footprint, and Greenhouse Gas Emissions for Current Food Consumption Patterns and Dietary Recommendations in the US. Env. Syst. Decis. 2016, 36, 92–103. [Google Scholar] [CrossRef]
  17. Milner, J.; Joy, E.J.M.; Green, R.; Harris, F.; Aleksandrowicz, L.; Agrawal, S.; Smith, P.; Haines, A.; Dangour, A.D. Projected Health Effects of Realistic Dietary Changes to Address Freshwater Constraints in India: A Modelling Study. Lancet Planet. Health 2017, 1, e26–e32. [Google Scholar] [CrossRef] [Green Version]
  18. Garrido, A.; Llamas, M.R. Water Policy in Spain; CRC Press: Boca Raton, FL, USA, 2009; ISBN 978-0-203-86602-3. [Google Scholar]
  19. Nieuwoudt, W.L.; Backeberg, G.R.; Du Plessis, H.M. The Value of Water in the South African Economy: Some Implications. Agrekon 2004, 43, 162–183. [Google Scholar] [CrossRef] [Green Version]
  20. Pfister, S.; Hellweg, S. The Water “Shoesize” vs. Footprint of Bioenergy. Proc. Natl. Acad. Sci. USA 2009, 106, E93–E94. [Google Scholar] [CrossRef] [Green Version]
  21. Hoekstra, A.Y.; Gerbens-Leenes, W.; Meer, T.H. van der Reply to Pfister and Hellweg: Water Footprint Accounting, Impact Assessment, and Life-Cycle Assessment. Proc. Natl. Acad. Sci. USA 2009, 106, E114. [Google Scholar] [CrossRef] [Green Version]
  22. Scanlon, B.R.; Jolly, I.; Sophocleous, M.; Zhang, L. Global Impacts of Conversions from Natural to Agricultural Ecosystems on Water Resources: Quantity versus Quality. Water Resour. Res. 2007, 43, W03437. [Google Scholar] [CrossRef] [Green Version]
  23. Jaramillo, F.; Destouni, G. Local Flow Regulation and Irrigation Raise Global Human Water Consumption and Footprint. Science 2015, 350, 1248–1251. [Google Scholar] [CrossRef]
  24. de Graaf, I.E.M.; Gleeson, T.; (Rens) van Beek, L.P.H.; Sutanudjaja, E.H.; Bierkens, M.F.P. Environmental Flow Limits to Global Groundwater Pumping. Nature 2019, 574, 90–94. [Google Scholar] [CrossRef] [PubMed]
  25. Hejazi, M.; Edmonds, J.; Clarke, L.; Kyle, P.; Davies, E.; Chaturvedi, V.; Wise, M.; Patel, P.; Eom, J.; Calvin, K.; et al. Long-Term Global Water Projections Using Six Socioeconomic Scenarios in an Integrated Assessment Modeling Framework. Technol. Forecast. Soc. Change 2014, 81, 205–226. [Google Scholar] [CrossRef]
  26. Gephart, J.A.; Davis, K.F.; Emery, K.A.; Leach, A.M.; Galloway, J.N.; Pace, M.L. The Environmental Cost of Subsistence: Optimizing Diets to Minimize Footprints. Sci. Total Environ. 2016, 553, 120–127. [Google Scholar] [CrossRef] [PubMed] [Green Version]
  27. Vanham, D. Water Resources for Sustainable Healthy Diets: State of the Art and Outlook. Water 2020, 12, 3224. [Google Scholar] [CrossRef]
  28. Okada, M.; Iizumi, T.; Sakamoto, T.; Kotoku, M.; Sakurai, G.; Hijioka, Y.; Nishimori, M. Varying Benefits of Irrigation Expansion for Crop Production Under a Changing Climate and Competitive Water Use Among Crops. Earth’s Future 2018, 6, 1207–1220. [Google Scholar] [CrossRef]
  29. Siebert, S.; Döll, P. Quantifying Blue and Green Virtual Water Contents in Global Crop Production as Well as Potential Production Losses without Irrigation. J. Hydrol. 2010, 384, 198–217. [Google Scholar] [CrossRef]
  30. World Bank Water in Agriculture. Available online: https://www.worldbank.org/en/topic/water-in-agriculture (accessed on 6 April 2022).
  31. Sezima, T.; Tušil, P.; Durčák, M.; Mičaník, T.; Kristová, A. Vybrané metody hodnocení životního prostředí. Vodohospodářské Tech. Ekon. Inf. 2018, 60, 22–25. [Google Scholar] [CrossRef]
  32. Huang, I.B.; Keisler, J.; Linkov, I. Multi-Criteria Decision Analysis in Environmental Sciences: Ten Years of Applications and Trends. Sci. Total Environ. 2011, 409, 3578–3594. [Google Scholar] [CrossRef]
  33. Diaz-Balteiro, L.; González-Pachón, J.; Romero, C. Measuring Systems Sustainability with Multi-Criteria Methods: A Critical Review. Eur. J. Oper. Res. 2017, 258, 607–616. [Google Scholar] [CrossRef]
  34. Saaty, R.W. The Analytic Hierarchy Process—What It Is and How It Is Used. Math. Model. 1987, 9, 161–176. [Google Scholar] [CrossRef] [Green Version]
  35. Jansen, S.J.T. The Multi-Attribute Utility Method. In The Measurement and Analysis of Housing Preference and Choice; Jansen, S.J.T., Coolen, H.C.C.H., Goetgeluk, R.W., Eds.; Springer: Dordrecht, The Netherlands, 2011; pp. 101–125. ISBN 978-90-481-8894-9. [Google Scholar]
  36. Uzun Ozsahin, D.; Gökçekuş, H.; Uzun, B.; LaMoreaux, J. (Eds.) Application of Multi-Criteria Decision Analysis in Environmental and Civil Engineering; Professional Practice in Earth Sciences; Springer International Publishing: Cham, Switzerland, 2021; ISBN 978-3-030-64764-3. [Google Scholar]
  37. Ansorge, L.; Stejskalová, L.; Dlabal, J. Allocation of Water Loss to Individual Benefits Provided by the Fláje Reservoir—Comparison of Several Procedures. IOP Conf. Ser. Earth Environ. Sci. 2021, 900, 012001. [Google Scholar] [CrossRef]
  38. Golabi, M.R.; Radmanesh, F. A New Approach to the Allocation of the Blue Water Footprint of Reservoirs Using Fuzzy AHP Model. Model. Earth Syst. Environ. 2020, 6, 793–797. [Google Scholar] [CrossRef]
  39. Manzardo, A.; Ren, J.; Piantella, A.; Mazzi, A.; Fedele, A.; Scipioni, A. Integration of Water Footprint Accounting and Costs for Optimal Chemical Pulp Supply Mix in Paper Industry. J. Clean. Prod. 2014, 72, 167–173. [Google Scholar] [CrossRef]
  40. Singh, A.; Lou, H.H. Hierarchical Pareto Optimization for the Sustainable Development of Industrial Ecosystems. Ind. Eng. Chem. Res. 2006, 45, 3265–3279. [Google Scholar] [CrossRef]
  41. Balezentis, T.; Chen, X.; Galnaityte, A.; Namiotko, V. Optimizing Crop Mix with Respect to Economic and Environmental Constraints: An Integrated MCDM Approach. Sci. Total Environ. 2020, 705, 135896. [Google Scholar] [CrossRef]
  42. Allan, J.A. ‘Virtual Water’: A Long Term Solution for Water Short Middle Eastern Economies? University of Leeds: London, UK, 1997. [Google Scholar]
  43. Yang, H.; Pfister, S.; Bhaduri, A. Accounting for a Scarce Resource: Virtual Water and Water Footprint in the Global Water System. Curr. Opin. Environ. Sustain. 2013, 5, 599–606. [Google Scholar] [CrossRef]
  44. Vanham, D.; Mekonnen, M.M. The Scarcity-Weighted Water Footprint Provides Unreliable Water Sustainability Scoring. Sci. Total Environ. 2021, 756, 143992. [Google Scholar] [CrossRef]
  45. Herath, I.; Deurer, M.; Horne, D.; Singh, R.; Clothier, B. The Water Footprint of Hydroelectricity: A Methodological Comparison from a Case Study in New Zealand. J. Clean. Prod. 2011, 19, 1582–1589. [Google Scholar] [CrossRef]
  46. Grubert, E.A. Water Consumption from Hydroelectricity in the United States. Adv. Water Resour. 2016, 96, 88–94. [Google Scholar] [CrossRef] [Green Version]
  47. Bakken, T.H.; Killingtveit, Å.; Alfredsen, K. The Water Footprint of Hydropower Production—State of the Art and Methodological Challenges. Glob. Chall. 2017, 1, 1600018. [Google Scholar] [CrossRef]
  48. Ansorge, L. Net Consumption Method Does Not Provide Helpful Insights Regarding the Blue Water Footprint of Hydroelectricity. Ecol. Indic. 2021, 126, 107681. [Google Scholar] [CrossRef]
  49. Tamea, S.; Tuninetti, M.; Soligno, I.; Laio, F. Virtual Water Trade and Water Footprint of Agricultural Goods: The 1961–2016 CWASI Database. Earth Syst. Sci. Data Discuss. 2021, 13, 2025–2051. [Google Scholar] [CrossRef]
  50. Hoekstra, A.Y.; Mekonnen, M.M.; Chapagain, A.K.; Mathews, R.E.; Richter, B.D. Global Monthly Water Scarcity: Blue Water Footprints versus Blue Water Availability. PLoS ONE 2012, 7, e32688. [Google Scholar] [CrossRef] [PubMed]
  51. World Economic Forum. Water Security: The Water-Food-Energy-Climate Nexus; Island Press: Washington, DC, USA, 2011; ISBN 978-1-61091-026-2. [Google Scholar]
  52. Hoff, H. Understanding the Nexus: Background Paper for the Bonn2011 Nexus Conference; SEI: Stockholm, Sweden, 2011. [Google Scholar]
  53. Al-Saidi, M.; Elagib, N.A. Towards Understanding the Integrative Approach of the Water, Energy and Food Nexus. Sci. Total Environ. 2017, 574, 1131–1139. [Google Scholar] [CrossRef] [PubMed]
  54. Springmann, M.; Spajic, L.; Clark, M.A.; Poore, J.; Herforth, A.; Webb, P.; Rayner, M.; Scarborough, P. The Healthiness and Sustainability of National and Global Food Based Dietary Guidelines: Modelling Study. BMJ 2020, 370, m2322. [Google Scholar] [CrossRef]
  55. Jones, A.D.; Hoey, L.; Blesh, J.; Miller, L.; Green, A.; Shapiro, L.F. A Systematic Review of the Measurement of Sustainable Diets. Adv. Nutr. 2016, 7, 641–664. [Google Scholar] [CrossRef] [Green Version]
  56. Steenson, S.; Buttriss, J.L. Healthier and More Sustainable Diets: What Changes Are Needed in High-Income Countries? Nutr. Bull. 2021, 46, 279–309. [Google Scholar] [CrossRef]
  57. Skoet, J.; Fabi, C.; Cattaneo, A. Measuring Food Loss and Waste: An FAO Perspective. EuroChoices 2020, 19, 22–23. [Google Scholar] [CrossRef]
Figure 1. Criteria for selection of alternatives based on the water footprint.
Sustainability 14 06317 g001
Publisher’s Note: MDPI stays neutral with regard to jurisdictional claims in published maps and institutional affiliations.

