1. Introduction
In the last decade, international organizations and research institutions have highlighted the importance of collecting and analysing damage and loss data at all scales and for all sectors to improve the quality and the effectiveness of Disaster Risk Reduction (DRR) measures [
1]. Improved damage and loss data are a key component of the first priority of the Sendai Framework for Disaster Risk Reduction and necessary to support the evaluation of the Sustainable Development Goals 1, 11 and 13 related to the need to enhance safe, resilient and sustainable human settlements by reducing the potential harm to people and economic losses caused by disasters and climate change impacts [
2].
However, data to assess the performance indicators set by policies [
3] are often unavailable at the scale, granularity and level of detail that is required. This may seem paradoxical in an era during which we are constantly overwhelmed by a deluge of data from multiple sources; however, necessary information in the form and quality required for a number of applications is often missing. The data gap is not new, it was recognized quite long ago, see White (1945) and Longbein and Hoyt (1955). The Disaster Risk Management Knowledge Centre of the EU Commission has produced a number of reports that identify limitations, inconsistencies, and gaps of current datasets and data collection practices and provide recommendations for the future [
4,
5,
6].
This paper is aimed at illustrating the results of the Lode project [
7] funded by the EU DG-ECHO under its Prevention and Preparedness Grant Program. The project has analysed current weaknesses in post-disaster damage and loss data management and has developed an information system for improved data collection, storage and retrieval to serve multiple applications for mitigation and preparedness. Although the long-term deficiencies may frustrate researchers in embarking in such an endeavour, we see two new facts as opening a window of opportunities. On the one hand, there are requests from many sectors, including the insurance sector [
8], to improve current risk models to obtain more reliable damage predictions. Whilst models and computing capacity have been constantly growing and increasingly sophisticated, the quality and amount of empirical data are still unsatisfactory with pilot studies producing very relevant and useful information but with little potential to be generalized. On the other hand, the tremendous development of Information Technologies (IT) is creating a pressure on governments, agencies and businesses to leverage the significant potential added value of data and information in the knowledge-based economy.
Even though a theoretical discussion on data in general and in the disaster risk domain specifically may seem unnecessary, we regard it instead as very relevant for an enhanced framework shaping the relationships between data, information and knowledge encompassing from pre-event preparedness to post event response and recovery. As IT applications are relatively new to the domain and growing in importance, there is the need to better define data science for Disaster Risk Reduction.
1.1. From Data to Knowledge and Back
“Data” is the plural of the Latin word “datum” which literally means “thing given”. The term was used to identify that category of facts and principles accepted in their existence beyond argument. The rise of the concept is linked to the development of modern concepts of knowledge and argumentation. “Data” are taken for granted and are often confused with “evidence” and “facts”, though these terms have a different etymology. According to the analysis performed by Rosenberg [
9], a datum could be a fact, and a fact could be evidence. Nonetheless when a fact is proven to be false, it ceases to be a fact, while false data, are still data.
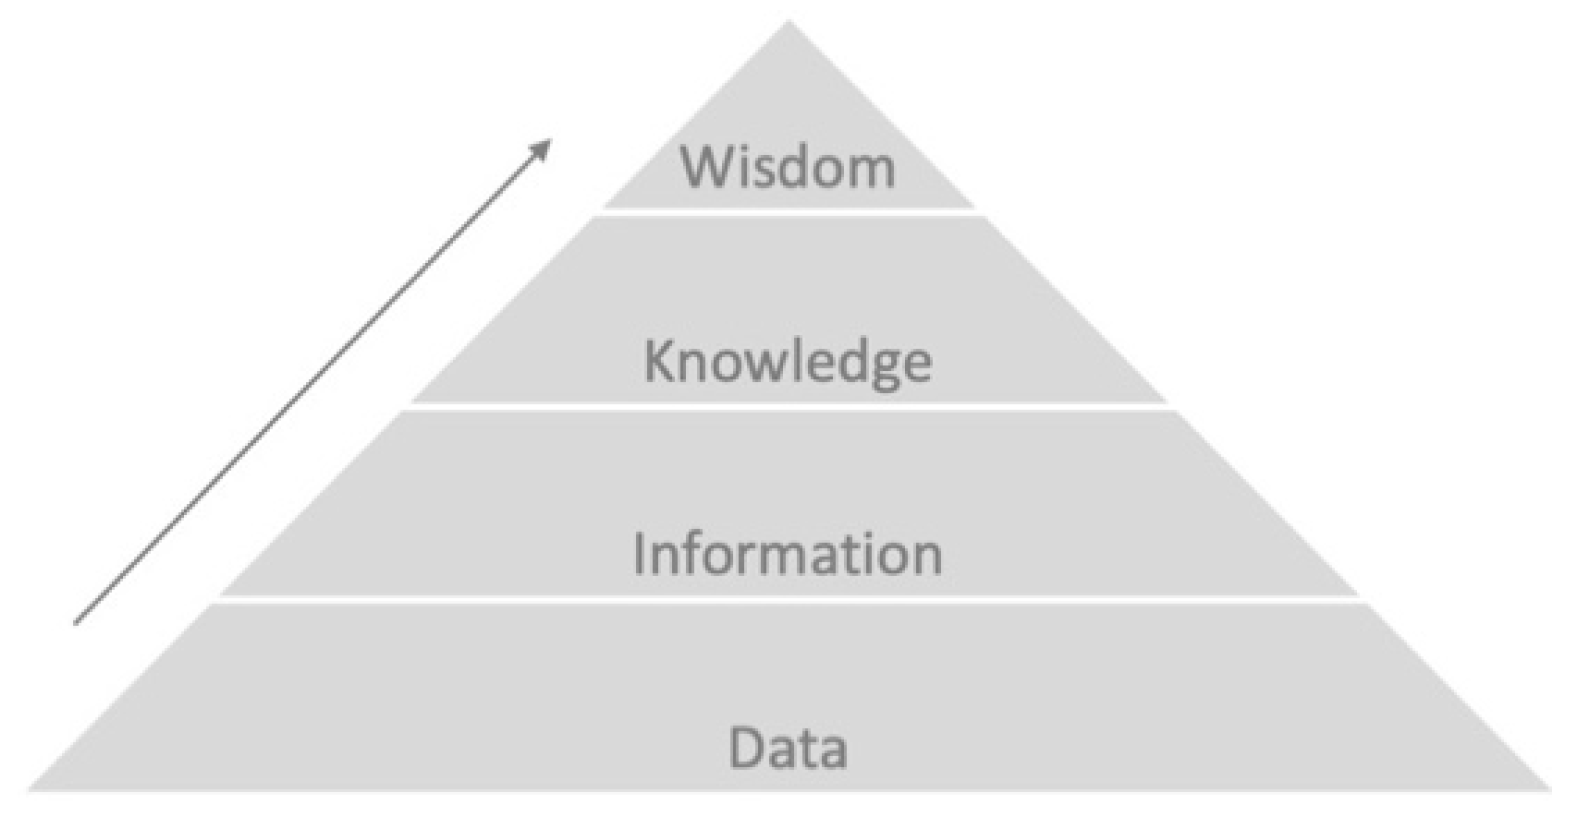
Data are commonly seen as basic, discrete, objective facts, that when structured, generate information, which turns into knowledge when it is interpreted and understood. The traditional approach in the field of knowledge management considers data as simple and isolated facts, placed at the base of the Pyramid of Knowledge, which represents a conventional view on the knowledge hierarchy (see
Figure 1). Ackoff [
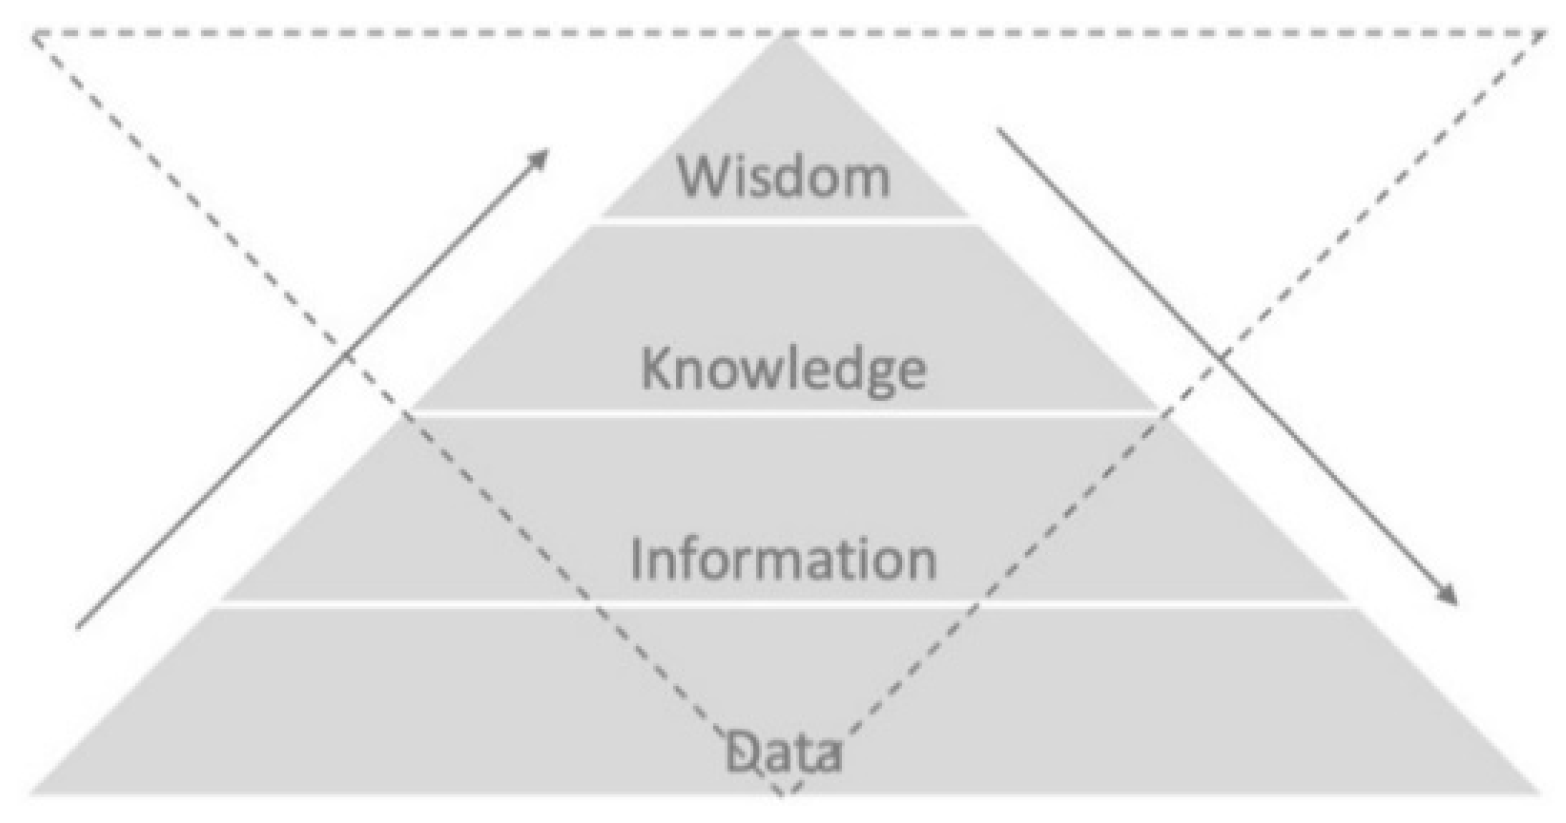
10] was the first to propose such a pyramidal representation and acknowledged that the figure requires some circularity in its interpretation and that the various elements do not stand in a linear relation (
Figure 2). The figure and the concept have been revisited and proposed in different variants by various authors who highlighted the many feedback loops in the data-information-knowledge “pyramid” [
11,
12,
13].
Tuomi [
14] proposed a reversed hierarchy overcoming the excessively rigid bottom-up structure, whilst Ackoff himself suggested that data are produced throughout a bi-directional flow, noting that the “most critical need is not for more relevant information, but rather for less irrelevant information”. In fact, “the only condition under which we know what information is needed to solve a problem is when we have a complete understanding of the entity that has the problem, its environment, and their interactions. There are few cases in which such complete understanding exists”.
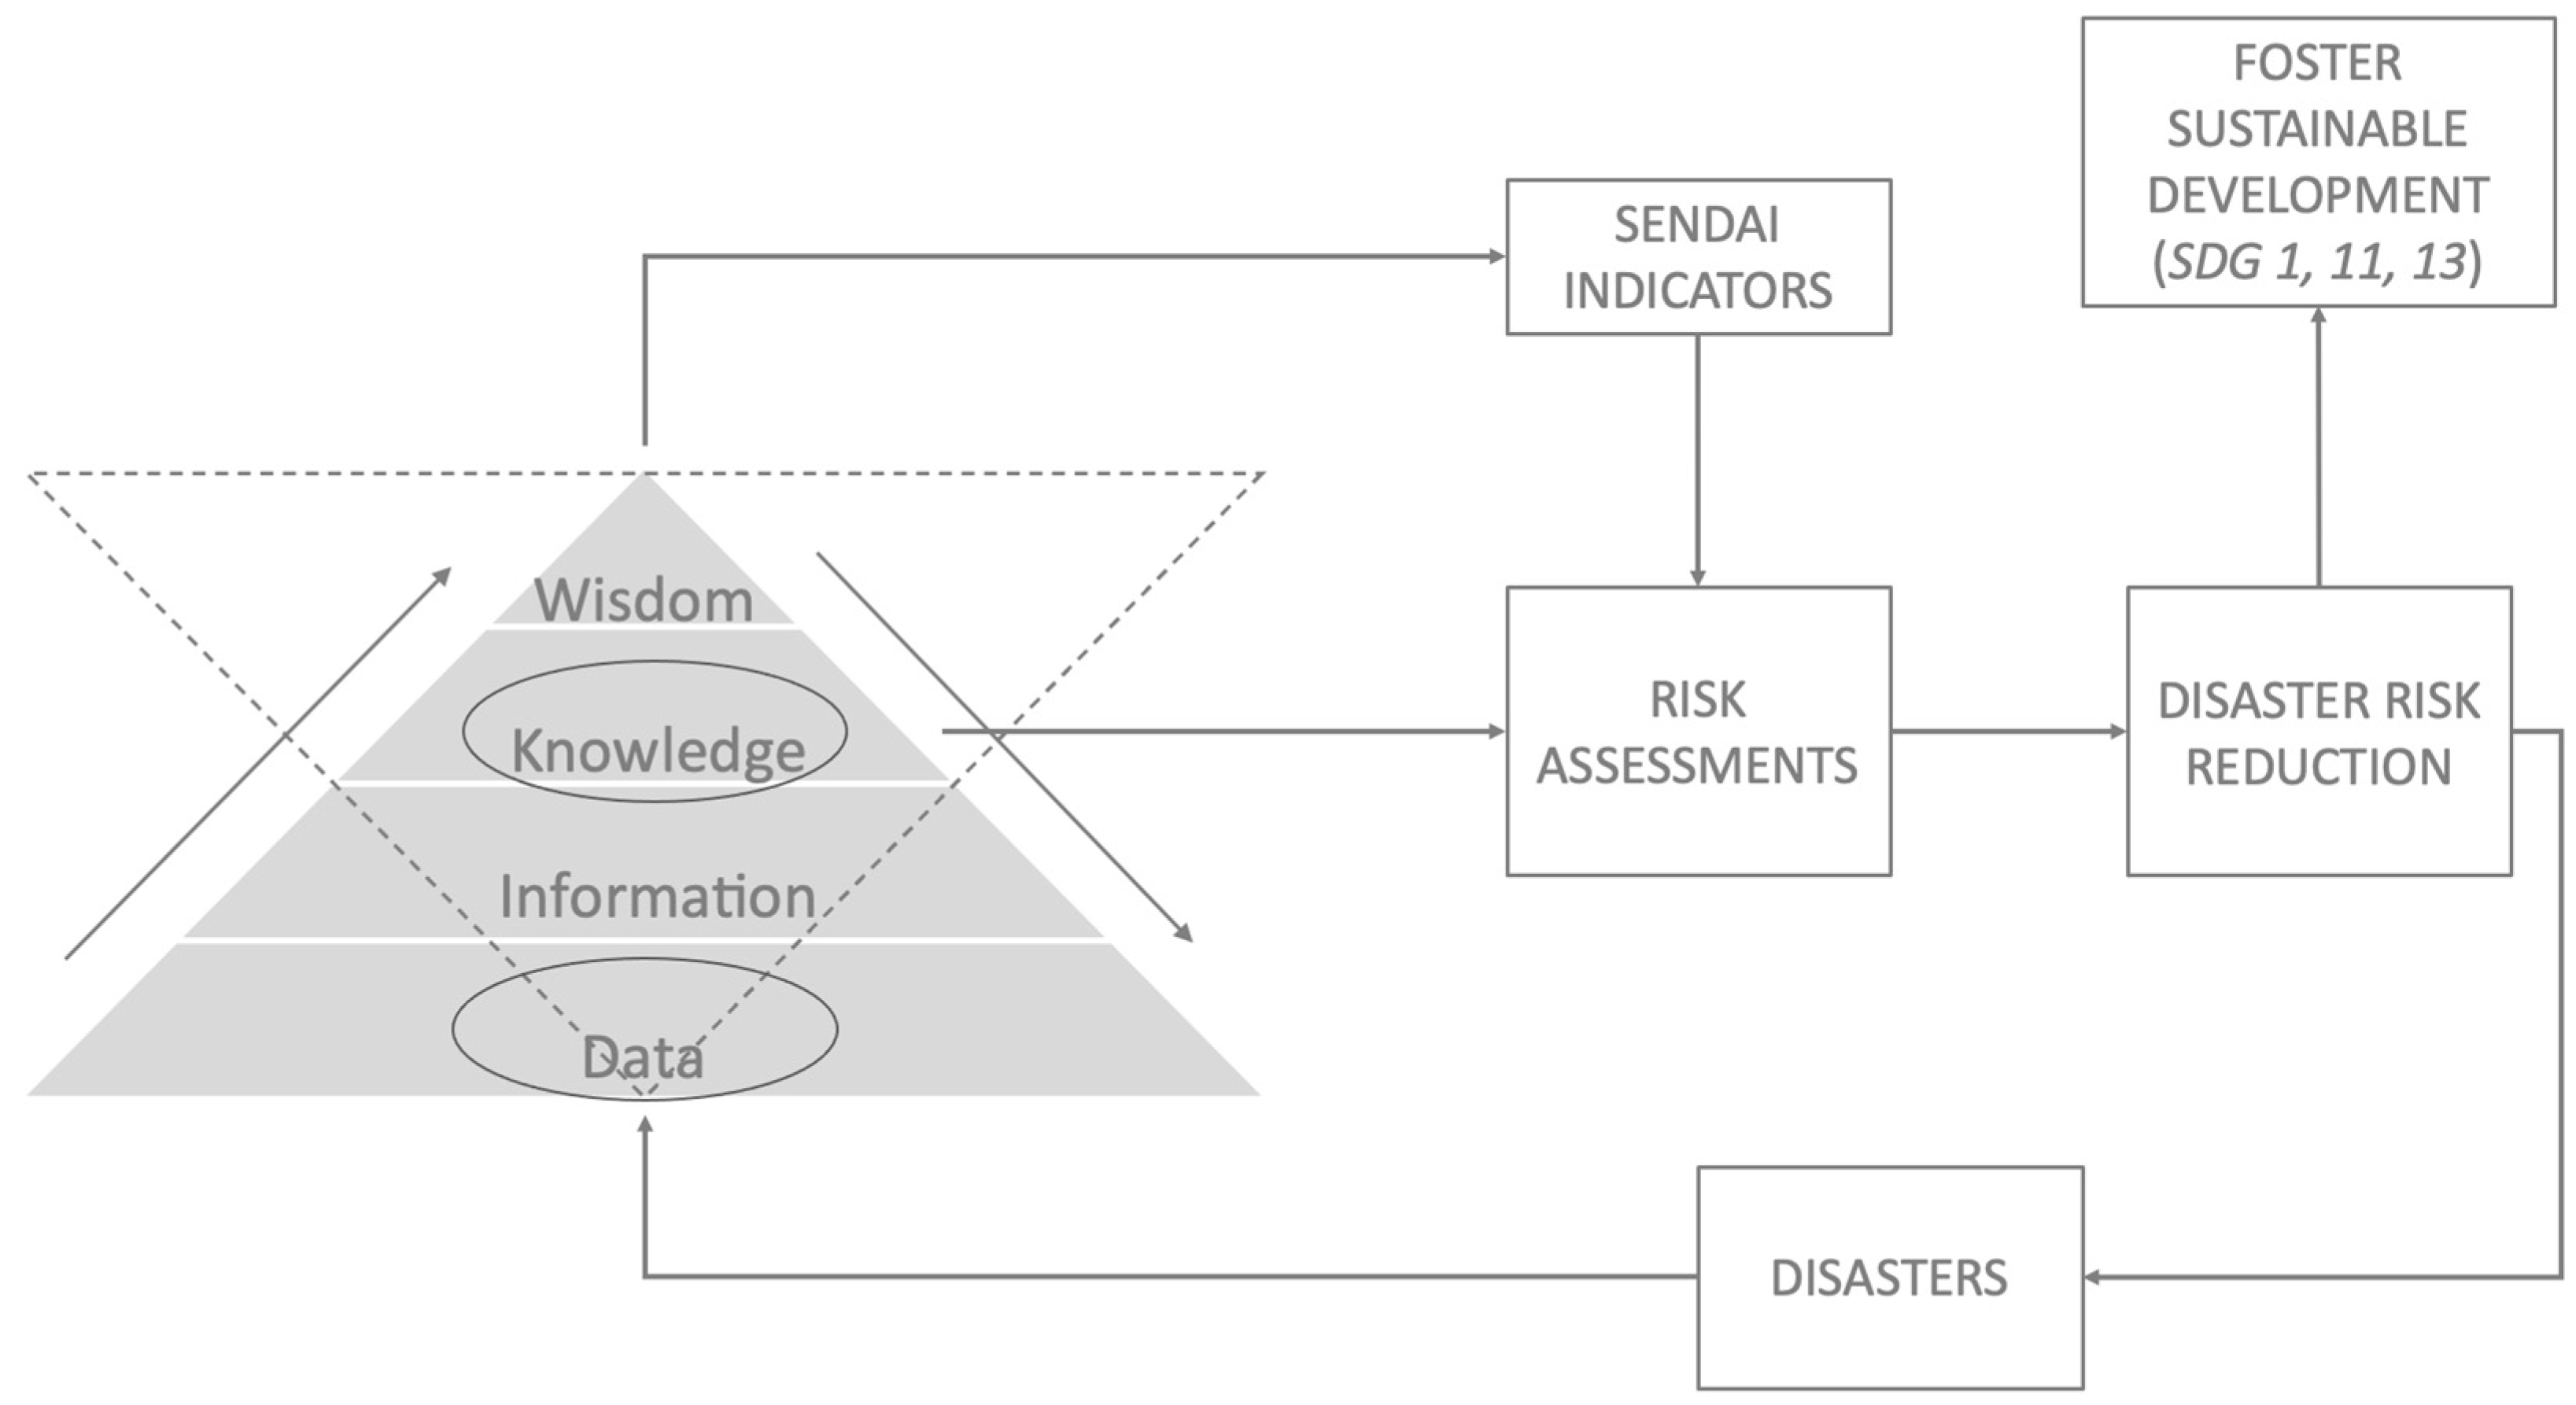
Figure 3 represents such a revised concept. Through a bidirectional flow, observations and “facts” are collected and associated via information to the higher levels of understanding, whilst a more theoretical approach which permits descent from knowledge does discriminate the needed data for analysis and interpretation. Hence, data do not exist as a collection of unrelated isolated facts, rather they are representations of observations, objects and evidence of phenomena. Knowledge permits to link data following a logical pattern depending on the problem at stake. Hence, post-disaster data disclose more than facts on damage and losses, they are constitutive elements of the knowledge base to assess the Sendai indicators (A1, B1, C1 and E1) and to attain the Sustainable Development Goals (
Figure 3).
1.2. Data Science Concepts Applied to the Domain of Disaster Risk Reduction
Data science is an emerging field. Contrary to a layman’s perception and expectation, the definition of its scope and the perimeter of the needed expertise is neither clear cut nor universally agreed upon. Gibert et al. (2018) [
15] position data science at the crossroad of three key fields of expertise: statistics, computer science and domain knowledge. The huge and rapid advancement of computer science at large, including both software and hardware, now permits not only the management of huge sets of data but also their sharing, transmission and storage at speeds and volumes that were unimaginable until a few years ago. Such capacities have rapidly and steadily augmented the possibility to treat very large amounts of data, and new software permits their filtering, classification and automatic ordering in a way that is impossible for humans. The quality of filtering and treatment processes that facilitates the extraction of patterns and meaningful clusters/trends from data rely largely on the knowledge that is embodied in the algorithms that are used and on the objectives for which data management is carried out.
In data science, terms such as “big data” have become very popular, yet far from univocally defined [
16], similarly to the essence of data science. It often refers to the volume and quantity of data, a condition that is not so frequent in the disaster risk domain where we often suffer from lack and relative scarcity of data. However, “big data” also refers to data characterized by a large variety of formats and units of measurement (data provided in the form of text, numbers, pictures, numbers referring to absolute numbers of damaged assets, or to the length of a disrupted network). In the latter sense, disaster and loss data are “big”, and lack of standardization constitutes a significant barrier to interoperability as highlighted by Migliorini et al. [
17]. Navigation of data provided in different formats and units of measurement and aggregation of values at higher scales require extended knowledge of the domain to address different use cases.
The LODE project has contributed to data science in the domain of Disaster Risk Reduction by developing an information system for multisectoral post-disaster damage estimation across relevant spatial and temporal scales. In other publications [
18,
19], we have addressed the advantages of multi-sector damage assessment to coordinate the damage data collection process among different sectors and to overcome the fragmentation currently observed. This was achieved by developing an Information System managing damage and loss data for multiple sectors (namely economic activities, infrastructures and services) considering interdependencies and interconnections among them. Each sector has been extensively analysed to account for its functioning and to understand what type of damage and disruption may affect it. Whilst sectors are a broad categorization of societal systems providing certain functions to a community, they can be abstracted as a set of fixed and movable assets including structures, equipment and machinery. In the standard way post-disaster damage is conducted, the built stock is a key aspect that accounts for the largest portion of damage due to particularly destructive hazards such as hurricanes or earthquakes. It is no surprise then that most established practices are available for buildings. However, as will be discussed in the following, there is still large room for improvement for taking advantage of digitalization in impact assessments on buildings.
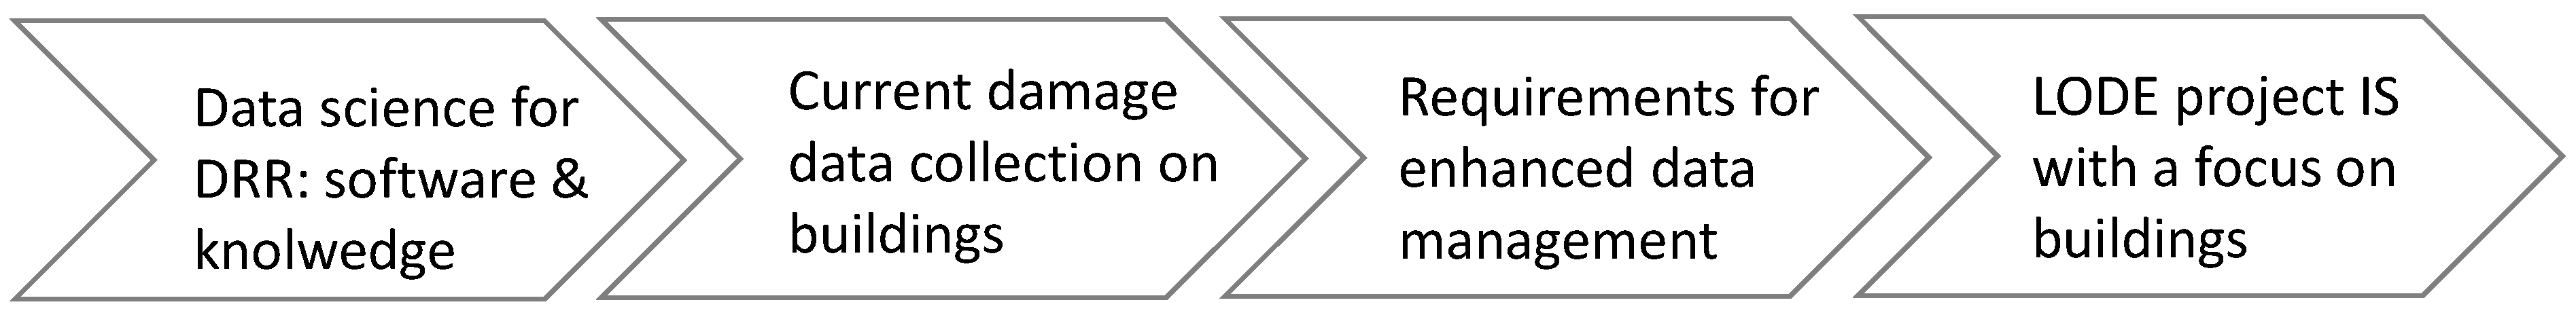
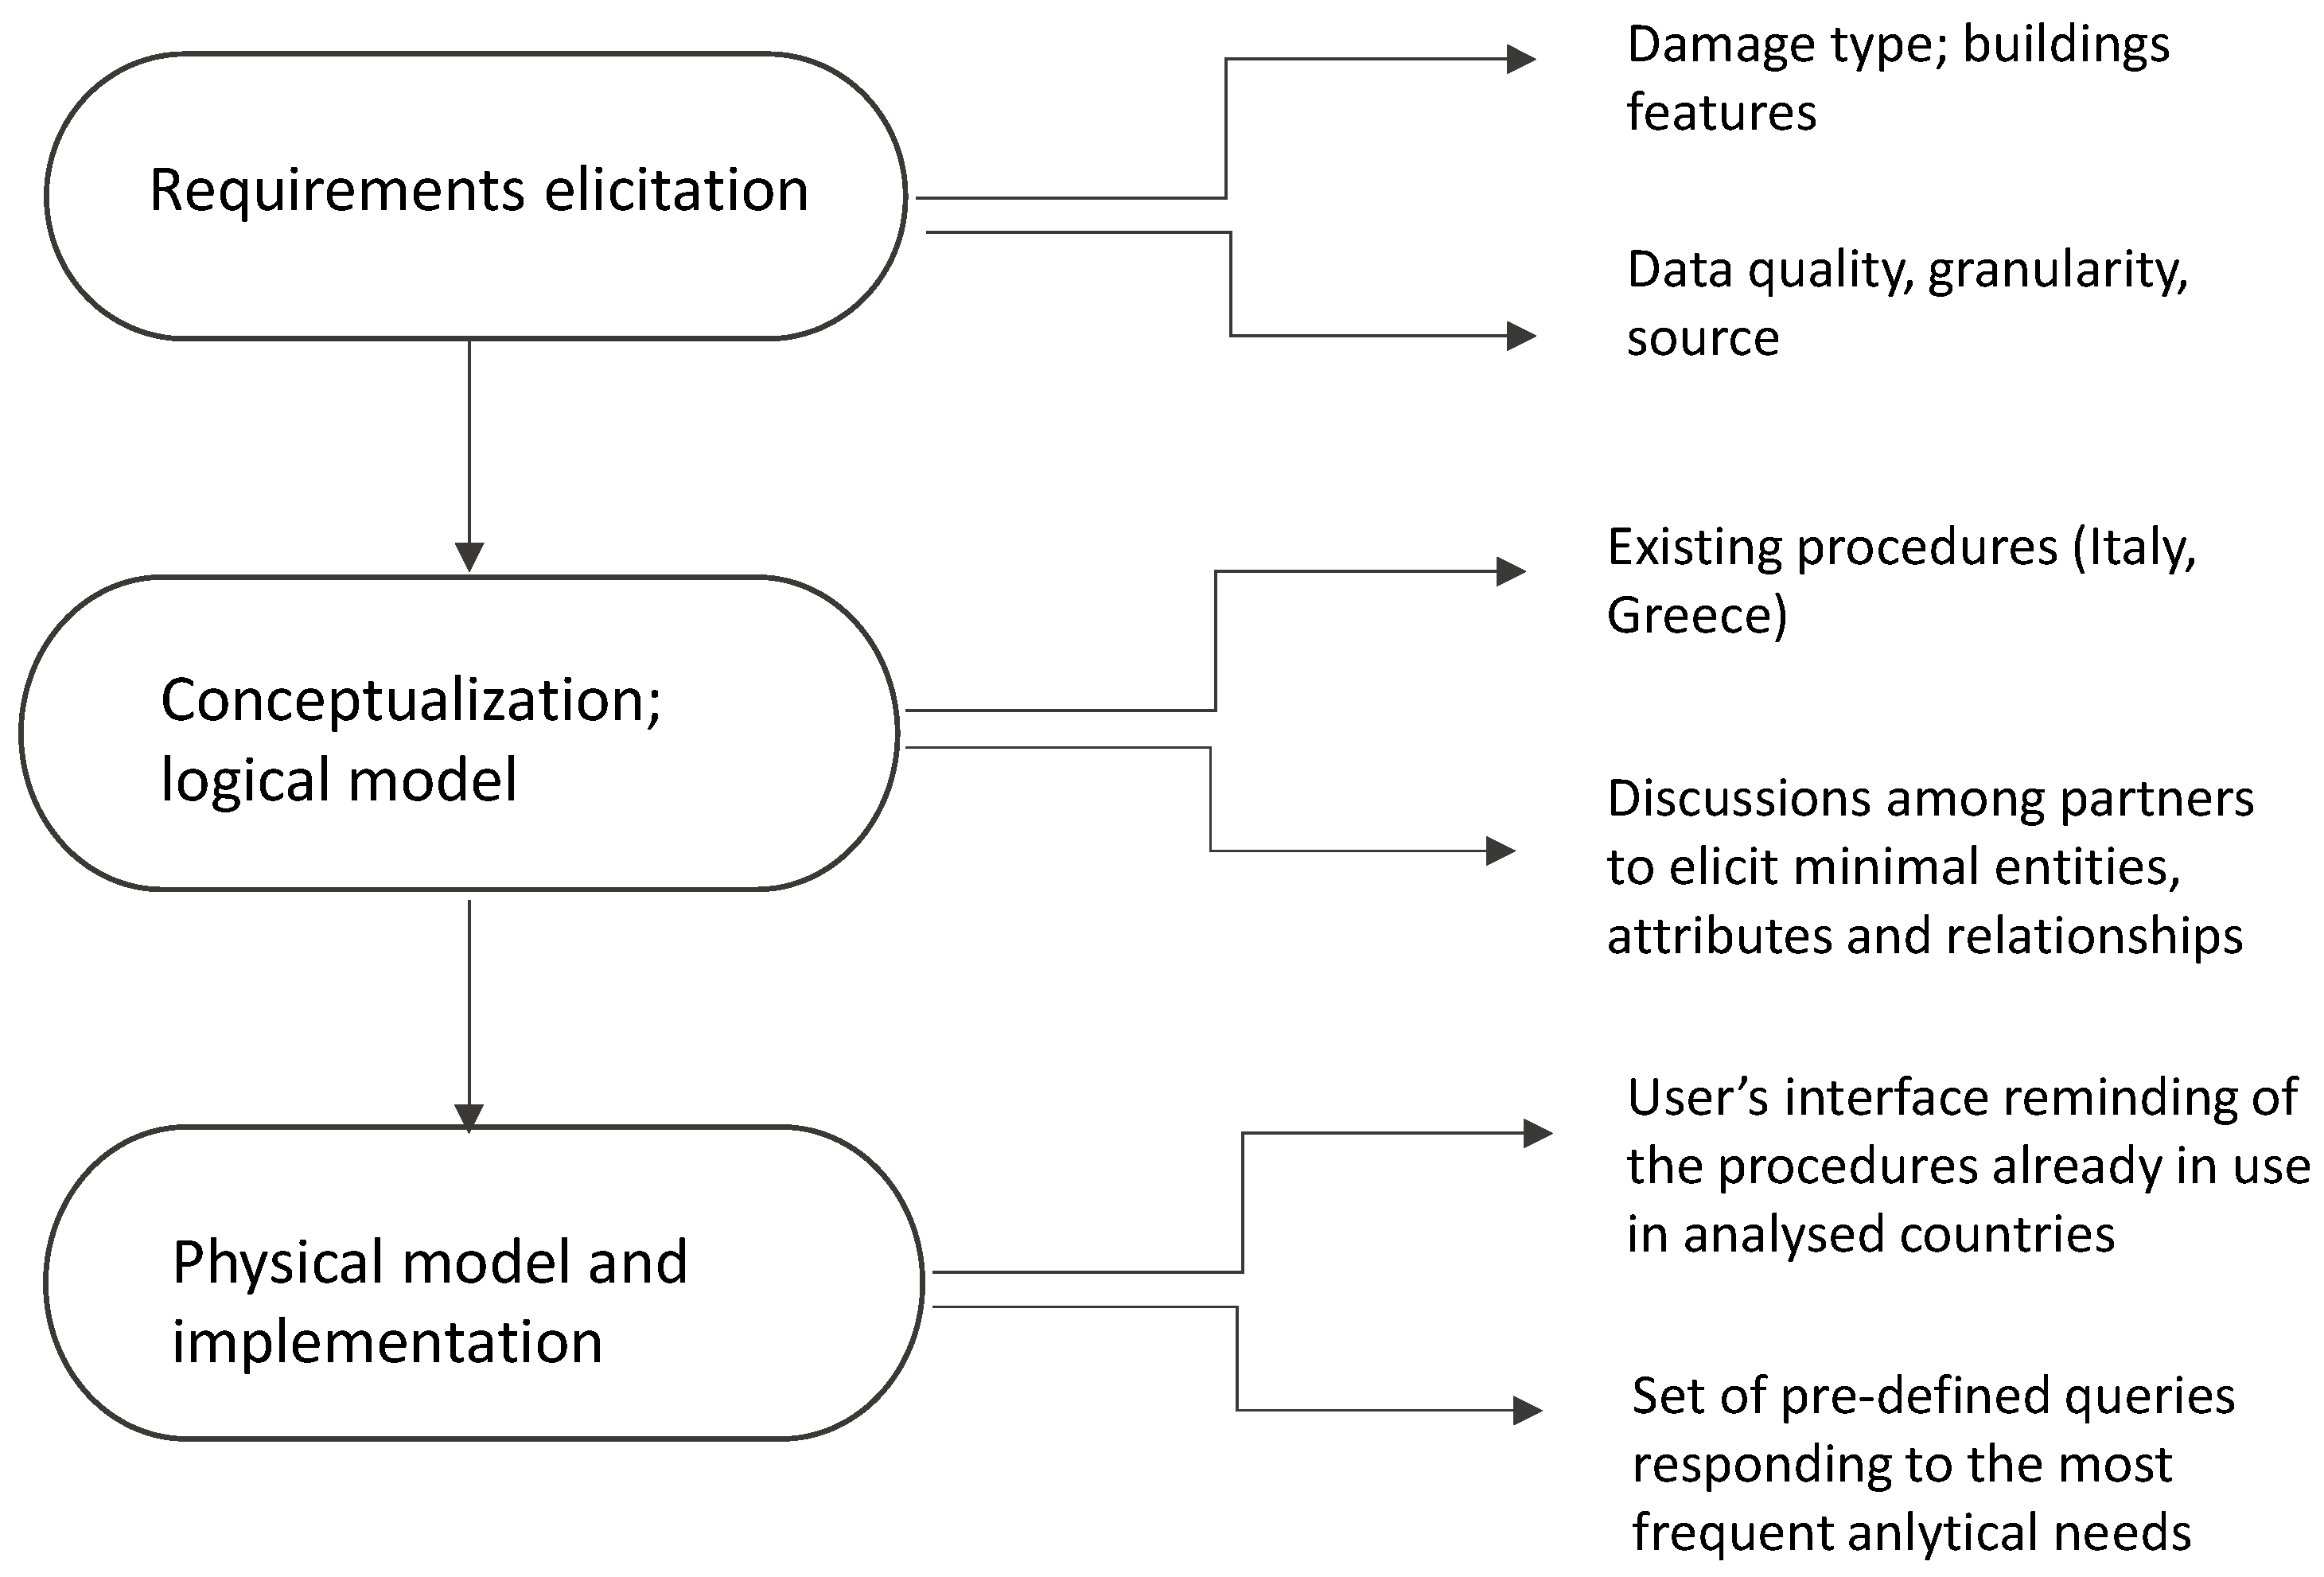
This paper focuses on the proposed advancement for the damage data collection and analysis for buildings conducted by the LODE project. It will do so following the logic chain presented in
Figure 4.
Section 2 is devoted to discussing the procedures and practices for collecting post-earthquake damage data on buildings and their subsequent use in Italy and Greece. Based on pros and cons of current practices, requirements for the LODE Information System are set in
Section 3 illustrating aspects of data quality, time and spatial scales to be addressed and arranging damage to buildings into a more comprehensive multi-sectoral frame.
Section 4 illustrates the IS architecture, design and implementation. The fifth and final section discusses the advantages and the advancement brought by the LODE approach and the IS as well as some criticalities that still must be solved and reflections for future work.
2. State of the Art on the Collection and Use of Damage Data for Buildings in the Case of Earthquakes
The management and coordination of post-event activities are complex, especially considering that initial operations are generally performed in the emergency phase to rapidly deliver damage and usability assessments for each inspected building. At a later stage, such initial assessment must be updated to support the proper recovery of social and economic activities.
2.1. The Practice of Post-Event Damage Data Collection for Buildings in Italy
In Italy, after a seismic event, building usability and damage assessment is coordinated by the Civil Protection using the so called “AeDES” forms, an official tool for first level damage surveys to be performed by trained technicians (generally architects or engineers) [
20]. The procedure aims at surveying “ordinary” buildings and assigning them a usability judgement. This tool was used for the first time after the 1997 earthquake in Umbria and Marche Regions, it was then modified and updated following the experience gained in subsequent seismic emergencies.
The AeDES forms are specifically designed for ordinary construction types (typically masonry, reinforced concrete) that are mostly used as dwellings or local commercial and community services. Specific forms have been developed instead to assess damage and usability of industrial warehouses, theatres, churches and other monuments.
The AeDES forms establish a common language in the damage description, providing a guided path to carry out the usability assessment. Specifically, the forms are composed by nine sections to provide information on the location of the building, on its geometry and structural features and finally on the damages it has suffered, both structural and non-structural. The surveyor is asked to grade the damage (i.e., no damage, low, medium, severe, high, collapse) of different components of the building (structural and non- structural) coherently with the damage levels defined in the EMS-98 [
21] and further extensions. An important piece of information that is collected regards close and nearby structures (such as a historic tower for example) that may impede usability, threatening the building itself or the access to it. At the end of the inspection, on the basis of the graded damage, the surveyor establishes an assessment in terms of usability. The latter may fall into one out of six categories, ranging from usable (A grade) to totally unusable (E grade) with intermediate conditions such as partly usable (C), usable upon minor repairs (B), to be further checked (D) and unusable as mentioned above because of external threats (F).
Data are then digitized (not necessarily by the same surveyor) and stored through an ad hoc application named Agitec. Agitec is limited in the number and type of queries that can be processed given the fact it has been designed primarily as an administrative tool without envisaging data reuse for other, more analytical purposes.
2.2. The Practice of Post-Seismic Damage Data Collection for Buildings in Greece
The inspection of buildings damaged by an earthquake in Greece is mandated to the General Directorate of Natural Disaster’s Rehabilitation—GDAEFK (GSCP 2020) under the Ministry of Infrastructure and Transport that operates according to the national seismic emergency plan. The latter establishes the mobilization of needed human resources and sets up different teams tasked with two engineers each for carrying out the inspections.
The primary objective of such an inspection is the evaluation of the condition of the building given the damage it has suffered for protecting human life and saving properties, considering therefore their residual level of safety. Buildings or their components identified as potentially able to provoke further casualties or injuries are subject to immediate intervention, including removal of non-structural elements (such as chimneys, balconies, or decoration), disconnection of utilities such as electricity, gas, etc., and structural shoring.
The inspection procedure consists of two steps:
- -
The Rapid Visual Inspection to classify buildings according to two categories: Usable (Safe for use) and Unusable (Unsafe for use);
- -
The Re-Inspection, that is performed on those buildings that have been characterized as unusable during the Rapid Visual Inspection. The buildings are reinspected and reclassified in three categories using a colour tagging scheme: usable (green), temporarily unusable until repair (yellow) and unusable/dangerous/to be demolished (red).
A form is filled for each inspected building. Data are then inserted into tables used by the coordinator of the procedure to update the civil protection authorities on a regular basis. This procedure targets typical ordinary construction types (reinforced concrete and masonry residential buildings) whereas schools and monumental structures are inspected according to different protocols and by other authorities.
The forms for Rapid Visual Inspection and Re-Inspection are organized in sections allowing the collection of data regarding building location, owner’s identification, description (year of construction, structural system, usage, number of floors, total area, etc.), usability and damage assessment and indication of counter measures if needed. There are specific technical guidelines for the classification of the building’s usability and damages.
The Rapid Visual Inspection takes place immediately following the main shake and strong aftershocks to provide a reliable estimate of homeless households allowing authorities to take proportionate relief measures. Therefore, the Rapid Visual Inspection form is as simple as possible including limited data entries.
During the Re-Inspection, as building conditions and damages are assessed with much higher detail and care, a more precise evaluation can be made which may also change the initial outcome produced during the rapid inspection.
Then, the owners hire engineers who produce a more precise and detailed description and assessment of damages by listing the necessary repairs in a document that is submitted to the competent authorities for the approval of foreseen costs. Regrettably, over the entire process data are not digitized.
2.3. The Use of Data Collected through the Usability Surveys in Italy
Data collected within post-event usability surveys, represent a unique source for several different uses far beyond its immediate use for assessing evacuation and repair needs.
It should be reminded that:
- -
Data are collected for single buildings;
- -
In most of the cases, the localization consists only in the address (especially before the 2016–17 seismic events), even though in the last versions of the AeDES forms the geographical coordinates are required. This field is only rarely filled by surveyors;
- -
The following structural features are collected: geometric (number of floors, average area, etc.), age of construction and interventions, structural characteristics such as material, type of vertical and horizontal elements, etc. Additional information is provided on buildings use (residential, commercial, services), ownership, occupancy details, and others;
- -
As discussed in
Section 2.1, damage to buildings is assessed through a grading system, thus, with a semi-quantitative method.
In parallel to the previously referred Agitec application, which serves to populate a database of damage to buildings for each single event accessible only to concerned public administrations, a second tool, Da.D.O. (Observed Damage Database) [
22] has been developed by the Italian Civil Protection with the support of research institutions. Da.D.O. is a WebGIS application devoted to managing historical data on damaged buildings and churches in past earthquakes that occurred in Italy between 1976 and 2012. Data collected through the usability forms for “ordinary” buildings have been standardized and georeferenced when available data were precise enough, in the remaining cases the system assigned the building to the municipal centre.
Da.D.O. has served insofar a rather large number of use cases including:
- -
The comparison of seismic damage scenarios calculated and observed (as described also in the Greek case) by single buildings and average values at different scales to analyse the reliability of the various methods used to determine damage scenarios;
- -
Improving exposure and vulnerability models, fragility curves and creation of building portfolios by typology and more frequent damages [
23,
24,
25,
26,
27] leading to more reliable damage probability matrices which are at the base of risk/scenario calculation [
28];
- -
Development of statistics considering areas affected by seismic events at different times (e.g., the Central Italy case affected by at least three strong events for the period covered by Da.D.O.) with the aim of also assessing the effectiveness of retrofitting and repair interventions on the seismic performance of the built environment.
Even though the Da.D.O. platform is constantly refined to feed new types of analyses [
29], it still presents some shortcomings. First, the lack of georeferenced data makes it hard to differentiate the various structures making it necessary to aggregate data (e.g., at municipal level) at the expense of the quality of damage scenarios. Second, available data related to the building characteristics do not easily allow to derive more detailed and nuanced vulnerability measures going beyond the vulnerability index developed in the past by the National Earthquake Disaster Risk Reduction Group (GNDT) [
30]. Finally, the damage measure, qualitatively collected in terms of damage grades, are of scarce use to define or improve the level of detail of losses/fragility models.
In a nutshell, data provided by the Da.D.O. database serve a variety of relevant applications especially if aggregated assessments are required (e.g., typological, areal), with some limitations mainly related to uses that require enhanced and more refined evaluations at a single asset level.
2.4. Assessing Pre-Event Damage Forecasts Using the Empirical Usability and Damage Data in the Kefalonia-Greece Showcase
One of the case studies of the LODE project was the Kefalonia 2014 earthquake. On 26 January and 3 February 2014, Kefalonia island, which is located in Ionian Sea, Greece, was struck by two major earthquakes (magnitudes M6.1 and M6.0, respectively). There were no casualties, but damages to buildings and infrastructure were recorded.
Post-earthquake buildings’ inspection data served two applications. First, the vulnerability assessment before and after the earthquake was compared. As for the pre-2014 assessment, the results of the two-step pre-earthquake vulnerability assessment that is conducted in Greece for public buildings has been used. According to the procedure, as a first step, an inspection form is filled for each building that is then assigned to one out of three vulnerability categories A, B or C, considering the construction material and the building code that was enforced when it was built. Buildings classified in the A category then require a second step which involved a more detailed investigation. Pre-earthquake vulnerability data can be used not only to more quickly identify buildings which may have performed poorly during the earthquake to take appropriate measures, but also in the response phase to prioritize inspections in the affected areas.
After the Kefalonia 2014 event, post-earthquake inspections were implemented by authorized engineers following the methodology described in
Section 2.2 permitting to extract some vulnerability indicators. The result of the comparison between the two sets of data shows that the pre-earthquake assessment provided a conservative prediction of the seismic response of buildings of public use. It is worth mentioning that no public building assessed as non-vulnerable suffered any significant damage.
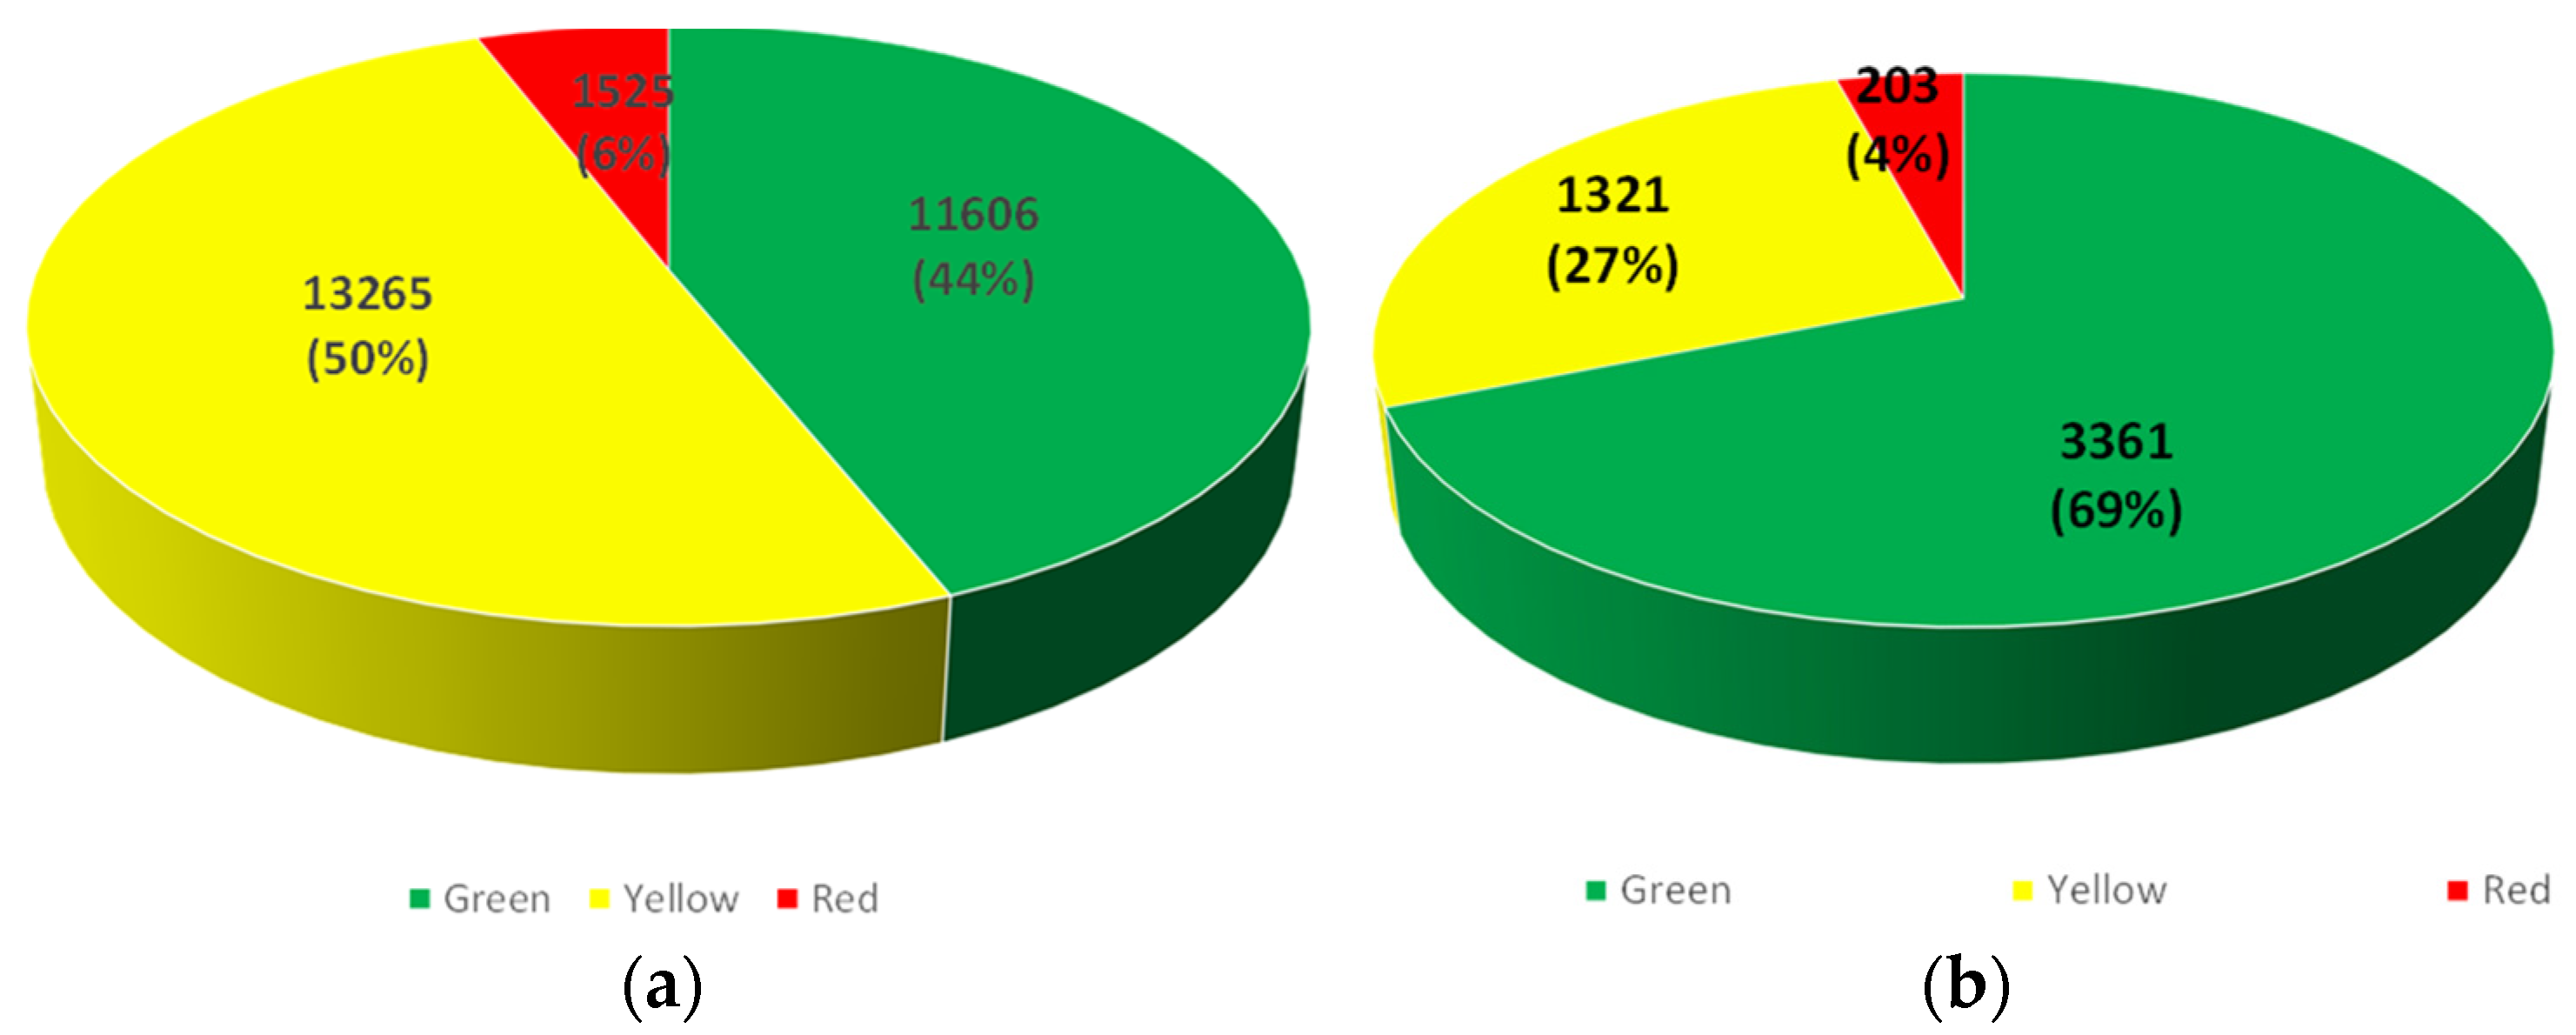
A second type of application consisted in comparing the empirically inspected damage after the 2014 earthquake and the predicted damage scenario using the accelerogram of the 2014 event as an input. As vulnerability forms were available only for public use buildings, residential buildings of Kefalonia were classified in four basic categories according to their structural bearing system, material, height, construction date and the corresponding design code as provided by the 2011 census of the Hellenic Statistical Authority. Fragility curves for each building category and for specific level of damage were determined. The most vulnerable structural types have been identified and expected damages for each structural type has been estimated. The result of the comparison shows that buildings in Kefalonia performed better than estimated (69% of the inspected buildings were marked green, while the corresponding ratio was estimated to 44% of the total buildings). Similar results were obtained for the severity level of the expected damages (
Figure 5).
It should be mentioned that a key factor that strongly influences the results of the loss estimation procedure is the selection of fragility curves which should always approach the seismic behaviour of buildings located in the examined area. Regarding the inspection results, it is obvious that the allocation of a building into a specific category depends mainly on engineering judgment. Any false estimation or assumption of the aforementioned factors, which do not correspond to the area under consideration, can lead to considerable differences.
2.5. Comparing the Two Cases in Terms of Data Collection and Uses
The Italian and Greek damage data collection processes present some similarities as well as differences in the way damage data are collected and managed. In both countries, inspections are carried out during the emergency and early recovery period to provide a rapid usability assessment and to have an overview of the sheltering needs.
In both cases, paper forms are mainly used and later digitized by specialized personnel designated by some authority to perform the task. However, a number of differences can be evidenced as well. First, regarding the administration in charge: in Italy the Civil Protection is appointed, a situation that has created, on some occasions, difficulties in smoothly shifting from an emergency type of evaluation to the procedures necessary to obtain compensatory funds and to commence repair work. In Greece, instead, the Ministry of Infrastructures and Public Works is in charge, a condition which allows to follow the “history” of the damage assessment outcome starting from the initial rapid inspection to the re-inspection and finally to the approved costs of repair. In this way, the monetary compensation is not based on the initial estimation that is often too conservative and based on a rather rough survey, as has been the case in Italy on some past earthquakes. In Greece, the cyclic and iterative nature of damage assessment can be considered more advanced and comprehensive. On the other side, as a counterbalance, in Italy, the Civil Protection whose mandate is Disaster Risk Reduction, has recognized the added value of damage data for vulnerability analysis and risk assessment as the creation of the Da.D.O database clearly demonstrates.
Instead, in Greece, the two tasks of damage data collection and risk assessment are split between the Organisation for Seismic Protection (OASP) and the Ministry of Infrastructures that is mainly in charge of activities under ordinary conditions. The LODE project provided an opportunity to experiment the added value of data obtained integrating the datasets of OASP and the Ministry of Infrastructure to gain insight on the reliability of data produced for vulnerability and scenario forecasting.
3. Elicitation of Requirements for the LODE Database System (IS): Conceptual and Factual
The requirements for the LODE Information System are the result of a rather intense and comprehensive activity aimed at eliciting knowledge in the field of databases devoted to disaster loss data. Such activity included literature review, the analysis of national cases, such as the Italian and the Greek examples illustrated in the previous section, extensive consultation with stakeholders, analysis of current practices on post-disaster buildings inspection [
31,
32] (among others). It also grounded on our own experience gathered in previous projects [
33,
34,
35]. In the following, buildings are first conceptualized as assets within a multi-sectoral framework. Second, the set of requirements for the LODE Information System is delineated.
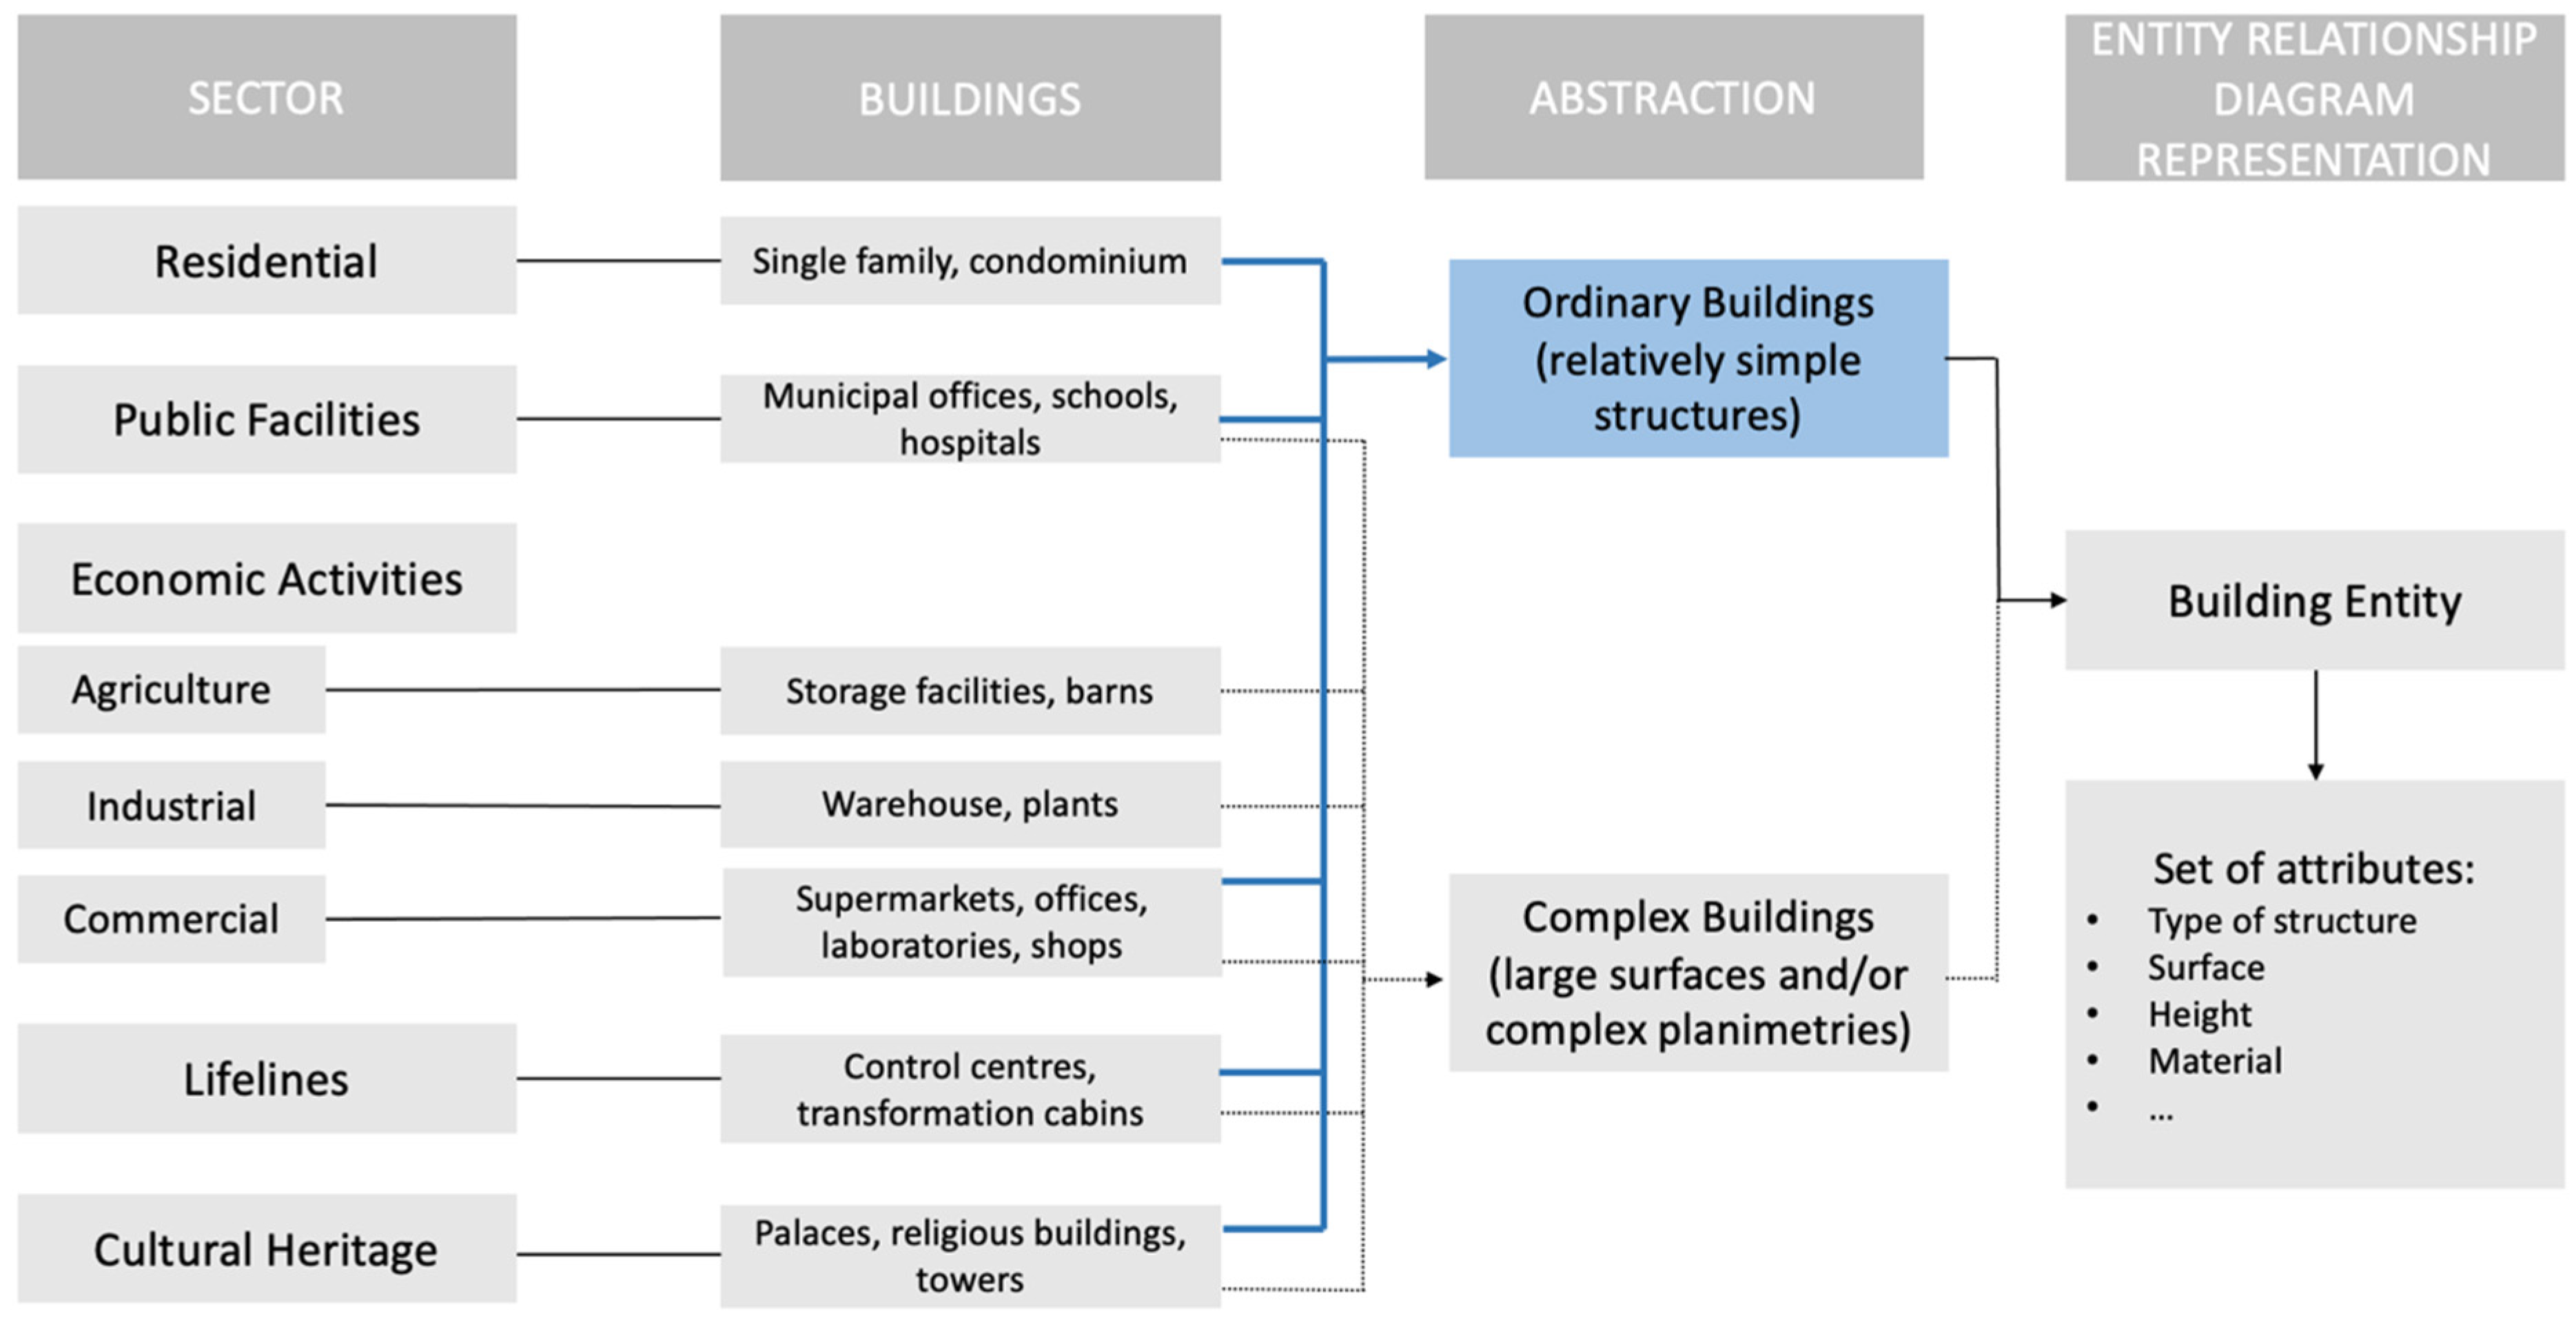
3.1. Understanding the Damage to Buildings in a Multisectoral Framework
As explained in the introduction, the LODE project aimed at developing an IS to collect and coordinate the post-disaster damage data collection across all relevant sectors. Dwellings can be considered as a relevant sector that is significantly affected in highly destructive events. However, in some cases, and very often in cities, buildings host multiple activities and uses, including neighbourhood services and commercial activities. This situation is represented in the framework in
Figure 6.
Different uses are also split by floor (residential use in the upper part, productive, commercial or service activities in the ground and first floor). This conceptualisation has been embedded in the information system as a requirement, guaranteeing the possibility to link the physical damage to parts or totality of the surveyed buildings to their functional use.
3.2. Quality Requirements of Damage and Loss Database
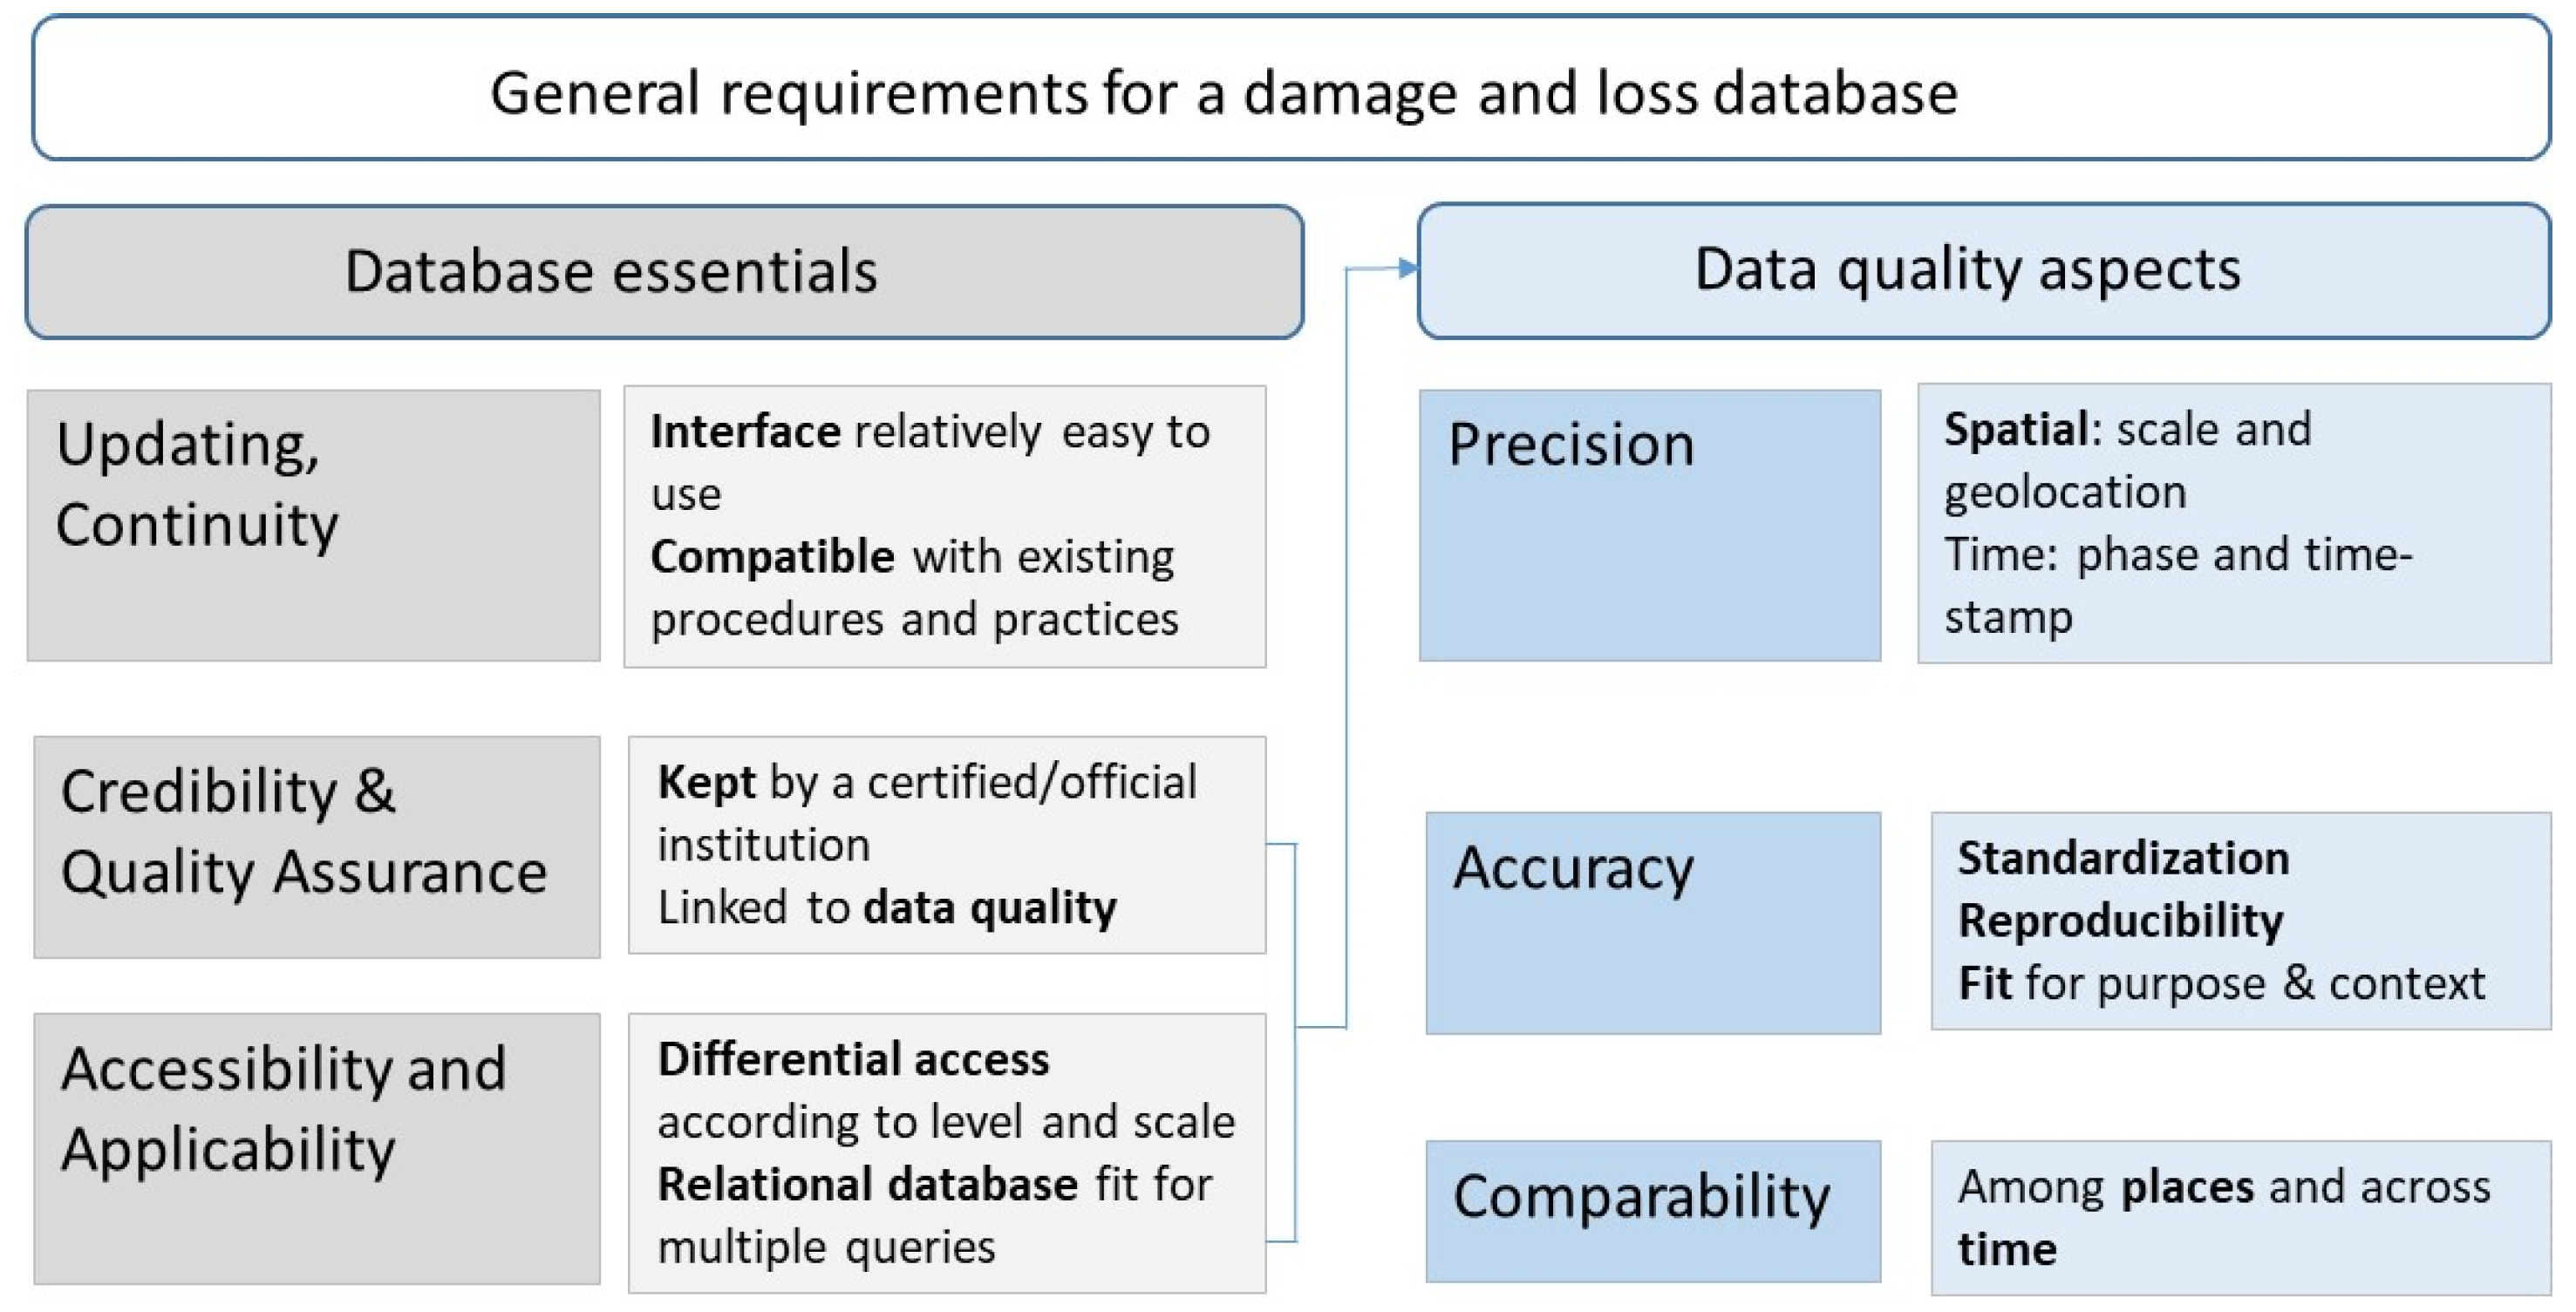
First, we have considered the requirements already elicited in past work, such as those available in the quoted reports of the European DRMKC, proposed by the Organization for Economic Cooperation and Development [
36], the Integrated Research on Disaster Risk (IRDR) and the United Nations. Grasso and Dilley [
37] compared the quality of national databases using six criteria that we have taken as a reference for
Figure 7. The criteria are grouped in three main categories, namely updating and continuity, credibility and quality assurance, accessibility and applicability. The criteria have been considered from a database designers’ standpoint as most of them are also heavily depending on the process and the data governance in general, which is beyond our direct control as a research consortium.
In the figure, the characteristics in the first two set of columns relate to the quality of the database as such. Working with stakeholders in the development of the database, we found that updating and continuity are more likely to be guaranteed if the user’s interface is relatively easy to use, familiar to technicians who will be in charge of maintaining and populating it and integrated in already established and functioning administrative procedures.
Accessibility was less a matter of concern in the development of the system, even though it has been designed to permit aggregation at upper levels (from asset and local to regional and national) which are generally easier to open with respect to the local levels that may contain more sensitive information. An important consideration was given instead to the potential for application as a multipurpose information system was the objective of the LODE project from the start. The effort invested in the damage data collection and storage must be then rewarded by the possibility to use and reuse data for multiple purposes. To fulfil this requirement, a relational database model has been preferred that will be described in
Section 4.
Credibility and quality assurance heavily depend on the quality of data input. The latter has been framed in the second set of columns drawing on literature on disaster and loss data and on some articles on data quality in the science of measurement [
38,
39]. Precision is considered as an important element of data reliability and relates to how data are framed and recorded. In the field of disaster data, spatial and temporal aspects are key concerns. Accuracy is usually related to the validity of data, to their capacity to represent the real “value” of a certain indicator. In our case, the damage occurred due to the impact of a natural hazard. According to Romão and Pauperio [
40], lack of standardisation is a key concern that undermines accuracy. It can be said that practices to assess damage to buildings following an earthquake are a relevant exception, as both in the Italian and Greek case, such practices have been not only codified and well-structured but also tested in practice for several years.
As for “validity” in a broader sense, Funtowicz and Ravetz [
41] highlighted long ago how in the domain of environmental sciences, accuracy and precision can be judged only within the boundaries of specific objectives, context and intra-peer agreement. In a similar vein, Oreskes et al. [
42] discussed how validation and verification cannot be understood in absolute terms in open systems such as environmental ones. Handmer [
43] in an article titled “The chimera of precision” addressed the issue of shifting the request of validity from the datum itself to the process followed to gather it, focusing on replicability and consistency as key concepts. In fact, as discussed by Molinari et al. [
44], damage is interpreted and understood in different manners depending on the role and responsibility of the agency or organization in charge of data collection and management.
Precision and accuracy are crucial for the fundamental requirement that has been set as the key for policy objectives at the European level and in relation to the evaluation of the Sendai indicators, that is, comparability. The latter must first be ensured among countries that damage and loss data estimated for a given hazard in one place can be compared to those obtained in another place. Second, consistency must also be guaranteed across time to be able to evaluate trends of increasing or decreasing damage.
In this regard, it must be noted that the LODE project aimed at developing an Information System to improve damage and loss data collection for the future, acknowledging that using it for historic events would be meaningless, because of the large gaps and missing information available in historic recordings. In this regard, it resembles more the Agitec rather than the Da.D.O database in the Italian case.
3.3. Spatial and Temporal Scales to Be Managed by the Information System
Spatial and temporal scales have been recognized as crucial in post-disaster damage surveys and estimation in different ways. As for spatial, the minimal level at which damage is analysed is essential for future applications. If the goal is then to identify vulnerabilities to improve risk models and/or revise existing codes and regulations, an asset level analysis is necessary. For regional, national and international databases, for programming future expenditure for prevention at larger scales, more aggregated analysis is sufficient. Therefore, depending on the goal, different spatial scales and levels of aggregation must be considered. However, if the initial data are collected or kept only at a large scale, in terms for example of total costs of rehabilitation or reconstruction, then more refined analyses will never be possible.
The term granularity is used to indicate at what geographic level data are collected and maintained. De Groeve et al. [
4] acknowledged that scale and granularity can have five levels that vary from the smallest to the largest entity considered, namely: asset, municipality, region, nation and global. These levels are not necessarily the same for all datasets, but granularity should be smaller than the scale. Highly detailed data would still allow the aggregation of information according to the geographical scale of the analysis. On the contrary, aggregated data do not allow performing analyses at the local level. This requirement is relatively easy to accomplish in countries such as Italy and Greece where the current practice is already to assess each building for usability purposes.
As for the time scale, the situation is more complex, as the two following aspects are key: on the one hand, the timestamp of the data (when damage is reported), and on the other, the time when the damage has actually occurred or became evident. For example, in the case of aftershocks or seismic swarm like those of the Central Italy 2016–2017 earthquakes, subsequent shakes stressed increasingly buildings, but usability or damage assessments were not always available after each significant shock, nor was the damage “history” kept.
The timestamp may be an important aspect of information to be kept in order to judge the accuracy of provided usability assessment. In fact, during first inspections, only a rough evaluation is carried out as the primary objective is to save lives and impede dwellers from returning to unsafe houses; in subsequent surveys made for insurance compensation or for rehabilitation, a much more refined inspection is carried out (see the Greek case). Keeping the time history of the damage data is then very relevant for a number of applications, including the possibility to improve current usability forms, evaluating the cost saving associated to more precise assessments, etc.
3.4. Expected Use and Re-Use of Damage Data to Buildings
In the proposed case studies of Greece and Italy, data are and have been used at least for three different uses perfectly matching the goal of data science applied to the disaster’s domain. First, the data are used to more clearly identify post-disaster needs in terms of financial resources required for recovery and type of engineered repair intervention. Second, the data are used to identify patterns of vulnerability in the different datasets following earthquakes of different severity and exposed built stock of varying resistance capacity. Third, scenarios that could be drawn based on pre-event vulnerability assessments and the “real” damage scenario after a seismic event may be compared. The latter use case is relevant for the improvement of risk models by refining the assessment of vulnerability and exposure features of buildings.
4. Design and Implementation of the Information System
The novelty proposed by the LODE project is based on the design of an Information System supporting the following three main functionalities: (i) collection of data, (ii) systematisation of their storage and (iii) facilitation of their management, including data use and reuse. The developed Information System standardizes the damage data collection, keeping track of from whom, when and where the data were collected, through an interface that directs data to storage “spaces”. Following the principle of relational databases, data are stored in a collection of tables that are interrelated to each other, anticipating their use for various objectives, allowing multiple queries through which information can be retrieved [
45]. By designing a relational database, redundancy and inconsistencies in collected data are avoided.
Translating the observed reality in a logical representation implies numerous challenges and an iterative effort to schematize complex relationships.
Following Teorey et al. [
46], the creation of the Information System followed the steps represented in the logic chain in
Figure 8.
4.1. The Conceptual Model of the Database Managing Damage Data to Buildings
A database is a collection of related data. There are different ways in which such relations can be modelled. For the scope of this article, it suffices to say that a relational database has been preferred in the LODE project for various reasons. First, because the relational model allows for some flexibility for future adaptation to emerging needs in terms of new types of data and attributes to be included. Second, and most importantly, because a relational database permits a much wider set of queries because of the way the relationships among data are expressed. Such variety of possible queries serves multiple use cases, from those that are purely administrative (for emergency and recovery management and for compensation) to the more analytical and scientific (improvement of risk and vulnerability models).
The database system has been designed to be adaptable to further changes while remaining standardised. The structure facilitates the collection of information in a standardised fashion as much as possible through prefigured values to avoid errors and over redundancy.
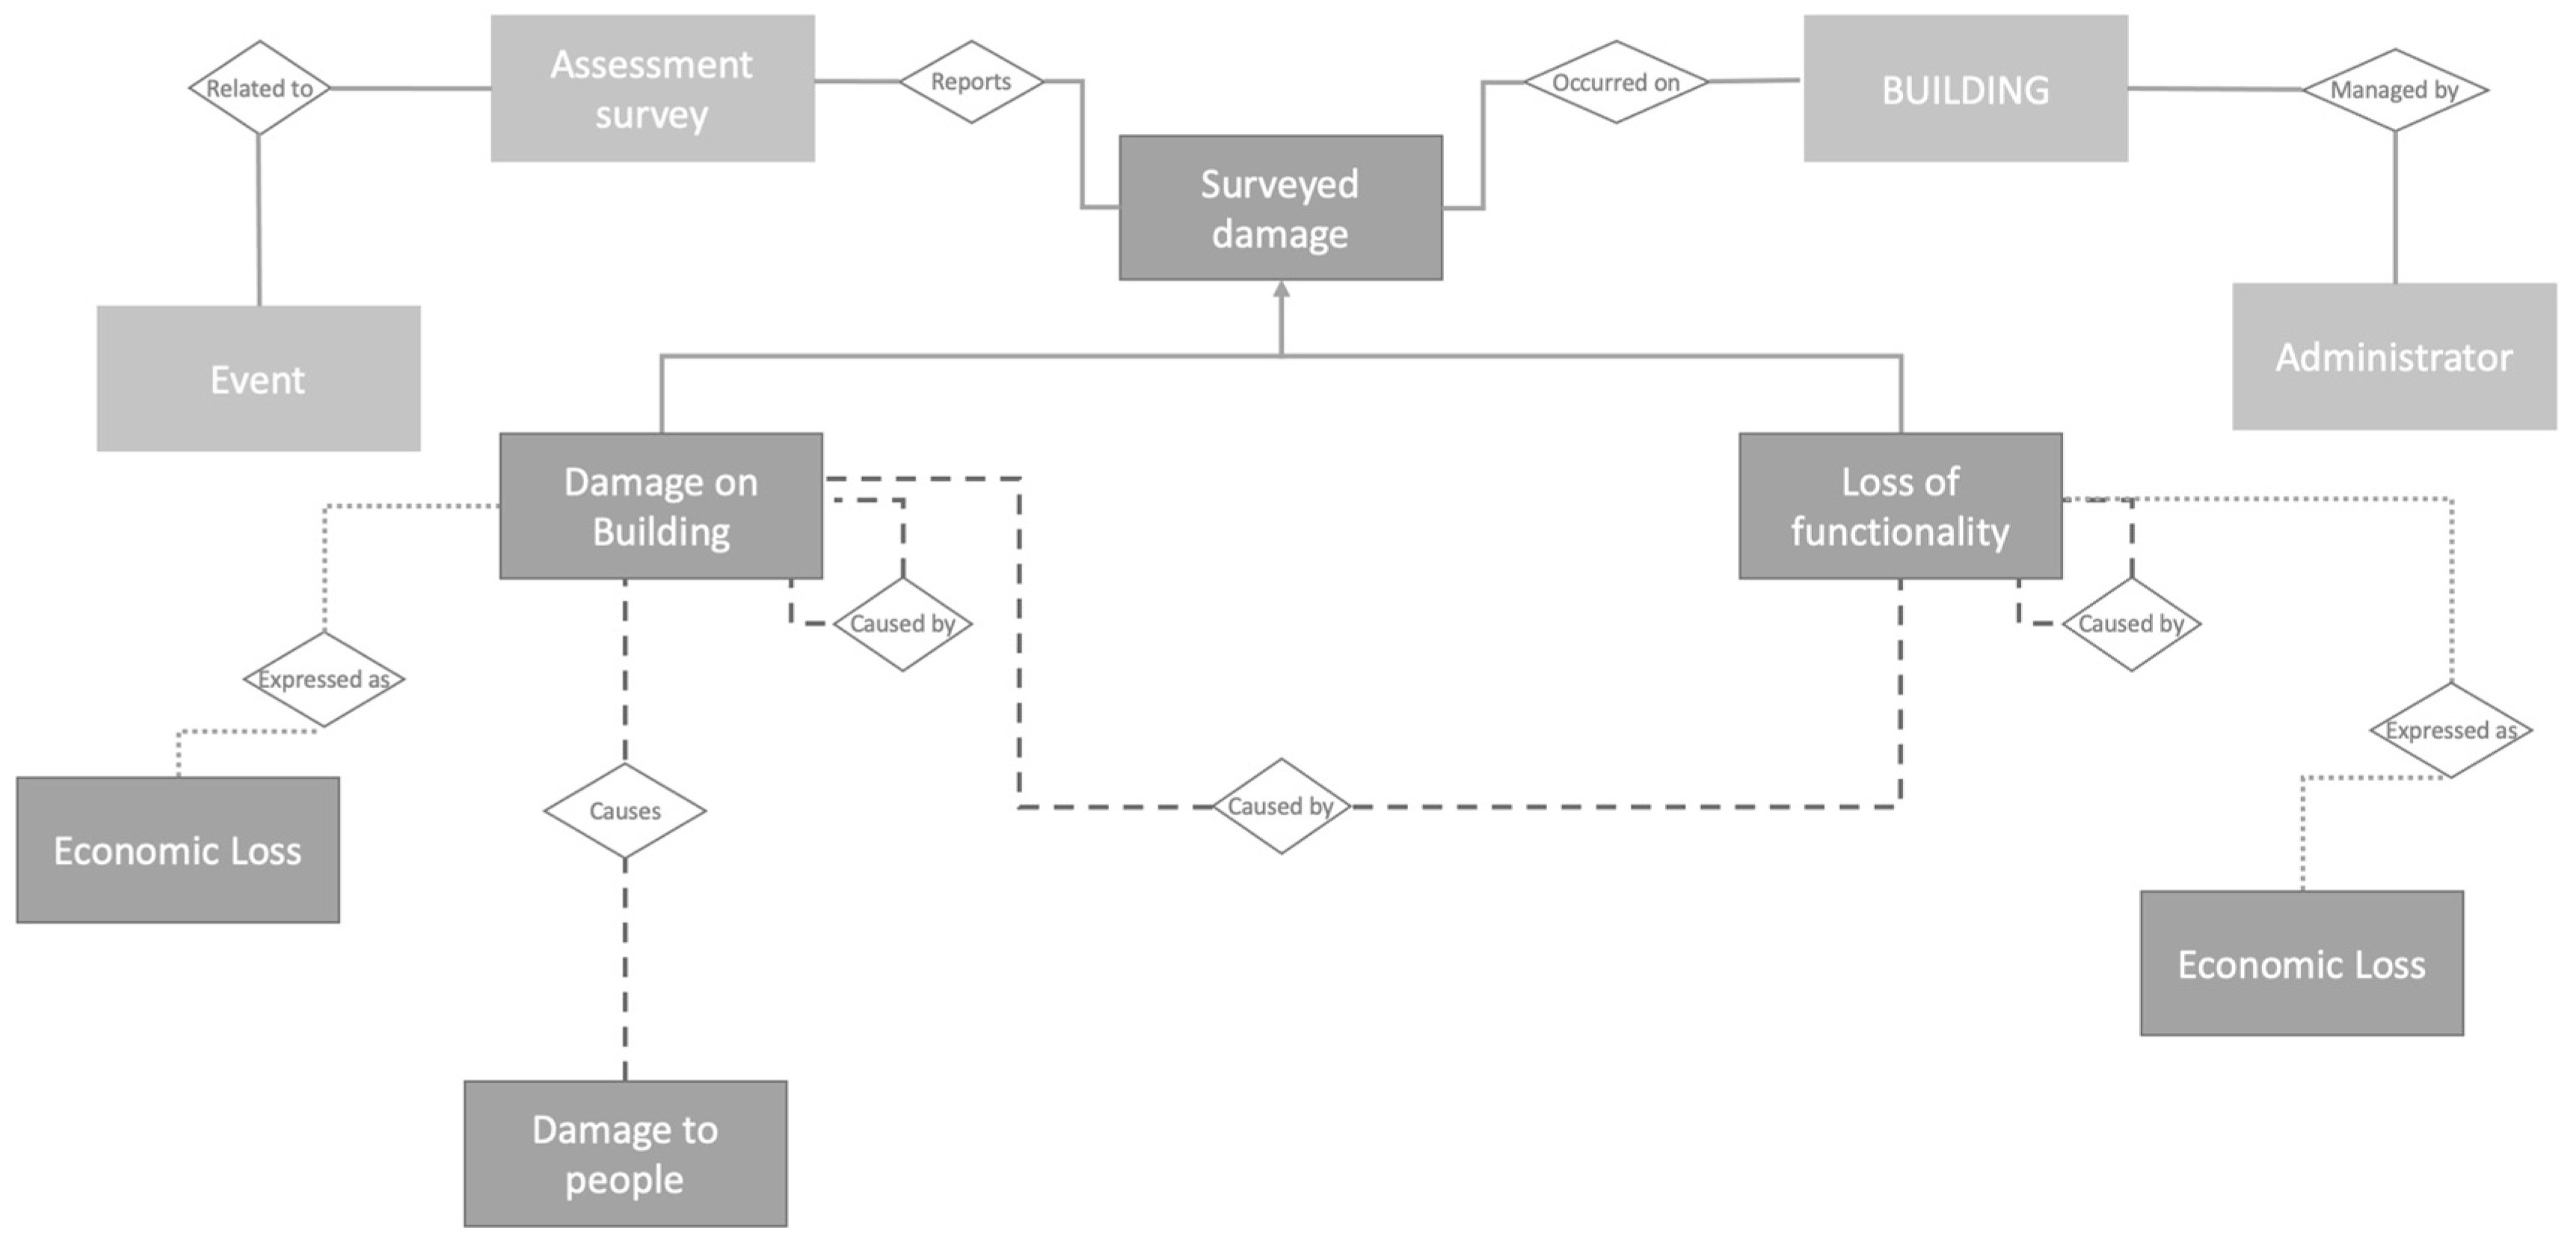
The proposed Entity-Relationship conceptual model represented in
Figure 9 discretises the main physical and functional characteristics of the damage that may occur after hazardous events to buildings across relevant spatial and temporal scales, to account for potential dynamic changes of the latter as damage unfolds. Thus, the system accounts not only for the immediate, direct, physical impact, but also the indirect and systemic consequences of an event. The system allows tracking of the damage across the various post-disaster phases by recording the dates of the survey and the subsequent updates on damage and losses. This information can be retrieved by filtering by time.
As for spatial aspects, the system has been designed to collect information at the asset level. However, it is possible to query the system for different spatial scales (street or district, municipal, regional, or NUTS 2 and 3). Finally, the model allows to keep track of the causality of the damage occurrences through the main relationship named ‘caused by’. This is important to fulfil the requirement to consider damage and losses suffered by multiple sectors also due to their interdependency or the intra-dependency of failed components within the same sector.
In the proposed model, buildings are represented as “entities”, characterised by the so called “attributes”, which have been selected in accordance to the knowledge acquired through the showcases of the LODE project, and “relationships” representing the interactions between the sector’s elements allowing to maintain the link between damages and the time of occurrence. From a graphical point of view, entities (represented as rectangles) are generally related to each other through a rhombus according to the Chen’s notation [
47]. Relationships among two entities have cardinality ratios which specify the maximum number of relationship instances that an entity can participate in [
48].
Entities are discretized in: (i) a set of primary entities; (ii) an entity representing the building stock; (iii) set of damage entities (physical and functional).
- (i)
The set of primary entities aims at defining the survey and the asset surveyed in relation to the occurred event. Surveyed Damage is a “super entity” and the “sub entities” inherit all its attributes. This pattern allows a DRY (Do not Repeat Yourself) approach: common attributes are defined in the “super entity” leading to reduced repetition of software patterns, avoiding redundancy. The Event entity allows the collection of primary information about the event in order to specify it, such as the type (flood, earthquake, forest fire, etc.), the area in which it occurred, the start and end date, severity and extension. The Assessment Survey entity reports information about the time and date assessment and the responsible surveyor;
- (ii)
The Building entity specifies the surveyed assets. Aside the location attribute, a set of attributes denote features relevant for assessing the building’s vulnerability such as year and quality of construction, conservation state, structural connections, retrofitting measures and regularity, etc. Further indicators relate to the economic value of the building and the estimated construction cost per square meter;
- (iii)
As shown in
Figure 9, damages are classified in damage on buildings, loss of functionality and damage on people (SDGs 1 and 11). The former is characterised by attributes describing impacts that may affect the overall structure. In addition to the the date of occurrence of the damage, it is possible to describe both structural and non-structural damages, the damage scale, i.e., the type of measurement used to classify the damage (e.g., damage grades and methodologies from European Macroseismic Scale 98, HazusMH, etc.), the damage level which is a function of the damage scale and the type of damage such as collapse, crack, infiltration, etc. Eventually, a technical description of the damage, including an estimation of the percentage of the extension of the damage and pictures can be uploaded as well. Through the assigned attributes, loss of functionality of service hosted in the surveyed structure that has been impacted can be reported. The type of function of the building can be specified (residential, services, etc.) and the start and end date of the dysfunction can be recorded followed by the usability outcome that establishes if the structure is usable, unusable or partly usable. In addition, the need for temporary measures can be also specified. The damage to people entity, which is related to the damage on building, is described by the number of injured, dead and missed attributes.
Damages are also expressed in terms of economic loss, representing costs of replacement, repair, temporary measures and loss of service/function. Costs are evaluated initially by the surveyor and later provided as approved and compensated costs (as there may be the situation in which costs are considered eligible but funding is insufficient to cover its totality).
The ERD shows the relationships assigned to the different entities, including the “caused by” association, since a damage could affect another asset or function. Therefore, it is possible to track the damage mechanisms and the domino effects.
4.2. Database Physical Model
The architecture of the LODE database management system satisfies the following criteria:
- -
Modularity that permits to achieve flexibility and standardisation;
- -
Hierarchical structure that avoids useless duplication by developing generalisable rules;
- -
Use of open source software;
- -
Georeferencing both assets and damages.
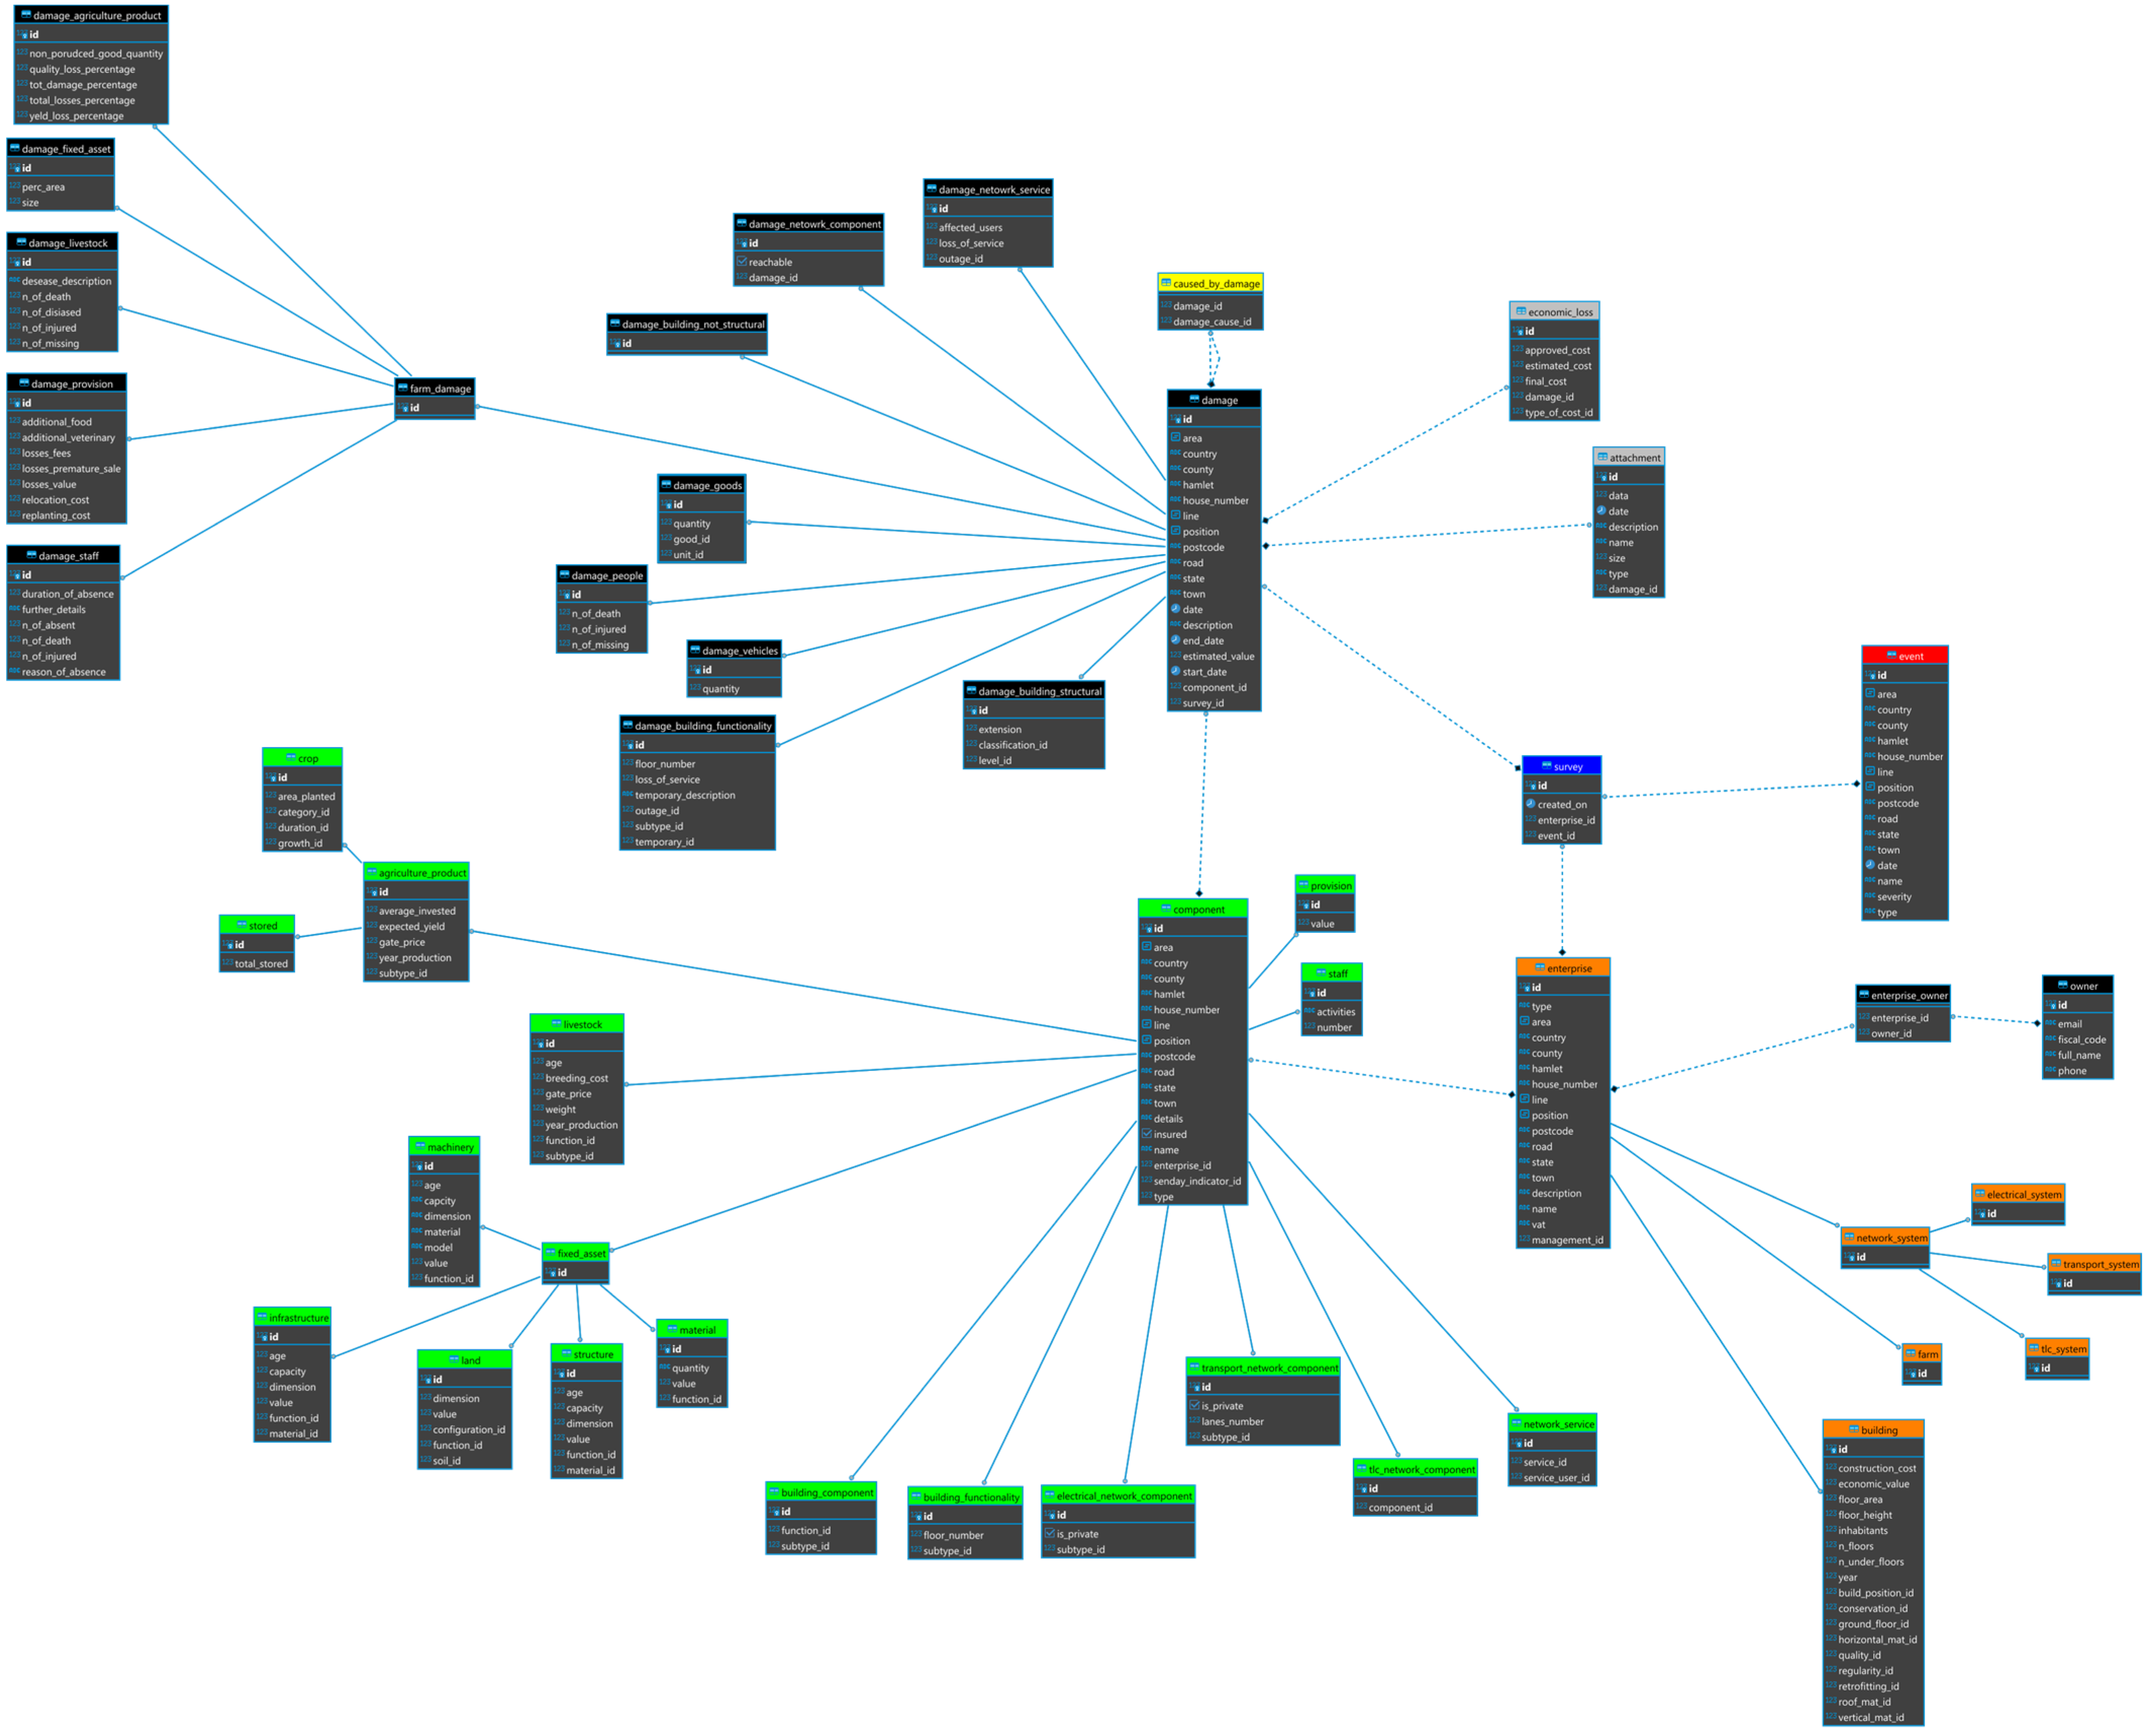
The LODE Information System supports the creation of a comprehensive inventory of georeferenced information avoiding the many errors that are typical of manually managed processes. The predefined relationships among data permit efficient search performance through a wide range of queries to support extensive use and reuse of data by researchers, public officials and practitioners. Queries can be managed through commercial and open-source tools (like METABASE or TALEND) to easily retrieve information such as the number and location of buildings severely damaged built before the introduction of the building code in the country; rehabilitation or full reconstruction costs by municipality; location and clustering of collapsed, severely and slightly damaged buildings, and so on. In addition, the proposed tool allows rapid and more accurate filling of documentation and sharing of large amounts of damage and loss data facilitating fast flow of information, instantaneously connecting numerous organisations across wide geographic areas. In relational databases, the logical model is implemented and translated in a physical model which consists in a collection of tables physically connected as a function of the established relationships. Each table collects relevant features (attributes) related to each entity that has been identified. The designed ERD has been translated into a set of interconnected tables shown in the
Appendix A of this article, which consist in the physical model. In the case of buildings, a table is devoted to specifying the survey (who accomplished it, when, related to which event), another is related to the characteristics of the affected building (age, number of floors, material), another displays the damage that has been surveyed or reported (partial, total collapse, damage to what building component), etc. The links among the tables permit the tracking of the relevant interrelations, for example between the physical damage to structural components and the disruption of the functions it serves as a commercial or a service facility (as damage is differentiated by floors). PostgreSQL has been chosen as the open-source relational database management system (RDBMS) to implement the physical model.
4.3. Application Programming Interface (API)
As for the technical configuration of the IS, the back-end application component of the LODE information system exposes an Application Program Interface (API) in REST (REpresentational State Transfer) format which allows work with HTTP (Hypertext Transfer Protocol) for transmitting hypermedia documents and managing the LODE entities through CRUD (create, read, update, delete) operations. This is possible through OpenApi standards and specification for machine-readable interface files (
https://www.openapis.org/, accessed on 10 January 2022) to query the LODE IS directly or to develop client applications in a quicker manner to interact with the system. In line with the standard definitions, this allows both humans and computers to discover and understand the capabilities of the service without requiring access to source codes, additional documentation or inspection of network traffic. A consumer can understand and interact with the LODE remote service with a minimal amount of implementation logic.
The toolset chosen to develop the information system (Java Spring Framework) includes the auto-generation of the Swagger editor; this allows a third-party integrator to easily navigate and live test the API through a well-known web user interface.
4.4. User Interfaces (GUI)
The implemented web user interface has been designed using a front-end, JavaScript library ReactJS with additional components for the state management (Redux) and logical routing (React Router).
The user interface has been shaped using Ant Design library: an open-source set of high-quality components, to unify the L&F (Look and Feel) of the overall frontend.
The result consists in a SPA (Single Page Application) implementing the REST API exposed by the backend system.
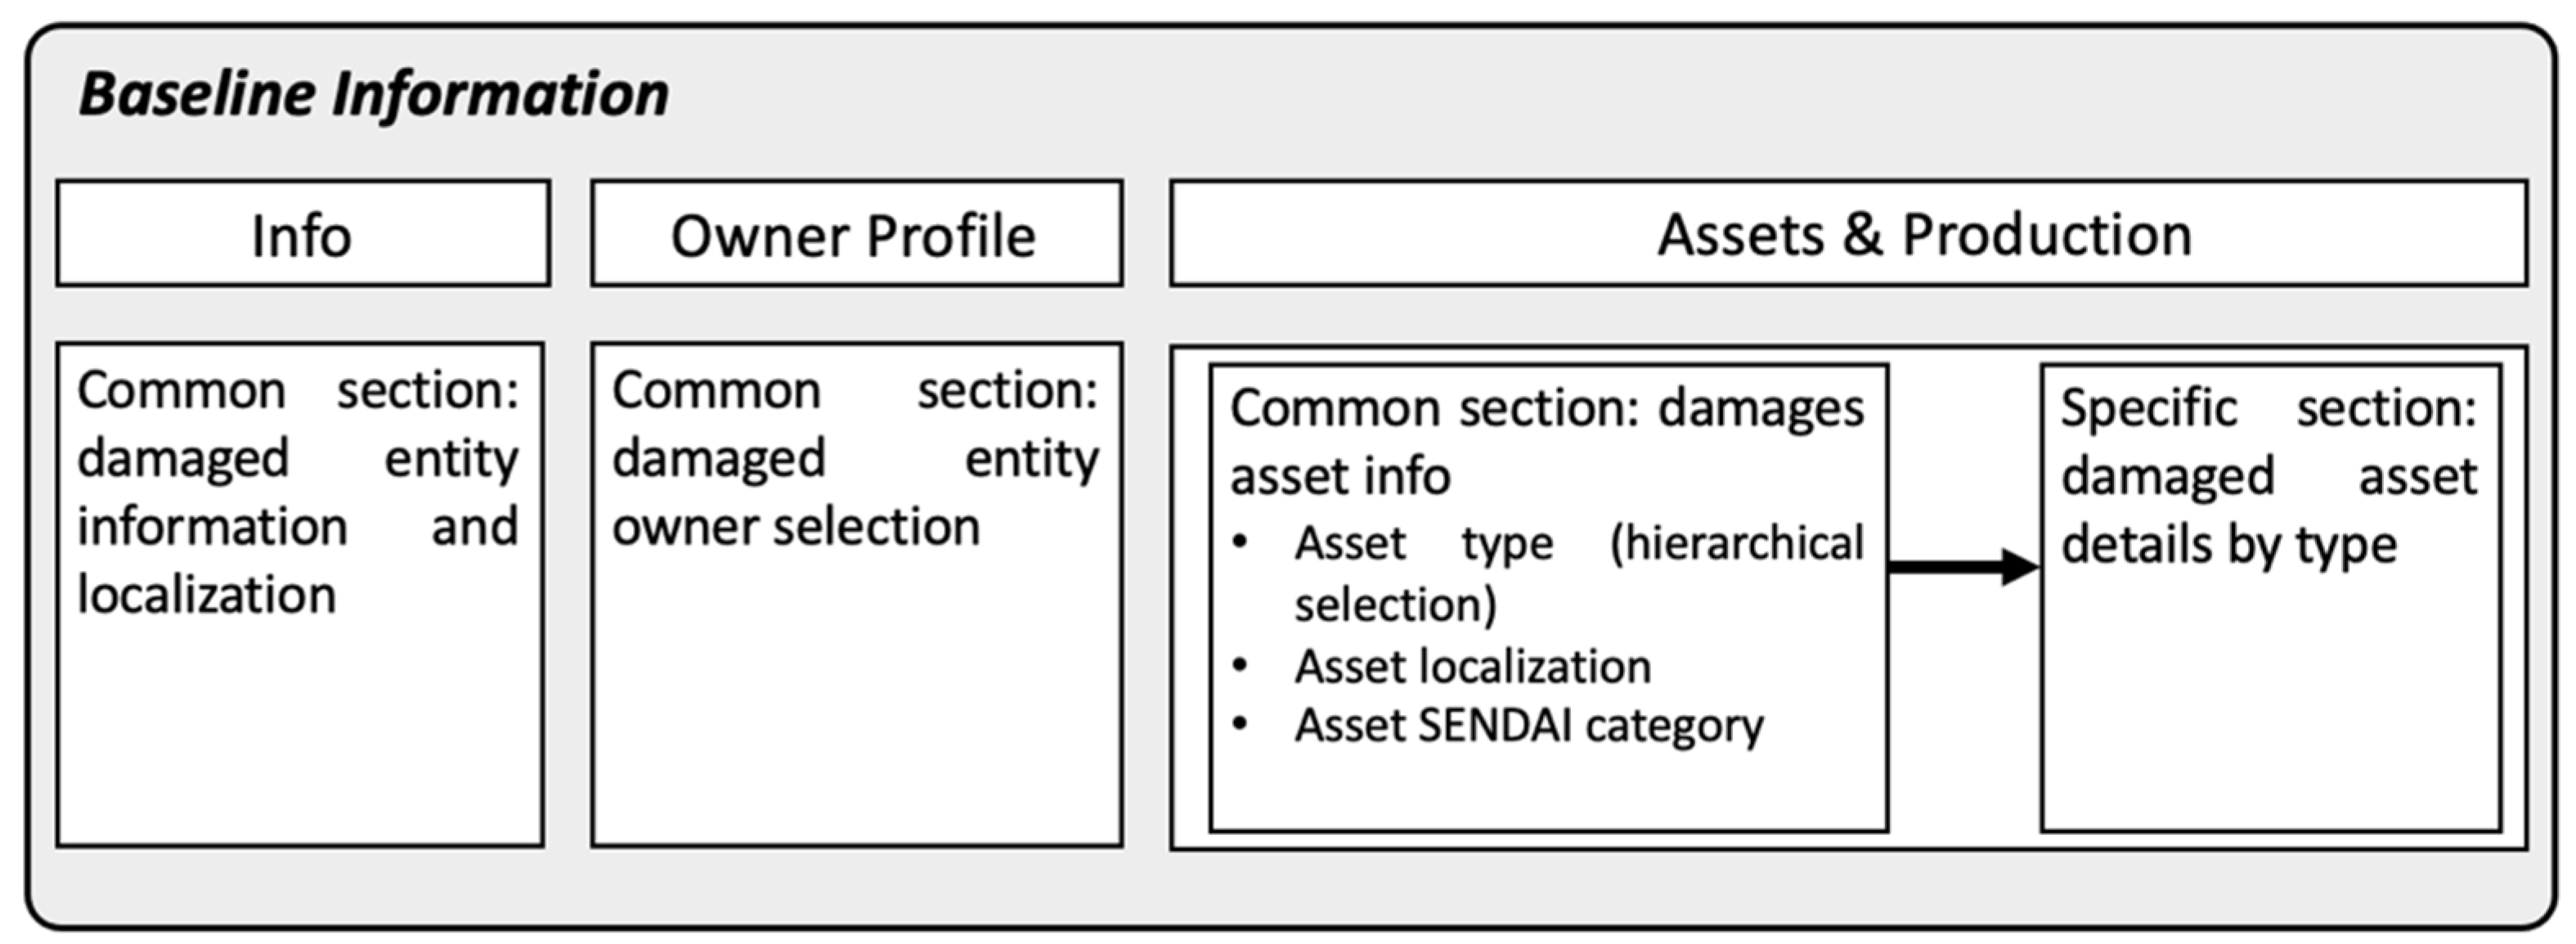
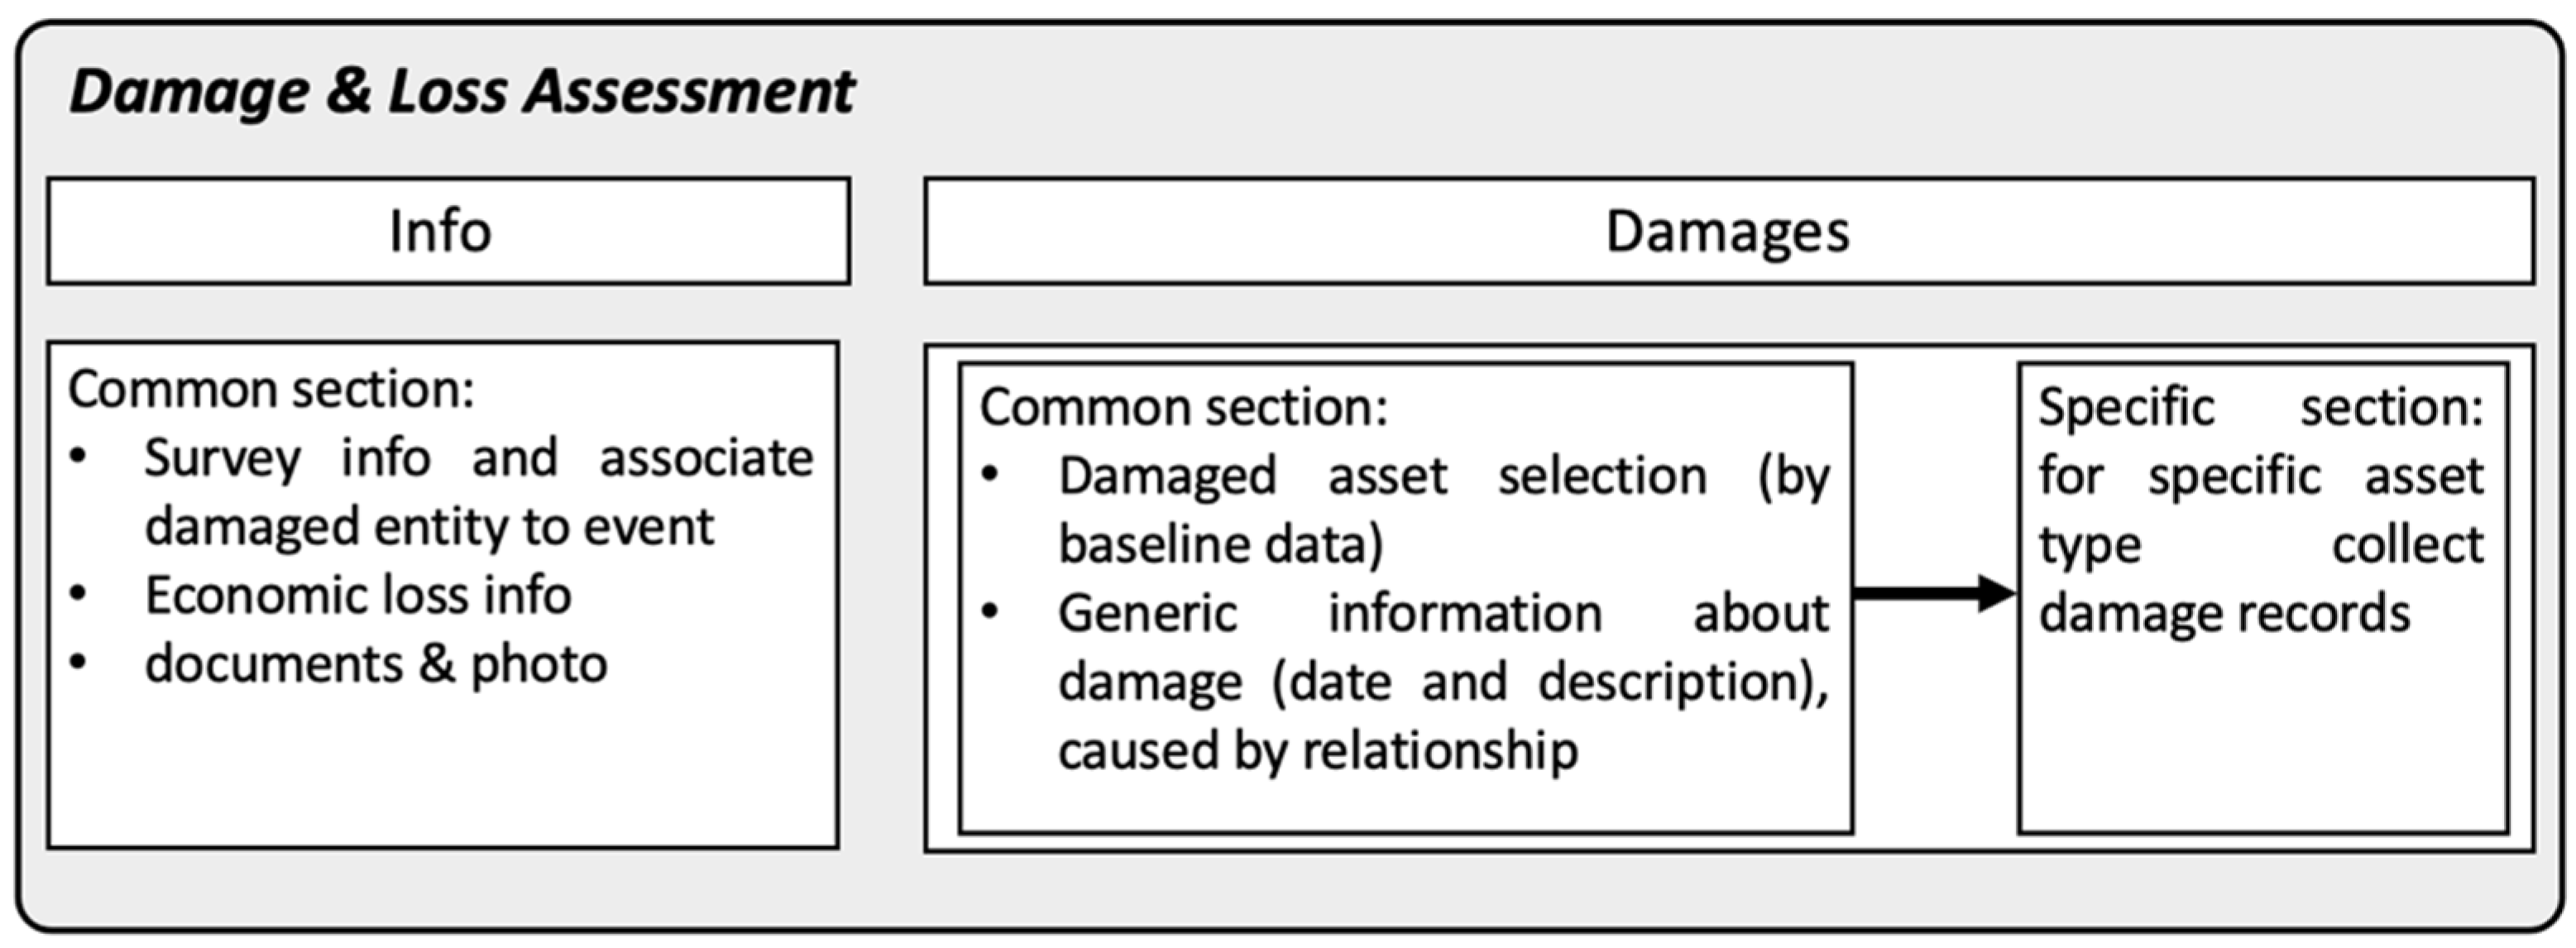
The GUI (Graphical User Interface) was designed through the DRY (Do not Repeat Yourself) approach by abstracting and reusing the common elements (i.e., attributes) of the different assets and damages of the model. This approach allows insertion of new typologies of assets and damages in a standard manner, implementing only additional views needed to collect and record supplementary specific details of newly added entities, reusing the common initial element and mimic what has already been performed in the hierarchy of the model domain.
Figure 10 and
Figure 11 explain the logic behind the design of every component of the interface, highlighting the adopted “reuse” concept. As shown, most of the entities have a common section, which means that the same structure is kept in the system regardless of the numerous possible categories that might be surveyed; for instance when considering Assets & Production, the data collected would follow the same structure either for assets of the agricultural or the residential sector, by allowing the collection of the main records such as (i) asset type, (ii) asset localization and (iii) asset SENDAI category; which are the same for every type of asset considered belonging to any societal sector envisaged.
For the geo-mapping component, the GUI uses a ReactJS wrapper of the Leaflet library.
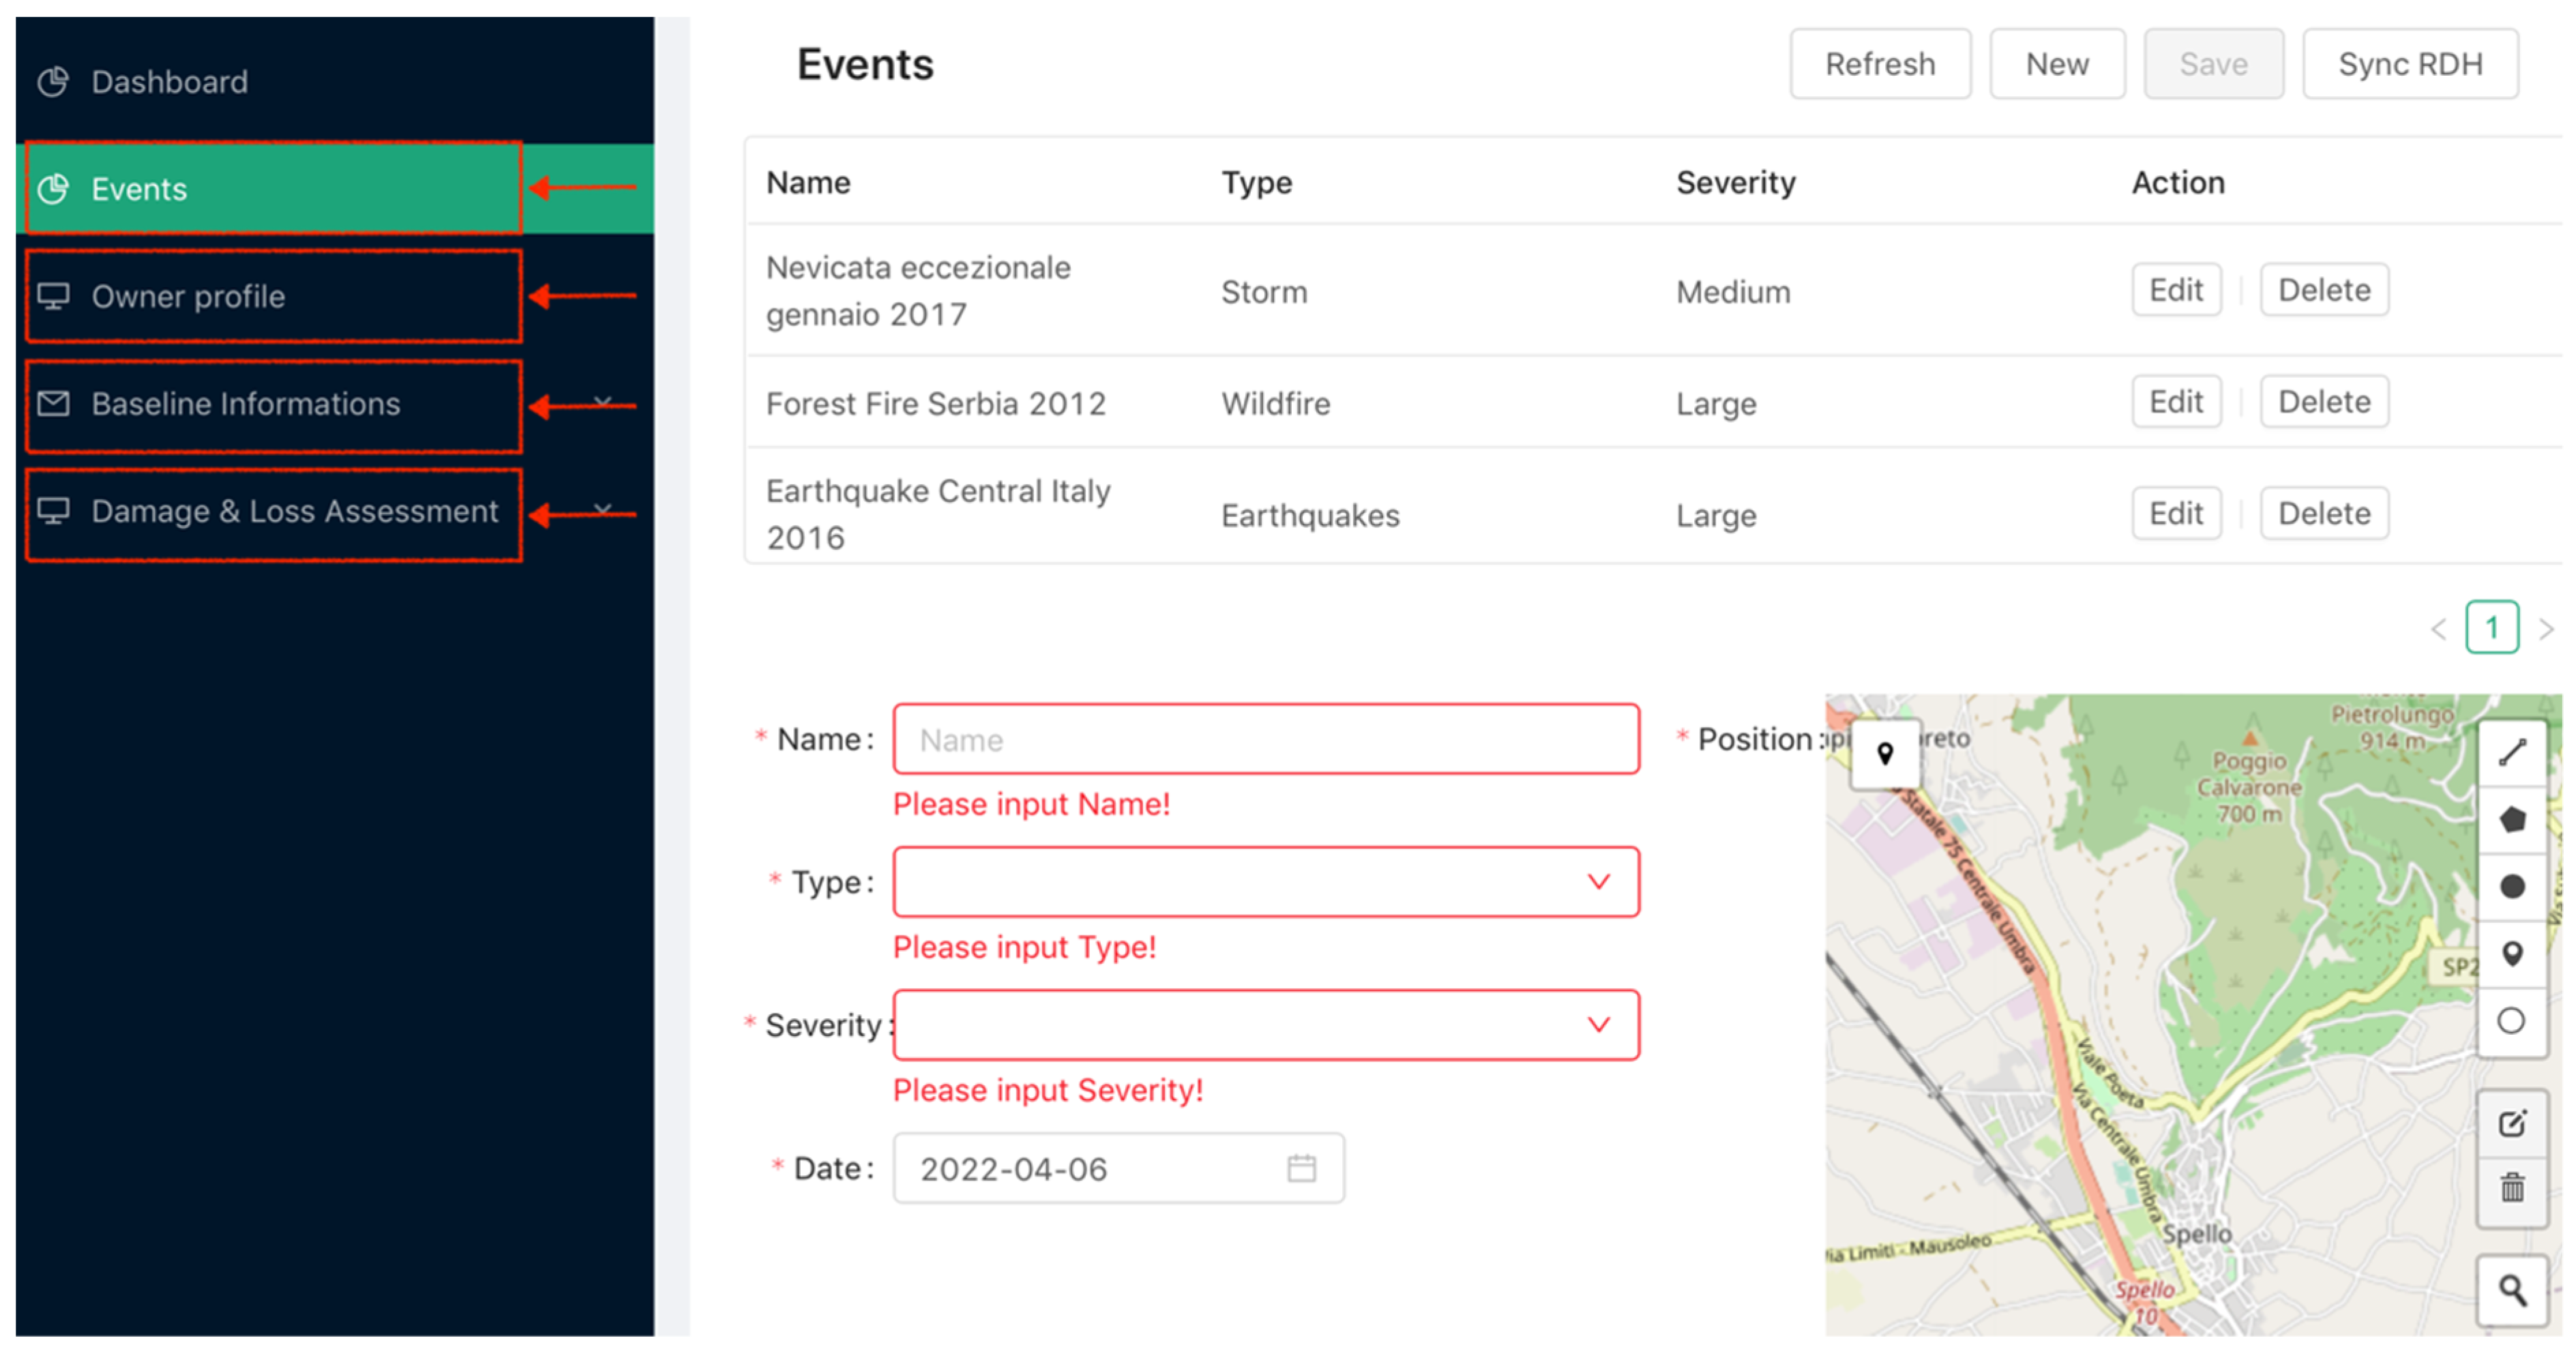
The GUI is composed of four main sections (see
Figure 12):
Event: to enter the name of the event, type of event, severity, date and geographical location;
Owner profile: to enter data of the titleholders of the companies/organisations;
Baseline Information: to enter information for the profiling of companies/organisations and their related damaged assets;
Damage & Loss Assessment: to enter damage and loss data (description, type, start/end date and location).
Figure 12.
GUI of the LODE IS—four main sections highlighted on the (left) sidebar.
Figure 12.
GUI of the LODE IS—four main sections highlighted on the (left) sidebar.
The User Interface Flow, which represents how the user would interact with the interface, i.e., the pathways he/she can take when interacting with the LODE IS, shows how a new damage survey shall be managed when a new operation starts:
- (1)
Baseline information procedure:
Does the Event exist? If no: add it;
Does the damaged entity exist? If no: add it;
Does the damaged asset of damaged entity exist? If no: add it.
- (2)
Creation of the survey procedure:
Create new damage survey;
Associate damaged entity to the event;
Select the damaged asset of damaged entity;
Add records about the damage of damaged asset;
Add (if exists) a <caused by> relationship between damages of different damaged assets related to different damaged entity.
4.5. Technologies Used for the Implementation of the IS
The backend of the Information System was developed using Java technology and specifically exploiting the following main components and principles:
OOP (object-oriented programming) model;
IoC (inversion of control) paradigm;
Open-source Spring framework components: Boot, Data, Web;
Open-source ORM (object to relational mapping) framework: JPA, Hibernate;
Open-source MapStruct library: DTO to DAO abstraction;
Open-source PostgreSQL + PostGis as DBMS;
Eclipse IDE.
The development environment was based on a Dockerized instance of PostgreSQL and Nginx frontend reverse proxy.
The deployment of staging was performed on Digitalocean virtual infrastructure with 1 vCPU, 1GB of RAB and 25GB of disk space.
5. Conclusions
In this paper, we illustrate the shortcomings of current post-disaster damage collection procedures, particularly those used to support a number of policies, including the Sendai Framework, Sustainable Development Goals and the European Climate Law. Our work proposes a well-structured IS developed within the LODE project and describes its main features. Starting from applications of damage data in Italy and Greece, the paper draws some lessons learnt using available data in case studies. The paper discusses how the proposed IS may both facilitate and enhance current data management practices for collecting and analysing damage to buildings.
The specific focus on building damage and current practices following seismic events is framed within a more general conceptual understanding of data science applied to the knowledge domain of Disaster Risk Reduction, exploring the entire process of data treatment, starting from collection, to storage, to exploitation for multiple use cases including improving current risk and vulnerability models.
The availability of an Information System that embeds many of the requirements formulated by stakeholders involved in disaster risk management and in the emergency, recovery and reconstruction phases is certainly fundamental to advance in the desired direction. However, it is not enough. A new system, regardless of how advanced and provably tangible it is at improving the work of damage surveyors in both public and private organizations, will only succeed under certain conditions.
In fact, for overcoming the initial obstacle represented by having to learn a new tool, its advantages must be immediately evident. This requires commitment on the side of public authorities and perhaps more stringent and specific legislation on the matter.
In the many meetings and the two workshops carried out within the LODE project, it became clear that the type and quantity of data required for completing the database within the LODE system is not greatly exceeding what is already achieved in the aftermath of a disaster. However, the real difference is in the way such tasks are accomplished. In one of the first stages of this long-term effort, a new procedure was designed for post-flood damage data collection and management by the Umbria Civil Protection Authority, named Polirisposta that relied on the combined and collaborative effort of a scientific institution willing to work “in the field” and a governmental agency [
49]. An important organizational requirement was to balance between the need to build as much as possible on current practices and the need to innovate and rationalize current procedures that will permit in some years from now to be in a much better situation as far as data availability and quality is concerned.
The rational redesign of the entire procedure must also consider training opportunities for officials at different levels, including municipal, provincial and volunteers. The latter constitutes in Italy a real resource that can be rapidly mobilised in the aftermath of a disaster and that is willing to devote spare time to develop a professional capacity to act in support to the civil protection. Although this model cannot be easily transferred elsewhere, there is the need within each cultural, social and political context to identify potential facilitating factors and stakeholders for the innovation of current processes of damage and loss data collection. This is essential to institutionalise damage data collection and develop sustainable settings to create up-to-date, continuous, credible and publicly available inventories.
A further point that has been also very much debated, especially in the meetings between the LODE project consortium and the DRMKC, relates to the possibility to link the newly developed Information System with others that already exist and are often used at different levels by public administrations for preparedness or risk assessments. In particular, there are several layers stored in regional, national and European portals that can be used by providing exact location of assets, land uses, hazard areas and statistical data at the census level. Whilst technically the connection with other databases and information systems is in principle possible, it is not as straightforward as often imagined. In fact, such interoperability requires that the different agencies, offices in charge of such data, coordinate their efforts and agree to exchange data. Protocols and agreements of data sharing are necessary preliminary steps towards the technical and practical interconnection of databases. It is felt that in order to achieve such a level of interconnection, future piloting projects are required, starting from those countries and regions whose administrations and organisations are already sensitive to the issue and willing to test the added value of such interoperability and sharing.

