Abstract
Urban green infrastructure (UGI) has a key role in improving human and environmental health in cities and contributes to several services related to climate adaptation. Accurate localization and quantification of pervious surfaces and canopy cover are envisaged to implement UGI, address sustainable spatial planning, and include adaptation and mitigation strategies in urban planning practices. This study aims to propose a simple and replicable process to map pervious surfaces and canopy cover and to investigate the reliability and the potential planning uses of UGI maps. The proposed method combines the normalized difference vegetation index (NDVI), extracted from high-resolution airborne imagery (0.20 m), with digital elevation models to map pervious surfaces and canopy cover. The approach is tested in the Municipality of Trento, Italy, and, according to a random sampling validation, has an accuracy exceeding 80%. The paper provides a detailed map of green spaces in the urban areas, describing quantity and distribution, and proposes a synthesis map expressed as a block-level degree of pervious surfaces and canopy cover to drive urban transformations. The proposed approach constitutes a useful tool to geovisualize critical areas and to compare levels of pervious surfaces and canopy cover in the municipal area. Acknowledging the role of green areas in the urban environment, the paper examines the potential applications of the maps in the policy cycle, such as land use management and monitoring, and in climate-related practices, and discusses their integration into the current planning tools to shift towards performative rather than prescriptive planning.
1. Introduction
Rapid urbanization has impacted urban ecosystems with environmental degradation and the loss of life quality, and has exacerbated the effects of climate change in the urban environment. The United Nations [1] estimates that 68% of the world’s population will be living in urban areas by 2050, with all the land-use and land cover challenges such a change entails. Moreover, urban growth may influence an increase in barren and impervious built-up surfaces [2], eventually affecting stormwater management and temperature increase. In this context, green areas play an essential role in contributing to the health and wellbeing of inhabitants [3] and urban ecosystems [4] in cities. Hence, urban green infrastructure (UGI), conceived as an infrastructure of green spaces and built systems, provides several ecosystem services, ranging from physical to social, which are relevant at the city, neighborhood, and block level. Green spaces offer benefits in climate change mitigation and adaptation due to their carbon storage function, thermal comfort, reduced energy use, stormwater regulation, and drought management [4]. In particular, urban tree canopy cover and permeability influence UGI’s positive effects by providing shade and evapotranspiration, thus regulating temperatures and reducing runoff [4].
A UGI assessment is the basis for moving towards a more sustainable urbanism, integrating societal challenges into planning practices. Alternatives to shift from the common prescriptive approaches based on traditional zoning towards more flexible and effective urban development have been emerging with, for example, performance-based planning [5,6]. The optimization of urban adaptive capacity using quality indicators and standards can support planning decisions [5], representing specific urban systems and parameters (e.g., impervious surfaces, climate). Thus, including UGI in urban planning practices and tools becomes crucial in order to consider its spatial implementation and performance.
An approach towards the conservation and enhancement of green areas in the urban environment is foreseen to preserve livability, public health, and climate resilience. It can be achieved through better knowledge, management, and monitoring of green areas. Urban planning policies and strategies based on geospatial data-driven approaches can allow the opportunity to better identify potential gaps in the current urban system and address new project opportunities [7]. These approaches can help provide a better understanding of future needs for infrastructure, amenities, and services and therefore, optimize the allocation of the resources over time. For example, accurate maps assessing urban cover can provide critical information to drive the transformation of human habitat and to improve the quality and health of urban spaces [8]. The definition of a precise spatial distribution of green areas is the baseline to estimate their functions in cities. For example, spatially explicit approaches were used by Yu et al. to investigate ecological conservation in the urban environment [9], by Lin et al. to define the equity of UGI distribution [10], and by Cortinovis and Geneletti to assess the distribution of ecosystem services [6]. Moreover, UGI classification has been used by Zhang and Shao [11] to assess urban vegetation biomass, by Zhong et al. [12] to analyze the effects of urbanization, and by Prohmdirek et al. [13] to compare urban vegetation and urban heat island (UHI) distribution. Measurements of green areas and urban forestry are necessary to estimate their functions, such as cooling capacity, air quality improvement, stormwater management, and their contribution to building energy balance.
Many variables related to UGI can be measured depending on context and purpose [14]. Managing climate change adaptation and ecosystem services related to urban transformations can be informed by pervious surfaces and canopy cover, as they influence the capacity to infiltrate water, to mitigate the UHI effect, and to reduce energy consumptions [4]. Pervious surfaces allow water and air infiltration into the soil, being porous (i.e., capable of infiltrating water) or permeable (i.e., composed of impervious material, alternated by voids allowing infiltration) [15]. The process of urbanization and land take covering natural and semi-natural areas with built-up or paved surfaces is defined as soil sealing. Sealed or impervious surfaces block the infiltration of water leading to loss of natural soil functions (e.g., reduction of runoff, infiltration, evapotranspiration, carbon sequestration, cooling) [16,17]. Canopy cover is an attribute used to measure urban forestry and assess forest structure [18], and it gives information related to the provision of services in the areas of interest, along with facts regarding the percentage, distribution, and location of vegetation.
In this framework, accurate localization and quantification of pervious surfaces and canopy cover in urban areas becomes crucial to implement UGI and address sustainable spatial planning, and to include adaptation and mitigation strategies in current planning practices. Highly precise UGI maps will reduce estimation errors and improve the assessment of ecosystem services, providing valuable information for planning decisions [19]. Many cities base their UGI mapping on field sampling methods that can be labor, time, and cost intensive [20], in addition to being dependent on the accessibility of the areas [21]. Moreover, such mapsets provided by municipalities usually include only public areas, thus resulting in the underestimation of canopy cover and pervious surfaces, since private areas are not considered [22,23,24]. Additionally, updating such maps requires considerable effort. An alternative to assess pervious surfaces is offered by the Copernicus Land Monitoring Service, which detects soil sealing in Europe using remote sensing data obtained through satellite images [7] at a geometric resolution of 10 m pixel. Remote sensing imagery represents an efficient method to improve knowledge of urban cover and to facilitate monitoring over time, especially now that high resolution aerial images are cheaper than in the past [25,26]. Remote sensing has been widely used for discriminating large scale land cover types [27], and its products can be integrated with geographic information systems (GISs) [28,29]. Urban cover classification or urban greening assessment have been mainly tested using satellite data (e.g., Landsat OLI images) [13,30,31], enabling only low resolution classifications.
In urban landscapes, high spatial resolution is crucial to provide accurate urban cover classifications [29,32]. Urban cover assessment using high resolution imagery, in addition to offering a highly detailed map, allows the use of maps to drive urban transformations and to compare future scenarios [33]. Recently, the increasing accessibility of technologies led to a growing number of high spatial resolution (<3 m) experiments in urban contexts [7,29,32]. For example, studies on urban forest canopy managed to identify its extension [34,35] and tree species [21]. UGI assessment and monitoring differs by regional environment, since each contains different structures of vegetation and complex surfaces [36]. Thus, mapping and assessing pervious surfaces and urban greening in urban areas using aerial images can be difficult, due to the variability of buildings and blocks, which consist of a mix between built-up areas, sparse natural spaces, and streets [37]. According to studies in the literature, soil sealing can be investigated with vegetation-based indexes such as the normalized difference vegetation index (NDVI) [38], a pixel-based vegetation index based on spectral signature [39,40], the soil-adjusted vegetation index (SAVI) [41], and the normal difference built-up index (NDBI) [42], or with ecological indexes, such as the biotope area factor (BAF) [7]. Zhong et al. combined NDVI and the land surface water index (LSWI) to identify impervious surfaces [12]. The NDVI may be calculated using relatively old data, such as Landsat images or aerial photographs that include an infrared layer, making it suitable for multitemporal comparisons in different environments [39,43]. Canopy cover is largely assessed using NDVI, but some studies, which may have a broader objective, include alternative methods to acquire UGI. For example, a study assessing urban vegetation biomass classifies urban vegetation through an object-oriented classification method, using remote sensing images and LiDAR data [11]. Object-based image analysis classifies segments of aerial or satellite images based on rules related to color, shape, and texture [35]. Zhong et al. evaluated the effects of urbanization by calculating two greenness-related spectral indexes—NDVI and the Enhanced Vegetation Index (EVI)—from Landsat images [12]. NDVI provides good planimetric measures of canopy cover, but does not include other variables, such as 3D tree canopy structure and volume [19]. Such variables can be determined with field work or with segmentation from LiDAR point clouds, as demonstrated by Hanssen et al. [19]. Aerial LiDAR datasets include three-dimensional point clouds and can be combined with NDVI or object-based analysis [11,34].
Given the role of UGI in the urban environment, innovative planning tools are envisaged to tackle the societal challenges. The present study intends to provide a tool to support city administrations in this effort by defining a simple and replicable method to assess UGI and insights to enhance the role of pervious surfaces and canopy cover in urban planning practices. In this context, the main aim of the study is to test the use of the vegetation-based index NDVI [29] with high resolution images to map pervious surfaces and canopy cover with a simple and replicable method. The specific aims are: (i) to test the reliability and the precision of the method in the municipality of Trento, (ii) to provide a useful tool to visualize permeability and canopy cover and to manage future scenarios, and (iii) to discuss the potential uses of the proposed method and the results of its application in planning practices.
Specifically, Section 2 provides the methodological approach to map pervious surfaces and canopy cover by including areas which are usually excluded, i.e., small plots and private gardens. The assessment of pervious surfaces and canopy cover is presented in Section 3. The discussion of the findings in Section 4 is divided into two parts: an evaluation of the proposed method (Section 4.1), and an examination of the maps’ potential for use in urban planning (Section 4.2).
2. Materials and Methods
2.1. Study Site
This study has been carried out in the Municipality of Trento in northeastern Italy (46°04′ N 11°07′ E) (Figure 1). Trento is an alpine city of approximately 120,000 inhabitants. It comprises a land area of 157.88 km2 in the Brenner corridor, connecting the Po Valley to Central Europe, surrounded by alpine peaks, ranging from 194 m.a.s.l. to 2175 m.a.s.l. The city extends mainly along the Adige River in the narrow and long valley floor, as well as along the hillsides with a lower density.
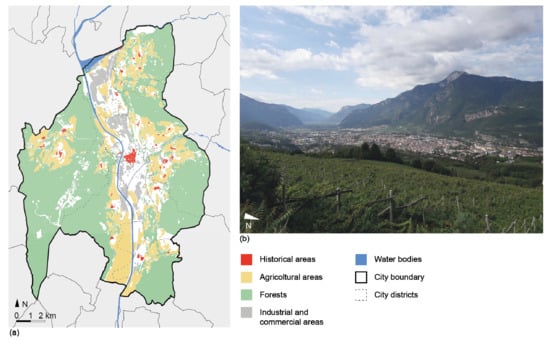
Figure 1.
Study area: Trento, Italy. (a) Map of the main patterns of the city; source of data: Land use Chart and Landscape Chart, available in the open data service of the Municipality of Trento; (b) picture from the hillsides in the eastern part of the city; source: Angelica Pianegonda.
Due to its position, Trento has large ecologically functioning protected areas, eight of which are part of Natura 2000, and four local reserves. A total of 50% of its territory is classified as forest or pastureland [44]. The city has many agricultural areas, mainly vineyards and apple orchards, on the valley floor and on the hillsides, extending for over 20% of the municipal surface. Despite the fact that the high value of agricultural production has guaranteed the protection of these areas, the pressure of urbanization is strong. The remaining 30% of the surface cover is categorized as urban and is mainly characterized by soil sealing, with all the stormwater management challenges and UHI effects it entails [6]. The phenomenon of increasing urbanization and land take has been observed in Trento and its province, leading to the reduction in open spaces. Moreover, according to a recent analysis conducted in Trento, the number of abandoned or underused built areas has been growing [45]. In this framework, planning tools are envisaged to protect not only the rich natural areas of the hillsides, but also the corridors and green spaces in the densely populated areas, especially along the valley floor.
The support for the revision of the Urban Plan of Trento [46,47], started in 2017 and concluded in 2019, and the co-creative approach to build a new vision for the city [48] set out the ecological transition for future developments and highlighted the important role of open spaces. The scientific support given to the municipality provided the opportunity to reflect on the integration of UGI in planning practices. The people from the municipality who got involved, discussed, and recognized the importance of open spaces, pervious areas, and canopy cover for the provision of ecosystem services and urban sustainable development showed interest in the proposed approach. (This was made possible by three events in 2021. Two of these were held on 8 April and on 10 June 2021, and consisted of a roundtable to share initiatives and work together with institutions. The other event, held on 29 April 2021, was an interview with a representative of the urban planning department of the Municipality of Trento to discuss the use of UGI indicators as planning tools.)
2.2. Mapping Urban Greening Using NDVI
NDVI is a remote sensing analytical product used for vegetation assessment calculated through a multispectral sensor with both a visible and a near-infrared band [49]. Currently, it is increasingly used in smart agriculture technologies due to the decreased costs of multispectral sensors. The analysis of vegetation status, stress, and quantification are the most common applications of the NDVI analysis, but other uses are emerging, and the urban greening assessment via remote sensing is a valid example.
According to Huang et al. [49], the NDVI value has been calculated as follows:
where:
NDVI = (NIR − Red)/(NIR + Red),
- NDVI represents the normalized difference vegetation index;
- NIR represents the spectral reflectance recorded in the near-infrared region;
- Red represents the spectral reflectance recorded in the red (visible) region.
NDVI is a dimensionless value, as it is based only on the spectral reflectance measuring the energy flux. The NDVI index ranges from −1 to +1 and, in general, negative values are indicative of water bodies, close to zero values are typical of impervious surfaces (e.g., rocks, concrete surfaces, etc.), and positive values represent vegetated areas. Values close to 1 are usually related to vigorous vegetation.
According to Akbar et al. [50], NDVI values can be classified into six categories, described in Table 1. NDVI values classify the vegetation according to its flourishing, but when such values are combined with other auxiliary maps and data, they can provide other interesting classifications, such as the differentiation of vegetative areas in crops, grasses, shrubs, and forests. NDVI threshold values depend on season, time, and area [51]; therefore, the values need to be corrected and adapted to the study area.

Table 1.
Classification of urban cover according to NDVI values, according to Akbar et al. 2019 [50]. Reproduced with permission from Akbar, Remote Sensing; published by MDPI, 2019.
2.3. Input Data
To estimate pervious surfaces and urban greening, data from high resolution orthophotos were used, combined with vector datasets and digital elevation models (DEMs). The data were obtained from the Environmental and Territorial Information System (Sistema Informativo Ambientale e Territoriale—SIAT), a service of the Autonomous Province of Trento that collects cartographical maps of the territory. The color and infrared (CIR) orthophotos used were published in May 2016. Image acquisition was carried out by flights between 2014 and 2016, under no cloud cover conditions and a solar elevation of at least 30°. The aero-photogrammetry camera used was a Vexcel Imaging GmbH—Ultracam Eagle. The images were uploaded to the SIAT web pages as a non-compressed GeoTIFF file in four bands (RGBIr), including RGB visible spectrum and the near-infrared spectrum, with a geometrical resolution of 0.2 meters and a radiometric resolution of 8 bit/band. The geodetic parameter dataset is the EPSG: 6707.
DEMs were used to assess the height information of the urban tree canopy cover. Specifically, the digital terrain model (DTM) and the digital surface model (DSM), developed in 2014 using LiDAR remote sensing systems, were downloaded from the SIAT with a resolution of 1 m and in the .xyz format.
Table 2 collects the main spatial data used as inputs to map pervious surfaces and canopy cover and provides their uses and sources.
Table 2.
Main input spatial data used and their sources.
2.4. Pervious Surfaces Mapping
The first step in the assessment of pervious surfaces was the definition of the NDVI threshold values to be considered. According to Atasoy, a value below 0.1 generally represents the absence of greening [52]. Based on the study of Akbar et al., values greater than 0.14 indicate pervious surfaces [50]. However, other studies assessing soil sealing (e.g., [29]) take into account values above 0, so as to include bare soils. In this study a visual comparison (Figure 2) of classification results was applied to define the most suitable value of NDVI in the urban environment [32]. According to the visual classification, an NDVI value threshold above 0 contains several impervious surfaces, such as white colored asphalt, while a NDVI value threshold greater than 0.14 excludes dry soil and barely vegetated areas. This analysis identified a threshold of NDVI values above 0.1 as the most accurate.
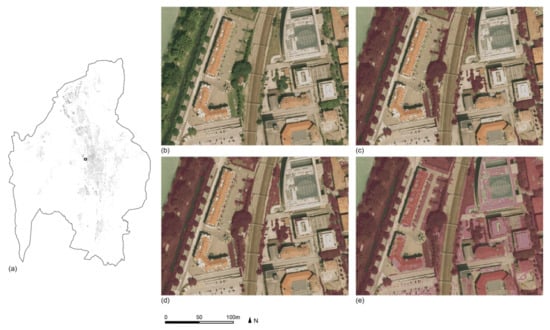
Figure 2.
Municipality of Trento: visual comparison of the accuracy between different thresholds of NDVI to map pervious surfaces. (a) Location of the area in the Municipality of Trento; (b) original three-band image (for source, see Table 1); (c) classification of pervious surfaces with NDVI values above 0.14; (d) classification of pervious surfaces with NDVI values above 0.1; (e) classification of pervious surfaces with NDVI values above 0.
The classification of certain land use categories with relatively low individual accuracies presents a range of unique challenges. On the one hand, bare soil and agricultural land may be confused with impervious surfaces when the surface is dry or barely vegetated. On the other hand, shadows and treetops may hide impervious areas [29], leading to the underestimation of sealed surfaces. From this point of view, there is a trade-off between the need for spatial detail (e.g., small streets) given by the quantitative mapping assessment, and increased specificity of cover classes (e.g., agricultural land or meadows) given by the available green infrastructure map. In the framework of the study, the objective is to test the validity of the mapping method, so auxiliary vector data of agricultural areas (i.e., vineyards, orchards), meadows, and uncultivated land were not superimposed on the classification obtained from NDVI values to provide a more precise result. The pre-processing with auxiliary data has been employed in other studies (e.g., [29,32,53]).
To facilitate the comprehension of the workflow, Figure 3 describes the main steps of the proposed methodology to classify pervious surfaces, conducted with QGIS 3.16.1.
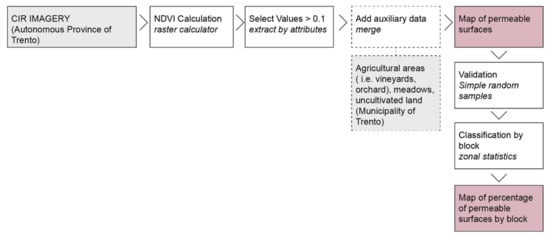
Figure 3.
Workflow to map pervious surfaces, showing input data (grey boxes), main steps (white boxes), outputs (pink boxes), differentiating required steps (solid line) from the optional ones (dashed line).
2.5. Urban Tree Canopy Cover Mapping
In the development of urban tree canopy cover classifications, high-spatial resolution aerial imagery presents several situations of uncertainty due to the shadow effect and similarity in spectral responses between different classes [25]. To improve its accuracy, several methods have been tested based on texture and band ratios [25], random point sampling [54], LiDAR and spectral imagery data [21,54].
The research presented here visually tests and selects NDVI values greater than 0.18, in line with the values indicated in Table 1 [35], and combines them with height data from LiDAR. Specifically, green areas have been classified as low vegetation (0.00–0.40 m), mainly representing pervious surfaces, medium vegetation (0.40–2.00 m), mainly representing bushes and farmlands, and high vegetation (above 2.00 m). To obtain objects’ height information, a canopy height model (CHM) has been assessed by collecting LiDAR data and subtracting the values of DTM from the values of DSM.
The model in Figure 4 contains the steps of the canopy cover classification process and shows required input data and outputs. It was mainly performed using RStudio by developing a script to manage the high number of DTM and DSM tiles (over 700) and to automatize the repetition of actions.
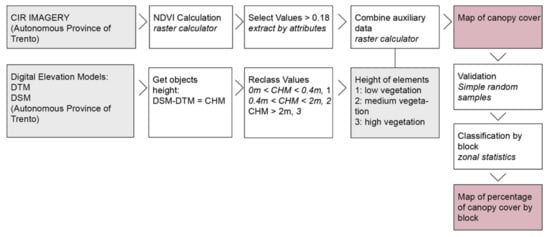
Figure 4.
Workflow for mapping the urban canopy cover, showing input data (grey boxes), steps (white boxes), and outputs (pink boxes).
2.6. Accuracy Assessment
The validation of the proposed processes was determined using an error matrix by comparing classification results with known reference data. To estimate the accuracy with reasonable precision [55], the accuracy assessment was employed using two different methods. To assess the accuracy of the map of pervious surfaces, a simple random sampling of 150 individual pixels (0.2 m) was applied over the whole municipality, and reference points were verified through manual high-resolution aerial image interpretation. In the canopy cover classification, a stratified random sampling was performed at 100 reference points per category over the whole study area. The 400 individual pixels were verified through field visits and image interpretation [25,55,56].
2.7. Mapping the UGI Indicators Using Neighborhood Blocks
Block boundaries for 2018 were retrieved from the CORINE Land Cover data [57]. This grid highlights the percentages of each indicator within the blocks using the zonal statistic function in QGIS 3.16.1. The resulting values were reclassified according to 10 classes to generate a normalized map. This map allows a visual comparison between different areas, and eventually, between different periods of time, and it gives an effective visualization of the distribution of pervious surfaces and canopy cover within the municipal area.
3. Results
3.1. Urban Green Infrastructure Extraction and Validation
3.1.1. Map of Pervious Surfaces
According to the proposed methodology, 79% of the municipal area of Trento is classified as pervious. The distribution of soil sealing is not homogeneous: a mean 88% pervious degree was detected on the hillsides, while the valley floor has a mean pervious degree of 49%.
As Figure 5 shows, the highly urbanized districts present different degrees of soil sealing: the historic center and the commercial areas in the northern part of the city have high rates of impervious surfaces (around 35–45%, respectively), while the residential areas in the southern part of the city are characterized by more green areas. The output data define a precise distribution of pervious surfaces. It identified urban greening (e.g., vegetated courtyards, bushes, flower beds) with a high resolution, which is valuable and appropriate for the neighborhood scale.
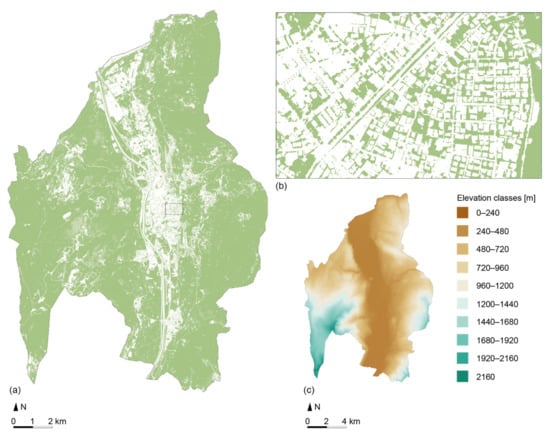
Figure 5.
(a) Soil permeability map of Trento based on the proposed methodology; (b) soil permeability map of Trento in a zoomed area; (c) elevation classes map of Trento.
To validate the results of the method proposed to map pervious surfaces, a simple visual random sampling was conducted. Table 3 highlights the elaborated classification validation results, and it includes omission and commission errors. The classification of the entire city produced an overall accuracy of 91.33%.
Table 3.
Error matrix of pervious surfaces.
3.1.2. Map of Canopy Cover
According to the proposed methodology, 42.4% of the municipal areas of Trento are covered by high vegetation. As is the case with pervious surfaces, the distribution of high vegetation is mainly concentrated on the hillsides. The urban tree canopy cover map (Figure 6) shows that on the valley floor, vegetation has a distributed pattern mainly along the streets. In the urban core, the industrial areas in the northern part of the city are characterized by the absence of vegetation, while in the southern part of the city, single trees are distributed in private gardens.
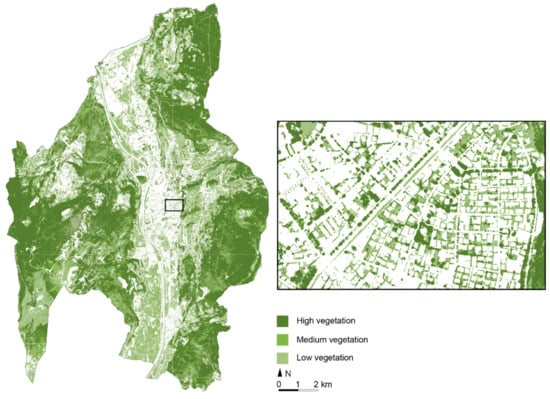
Figure 6.
Trento canopy map based on the proposed methodology.
Table 4 shows the results of the canopy cover accuracy assessment obtained with a stratified random sampling. The overall accuracy exceeds 80% for the four classes. The method tested provides very accurate results for high vegetation, which, given the dimensions, is properly modelled through the digital elevation model. Confusion occurs between low vegetation and medium vegetation in the agricultural fields, or between medium vegetation and high vegetation in the forests, due to the resolution of the LiDAR. Improvements are possible to increase the accuracy for determining low vegetation and medium vegetation linked to the resolution of LiDAR. However, much higher accuracy values would be achieved by using a larger sample area (e.g., 1 m2, corresponding to the resolution of LiDAR), since the inaccuracies are usually due to offsets of a few centimeters and not to the detection of completely different cover classes.
Table 4.
Error matrix of canopy cover.
3.2. Synthesis Map by Land Cover Units
A synthesis map by land cover units is provided to assess pervious surfaces and canopy cover. The percentage of permeability (Figure 7) and high vegetation (above 2 m) of each polygon was calculated. The synthesis map shows the normalized average pervious surface degree and enables the detection of urban blocks with high ratios of soil sealing, which are leading issues for stormwater management and cooling. The map allows a visual comparison between different areas and, by highlighting urban patterns, constitutes the baseline to set future requirements driving urban transformations.
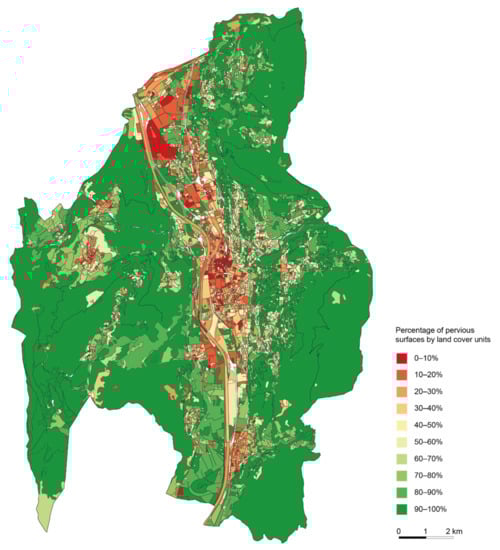
Figure 7.
Synthesis map by land cover units of the current status of pervious surfaces in Trento.
4. Discussion
4.1. Strengths and Limitations of the Proposed Approach
This study proposes a simple, accurate, precise, and effective method to assess and monitor pervious surfaces and urban vegetation, using high-resolution color and infrared aerial images and DEMs. Testing the mapping methodology in the city of Trento revealed some strengths and limitations of the proposed approach.
4.1.1. Mapping Process
Compared to other methodologies [11], the proposed workflow is less complex and requires a lower amount of information to be processed. The developed approach to classify pervious surfaces and canopy cover requires orthophoto, with color and infrared information and DEMs. The method is based on few and simple steps, facilitating easy replication, especially for non-experts. Therefore, it constitutes an alternative to the recent studies extracting pervious surfaces and UGI in urban contexts, and it could easily be used by city administrators. For example, object-oriented classifications rely on multiple datasets and require the extraction skills of multi-scale segmentation algorithm features [11,58]. Moreover, pervious surfaces have been assessed with hierarchical spectral mixture analysis [59], or by linear spectral mixture models [60], which both require advanced remote sensing skills.
4.1.2. Accuracy of the Results
Generally, publicly available satellite data (e.g., Landsat) provide low or moderate resolution, for instance 30 m, allowing good representations at the regional scale. According to Wellmann et al., Landsat-related sensors (e.g., OLI, TM) are still the most widely used [61]. However, NDVI analysis has been increasingly applied at the urban scale to identify small green areas (1–2 m), as high-resolution color-infrared aerial images become more easily accessible. In the case of Trento, due to the high resolution of the publicly available data (0.20 m/pixel), it has been possible to develop a very precise map of pervious surfaces and a classification of green areas according to vegetation height.
Using NDVI to assess and map pervious surfaces and canopy cover appears to be a reliable and useful method for planning practices, yielding levels of accuracy above 90% for the classification of pervious surfaces and above 80% for the classification of urban greening. The accuracy of the resultant maps was assessed using the high-resolution aerial images and through field measurements. The high accuracy of the input maps allows the identification of footpaths, hedges, and small green patches, providing valuable results from the urban to the neighborhood scale (Figure 8). In the residential areas of Trento, green infrastructure is a patchwork of urban parks and many private gardens, edible gardens, and inner courtyards, contributing to the local supply of ecosystem services. The map obtained with the proposed method (Figure 8b) portrays such small elements, thus constituting an upgrade of the map provided by the municipality (Figure 8d). Moreover, the tree canopy assessment provided by the Municipality of Trento does not include information on private properties, thus underestimating the presence of trees. Hence, the maps can provide appropriate information to decision makers, planners, and designers to improve understanding and management of urban cover at the local scale. The visual comparison provided in Figure 8 highlights the above-mentioned advantages: precision, high level of detail of the classification, and improvement of the classification provided by the municipality. Moreover, the proposed method has the potential to estimate the height of the trees. However, for more detailed analysis, LiDAR-based tree canopy segmentation analysis may be useful to measure parameters such as volume and biomass, and to make an inventory of the trees [19].
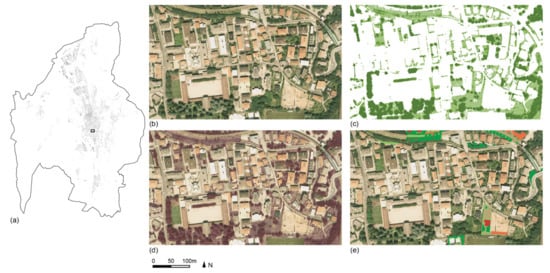
Figure 8.
City of Trento: examples of visual comparisons between the accuracy of vegetation classification. (a) Location of the area in the Municipality of Trento; (b) original three-band image (for source, see Table 1); (c) classification of vegetation with NDVI values above 0.18; (d) classification from NDVI on aerial image; (e) classification using vector dataset from the municipality.
However, the approach used for mapping surface cover has certain limitations leading to the underestimation or overestimation of the classification. The most problematic areas leading to underestimations in the assessment of pervious surfaces are agricultural lands. Indeed, when assessing these, the bare soil in between rows of trees is not detected as pervious. Moreover, surfaces with dry vegetation or barren land are rarely classified as pervious. This fact is not unexpected, since the NDVI analysis is based on the detection of the level of the flourishing vegetation, and it can be solved by superimposing vector datasets. Statistical aggregation of existing datasets improves the accuracy and balances omission errors with commission errors, but may cause flaws in the visualization. Combining other indexes with NDVI (such as LSWI), which reflects the surface moisture, might improve the results of the classification, as in the work of Zhong et al. [12].
Underestimations in the classification of the urban tree canopy cover are often related to the precision of the DEM. Confusion occurred between vineyards and bare soil in between the crops or between isolated and small bushes in meadows. Moreover, on the hillsides, the accuracy of DEM underestimates the height of some trees.
The most challenging situations in terms of overestimations are due to tree cover that may hide impervious surfaces. However, the surface extent of these situations is relatively low. Agricultural areas, especially those with apple trees, may cause overestimations due to the accuracy of DEMs that do not identify the bare soil in between tree lines.
Some of the issues can be solved by implementing further indices, such as the SAVI as proposed by [62], or enhancements, such as texture, to the classification. Moreover, improvements are possible in the level of the classification by providing, for example, different degrees of permeability and urban cover types.
Moreover, more coordinated and regular LiDAR campaigns and the acquisition of high-resolution color and infrared aerial imagery are recommended to improve accuracy and potential uses.
4.1.3. Potential Usages and Further Studies
The study provided a useful tool to visualize pervious surfaces and canopy cover in Trento and to manage future scenarios, as it produced detailed classifications and a synthesis map of pervious surfaces by land cover units. A further analysis that could be a major tool to visualize and drive urban transformations is the forest canopy density (FCD) method, representing the proportion of an area covered by the crowns of the trees and expressed as a percentage of the total area [63]. The important role that water surfaces play in the health of citizens and ecosystem services related to climate adaptation [64] is also worth noting. The use of indexes, such as the normalized difference water index (NDWI) [65] or the water ratio index (WRI) [66], can also constitute a useful resource for obtaining a complete view of the natural elements in the urban context. Given the geographical characteristics of the study area and the availability of vector datasets, an index-based map of water surfaces is not relevant. However, depending on the context, NDWI or WRI might be useful to assess water surfaces and wetlands.
Notwithstanding some inaccuracies in the evaluation of pervious surfaces and canopy cover for urban areas, the results are promising and constitute a valuable opportunity to improve the knowledge and management of urban greening in planning practices. Hence, an overall accuracy greater than 80% is sufficient to understand the geography of urban elements. The proposed methodology is applicable and transferable to other contexts, and the description of the application in Trento can be a support for the application in other contexts, where the thresholds of the NDVI value might be different. Moreover, the proposed approach has been developed to be automatic and easily replicable in other contexts where high-quality aerial imagery is available. Elements that are normally mapped manually can now be automatically mapped, thus allowing for considerable time savings and ease of updating.
4.2. Supporting Urban Planning
Urban green infrastructure contributes to make cities more livable, sustainable, and climate resilient. However, owing to institutional barriers, lack of collaboration, and lack of suitable supporting tools for planners, its implementation in planning processes is still slow [67]. Due to multifunctionality, UGI planning is a strategic approach capable of contributing to several policy objectives related to green space management, ranging from climate change adaptation to biodiversity conservation [68]. Green space implementation depends on the priorities and trade-offs established in the planning practice. To strengthen its role in the urban environment, its potentialities should be considered to simultaneously deliver several ecosystem services. Many studies provided methods to estimate the supply and demand of ecosystem services (e.g., [69,70]) and defined required performances to transform areas. In this view, an accurate assessment of pervious surfaces and vegetation, capable of mapping both public and private small-green areas, constitutes a tool to properly estimate UGI functions, such as microclimate regulation and runoff reduction.
Since green spaces in the urban environment, such as parks, gardens, street trees, green roofs, and facades, are managed by humans and are integrated with grey infrastructures, neighborhood- and block-level transformations are needed to maximize their potential. To drive urban transformations by including UGI management and climate policies, a first step can be the introduction of quality indicators (e.g., minimum degree of permeability) in the current planning practices. Moreover, the specific requirements of the indicators can be set according to the location, type, and entity of the transformation to contribute to the supply of ecosystem services for the surrounding areas. This study proposes a map by block to be used as a synthesis map to assess the current status of UGI indicators and to set required performances in the processes of urban transformation.
4.2.1. Potential Usages in Urban Planning
The use of geographic information tools and spatial analysis in planning practices can help to connect different disciplines and requirements and can support the management and monitoring of land use changes. The assessment of pervious surfaces and tree canopy cover is examined to provide a baseline for the management and governance of green infrastructure and for the integration of climate adaptation policies in urban planning, supporting the setting of realistic and measurable goals for the greenification of urban areas. Moreover, the high-resolution imagery enables a multi-level approach and a detailed quantification at the block scale, allowing for the definition of design tools and place-specific regulations to implement or protect UGI. Hence, these maps can be an aid to solve land-use conflicts and to facilitate decision-making processes [71].
The revision of the Urban Plan of Trento, which started in 2017 and ended in 2019 [46], provided the opportunity to reflect on how to integrate climate adaptation knowledge in planning practices. According to the strategic document approved by the municipality, nature-based solutions are envisioned towards urban transformation. In this view, the provided pervious surfaces and urban tree canopy cover maps have several potential uses, including the creation of a knowledge base, planning policies, and monitoring systems.
The maps contributed to the formation of a knowledge base. The high spatial resolution of soil sealing and vegetation distribution improved the existing estimation of Trento’s UGI, creating the baseline to determine the distribution of functions such as microclimate regulation [70] and run-off mitigation [72]. Moreover, by outlining the extension, the distribution of vegetation, and its functions, it is possible to determine planning actions aimed at defining areas to further develop UGI, or to preserve it [61]. For example, the relationship between the structure of UGI and the built components could be examined to determine practices or modifications to improve UGI functions [73] in design and urban planning practices. In this framework, urban designers should include tools aimed at improving existing functions (e.g., green roofs, bioswales, rain gardens) as a starting point to alter the urban mosaic [73].
The maps constitute a tool to drive planning policies. Specifically, an attempt to support urban planning is made by providing the by block pervious surfaces map. The map of the by block green indicator is meant as an instrument to define performance zoning and performance regulations (e.g., indexes) [74] allowing for the flexibility of uses and design tools [5] evaluated on the expected impacts of the proposed interventions [75]. In this framework, the geovisualization by block facilitates a detailed knowledge and monitoring of land use changes, driving future scenarios and fixing parameters to measure the impacts of projects.
Pervious surfaces and the presence of vegetation are two properties necessary to evaluate the cooling capacity of green infrastructures and run-off mitigation, indicators that should be included for climate adaptation in spatial planning [6]. According to Zardo et al., an assessment of sealed soil, bare soil, water, and grass is required to estimate the microclimate regulation of UGI [70]. Similarly, due to the vegetation’s interception capacity, permeable surfaces are used to determine runoff mitigation.
As with formation of knowledge base, pervious surfaces and canopy cover maps constitute efficient instruments for monitoring the development and the changes of UGI and its functions over time. The proposed method is semi-automated and simple; therefore, remote sensing is valuable in tracking changes and driving flexible policies [61].
4.2.2. Integration in the Current Planning Tools
Knowledge from different fields, such as ecology, planning, urban forestry, and climate-related studies, is contributing to ecologically-oriented and climate-related urban planning. However, efforts are needed to convert this knowledge into guidance [76] and to integrate the disciplines to make them policy relevant [61]. This study provides the baseline and intends to further develop a tool to guide urban transformations by proposing the introduction of specific requirements into the planning processes (e.g., building code) based on the level of permeability and canopy cover by block. This paper suggests possible ways in which scientific knowledge on UGI could contribute to support decision making and drive urban transformations. However, urban planning tools should be innovated to introduce the knowledge related to pervious surfaces and canopy cover related to ecosystem services and climate adaptation. As a matter of fact, innovative and adaptive approaches often remain at a conceptual level [6] due to difficulties in effectively implement them in the planning tools. For example, performance-based planning might be a promising alternative to traditional zoning [77], but it requires training for the administration staff. To support the transition towards innovative and adaptive planning tools, the proposed maps can contribute to create awareness and support specific decisions, such as prioritizing solutions or selecting scenarios [78]. In this context, they might constitute a support in the negotiation processes between public administration and private developers, since private areas are also acknowledged as contributors to climate adaptation and the supply of ecosystem services. For example, the synthesis map by land cover units could help decision makers to discuss the requirements of the areas during the negotiation process or to relocate the compensation of specific interventions.
Green spaces and pervious surfaces are often included in traditional urban plans. However, they are considered as a quantitative measure instead of as a performative one, due to the inability to differentiate qualities of green [77] and ecological benefits. In the last few years, some cities have developed more advanced tools, attempting to go beyond the common quantitative indicators and to extend the value of green areas [6]. An example is provided by the introduction of the BAF, developed by the city of Berlin in the late 1980s, which drives new construction and redevelopment by measuring the ecological value of surfaces in each parcel. Compared to the common standard of green areas, this tool is an advancement, but it is limited to considering the supply of ecosystem services. A different approach is the one developed by the Municipality of Bologna, which introduces several indicators to integrate climate adaptation strategies into the General Urban Plan. Specifically, the rules to implement the plan (disciplina del piano) introduce the reduction of impervious surfaces and the prioritization of sustainable urban drainage solutions to reduce runoff. Moreover, the building code (regolamento edilizio) sets some indexes, such as the microclimatic wellbeing index (indice di benessere microclimatico), acknowledging the capacity of vegetation to regulate the microclimate. In this view, the maps of pervious surfaces and canopy cover constitute a tool to support subordinated planning tools (strumenti di pianificazione subordinata) and strategic planning tools (strumenti di pianificazione strategica), promoting the transition towards urban transformations based on performance and not on quantitative indicators.
In the case of Trento, the proposed maps can contribute to managing the benefits of green areas in a balanced, accessible, and more distributed way. For example, they can support the introduction of climate adaptation-related indexes in the General Regulatory Plan (Piano Regolatore Generale), the location and relocation of the supply of ecosystem services and demand in the Landscape Chart (Carta del Paesaggio), and the specific requirements for streets and parking lots in the Mobility Urban Plan. Moreover, the high resolution of the maps raises the awareness and the importance of the functions of tree canopy and pervious surfaces in the urban environment. They can drive transformations by defining locally specific requirements and, as a monitoring tool, they may be useful to support the inventorying of trees, to be verified by ground-truthing, and the monitoring of land take. In this view, the scientific support given to the Municipality of Trento increased the awareness about societal challenges in cities and about the need to shift towards more adaptive and performative planning tools. The discussion explored the potential changes and integrations in planning tools, and defined the baseline for the future policy interventions.
5. Conclusions
As UGI benefits are revealed, it becomes increasingly important for urban planners and decision makers to acquire methods for the accurate mapping of green areas and their potentialities to facilitate UGI and climate adaptation implementation in city planning. In this paper, a vegetation assessment of Trento was undertaken to provide useful information for implementing ecological knowledge in urban planning and to deal with urban climate adaptation and mitigation. Two different indicators of UGI are assessed by combining color-infrared aerial images with vector datasets and DEMs, i.e., pervious surfaces and tree canopy cover. To date, the proposed method enables the most accurate, comprehensive, and detailed pervious surfaces and canopy cover maps available of Trento, providing an understanding of the quantity, distribution, and configuration of the UGI. The resulting maps enhance the understanding of urban cover, as well as the spatial distribution of functions across the city of Trento. The developed maps constitute the baseline for future analysis in the area, for example, the comparison of time periods, which can highlight the impacts of urbanization, and statistical analyses (e.g., land use distribution, property of the green spaces, accessibility), which can assess the effects of planning decisions and drive future transformations. Moreover, as it is a simple and semi-automated process, it is easy to replicate and to monitor the trend of the indicators, and it provides the baseline for green infrastructure management and planning. The findings of our study do not preclude the use of field sampling methods to map the spatial distribution of UGI, or its combination with alternative methodologies to assess UGI in more detail, but instead focus on the provision of a simple and replicable approach that could be used by city administrators.
The changing demands for more flexible and multifunctional planning, as well as new expectations for urban spatial data, are facilitated by rapidly replicable and more accurate methods. Several efforts have recently been made to introduce ecological knowledge and climate strategies into urban planning. In this study, we attempts to provide a baseline to integrate climate adaptation policies related to the development of pervious surfaces and the presence of vegetation in the current planning practices of Trento. The application revealed strengths and limitations of the proposed methodology and the potentials for its adoption as a planning tool. The proposed approach intends to provide knowledge as a more detailed and accurate base to determine UGI functions and to define a tool to drive urban transformations. In this context, a classification of pervious surfaces and vegetation by blocks can be used as a planning tool to set requirements and improvements for specific quality indicators (e.g., minimum permeability) according to location. To improve climate resilience in terms of cooling and run-off reduction, synthesis maps of pervious surfaces and canopy cover are provided to provide a basis for a critical review to integrate climate policies into urban planning practices.
Author Contributions
Conceptualization, A.C. and A.P.; methodology, A.C., A.P., and M.C.; software, A.C. and A.P.; validation, A.C., A.P., and M.C.; investigation, A.C., A.P., and M.C.; resources, A.C. and A.P.; data curation, A.C. and A.P.; writing—original draft preparation, A.C. and A.P.; writing—review and editing, A.C., A.P., M.C., S.F., and R.A.; visualization, A.C.; supervision, M.C., S.F., and R.A.; project administration, M.C., S.F., and R.A.; funding acquisition, M.C., S.F., and R.A. All authors have read and agreed to the published version of the manuscript.
Funding
This project has received funding from the European Union’s Horizon 2020 Research and Innovation Programme under the Marie Skłodowska-Curie grant, agreement No. 778039 (Project: “Planning and Engagement Arenas for Renewable Energy Landscapes”—PEARLS), from the Municipality of Trento and the University of Trento within the UniCittà memorandum of understanding (Project: “Trento Urban Transformation”—TUT), and from EIT Climate-KIC under the Climate Innovation Ecosystems 2/2018 grant agreement (Project: “System and Sustainable Approach to Virtuous Interaction of Urban and Rural Landscapes”—SATURN).
Data Availability Statement
The data presented in this study are available on request from the corresponding author.
Acknowledgments
The research received support from the “Trento Urban Transformation” project (founded by the Municipality of Trento and the University of Trento within the UniCittà memorandum of understanding), PEARLS (project received funding from the European Union’s Horizon 2020 Research and Innovation Programme under the Marie Skłodowska-Curie grant, agreement No. 778039), and SATURN EIT Climate-KIC (Orchestrated Innovation Ecosystem Project, co-funded by EIT Climate-KIC). We would like to thank the Municipality of Trento for providing some of the baseline GIS layers and for giving their support to further develop the study and for proposing its implementation as a specific urban planning tool. The authors acknowledge the services which provided source data: 1. Environmental and Territorial Information System (Sistema informativo ambientale e territoriale—SIAT) https://siat.provincia.tn.it/geonetwork/srv/ita/catalog.search#/home (accessed on 25 January 2021). 2. European Union, Copernicus Land Monitoring Service https://land.copernicus.eu/pan-european/corine-land-cover (accessed on 25 January 2022).
Conflicts of Interest
The authors declare no conflict of interest.
References
- United Nations, Department of Economic and Social Affairs, Population Division. World Urbanization Prospects: The 2018 Revision; United Nations: New York, NY, USA, 2019.
- Padmanaban, R.; Bhowmik, A.K.; Cabral, P. Satellite image fusion to detect changing surface permeability and emerging urban heat islands in a fast-growing city. PLoS ONE 2019, 14, e0208949. [Google Scholar] [CrossRef] [PubMed]
- de Vries, S.; Snep, R. Biodiversity in the Context of ‘Biodiversity–Mental Health’ Research. In Biodiversity and Health in the Face of Climate Change; Marselle, M.R., Stadler, J., Korn, H., Irvine, K.N., Bonn, A., Eds.; Springer International Publishing: Cham, Germany, 2019; pp. 159–173. ISBN 978-3-030-02318-8. [Google Scholar]
- Demuzere, M.; Orru, K.; Heidrich, O.; Olazabal, E.; Geneletti, D.; Orru, H.; Bhave, A.G.; Mittal, N.; Feliu, E.; Faehnle, M. Mitigating and adapting to climate change: Multi-functional and multi-scale assessment of green urban infrastructure. J. Environ. Manag. 2014, 146, 107–115. [Google Scholar] [CrossRef] [PubMed]
- Pelorosso, R. Modeling and urban planning: A systematic review of performance-based approaches. Sustain. Cities Soc. 2019, 52, 101867. [Google Scholar] [CrossRef]
- Cortinovis, C.; Geneletti, D. A performance-based planning approach integrating supply and demand of urban ecosystem services. Landsc. Urban Plan. 2020, 201, 103842. [Google Scholar] [CrossRef]
- Peroni, F.; Pristeri, G.; Codato, D.; Pappalardo, S.E.; De Marchi, M. Biotope Area Factor: An Ecological Urban Index to Geovisualize Soil Sealing in Padua, Italy. Sustainability 2019, 12, 150. [Google Scholar] [CrossRef] [Green Version]
- La Rosa, D.; Wiesmann, D. Land cover and impervious surface extraction using parametric and non-parametric algorithms from the open-source software R: An application to sustainable urban planning in Sicily. GIScience Remote Sens. 2013, 50, 231–250. [Google Scholar] [CrossRef]
- Yu, D.; Xun, B.; Shi, P.; Shao, H.; Liu, Y. Ecological restoration planning based on connectivity in an urban area. Ecol. Eng. 2012, 46, 24–33. [Google Scholar] [CrossRef]
- Lin, B.; Meyers, J.; Barnett, G. Understanding the potential loss and inequities of green space distribution with urban densification. Urban For. Urban Green. 2015, 14, 952–958. [Google Scholar] [CrossRef]
- Zhang, Y.; Shao, Z. Assessing of Urban Vegetation Biomass in Combination with LiDAR and High-resolution Remote Sensing Images. Int. J. Remote Sens. 2020, 42, 964–985. [Google Scholar] [CrossRef]
- Zhong, Q.; Ma, J.; Zhao, B.; Wang, X.; Zong, J.; Xiao, X. Assessing spatial-temporal dynamics of urban expansion, vegetation greenness and photosynthesis in megacity Shanghai, China during 2000–2016. Remote Sens. Environ. 2019, 233, 111374. [Google Scholar] [CrossRef]
- Prohmdirek, T.; Chunpang, P.; Laosuwan, T. The relationship between normalized difference vegetation index and canopy temperature that affects the urban heat island phenomenon. Geomatics Appl. Geogr. 2020, 15, 222–234. [Google Scholar] [CrossRef]
- Morgenroth, J.; Östberg, J. Measuring and Monitoring Urban Trees and Urban Forests. In Routledge Handbook of Urban Forestry, 1st ed.; Ferrini, F., Konijnendijk van den Bosch, C.C., Fini, A., Eds.; Routledge: London, UK, 2017; pp. 33–48. ISBN 9781315627106. [Google Scholar]
- Woods Ballard, B.; Wilson, B.; Udale-Clarke, H.; Illman, S.; Scott, T.; Ashley, R.; Kellagher, R. The SuDS Manual (C753); CIRIA: London, UK, 2015. [Google Scholar]
- European Commission. Guidelines on Best Practice to Limit, Mitigate or Compensate Soil Sealing; Publications Office of the European Union: Luxembourg, 2012; Available online: https://ec.europa.eu/environment/soil/pdf/guidelines/pub/soil_en.pdf (accessed on 19 February 2022).
- Jim, C.Y. Constraints to Urban Trees and Their Remedies in the Built Environment. In Routledge Handbook of Urban Forestry, 1st ed.; Ferrini, F., Konijnendijk van den Bosch, C.C., Fini, A., Eds.; Routledge: London, UK, 2017; pp. 273–290. ISBN 9781315627106. [Google Scholar]
- Nowak, D.J. Assessing the Benefits and Economic Values of Trees. In Routledge Handbook of Urban Forestry, 1st ed.; Ferrini, F., van den Bosch, C.C.K., Fini, A., Eds.; Routledge: London, UK, 2017; pp. 152–163. ISBN 9781315627106. [Google Scholar]
- Hanssen, F.; Barton, D.N.; Nowell, M.; Cimburova, Z. Mapping Urban Tree Canopy Cover Using Airborne Laser Scanning-Applications to Urban Ecosystem Accounting for Oslo; NINA Report 1677; Norwegian Institute for Nature Research: Oslo, Norway, 2019. [Google Scholar]
- Nowak, D.J.; Walton, J.T.; Stevens, J.C.; Crane, D.E.; Hoehn, R.E. Effect of Plot and Sample Size on Timing and Precision of Urban Forest Assessments Methods Effect of Plot Size on Data Collection Time and Total Population Estimate Precision. Arboric. Urban For. 2008, 34, 386–390. [Google Scholar] [CrossRef]
- Alonzo, M.; McFadden, J.P.; Nowak, D.J.; Roberts, D.A. Mapping urban forest structure and function using hyperspectral imagery and lidar data. Urban For. Urban Green. 2016, 17, 135–147. [Google Scholar] [CrossRef] [Green Version]
- Mathieu, R.; Freeman, C.; Aryal, J. Mapping private gardens in urban areas using object-oriented techniques and very high-resolution satellite imagery. Landsc. Urban Plan. 2007, 81, 179–192. [Google Scholar] [CrossRef]
- Östberg, J.; Wiström, B.; Randrup, T.B. The state and use of municipal tree inventories in Swedish municipalities—Results from a national survey. Urban Ecosyst. 2018, 21, 467–477. [Google Scholar] [CrossRef] [Green Version]
- Klobucar, B.; Sang, N.; Randrup, T.B. Comparing Ground and Remotely Sensed Measurements of Urban Tree Canopy in Private Residential Property. Trees For. People 2021, 5, 100114. [Google Scholar] [CrossRef]
- Myeong, S.; Nowak, D.J.; Hopkins, P.F.; Brock, R.H. Urban cover mapping using digital, high-spatial resolution aerial imagery. Urban Ecosyst. 2001, 5, 243–256. [Google Scholar] [CrossRef]
- Galle, N.J.; Nitoslawski, S.A.; Pilla, F. The Internet of Nature: How taking nature online can shape urban ecosystems. Anthr. Rev. 2019, 6, 279–287. [Google Scholar] [CrossRef]
- Feng, Q.; Liu, J.; Gong, J. UAV Remote Sensing for Urban Vegetation Mapping Using Random Forest and Texture Analysis. Remote Sens. 2015, 7, 1074–1094. [Google Scholar] [CrossRef] [Green Version]
- Zhang, H.; Lin, H.; Li, Y.; Zhang, Y.; Fang, C. Mapping urban impervious surface with dual-polarimetric SAR data: An improved method. Landsc. Urban Plan. 2016, 151, 55–63. [Google Scholar] [CrossRef]
- Schmidt, S.; Barron, C. Mapping Impervious Surfaces Precisely—A GIS-Based Methodology Combining Vector Data and High-Resolution Airborne Imagery. J. Geovis. Spat. Anal. 2020, 4, 14. [Google Scholar] [CrossRef]
- Pereira, L.E.; de Oliveira, E.F.; da Rosa Oliveira, M.; Amorim, G.M.; Grigio, A.M.; Filho, A.C.P. Methods to model impermeable URBAN areas using soil moisture characteristics. J. Flood Risk Manag. 2018, 12, e12480. [Google Scholar] [CrossRef]
- Rujoiu-Mare, M.-R.; Mihai, B.-A. Mapping Land Cover Using Remote Sensing Data and GIS Techniques: A Case Study of Prahova Subcarpathians. Procedia Environ. Sci. 2016, 32, 244–255. [Google Scholar] [CrossRef] [Green Version]
- Pristeri, G.; Peroni, F.; Pappalardo, S.; Codato, D.; Masi, A.; De Marchi, M. Whose Urban Green? Mapping and Classifying Public and Private Green Spaces in Padua for Spatial Planning Policies. ISPRS Int. J. Geo-Inform. 2021, 10, 538. [Google Scholar] [CrossRef]
- Pristeri, G.; Peroni, F.; Pappalardo, S.E.; Codato, D.; Castaldo, A.G.; Masi, A.; De Marchi, M. Mapping and Assessing Soil Sealing in Padua Municipality through Biotope Area Factor Index. Sustainability 2020, 12, 5167. [Google Scholar] [CrossRef]
- MacFaden, S.W.; O’Neil-Dunne, J.P.; Royar, A.R.; Lu, J.W.; Rundle, A. High-resolution tree canopy mapping for New York City using LIDAR and object-based image analysis. J. Appl. Remote Sens. 2012, 6, 063567. [Google Scholar] [CrossRef]
- Richardson, J.J.; Moskal, L.M. Uncertainty in urban forest canopy assessment: Lessons from Seattle, WA, USA. Urban For. Urban Green. 2014, 13, 152–157. [Google Scholar] [CrossRef]
- Shao, Z.; Ding, L.; Li, D.; Altan, O.; Huq, E.; Li, C. Exploring the Relationship between Urbanization and Ecological Environment Using Remote Sensing Images and Statistical Data: A Case Study in the Yangtze River Delta, China. Sustainability 2020, 12, 5620. [Google Scholar] [CrossRef]
- García, P.; Pérez, E. Mapping of soil sealing by vegetation indexes and built-up index: A case study in Madrid (Spain). Geoderma 2016, 268, 100–107. [Google Scholar] [CrossRef]
- Kriegler, F.J.; Malila, W.A.; Nalepka, R.F.; Richardson, W. Preprocessing Transformations and Their Effects on Multispectral Recognition. In Proceedings of the Sixth International Symposium on Remote Sensing of Environment, Ann Arbor, MI, USA, 13–16 October 1969; pp. 97–131. [Google Scholar]
- Spadoni, G.L.; Cavalli, A.; Congedo, L.; Munafò, M. Analysis of Normalized Difference Vegetation Index (NDVI) multi-temporal series for the production of forest cartography. Remote Sens. Appl. Soc. Environ. 2020, 20, 100419. [Google Scholar] [CrossRef]
- Cavada, N.; Ciolli, M.; Rocchini, D.; Barelli, C.; Marshall, A.R.; Rovero, F. Integrating field and satellite data for spatially explicit inference on the density of threatened arboreal primates. Ecol. Appl. 2017, 27, 235–243. [Google Scholar] [CrossRef] [PubMed] [Green Version]
- Huete, A.R. A soil-adjusted vegetation index (SAVI). Remote Sens. Environ. 1988, 25, 295–309. [Google Scholar] [CrossRef]
- Zha, Y.; Gao, J.; Ni, S. Use of normalized difference built-up index in automatically mapping urban areas from TM imagery. Int. J. Remote Sens. 2003, 24, 583–594. [Google Scholar] [CrossRef]
- Lunetta, R.S.; Knight, J.F.; Ediriwickrema, J.; Lyon, J.G.; Worthy, L.D. Land-cover change detection using multi-temporal MODIS NDVI data. Remote Sens. Environ. 2006, 105, 142–154. [Google Scholar] [CrossRef]
- Favargiotti, S.; Pianegonda, A. The Foodscape as Ecological System. Landscape Resources for R-Urban Metabolism, Social Empowerment and Cultural Production. In Urban Services to Ecosystems: Green Infrastructure Benefits from the Landscape to the Urban Scale, 1st ed.; Catalano, C., Andreucci, M.B., Guarino, R., Bretzel, F., Leone, M., Pasta, S., Eds.; Springer International Publishing: Cham, Switzerland, 2021; Volume 17, pp. 279–295. ISBN 978-3-030-75929-2. [Google Scholar]
- Minora, F. Mutual Housing: Pratiche di Resilienza Abitativa. Available online: https://drive.google.com/file/d/17lXMmXtXU4W60CdLl-Q60kvrCFiFquh8/view (accessed on 19 February 2022).
- Comune di Trento. 2018. Il Futuro Della Città Di Trento Si Costruisce Oggi. Obiettivi e Percorso Della Variante Generale al Piano Regolatore Generale. Available online: https://www.comune.trento.it/Aree-tematiche/Ambiente-e-territorio/Urbanistica/Il-nuovo-PRG-Piano-regolatore-generale/Obiettivi-e-percorso-della-variante-generale-al-Piano-regolatore-generale-2018/Il-futuro-della-citta-di-Trento-si-costruisce-oggi-Schema-del-documento (accessed on 19 February 2022).
- Ricci, M.; Favargiotti, S. Trento Leaf Plan: Cinque Sfide per Il Metabolismo Urbano. EcoWebTown J. Sustain. Des. 2019, 19, 1–10. [Google Scholar]
- Nikologianni, A.; Betta, A.; Pianegonda, A.; Favargiotti, S.; Moore, K.; Grayson, N.; Morganti, E.; Berg, M.; Ternell, A.; Ciolli, M.; et al. New Integrated Approaches to Climate Emergency Landscape Strategies: The Case of Pan-European SATURN Project. Sustainability 2020, 12, 8419. [Google Scholar] [CrossRef]
- Huang, S.; Tang, L.; Hupy, J.P.; Wang, Y.; Shao, G.F. A commentary review on the use of normalized difference vegetation index (NDVI) in the era of popular remote sensing. J. For. Res. 2021, 32, 2719. [Google Scholar] [CrossRef]
- Akbar, T.A.; Hassan, Q.K.; Ishaq, S.; Batool, M.; Butt, H.J.; Jabbar, H. Investigative Spatial Distribution and Modelling of Existing and Future Urban Land Changes and Its Impact on Urbanization and Economy. Remote Sens. 2019, 11, 105. [Google Scholar] [CrossRef] [Green Version]
- Pei, Z.; Fang, S.; Yang, W.; Wang, L.; Wu, M.; Zhang, Q.; Han, W.; Khoi, D.N. The Relationship between NDVI and Climate Factors at Different Monthly Time Scales: A Case Study of Grasslands in Inner Mongolia, China (1982–2015). Sustainability 2019, 11, 7243. [Google Scholar] [CrossRef] [Green Version]
- Atasoy, M. Monitoring the urban green spaces and landscape fragmentation using remote sensing: A case study in Osmaniye, Turkey. Environ. Monit. Assess. 2018, 190, 713. [Google Scholar] [CrossRef]
- Wan, T.; Lu, H.; Lu, Q.; Luo, N. Classification of High-Resolution Remote-Sensing Image Using OpenStreetMap Information. IEEE Geosci. Remote Sens. Lett. 2017, 14, 2305–2309. [Google Scholar] [CrossRef]
- Parmehr, E.G.; Amati, M.; Taylor, E.J.; Livesley, S.J. Estimation of urban tree canopy cover using random point sampling and remote sensing methods. Urban For. Urban Green. 2016, 20, 160–171. [Google Scholar] [CrossRef]
- Stehman, S.V. Basic probability sampling designs for thematic map accuracy assessment. Int. J. Remote Sens. 1999, 20, 2423–2441. [Google Scholar] [CrossRef]
- Zurqani, H.A.; Post, C.J.; Mikhailova, E.A.; Allen, J.S. Mapping Urbanization Trends in a Forested Landscape Using Google Earth Engine. Remote Sens. Earth Syst. Sci. 2019, 2, 173–182. [Google Scholar] [CrossRef]
- Copernicus Land Monitoring Service. Corine Land Cover. Available online: https://land.copernicus.eu/pan-european/corine-land-cover/clc2018 (accessed on 19 February 2022).
- Lichtblau, E.; Oswald, C.J. Classification of impervious land-use features using object-based image analysis and data fusion. Comput. Environ. Urban Syst. 2019, 75, 103–116. [Google Scholar] [CrossRef]
- Shao, Z.; Zhang, Y.; Zhang, C.; Huang, X.; Cheng, T. Mapping impervious surfaces with a hierarchical spectral mixture analysis incorporating endmember spatial distribution. Geo-Spatial Inf. Sci. 2022, 1–18. [Google Scholar] [CrossRef]
- Yang, J.; He, Y. Automated mapping of impervious surfaces in urban and suburban areas: Linear spectral unmixing of high spatial resolution imagery. Int. J. Appl. Earth Obs. Geoinformation 2016, 54, 53–64. [Google Scholar] [CrossRef]
- Wellmann, T.; Lausch, A.; Andersson, E.; Knapp, S.; Cortinovis, C.; Jache, J.; Scheuer, S.; Kremer, P.; Mascarenhas, A.; Kraemer, R.; et al. Remote sensing in urban planning: Contributions towards ecologically sound policies? Landsc. Urban Plan. 2020, 204, 103921. [Google Scholar] [CrossRef]
- Kaspersen, P.S.; Fensholt, R.; Drews, M. Using Landsat Vegetation Indices to Estimate Impervious Surface Fractions for European Cities. Remote Sens. 2015, 7, 8224–8249. [Google Scholar] [CrossRef] [Green Version]
- Sharma, K.; Saikia, A. How green was my valley: Forest canopy density in relation to topography and anthropogenic effects in Manipur valley, India. Geogr. Tidsskr. J. Geogr. 2018, 118, 137–150. [Google Scholar] [CrossRef]
- Maes, J.; Liquete, C.; Teller, A.; Erhard, M.; Paracchini, M.L.; Barredo, J.I.; Grizzetti, B.; Cardoso, A.; Somma, F.; Petersen, J.-E.; et al. An indicator framework for assessing ecosystem services in support of the EU Biodiversity Strategy to 2020. Ecosyst. Serv. 2015, 17, 14–23. [Google Scholar] [CrossRef] [Green Version]
- Gao, B.-C. NDWI—A normalized difference water index for remote sensing of vegetation liquid water from space. Remote Sens. Environ. 1996, 58, 257–266. [Google Scholar] [CrossRef]
- Shen, L.; Li, C. Water Body Extraction from Landsat ETM+ Imagery Using Adaboost Algorithm. In Proceedings of the 2010 18th International Conference on Geoinformatics, Beijing, China, 18–20 June 2010; pp. 1–4. [Google Scholar]
- Pauleit, S.; Ambrose-Oji, B.; Andersson, E.; Anton, B.; Buijs, A.; Haase, D.; Elands, B.; Hansen, R.; Kowarik, I.; Kronenberg, J.; et al. Advancing urban green infrastructure in Europe: Outcomes and reflections from the GREEN SURGE project. Urban For. Urban Green. 2019, 40, 4–16. [Google Scholar] [CrossRef]
- Pauleit, S.; Hansen, R.; Rall, E.L.; Zölch, T.; Andersson, E.; Luz, A.C.; Szaraz, L.; Tosics, I.; Vierikko, K. Urban Landscapes and Green Infrastructure. In Oxford Research Encyclopedia of Environmental Science; Oxford University Press: Oxford, UK, 2017; Volume 28, pp. 6–28. [Google Scholar]
- Cortinovis, C.; Geneletti, D. Mapping and assessing ecosystem services to support urban planning: A case study on brownfield regeneration in Trento, Italy. One Ecosyst. 2018, 3, e25477. [Google Scholar] [CrossRef]
- Zardo, L.; Geneletti, D.; Pérez-Soba, M.; Van Eupen, M. Estimating the cooling capacity of green infrastructures to support urban planning. Ecosyst. Serv. 2017, 26, 225–235. [Google Scholar] [CrossRef]
- Lamelas, M.; Hoppe, A.; De La Riva, J.; Marinoni, O. Modelling environmental variables for geohazards and georesources assessment to support sustainable land-use decisions in Zaragoza (Spain). Geomorphology 2009, 111, 88–103. [Google Scholar] [CrossRef]
- Li, C.; Liu, M.; Hu, Y.; Shi, T.; Qu, X.; Walter, M.T. Effects of urbanization on direct runoff characteristics in urban functional zones. Sci. Total Environ. 2018, 643, 301–311. [Google Scholar] [CrossRef]
- Pickett, S.T.A.; Cadenasso, M.L. Linking ecological and built components of urban mosaics: An open cycle of ecological design. J. Ecol. 2007, 96, 8–12. [Google Scholar] [CrossRef]
- Landry, S.; Pu, R. The impact of land development regulation on residential tree cover: An empirical evaluation using high-resolution IKONOS imagery. Landsc. Urban Plan. 2010, 94, 94–104. [Google Scholar] [CrossRef]
- Frew, T.; Baker, D.; Donehue, P. Performance based planning in Queensland: A case of unintended plan-making outcomes. Land Use Policy 2016, 50, 239–251. [Google Scholar] [CrossRef]
- Norton, B.A.; Coutts, A.M.; Livesley, S.J.; Harris, R.J.; Hunter, A.M.; Williams, N.S.G. Planning for cooler cities: A framework to prioritise green infrastructure to mitigate high temperatures in urban landscapes. Landsc. Urban Plan. 2015, 134, 127–138. [Google Scholar] [CrossRef]
- Ronchi, S.; Arcidiacono, A.; Pogliani, L. Integrating green infrastructure into spatial planning regulations to improve the performance of urban ecosystems. Insights from an Italian case study. Sustain. Cities Soc. 2019, 53, 101907. [Google Scholar] [CrossRef]
- Grêt-Regamey, A.; Altwegg, J.; Sirén, E.A.; van Strien, M.J.; Weibel, B.; Grêt-Regamey, A.; Altwegg, J.; Sirén, E.A.; van Strien, M.J.; Weibel, B.; et al. Integrating ecosystem services into spatial planning—A spatial decision support tool. Landsc. Urban Plan. 2017, 165, 206–219. [Google Scholar] [CrossRef] [Green Version]
Publisher’s Note: MDPI stays neutral with regard to jurisdictional claims in published maps and institutional affiliations. |
© 2022 by the authors. Licensee MDPI, Basel, Switzerland. This article is an open access article distributed under the terms and conditions of the Creative Commons Attribution (CC BY) license (https://creativecommons.org/licenses/by/4.0/).