Article

Assessing Land Use Efficiencies and Land Quality Impacts of Renewable Transportation Energy Systems for Passenger Cars Using the LANCA® Method

1
Department of Sustainability Science, Lappeenranta-Lahti University of Technology LUT, Mukkulankatu 19, 15210 Lahti, Finland
2
Department of Life Cycle Engineering, University of Stuttgart, 70563 Stuttgart, Germany
3
Department of Life Cycle Engineering, Fraunhofer Institute for Building Physics, 70563 Stuttgart, Germany
*
Author to whom correspondence should be addressed.
Sustainability 2022, 14(10), 6144; https://doi.org/10.3390/su14106144
Submission received: 29 March 2022 / Revised: 25 April 2022 / Accepted: 5 May 2022 / Published: 18 May 2022

Abstract

:
Targets to reduce global warming impacts of the transportation sector may lead to increased land use and negative land quality changes. The aim of this paper is to implement the Land Use Indicator Calculation in Life Cycle Assessment (LANCA®) model to assess land quality impacts and land use efficiencies (concerning occupation and transformation) of different example renewable transport energy systems for passenger cars. In addition, the land use impacts are normalized according to the Soil Quality Index building on LANCA® and included in the environmental footprint. The assessment is based on information from GaBi life cycle assessment software databases and on literature. Functional unit of the model is to provide annual drive of 18,600 km for a passenger car in the EU. The analysis includes examples of biomass, electricity, electricity to fuels and fossil-based energy systems. Our findings confirm previous research that biomass-based transport energy systems have risks to lead to significantly higher land occupation and transformation impacts than do fossil oil or electricity-based ones. According to the LANCA® model, methane from Finnish wood and German corn has the highest impacts on filtration and the physicochemical filtration reduction potential. Sugarcane ethanol and palm oil diesel systems, on the other hand, lead to the highest erosion potential. Electricity-based transportation energy systems appear to be superior to biomass-based ones from the perspectives of land occupation, land transformation, and soil quality impacts for the selected examples. Land quality impacts should be taken into account when developing and expanding renewable transportation energy systems. The paper shows that the LANCA® method is applicable for the assessment of transport systems in order to provide extended information on environmental sustainability, which should be included more often in future analysis. However, it can be challenging to interpret underlaying assumptions, especially when aggregated information is used from databases.

1. Introduction

The Intergovernmental Panel on Climate Change (IPCC) [1] has urged rapid action to mitigate greenhouse gas emissions (GHG) in order to limit global warming to below 1.5 °C. Approximately 15% of global GHG emissions are related to the transportation sector, and it is estimated that this sector’s energy consumption will increase at a rate of 1.4% annually, mainly in non-OECD countries [2,3,4]. Targets for reducing GHG emissions in the transportation sector have led to increased interest and use of renewable transportation energy options ranging from biofuels and renewable electricity to power-to-fuels technologies. The share of renewables in global transportation systems is currently only less than 5% [5], so significant increase will be needed.
In addition to challenges related to climate change, Earth is also facing other environmental sustainability challenges such as a rapid biodiversity loss and land system change [6,7]. Habitat loss due to land use (LU) is one of the main drivers behind this decreasing biodiversity followed by, e.g., climate change [8,9]. At the moment, approximately 40% of the Earth’s surface area is harnessed for food production, and possible additions likely contain less productive land areas [10]. Many ecosystem services are dependent on land availability and are inherently linked to biodiversity. Therefore, expanded LU will possibly lead to the disturbance of ecosystem services, along with unpredictable effects on humans [11,12]. This creates major challenges for increased renewable transportation energy production from the LU perspective.
Renewable energy production for the transport sector, particularly production from biomass-based systems, requires more LU than does production from fossil energy-based systems [13]. According to Harvey’s [13] analysis, the LU of future zero greenhouse gas emission strategies for light-duty vehicles varies greatly but is significant, especially in terms of biomass-based systems. Uusitalo et al. [14] have demonstrated that in the boreal climate zone, solar and wind electricity production for traffic energy needs is, in terms of LU, much more efficient than biomass-based energy pathways. In addition, globally, and from the LU perspective, electricity use in traffic is more efficient than sugarcane-based ethanol and palm oil-based diesel, which are examples of biofuels from feedstock exhibiting high productivity per land area [15]. Waste and sideflow feedstock-based transportation energy systems require less land area but are typically limited by feedstock availability, especially with regard to increased need in the future [16]. This may create pressure to produce renewable transportation energy from feedstocks, which requires LU intensification. This raises the necessity to assess the impacts on soil quality and biodiversity instead of the size of occupied and transformed areas.
There seems to be a high risk that the increased use of renewable transportation energy will lead to expanding LU, which will in turn cause negative impacts on sustainability, e.g., in soil quality and in biodiversity. LU requirements should be a key issue when the sustainability of renewable transport systems is evaluated [17]. In addition, quality changes of soils should be assessed to avoid negative sustainability impacts on soils [18]. Sustainable LU from a land quality perspective has consequently become a central issue worldwide, especially with regard to biofuels, as the use of arable land for the production of biofuels can lead to soil degradation. The current predominantly unsustainable LU practices result in negative environmental impacts such as soil erosion, salinization, acidification, and the loss of habitats, thus ultimately resulting in the loss of biodiversity [9,19]. Soil is a consumable resource, as its formation is very complex and may take centuries.
In order to address these challenges of global ecological change with product development, valuable methods assessing the impact on biodiversity and soil quality using life cycle analysis (LCA) have been established. These methods have been reviewed in publications (see, e.g., [20,21,22,23]), and significant research gaps have been highlighted. Halleux et al. [24] have demanded to include soil quality impacts on decision making related to biofuels. To measure a product’s environmental footprint, the European Union has recommended the use of the soil quality index based on the Land Use Indicator Calculation in Life Cycle Assessment (LANCA®) method [25]. LANCA® can be used to calculate various LU environmental impact categories representing the influence of production processes on local ecosystem services [26,27,28]. It can be applied to calculate characterized indicator values that describe the influence of processes on various ecosystem services and soil quality. The LANCA® calculations are based on geo-ecological classification systems and area-specific input data. The ecosystem functions include occupation and transformation impacts on erosion resistance, mechanical filtration, physical-chemical filtration, groundwater recharge, and biotic production potential, which can all be considered in the LCA using this method.
LU quality impacts of different transport energy systems for passenger cars have not been previously holistically analyzed. Understanding these impacts is, however, crucial for recognizing sustainability impacts of various transport energy pathways. The aim of this paper is to use LCA and the LANCA® model to show whether it can be used to compare different transport energy pathways from land quality perspectives. Another aim is to produce information on LU efficiency and land quality impacts of widely used and promising examples of renewable transport energy systems for passenger cars and to compare these impacts to those stemming from fossil gasoline and diesel use.

2. Materials and Methods

2.1. Life Cycle Assessment Methodology for the LANCA® Model

LCA methodology has been applied in this paper to calculate LU (concerning land occupation and land transformation) and other selected LU-related quality impacts for different transportation energy systems for passenger cars. The specific LCA model for land quality impacts is LANCA®. The analysis for the various options presented herein is from cradle to wheel and does not include car manufacturing. The functional unit (FU) of the study is 18,600 km a−1 driven on average by passenger cars in the EU [29]. The FU of the study is provided in central Europe for all the options under study. The LCA model has been based on the instructions of ISO 14040 and ISO 14044 standards, and the model has been created using GaBi 8.7 life cycle assessment software and databases [30,31]. The GaBi database processes include regionalized LU impacts based on the LANCA® method, ant this assessment is based on initial data from GaBi databases. However, some data and processes are lacking, so additional information for processes is collected from literature sources. Assumptions related to LU of processes modelled based on literature are presented in Appendix A.
LU-related inventories and impact assessments typically include both land occupation and land transformation [18]. According to the guidelines presented by Koellner et al. [32], land occupation can be calculated by the change in ecosystem quality over a certain time period, multiplied by the occupied land area. Land transformation may be calculated based on the difference of ecosystem quality between the LU and reference over time. Koellner et al. [32] recommend allocating transformation impacts to a functional unit using a 20-year production output value as a compromise between allocating everything to the first year or to long allocation periods.
Bos et al. [27] present characterization factors for LANCA® in the impact categories of Erosion Resistance, Mechanical Filtration, Physicochemical Filtration, Groundwater Regeneration and Biotic Production. All these impact categories have been selected for assessment in this paper. Within the LANCA® framework, land transformation is subdivided into transformation from, which presents the change between the reference LU and previous LU; and transformation to, which presents the change between prospective and reference LUs [27].

2.2. Selected Pathways for Transportation Energy Production

As there are approximately one billion passenger cars globally, the main focus of this research is on energy systems applicable to passenger cars [33]. The main energy sources for passenger cars are currently fossil gasoline and diesel. According to the International Energy Agency [34], liquid biofuels such as ethanol and biodiesel represent the highest share of transportation energy consumption after fossil fuels, followed by electricity and biogas. Biofuel use in the traffic sector has approximately doubled between 2007 and 2017 [34]. Advanced fuels from cellulosic raw materials and synthetic fuels currently only have a marginal share, but this is expected to grow in the future [34]. Schmidt et al. [35] based their 100% renewable transport plan for the EU system on electricity, power to liquids, and gas processes. According to the International Energy Agency [36], electric car sales are increasing globally, and electricity can be viewed as one of the main energy sources for passenger cars in the near future. Schemme et al. [37] envision many possibilities for replacing fossil diesel with synthetic fuels produced using renewable electricity and CO2. Such options can be, for example, methane and methanol [38]. Based on current energy use and these future predictions, we have chosen example transportation energy production options for this study, which are presented in Table 1.
Fossil gasoline and diesel are included in this study to represent reference values for current LU impacts of energy systems for passenger cars. Average gasoline and diesel mixes at filling stations in EU-28 GaBi database processes have been utilized in the model. It should be noted that both gasoline and diesel mixes include a small share (approximately 6–15%) of bio-based fuel mixed with fossil fuels.
Hydrotreated diesel produced from palm oil has been selected as an example of a vegetable oil-based renewable diesel production process. Palm oil is produced in tropical regions, especially in Southeast Asia, but also in increasing amounts in South America and Africa [39]. It can be cultivated both on mineral and peat lands [40]. Malaysia has been chosen here as an example of a palm oil production location because, together with Indonesia, it produces the majority of global palm oil [39]. The palm kernel production process in Malaysia is available in the GaBi database, but oil extraction and hydrotreatment processes have been modelled separately. Oil extraction of palm fruit brunches produces crude palm oil and palm kernel oil. The process does not require energy from outside the system because all the required energy can be produced from side flows on site [41]. The LU of the palm oil extraction facility can be roughly measured from satellite maps and is approximately 1500 m2, with a 60,000 t annual production capacity.
The refined palm oil is exported to pre- and hydrotreatment (HVO) plants, and Neste’s Rotterdam plant has been chosen as an example for this study. The HVO plant area measured from satellite maps is 80,000 m2, with an annual production capacity of 1 million tons of renewable diesel [42]. Distribution is carried out using average tankers, and the distance is 14,500 km from Malaysia to Rotterdam. The HVO process requires 29.4 kg of hydrogen from steam cracking, 129.5 MJ of electricity, and 560.6 MJ of steam from natural gas for the utilization of 1000 kg of vegetable oil [41]. These processes have been modelled using GaBi data for the Netherlands. This results in 824 kg of diesel, 20 kg of gasoline and 59 kg of propane as co-products [41]. No land transformation is expected to have occurred related to the HVO plant in Rotterdam because the facility is built on earth fill in an area that used to be sea. The production of materials for the palm oil extraction plant and HVO plant has been excluded from this study due to the lack of data, but this impact is assumed to be minimal.
Ethanol produced from sugarcane is one of the major global ethanol production pathways. Brazil is the world’s leading producer of ethanol, and therefore ethanol production from Brazilian sugarcane has been selected for analysis herein. The GaBi database process for sugarcane ethanol production in Brazil has been augmented by adding distribution to Europe. The distribution has been assumed to be carried out by an average tanker (7400 km) and a EURO 6, 40.6 t payload truck (500 km).
Methane produced from corn silage through anaerobic digestion is an option that utilizes biomass production in central Europe. The EU-28 mix for corn silage methane production from the GaBi database has been used here and has been augmented by adding distribution and refueling. Biomethane may be distributed via natural gas grids or via refueling infrastructure for natural gas [43]. The electricity used in distribution and refueling processes consumes approximately 1 MJ kg−1 methane [43].
Methane produced from wood through gasification is an option for using lignocellulosic wood biomass in traffic energy production. Boreal forests cover one third of the world’s forest area, thus offering great potential for biomass utilization [44]. This is, however, a rather theoretical case, as currently gasification plants only deal with waste and sideflow wood.
For this study, Finland has been selected as an example location for wood production. The average annual growth of Finnish forests is approximately 4.7 (2.7–6.7) m3 ha−1 [45]. The average timber density is 560 (497–625) kg m−3, and the lower heating value is 7.5 MJ kg−1 [46]. Wood harvesting and collection have been calculated here using the assumptions presented by Leino et al. [46].
A Swedish gasification plant efficiency of 65% has been used in this study [47]. Gasification consists of two main process stages. Steam is used to gasify wood in the first reactor. Unconverted biomass from the first reactor can be used to produce the steam required. The gas produced from gasification is directed to the methanation process and then to the upgrading and purification process [14]. The process equipment consumes approximately 139 Wh kg−1 of electricity, which is modelled using GaBi Finnish grid electricity data [48]. There may be excess heat from the process, but this is regarded as waste heat in this study. Catalyst production and materials for the gasification plant are not included in this study owing to the lack of data.
The LU of the gasification plant has been calculated using data available for such a plant that was planned to be built in Joutseno, Finland. According to Siitonen [49], annual production of the plant was expected to be 1600 GWh of methane, and the land area requirements are approximately 3000 m2 (measured using satellite maps).
Electricity can be directly used in electric cars. For this study, we have selected solar photovoltaic (PV) and wind power to represent renewable electricity production options. The solar electricity production is located in Germany because of its relatively high production potential and its location for central European markets. The GaBi PV process does not include land occupation by solar panels. Therefore, this case can be assumed to represent a situation where solar PVs have been installed, e.g., on rooftops. However, we have also assessed separately direct land occupation and transformation of ground solar PV systems in Germany based on assumption that direct normal irradiation is 1100 kWh m−2 per year [50] and solar PV efficiency is 20% [51].
The North Sea coastal region in the Netherlands was selected as the case region for wind power production because of its high wind potential and short distance to central European markets [52]. In addition, we have employed EU-28 electricity grid mixes from the GaBi database for the current state of affairs and for estimations for 2030 and 2050.
Synthetic methane produced from electricity has been seen as a promising power to fuel technology. Electricity may be used in hydrogen production through an electrolysis process. After electrolysis, hydrogen and CO2 can be converted into various hydrocarbons. CO2 can be captured from air or flue gas flows, for example, and direct air capture has been selected. In this paper, we have selected solar photovoltaics (PVs) in Spain to represent high solar productivity for synthetic fuels. Hydrogen production is modelled using an electrolysis process available in the GaBi database. The hydrocarbon selected for this paper is methane. Methane can be produced from hydrogen and CO2 via a methanation process. The production of 1 kg of methane requires 0.53 kg of hydrogen, 2.89 kg of CO2 and 1.19 MJ of electricity [38]. The materials required for methanation facilities are not included in this study because of the lack of data. A container-sized methanation unit requires 14 m2 of land and is able to produce 600,000 kg of methane annually [53]. Figure 1 presents the main life cycle steps of each transportation energy pathway and the key inputs and outputs from processes.

2.2.1. Tank-to-Wheel Efficiencies of Passenger Cars

Tank-to-wheel efficiencies of passenger cars vary among the different traffic energy options. In this paper, we have used average energy consumption data provided by the Technical Research Centre of Finland [54]. The following energy consumption rates have been chosen for this study: for petrol-operated cars, 2.3 MJ km−1; for diesel-operated cars, 2.1 MJ km−1; for gas-operated cars, 1.9 MJ km−1; and for electric cars, 0.69 MJ km−1. All these values are for a case when there is an average of 1.7 people in a car and with a proportion of 27% street driving and 73% highway driving. HVO diesel is applicable for diesel engines in high blends [41]. Ethanol can be blended with fossil petrol but in lower blends. A high blend of ethanol requires flexi-fuel cars [55].

2.2.2. Refueling Stations

There are 75,000 refueling stations in the EU and 264 million passenger cars [29,56]. An average refueling station is assumed to be 1000 m2. The same assumptions have also been used for methane refueling.
Electricity can be distributed via electric grids and through slow or fast charging stations. Approximately 75% of people in the EU have access to home-based charging, and it is estimated that home charging would provide 75% of their charging needs. The rest is assumed to be carried out by fast charging stations [57]. Home charging can be done with existing parking spaces, but for fast charging, new stations are necessary. Fast charging is assumed to take 30 min, and cars are assumed to be charged once a week. It is assumed that average charging stations require a space of parking slot that is 2.3 m wide by 4.8 m long.

2.2.3. Allocation

Some of the processes yield valuable co-products, so an allocation process is called for. Allocation has been carried out based on the energy content of main products and co-products and according to the instructions of EU Directive 2018/2001 [58]. Table 2 presents the allocation methods for main and co-products.

3. Results

This chapter presents results based on assumptions and initial data presented in the Materials and Methods chapter. The basis of the analysis are processes from GaBi databases, and this data has been supported by literature data. Results have been provided by the GaBi software for selected pathways to provide energy for passenger cars. Figure 2 presents land occupation and land transformation of the transport energy systems under study for the FU. As can be seen in the figure, biomass-based energy systems requiring cultivation or forestry lead to significantly higher land occupation and transformation than does the use of fossil fuels or electricity-based systems. The majority of land occupation and transformation is related to biomass production as was previously concluded by Harvey [13]. This also indicates that by using sideflow or waste feedstock majority of land use and transformation could be avoided. Fuel production and distribution only have marginal impacts on land occupation and transformation and could be perhaps neglected in future studies. For example, in the case of renewable diesel production based on palm oil, the production of palm fruit brunches in cultivation is responsible for approximately 99.9% of the land occupation and transformation. Land transformation and occupation concerning electricity use can be viewed as increasing slowly (2030 and 2050 scenarios) over the coming decades because of the higher LU requirements of renewable electricity systems. There was uncertainty around the measurements of area requirements for fuel production plants and refueling stations, but in light of the results, attention should be focused on biomass and renewable electricity production phases. Solar PV electricity production process was assumed to be located on rooftops, thus not requiring land occupation. Direct land occupation per functional unit for ground solar PVs in Southern Germany is 16.2 m2a and transformation is 0.8 m2. This shows that ground solar PV-based transport energy systems also seem to be significantly better than biomass-based systems.
Results from the LANCA® impact assessment for various land quality indicators for mobility modes are presented in Table 3. Across all the studied impact categories, biomass-based energy systems typically have higher impacts than do fossil fuel and electricity-based systems, which is linked to land area requirements. Land transformation values may lead to negative impacts if new land use performs better than previous land use in quality indicators. Impacts in different impact categories of land quality are results from regionalized national level land occupation and transformation indicators for different land use types for the FU.
Within the biomass-based energy systems, methane from wood has the greatest impact on the categories of the physical-chemical filtration reduction potential, infiltration reduction potential and biotic production loss. Biomethane from maize has the second highest impact on the same three indicators. The characterization factors for the physical-chemical filtration-reduction potential as well as the infiltration-reduction potential are highly correlated; therefore, the results are also correlated and show similarities [25]. Furthermore, both biofuels also have the highest land demand. The production sites of wood and corn are located in temperate and boreal ecoregions. In production sites with good soil characteristics, the influence is greater, as these areas have a higher characterization factor. According to Bos [59] and Bos et al. [60], the highest characterization factors occur in countries where soils with very good filtering properties are present due to a high sand content and a high groundwater level. If these soils are sealed, the filter properties strongly decrease, which leads to high impacts in such regions. Furthermore, the effects also depend on the type of LU. In this context, forests and grassland generally show lower risks than arable or urban soils because of the difference in the sealing factor [59,60]. However, even if the characterization factor of the LU type of forest is smaller, our results still show higher impacts for the production of biogas from wood, since much more land is affected as a result of the inefficient process of wood gasification and lower biomass productivity.
Among the indicators for erosion potential and groundwater regeneration potential, renewable diesel from palm oil has the highest impact, followed by ethanol from sugar cane production. Both production sites are located in tropical areas with similar soil and climate conditions. Here, a reduction in the natural vegetation cover of the tropical forest has a much higher risk of soil erosion than in sites with a natural vegetation cover of grassland or open bare land [59,60]. As a result, particularly high-risk values for erosion are found in countries near the equator, such as the case of palm oil and sugar cane cultiva-tion sites in Malaysia and Brazil. These results are in line with the study of Borelli et al. [61], who found the highest soil erosion rates in countries in South America, Africa, and Asia.
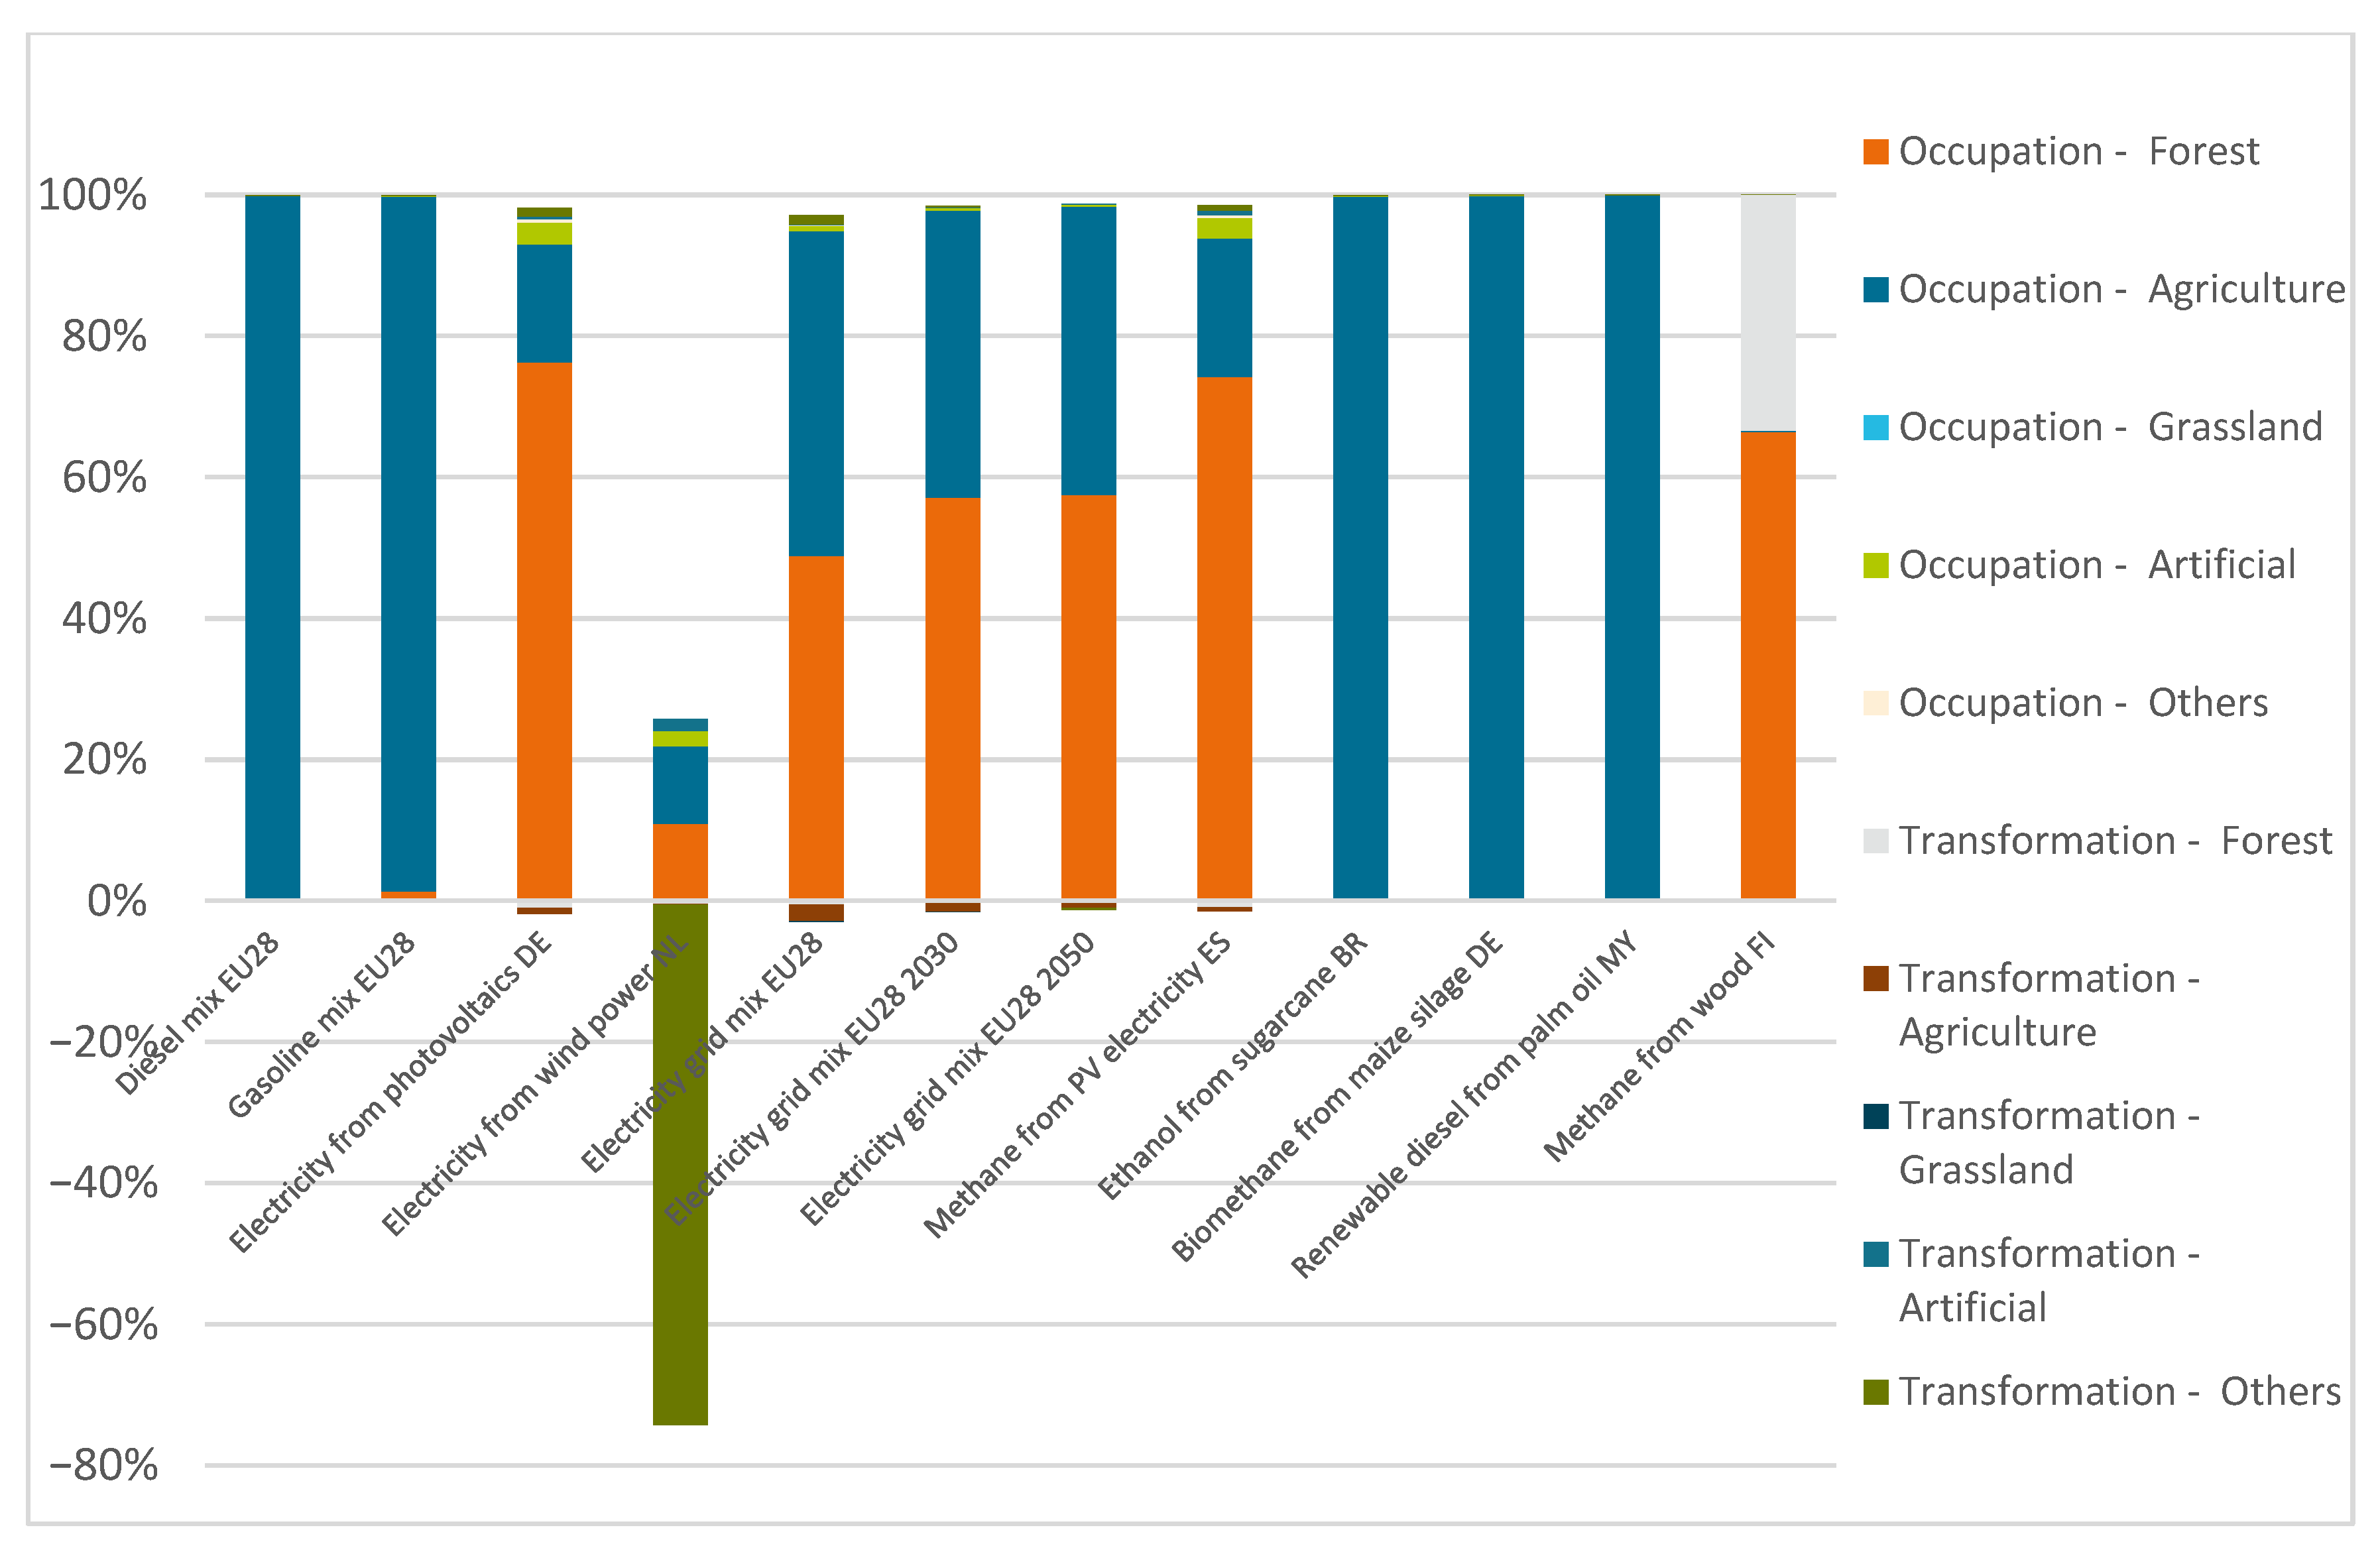
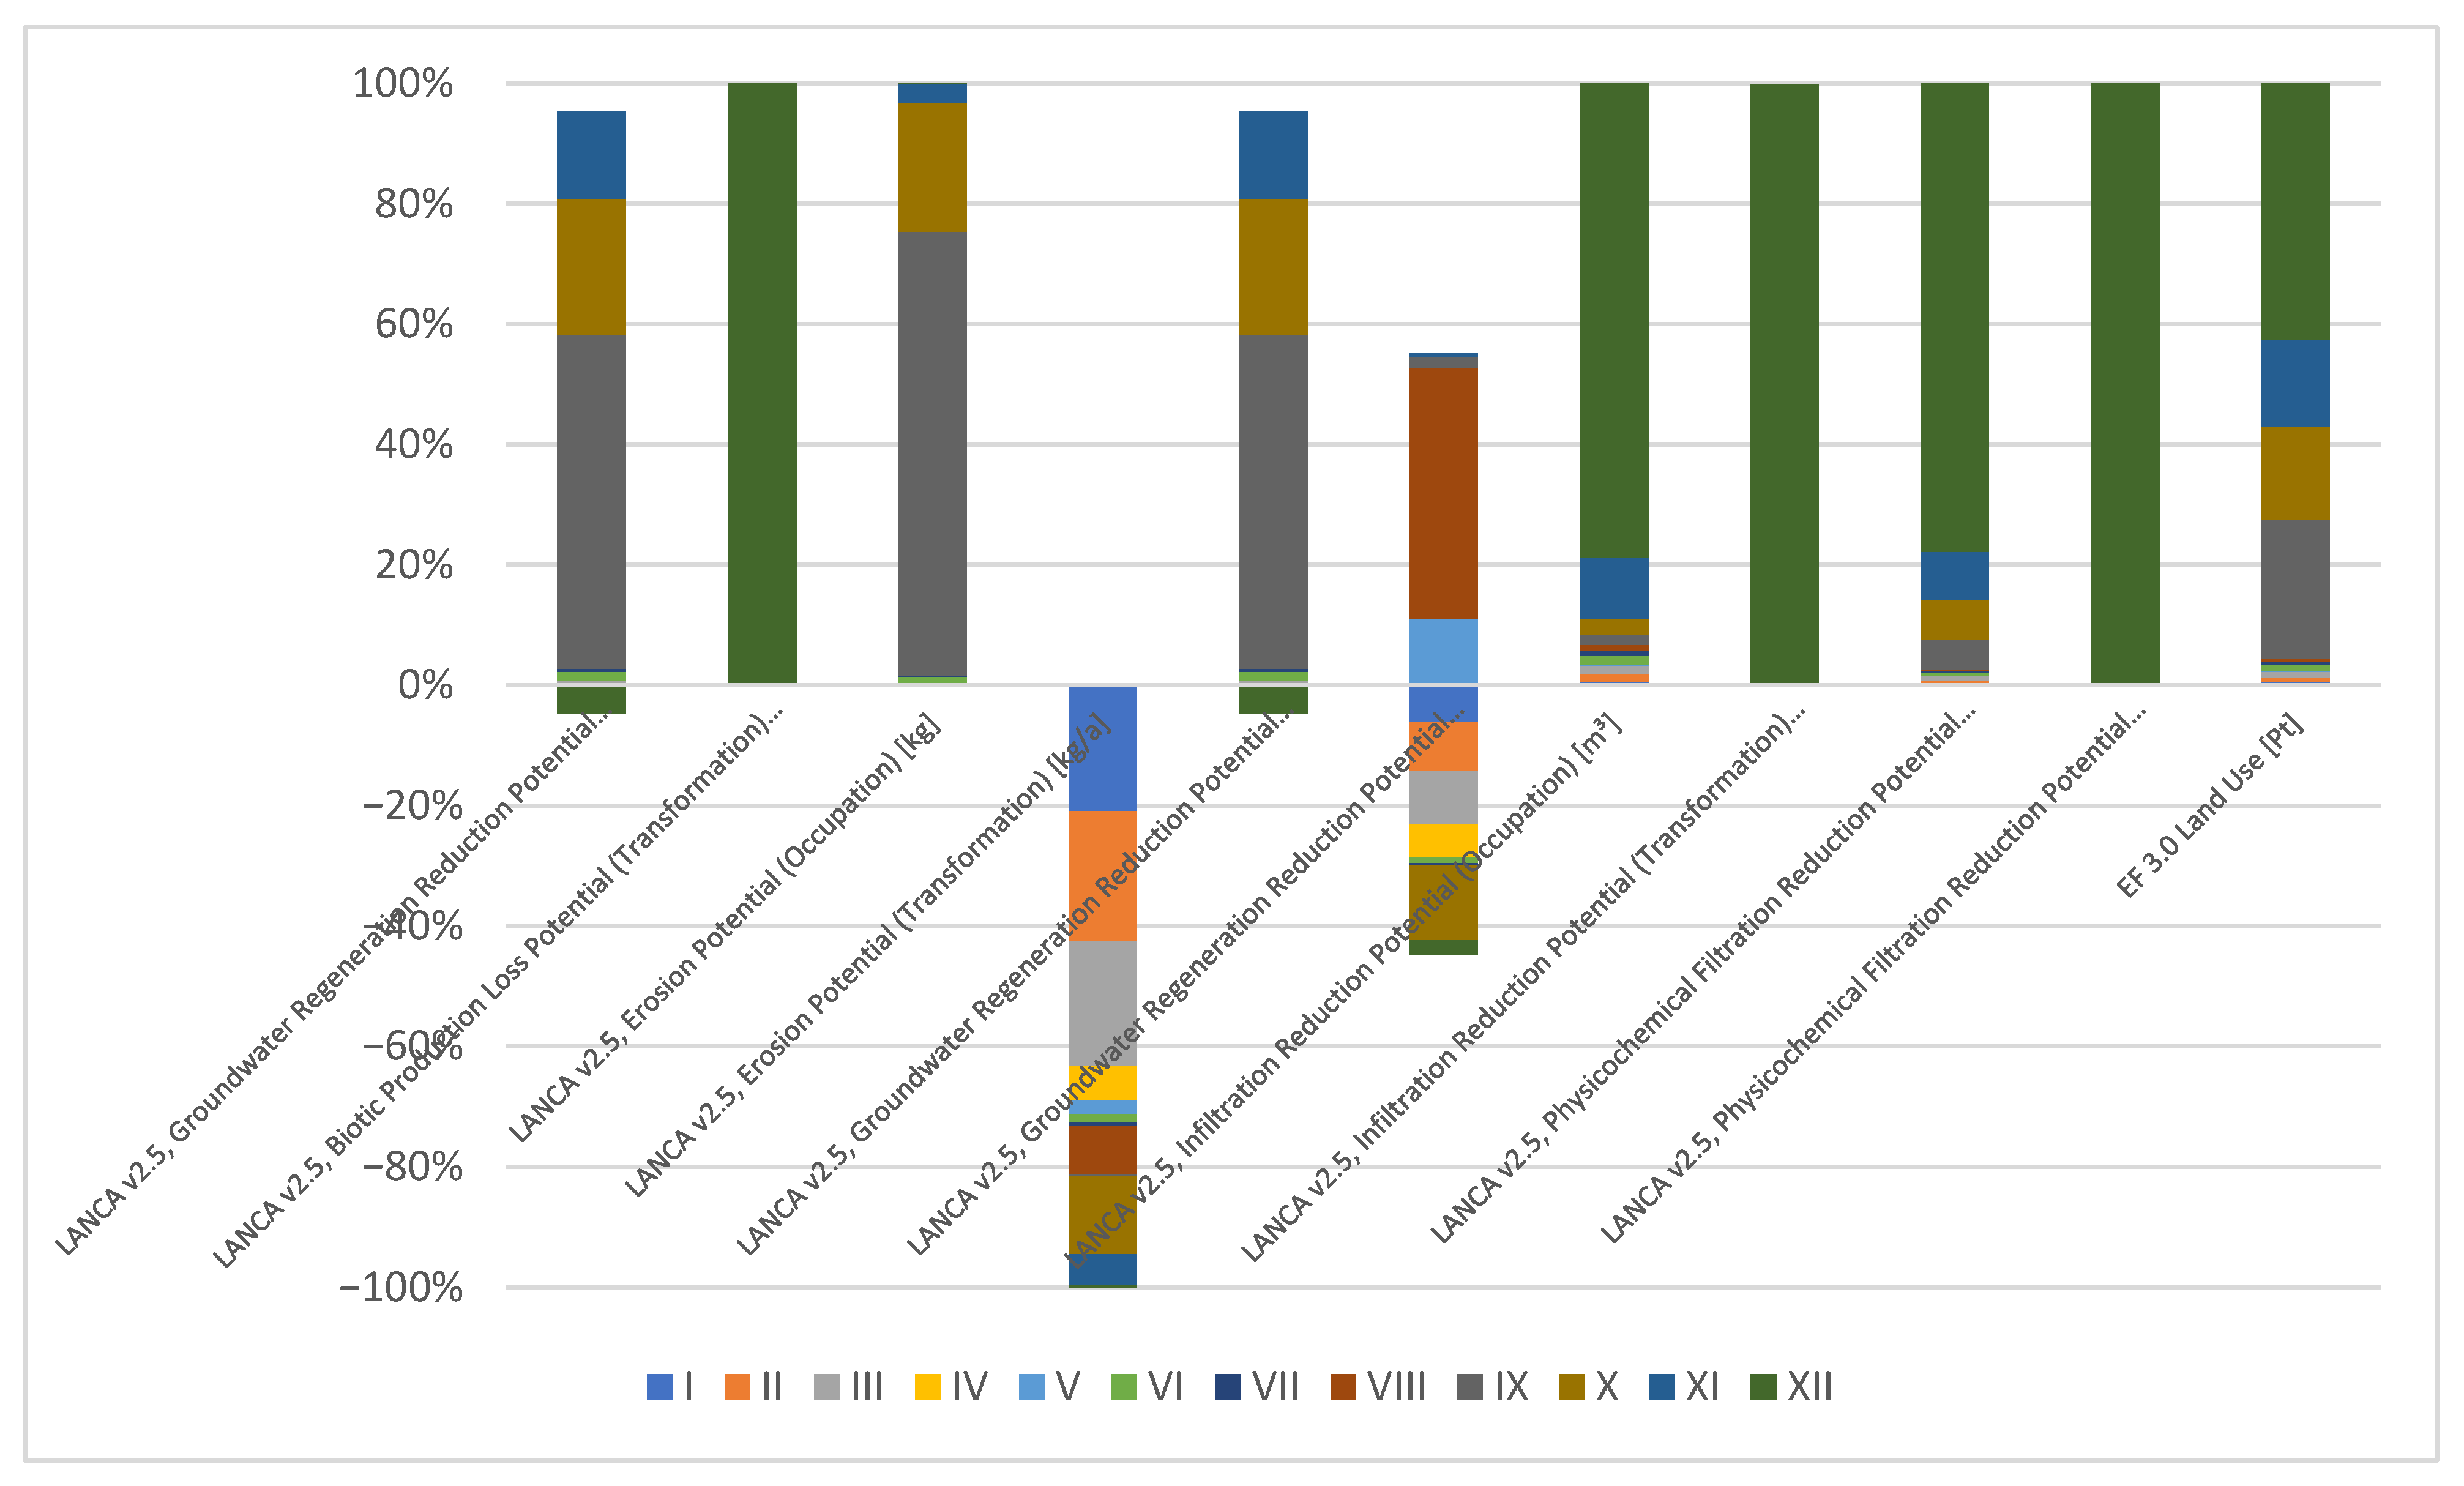
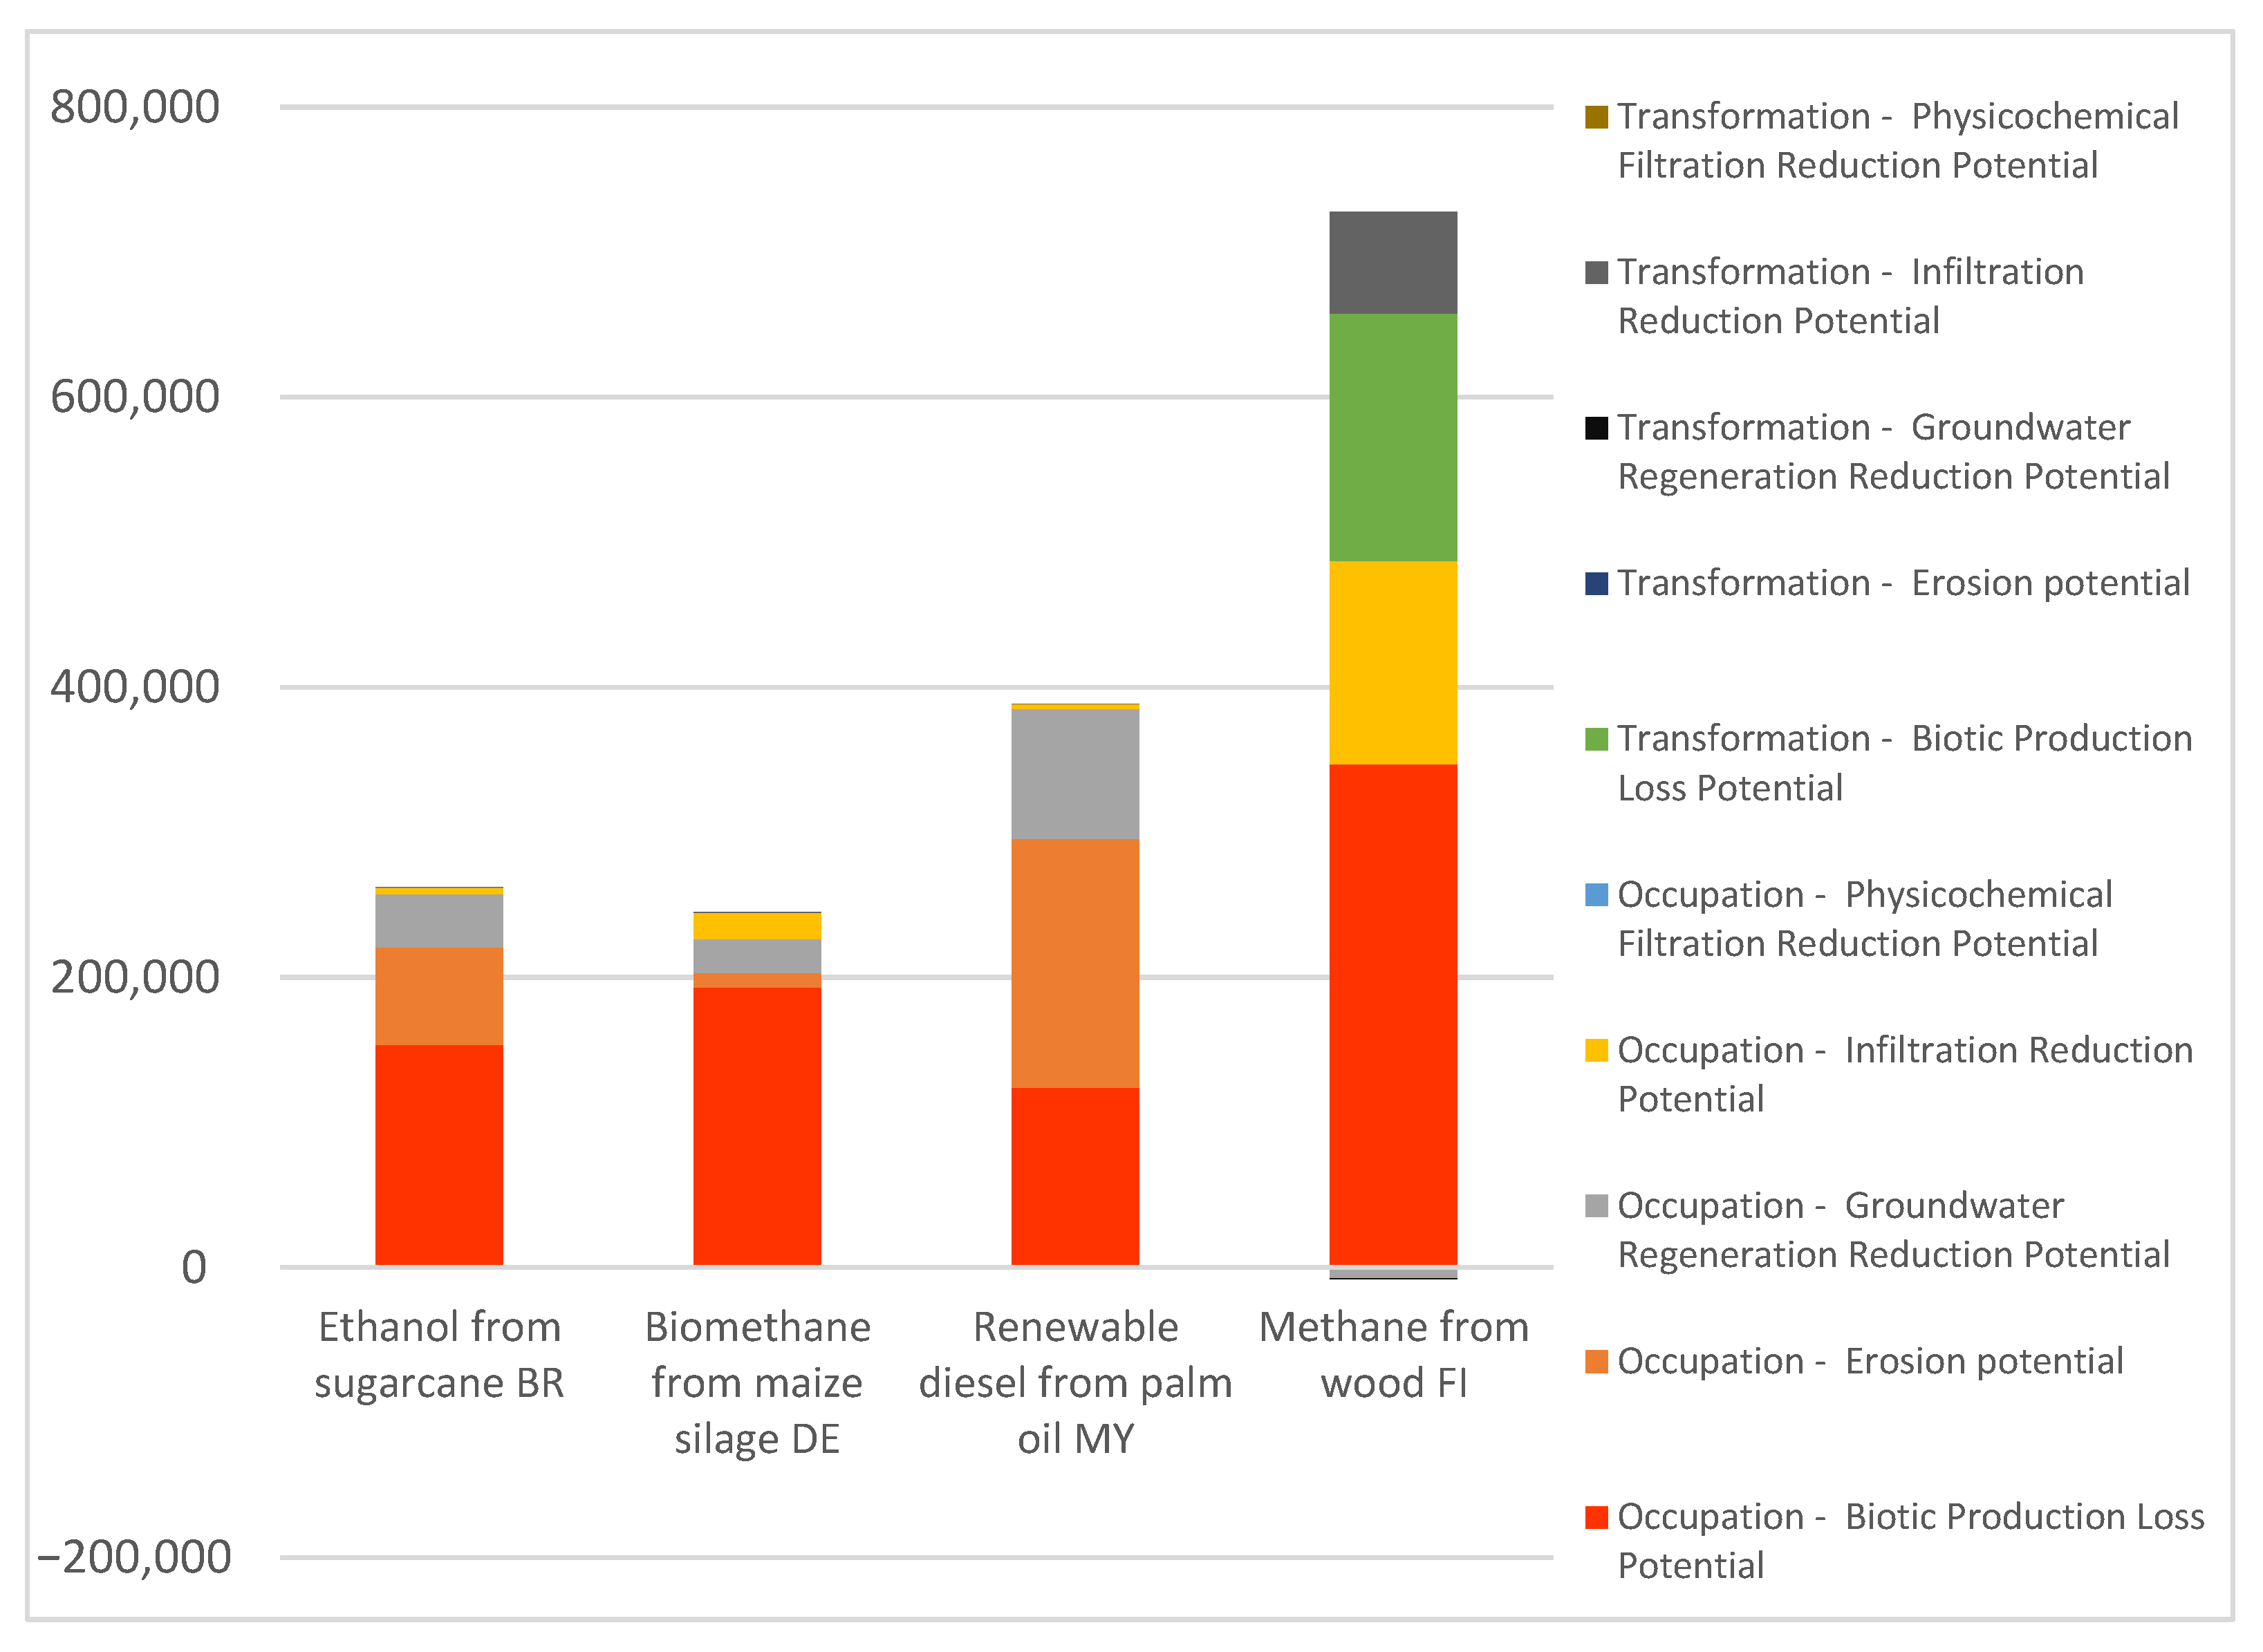
In addition to the midpoint LANCA results, the results have been normalized using the Soil Quality Index approach as developed by de Laurentiis et al. [25]. Figure 3 shows the normalized results for the biobased fuels differentiated by the LANCA categories. The normalized results also are in line with the abovementioned findings, offer an aggregated view on the impact on soil quality. Among the LANCA indicators, biotic production (occupation) and erosion potential (occupation) are relevant for all energy pathways. Looking at specific biofuel sourcing routes, the abovementioned findings are represented in the SQI as well. The impact of wood based methane mainly originates from the transformed and occupied forest represented in high impacts on biotic production loss and infiltration reduction. The palm oil as well as the sugarcane result relevant impacts on groundwater regeneration reduction as well as on erosion, while the maize based fuel is strongly dominated by the occupational biotic production loss potential. Use of forest and agricultural lands dominate land occupation in all studied transport energy pathways. In addition forest tarnsformation has high importance for wood methane pathway. These results have been presented in more detailled in Appendix B, which presents shares of land use types based on LANCA and normalized by the Soil Quality Index for the investigated energy pathways. Appendix B also shows relative relevance of the different pathways for the LANCA categories and the Soil Quality Index. Overall, the different characteristics of the LANCA categories are represented in the normalized result and allow for an abstracted assessment of the impact on soil quality.

4. Discussion

From the results of this study, we may conclude that, in general, all biofuel transport energy systems have a higher impact on LU and soil than do electrical and fossil-based energy systems. Majority of land use related challenges could be possibly avoided by using waste and sideflow feedstocks. Fossil energy systems, have a greater impact on the global climate, which in the long run will also affect LU and soils. Therefore, electrical energy systems from renewable sources such as solar or wind are preferable. More research would be required to land use impacts of various renewable electricity options in different geographical locations. For biofuel energy systems, land yield efficiency has a significant influence on the overall impact. However, the location of the production system and the soil conditions in the region also influence the results, depending on the indicator studied. Consequently, trade-offs should be carefully weighed against each other, and impacts in other impact categories, such as climate change or social impacts, should also be considered. It should be also noted that country-specific default values can in reality differ from actual site-specific values as was shown by Terranova et al. (2021) [62]. There can be also differences in LANCA impacts between different geographical locations [63]. Therefore, for example, the wood biomethane case could have led to different results if the wood were from other ecoregions.
From a global perspective, in addition to low life cycle greenhouse gas emissions transportation energy production should be done as efficiently as possible in order to minimize direct and indirect LU impacts. The LANCA® method seems to be applicable in assessing land quality impacts of transport energy systems related to LU. These impacts should be included more often in future LCA research to recognize sustainability risks and to have a better understanding for decisions making. When using aggregated data from databases, there can be challenges in data interpretation. For example, it can be possible that some relevant land use data has not been included in aggregated processes, and this can be difficult to recognize as was the case with solar PVs.
From a climate policy perspective, land-use is critical because, e.g., agricultural expansion possesses a risk to lead to reduced carbon storage in comparison to native vegetation [64]. This can significantly reduce positive impacts of transport biofuels [41]. However, in some cases, land use change for transport energy production can lead to increased carbon storage [41]. Future research should provide more information holistically for land use related climate impacts of transport energy pathways. There are multiple environmental sustainability risks related to biofuels from cultivated feedstock. In addition, availability of agricultural land seems to be a significant limiting factor for biomass that requires cultivation [10]. It is also possible that scarce biomass sources should be directed for longer lasting products such as textiles or plastics, but more holistic analysis would be required for this issue. Ram et al. [65] assessed that in Europe, a 100% renewable transport energy system could be possible, but it would be based mainly on direct electrification along with power-to-fuels pathways.

5. Conclusions

Land use and land use quality impacts for six major example energy pathways for passenger cars were compared using life cycle assessment and the LANCA® method. The results show that there are significant differences in land quality impacts between different energy pathways. The biomass-based energy pathways have significantly higher land use (land occupation and transformation) requirements and soil quality impacts (filtration, erosion) than do fossil oil or electricity-based systems. The majority of impacts are related to biomass production, with production plants and the distribution system playing only a marginal role. From the perspectives of land use and soil quality, an energy transition to low carbon transportation should be primarily done by using electricity either directly in electric cars or by using synthetic fuels. There appears to be a risk that an increased use of renewables in traffic systems may lead to land use problems and soil quality issues.

Author Contributions

Conceptualization, V.U., R.H., and S.D.M.; Methodology, V.U., R.H., and S.D.M.; Software, V.U. and R.H.; Validation, V.U. and R.H.; Formal Analysis, V.U.; Data Curation, V.U. and R.H.; Writing—Original Draft Preparation, V.U.; Writing—Review & Editing, V.U., R.H., and S.D.M.; Visualization, V.U. and R.H. All authors have read and agreed to the published version of the manuscript.

Funding

This research received no external funding.

Institutional Review Board Statement

Not applicable.

Informed Consent Statement

Informed consent was obtained from all subjects involved in the study.

Data Availability Statement

Not applicable.

Conflicts of Interest

The authors declare no conflict of interest.

Appendix A

Life Cycle PhaseLand Occupation
(m2a)
Allocation Period for Transformation(a)Land Transformation from(m2)Land Transformation to(m2)
Electric car charging
(per FU)
0.033
Urban (regionalized, DE)
200.00165 (20 a)
From urban, green areas (regionalized, DE)
0.00165 (20 a)
To industrial area (regionalized, DE)
Petrol/diesel refueling station
(per FU)
0.28
Urban (regionalized, DE)
20No transformationNo transformation
Biomethane refueling station
(per FU)
0.28
Urban (regionalized, DE)
200.0141 (20 a)
From urban, green areas (regionalized, DE)
0.0141 (20 a)
To urban (regionalized, DE)
Palm oil extraction
(per 1 kg palm oil)
2.5 × 10⁻⁵
Industrial area (regionalized, MY)
201.25 × 10⁻⁶ (20 a)
From forest, natural (regionalized, MY)
1.25 × 10⁻⁶ (20 a)
To industrial area (regionalized, MY)
HVO process
(per 1 kg renewable diesel)
0.00008
Industrial area (regionalized, NL)
20No land transformation. Build on previous sea0.000004 (20 a)
To urban (regionalized, NL)
SNG production from wood
(per FU)
0.0184
Industrial area (regionalized, FI)
200.0009
From forest, intensive (regionalized, FI)
0.0009
To industrial area (regionalized, FI)
Forest use for SNG wood production28,000
Forest, intensive
(regionalized, FI)
201400
From forest natural (regionalized, FI)
1400
To forest intensive (regionalized, FI)
Methanation process
(per 1 kg methane)
2.3 × 10⁻⁵
Industrial area
(regionalized, ES)
201.15 × 10⁻⁶
From shrub land
(regionalized, ES)
1.15 × 10⁻⁶
To industrial area
(regionalized, ES)

Appendix B

Land use type share of impacts based on LANCA and normalized by the Soil Quality Index for the investigated energy pathways to produce the annual energy required for driving for a passenger car in the EU.
Sustainability 14 06144 g0a1
Relative relevance of the different pathways for the LANCA categories and the Soil Quality Index.
Sustainability 14 06144 g0a2

References

  1. IPCC. Global Warming of a 1.5 °C; IPCC: Geneva Switzerland, 2018. [Google Scholar]
  2. IPCC. Summary for Policy MakersSummary for Policy Makers; IPCC: Geneva Switzerland, 2014. [Google Scholar]
  3. U.S. Energy Information Administration. Internation Energy Outlook 2016; U.S. Energy Information Administration: Washington, WA, USA, 2016.
  4. Richie, H. Sector by Sector: Where Do Global Greenhouse Gas Emissions Come From? Available online: https://ourworldindata.org/ghg-emissions-by-sector (accessed on 21 April 2022).
  5. REN21. Renewables 2021 Global Status Report; REN21 Secretariat: Paris, France, 2021. [Google Scholar]
  6. Rockström, J.; Steffen, W.; Noone, K.; Persson, Å.; Chapin, F.S.; Lambin, E.F.; Lenton, T.M.; Scheffer, M.; Folke, C.; Schellnhuber, H.J.; et al. A Safe Operating Space for Humanity. Nature 2009, 461, 472–475. [Google Scholar] [CrossRef] [PubMed]
  7. Steffen, W.; Richardson, K.; Rockström, J.; Cornell, S.E.; Fetzer, I.; Bennett, E.M.; Biggs, R.; Carpenter, S.R.; De Vries, W.; De Wit, C.A.; et al. Planetary Boundaries: Guiding Human Development on a Changing Planet. Science 2015, 347, 1259855. [Google Scholar] [CrossRef] [PubMed] [Green Version]
  8. Tilman, D.; Fargione, J.; Wolff, B.; D’Antonio, C.; Dobson, A.; Howarth, R.; Schindler, D.; Schlesinger, W.H.; Simberloff, D.; Swackhamer, D. Forecasting Agriculturally Driven Global Environmental Change. Science 2001, 292, 281–284. [Google Scholar] [CrossRef] [PubMed] [Green Version]
  9. IPBES. Summary for Policymakers of the Global Assessment Report on Biodiversity and Ecosystem Services of the Intergovernmental Science-Policy Platform on Biodiversity and Ecosystem Services; IPBES: Bonn, Germany, 2019. [Google Scholar]
  10. Foley, J.A.; Ramankutty, N.; Brauman, K.A.; Cassidy, E.S.; Gerber, J.S.; Johnston, M.; Mueller, N.D.; O’Connell, C.; Ray, D.K.; West, P.C.; et al. Solutions for a Cultivated Planet. Nature 2011, 478, 337–342. [Google Scholar] [CrossRef] [PubMed] [Green Version]
  11. Metzger, M.J.; Rounsevell, M.D.A.; Acosta-Michlik, L.; Leemans, R.; Schröter, D. The Vulnerability of Ecosystem Services to Land Use Change. Agric. Ecosyst. Environ. 2006, 114, 69–85. [Google Scholar] [CrossRef]
  12. Foley, J.A.; DeFries, R.; Asner, G.P.; Barford, C.; Bonan, G.; Carpenter, S.R.; Chapin, F.S.; Coe, M.T.; Daily, G.C.; Gibbs, H.K.; et al. Global Consequences of Land Use. Science 2005, 309, 570–574. [Google Scholar] [CrossRef] [Green Version]
  13. Harvey, L.D.D. Resource Implications of Alternative Strategies for Achieving Zero Greenhouse Gas Emissions from Light-Duty Vehicles by 2060. Appl. Energy 2018, 212, 663–679. [Google Scholar] [CrossRef]
  14. Uusitalo, V.; Leino, M.; Kasurinen, H.; Linnanen, L. Transportation Biofuel Efficiencies from Cultivated Feedstock in the Boreal Climate Zone: Case Finland. Biomass Bioenergy 2017, 99, 79–89. [Google Scholar] [CrossRef]
  15. Uusitalo, V.; Leino, M.; Claudelin, A.; Sillman, J. Comparison of Land Use Efficiencies of Different Transportation Energy Systems. In Proceedings of the The 24th International Sustainable Development Research Society Conference: Actions for Sustainable World: From Theory to Practice, Messina, Italy, 13–15 June 2018. [Google Scholar]
  16. O’Malley, J.; Pavlenko, N.; Stephanie, S. Estimating Sustainable Aviation Fuel Feedstock Availability to Meet Growing European Union Demand; International Council on Clean Transportation: San Francisco, CA, USA, 2021. [Google Scholar]
  17. Groom, M.J.; Gray, E.M.; Townsend, P.A. Biofuels and Biodiversity: Principles for Creating Better Policies for Biofuel Production. Conserv. Biol. 2008, 22, 602–609. [Google Scholar] [CrossRef]
  18. Milà i Canals, L.; Romanyà, J.; Cowell, S.J. Method for Assessing Impacts on Life Support Functions (LSF) Related to the Use of ‘Fertile Land’ in Life Cycle Assessment (LCA). J. Clean. Prod. 2007, 15, 1426–1440. [Google Scholar] [CrossRef]
  19. IPBES. The IPBES Assessment Report on Land Degradation and Restoration; IPBES: Bonn, Germany, 2018. [Google Scholar]
  20. Souza, D.M.; Teixeira, R.F.M.; Ostermann, O.P. Assessing Biodiversity Loss Due to Land Use with Life Cycle Assessment: Are We There Yet? Glob. Chang. Biol. 2015, 21, 32–47. [Google Scholar] [CrossRef] [PubMed] [Green Version]
  21. Winter, L.; Lehmann, A.; Finogenova, N.; Finkbeiner, M. Including Biodiversity in Life Cycle Assessment—State of the Art, Gaps and Research Needs. Environ. Impact Assess. Rev. 2017, 67, 88–100. [Google Scholar] [CrossRef]
  22. Vidal Legaz, B.; Maia De Souza, D.; Teixeira, R.F.M.; Antón, A.; Putman, B.; Sala, S. Soil Quality, Properties, and Functions in Life Cycle Assessment: An Evaluation of Models. J. Clean. Prod. 2017, 140, 502–515. [Google Scholar] [CrossRef]
  23. Maier, S.D.; Lindner, J.P.; Francisco, J. Conceptual Framework for Biodiversity Assessments in Global Value Chains. Sustainability 2019, 11, 1841. [Google Scholar] [CrossRef] [Green Version]
  24. Halleux, H.; Lassaux, S.; Renzoni, R.; Germain, A. Comparative Life Cycle Assessment of Two Biofuels: Ethanol from Sugar Beet and Rapeseed Methyl Ester. Int. J. Life Cycle Assess. 2008, 13, 184–190. [Google Scholar] [CrossRef]
  25. De Laurentiis, V.; Secchi, M.; Bos, U.; Horn, R.; Laurent, A.; Sala, S. Soil Quality Index: Exploring Options for a Comprehensive Assessment of Land Use Impacts in LCA. J. Clean. Prod. 2019, 215, 63–74. [Google Scholar] [CrossRef]
  26. Beck, T.; Bos, U.; Wittstock, B.; Baitz, M.; Fischer, M.; Sedlbauer, K. LANCA®. Land Use Indicator Value Calculation in Life Cycle Assessment; Publications Office of the European Union: Luxembourg, 2010. [Google Scholar]
  27. Bos, U.; Horn, R.; Beck, T.; Lindner, J.P.; Fischer, M. LANCA® Characterization Factors for Life Cycle Impact Assessment. Version 2.0; Fraunhofer: Stuttgart, Germany, 2016. [Google Scholar]
  28. Horn, R.; Maier, S.D. LANCA®—Characterization Factors for Life Cycle Impact Assessment: Version 2.5; Fraunhofer: Stuttgart, Germany, 2018. [Google Scholar]
  29. European Commissions. Statistical Pocketbook, EU Transport in Figures; European Commissions: Brussels, Belgium, 2018. [Google Scholar]
  30. ISO 14040; Environmental Management–Life Cycle Assessment—Principles and Framework. International Organization of Standardization: Geneva Switzerland, 2006.
  31. ISO 14044; Environmental Management–Life Cycle Assessment—Requirements and Guidelines. International Organization of Standardization: Geneva Switzerland, 2006.
  32. Koellner, T.; de Baan, L.; Beck, T.; Brandão, M.; Civit, B.; Margni, M.; i Canals, L.M.; Saad, R.; de Souza, D.M.; Müller-Wenk, R. UNEP-SETAC Guideline on Global Land Use Impact Assessment on Biodiversity and Ecosystem Services in LCA. Int. J. Life Cycle Assess. 2013, 18, 1188–1202. [Google Scholar] [CrossRef] [Green Version]
  33. International Organization of Motor Vehicle Manufacturers. Motorization Rate 2015 Worldwide. Available online: http://www.oica.net/category/vehicles-in-use/ (accessed on 15 November 2019).
  34. International Energy Agency Renewables. Market Analysis and Forecast from 2018 to 2023. 2018. Available online: https://www.iea.org/renewables2018/transport/ (accessed on 15 November 2019).
  35. Schmidt, P.; Zittel, W.; Weindorf, W.; Rakasha, T.; Goericke, D. Renewables in Transport 2050—Empowering a Sustainable Mobility Future with Zero Emission Fuels. In 16. Internationales Stuttgarter Symposium; Springer: Wiesbaden, Germany, 2016; pp. 185–199. [Google Scholar]
  36. International Energy Agency. Global EV Outlook 2018, towards Cross-Modal Electrification; International Energy Agency: Paris, France, 2018. [Google Scholar]
  37. Schemme, S.; Samsun, R.C.; Peters, R.; Stolten, D. Power-to-Fuel as a Key to Sustainable Transport Systems—An Analysis of Diesel Fuels Produced from CO2 and Renewable Electricity. Fuel 2017, 205, 198–221. [Google Scholar] [CrossRef]
  38. Uusitalo, V.; Väisänen, S.; Inkeri, E.; Soukka, R. Potential for Greenhouse Gas Emission Reductions Using Surplus Electricity in Hydrogen, Methane and Methanol Production via Electrolysis. Energy Convers. Manag. 2017, 134, 125–134. [Google Scholar] [CrossRef]
  39. World Atlas Top Palm Oil Producing Countries in the World. Available online: https://www.worldatlas.com/articles/top-palm-oil-producing-countries-in-the-world.html (accessed on 11 November 2019).
  40. Harsono, S.S.; Prochnow, A.; Grundmann, P.; Hansen, A.; Hallmann, C. Energy Balances and Greenhouse Gas Emissions of Palm Oil Biodiesel in Indonesia. GCB Bioenergy 2012, 4, 213–228. [Google Scholar] [CrossRef]
  41. Uusitalo, V.; Väisänen, S.; Havukainen, J.; Havukainen, M.; Soukka, R.; Luoranen, M. Carbon Footprint of Renewable Diesel from Palm Oil, Jatropha Oil and Rapeseed Oil. Renew. Energy 2014, 69, 103–113. [Google Scholar] [CrossRef]
  42. Neste Rotterdam Refinery. Available online: https://www.neste.com/corporate-info/who-we-are/production/rotterdam-refinery (accessed on 24 February 2021).
  43. Uusitalo, V.; Havukainen, J.; Kapustina, V.; Soukka, R.; Horttanainen, M. Greenhouse Gas Emissions of Biomethane for Transport: Uncertainties and Allocation Methods. Energy Fuels 2014, 28, 1901–1910. [Google Scholar] [CrossRef]
  44. Global Forest Atlas Boreal Zone; Food and Agriculture Organization of the United Nations: Rome, Italy.
  45. Natural Resources Institute Finland Most Recent Information about Forest Resources in Luke’s Statistical Portal. Available online: https://www.luke.fi/en/news/most-recent-information-about-forest-resources-in-lukes-statistics-portal/ (accessed on 4 November 2019).
  46. Leino, M.; Uusitalo, V.; Grönman, A.; Nerg, J.; Horttanainen, M.; Soukka, R.; Pyrhönen, J. Economics and Greenhouse Gas Balance of Distributed Electricity Production at Sawmills Using Hermetic Turbogenerator. Renew. Energy 2016, 88, 102–111. [Google Scholar] [CrossRef]
  47. Göteborg Energi Gothenburg Biomass Gasification Project, GoBiGas; City of Gothenburg: Gothenburg, Sweden, 2015.
  48. Steubing, B.; Reinhard, J. LCA of the Production of Synthetic Natural Gas from Wood and Consideration to the Optimal Plant Scale. Available online: http://www.lcaforum.ch/portals/0/df36/DF36-3BernhardSteubing.pdf (accessed on 2 November 2019).
  49. Siitonen, S. Benefits and Challenges of Bio-SNG Production. Available online: https://www.vtt.fi/files/projects/vetaani/sari_siitonen.pdf (accessed on 2 November 2019).
  50. Global Solar Atlas. Available online: https://globalsolaratlas.info/ (accessed on 5 December 2020).
  51. Green, M.A.; Dunlop, E.D.; Levi, D.H.; Hohl-Ebinger, J.; Yoshita, M.; Ho-Baillie, A.W.Y. Solar Cell Efficiency Tables (Version 54). Prog. Photovolt. Res. Appl. 2019, 27, 565–575. [Google Scholar] [CrossRef]
  52. Global Wind Atlas Global Wind Atlas. Available online: https://globalwindatlas.info/ (accessed on 5 December 2020).
  53. Schriimeister, S.; von Morstein, O.; Föcker, H. Demonstration Plant Falkenhagen Commissioned/Commissioning Report; European Commission: Brussels, Belgium, 2017. [Google Scholar]
  54. Technical Research Centre Finland Lipasto Unit Emissions Database. Available online: http://lipasto.vtt.fi/yksikkopaastot/indexe.htm (accessed on 10 November 2020).
  55. Lask, J.; Wagner, M.; Trindade, L.M.; Lewandowski, I. Life Cycle Assessment of Ethanol Production from Miscanthus: A Comparison of Production Pathways at Two European Sites. GCB Bioenergy 2019, 11, 269–288. [Google Scholar] [CrossRef] [Green Version]
  56. Fuels Europe. Number of Petrol Stations in Europe. Available online: www.fuelseurope.eu (accessed on 15 November 2020).
  57. Engel, H.; Hensley, R.; Knupfer, S.; Sahdev, S. Charging Ahead: Elecric Vehicle Infrastructure Demand. Available online: https://www.mckinsey.com/industries/automotive-and-assembly/our-insights/charging-ahead-electric-vehicle-infrastructure-demand# (accessed on 15 November 2020).
  58. European Commission. Directive (EU) 2018/2001 of the European Parliament and of the Council, on the Promotion of the Use of Energy from Renewable Resources; European Commission: Brussels, Belgium, 2018. [Google Scholar]
  59. Bos, U. Operationalisierung und Charakterisierung der Flächeninanspruchnahme im Rahmen der Ökobilanz; Fraunhofer: Stuttgart, Germany, 2019. [Google Scholar]
  60. Bos, U.; Maier, S.D.; Horn, R.; Leistner, P.; Finkbeiner, M. A GIS Based Method to Calculate Regionalized Land Use Characterization Factors for Life Cycle Impact Assessment Using LANCA®. Int. J. Life Cycle Assess. 2020, 25, 1259–1277. [Google Scholar] [CrossRef]
  61. Borrelli, P.; Robinson, D.A.; Fleischer, L.R.; Lugato, E.; Ballabio, C.; Alewell, C.; Meusburger, K.; Modugno, S.; Schütt, B.; Ferro, V.; et al. An Assessment of the Global Impact of 21st Century Land Use Change on Soil Erosion. Nat. Commun. 2017, 8, 2013. [Google Scholar] [CrossRef] [Green Version]
  62. Terranova, D.; Balugani, E.; Righi, S.; Marazza, D. An Applicability Assessment and Sensitivity Analysis of Land Use Impact Models: Application of the LANCA Model in Site-Specific Conditions. Int. J. Life Cycle Assess. 2021, 26, 2215–2231. [Google Scholar] [CrossRef]
  63. Thoumazeau, A.; Bustany, C.; Ridrigues, J.; Bessou, C. Using the LANCA® Model to Account for Soil Quality Within LCA: First Application and Approach Comparison in Two Contrasted Tropical Case Studies. IJoLCAS 2019, 3, 1–13. [Google Scholar] [CrossRef]
  64. Searchinger, T.D.; Wirsenius, S.; Beringer, T.; Dumas, P. Assessing the Efficiency of Changes in Land Use for Mitigating Climate Change. Nature 2018, 564, 249–253. [Google Scholar] [CrossRef]
  65. Ram, M.; Bogdanov, D.; Aghahosseini, A.; Khalili, S.; Child, M.; Fasihi, M.; Traber, T.; Breyer, C. European Energy System Based on 100% Renewable Energy—Transport Sector BT. In Mobilität der Zukunft: Intermodale Verkehrskonzepte; Siebenpfeiffer, W., Ed.; Springer: Berlin/Heidelberg, Germany, 2021; pp. 519–562. ISBN 978-3-662-61352-8. [Google Scholar]
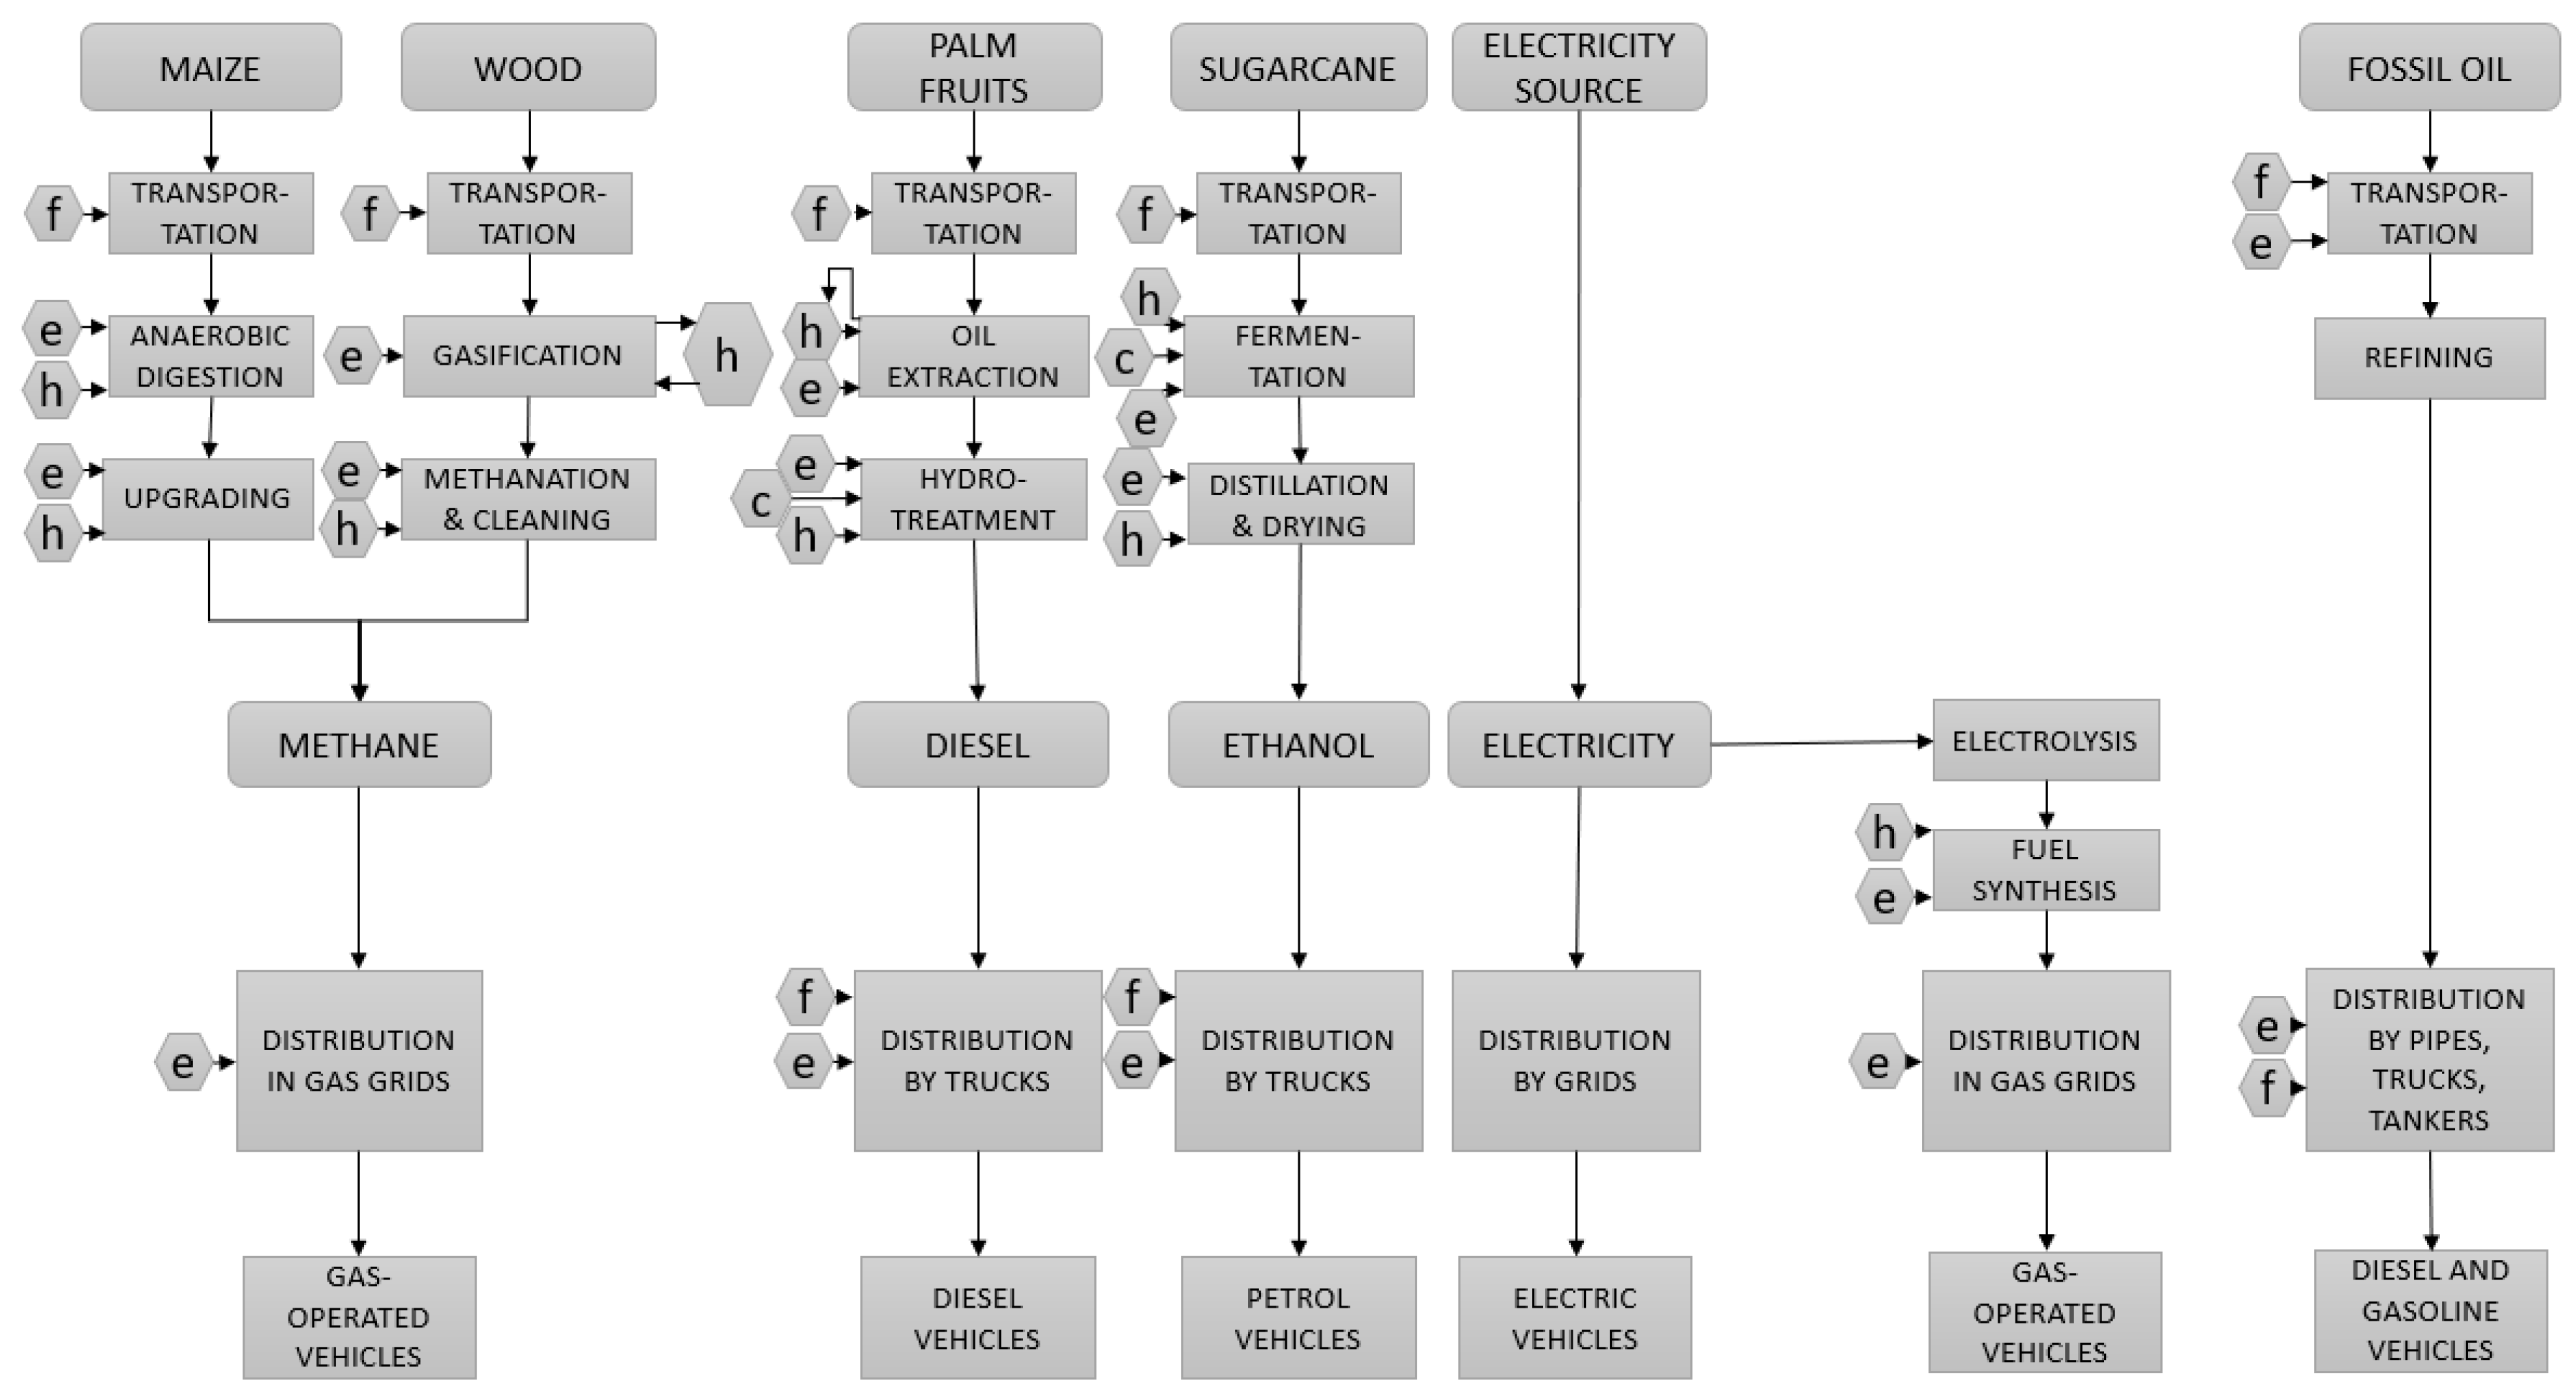
Figure 1. Transportation energy pathways. The abbreviations in the figure are as follows: f for fuel, c for chemicals, e for electricity, h for heat. In distribution by trucks, e refers to electricity used in refueling station, e.g., for pumping.
Sustainability 14 06144 g001
Figure 2. Land occupation and transformation of different energy pathways to produce the annual energy required for driving for a passenger car in the EU.
Sustainability 14 06144 g002
Figure 3. Land use impacts based on LANCA and normalized by the Soil Quality Index approach for transformation of different energy pathways to produce the annual energy required for driving for a passenger car in the EU.
Sustainability 14 06144 g003
Table 1. Transport energy systems selected for this study.
ProductFeedstock and/or Production MethodThe Main Geographical Location of ProductionGeographical Location for the Functional Unit
Fossil fuels
DieselFossil oilDiesel mix at filling stations, EU-28Central EU
GasolineFossil oilGasoline mix at filling stations, EU-28Central EU
Biofuels
DieselHydrotreatment from palm oilSoutheast Asia, MalaysiaCentral EU
EthanolSugarcaneSouth America, BrazilCentral EU
MethaneAnaerobic digestion from maizeProduction mix for EU-28 Central EU
MethaneGasification from woodNorthern Europe, FinlandCentral EU
Electricity
Wind North Sea coastlines, NetherlandsCentral EU
Solar PV (2) Central Europe, GermanyCentral EU
Grid mix Production mix for EU-28Central EU
Grid mix 2030 Production mix for EU-28Central EU
Grid mix 2050 Production mix for EU-28Central EU
Power-to-fuel
MethanePower to methane with DAC (1)Solar PVs in SpainCentral EU
(1) DAC = Direct air capture for CO2. (2) PV = Photovoltaic.
Table 2. Processes which require allocation, allocation methods and share of land use impacts allocated for various products and services [41,56,57].
Process Step with Multiple OutputsAllocation MethodMain Product and Share of AllocationCo-Products and Share of Allocation
Palm oil extractionEnergyVegetable oil (36 MJ kg−1): 80%Kernel oil (36 MJ kg−1): 20%
Renewable diesel productionEnergyDiesel (44 MJ kg−1): 91%Gasoline (44 MJ kg−1), propane (46 MJ kg−1): 9%
Electric car charging Time24 h per year allocated for one car: 0.3%Annual fast charging station, with charging time of 6552 h periods: 99.7%
Table 3. Land use impacts based on the LANCA® method (v2.5) and the Soil Quality Index (as recommended in EF 3.0 for Land Use) for different passenger car energy systems.
Diesel Mix EU28Gasoline Mix EU28Electricity from Photovoltaics DEElectricity from Wind Power NLElectricity Grid Mix EU28Electricity Grid Mix EU28 2030Electricity Grid Mix EU28 2050Methane from PV Electricity ESEthanol from Sugarcane BRBiomethane from Maize Silage DERenewable Diesel from Palm Oil MYMethane from Wood FI
Biotic Production Loss Potential (Occupation) (kg)1.71 × 1028.86 × 1012.09 × 1011.23 × 1009.58 × 1011.60 × 1021.94 × 1029.62 × 1012.28 × 1032.87 × 1031.84 × 1035.16 × 103
Biotic Production Loss Potential (Transformation) (kg/a)6.62 × 10−37.50 × 10−39.87 × 10⁻⁴−1.08 × 10−13.42 × 10−3−3.28 × 10⁻²−5.02 × 10⁻²−5.59 × 10−31.43 × 10−19.37 × 10−35.43 × 10−32.54 × 10²
Erosion Potential (Occupation) (kg)2.55 × 1033.38 × 1024.04 × 1013.71 × 1001.37 × 1021.88 × 1022.24 × 1021.65 × 1024.60 × 1046.95 × 1031.59 × 1051.47 × 102
Erosion Potential (Transformation) (kg/a)−2.27 × 10−1−7.74 × 10⁻²−3.42 × 10⁻¹−8.99 × 10⁻¹−3.25 × 100−3.36 × 100−3.20 × 100−1.26 × 100−2.01 × 100−7.77 × 10⁻¹−4.82 × 10⁻²−5.59 × 10⁻²
Groundwater Regeneration Reduction Potential (Occupation) (m³)1.15 × 1013.27 × 1008.79 × 10−23.01 × 10−21.40 × 1001.81 × 1002.18 × 1004.95 × 10−11.69 × 1021.08 × 1024.11 × 102−3.43 × 101
Groundwater Regeneration Reduction Potential (Transformation) (m³/a)−9.41 × 10−4−4.46 × 10−41.22 × 10−2−6.23 × 10⁻³−6.90 × 10⁻³−8.87 × 10⁻³−9.89 × 10−34.63 × 10−2−1.38 × 10−27.65 × 10−42.04 × 10⁻³−2.71 × 10⁻³
Infiltration Reduction Potential (Occupation) (m³)6.62 × 1034.12 × 1039.00 × 1023.66 × 1013.03 × 1035.33 × 1036.45 × 1034.00 × 1031.15 × 1044.64 × 1047.96 × 1033.58 × 105
Infiltration Reduction Potential (Transformation) (m³/a)−6.76 × 10−24.55 × 10−1−5.76 × 10−11.37 × 10−1−9.52 × 100−8.88 × 100−7.70 × 1006.32 × 1005.40 × 100−9.19 × 10−11.32 × 10−11.78 × 10⁴
Physicochemical Filtration Reduction Potential (Occupation) (mol*a)2.42 × 1031.31 × 1033.80 × 1022.18 × 1011.57 × 1032.66 × 1033.22 × 1031.75 × 1033.26 × 1043.90 × 1042.47 × 1043.85 × 105
Physicochemical Filtration Reduction Potential (Transformation) (mol)−8.06 × 10−21.10 × 10−2−1.77 × 10−11.18 × 10−1−4.31 × 100−3.80 × 100−3.11 × 1006.95 × 10−21.34 × 1001.12 × 10−15.33 × 10−11.92 × 104
EF 3.0 Land Use (Pt)1.57 × 1056.97 × 1041.47 × 1041.97 × 1026.39 × 1041.06 × 1051.29 × 1056.73 × 1042.08 × 1061.94 × 1063.08 × 1065.72 × 106
Publisher’s Note: MDPI stays neutral with regard to jurisdictional claims in published maps and institutional affiliations.