Article

Practical Challenges and Opportunities for Marine Plastic Litter Reduction in Manila: A Structural Equation Modeling

by
Guilberto Borongan
1,2,* and
Anchana NaRanong
1
1
Graduate School of Public Administration, National Institute of Development Administration, Bangkok 10240, Thailand
2
Regional Resource Centre for Asia and the Pacific, Asian Institute of Technology, Klong Luang 12120, Thailand
*
Author to whom correspondence should be addressed.
Sustainability 2022, 14(10), 6128; https://doi.org/10.3390/su14106128
Submission received: 26 March 2022 / Revised: 10 May 2022 / Accepted: 11 May 2022 / Published: 18 May 2022

Abstract

:
Land-based plastic pollution has increased to the level of an epidemic due to improper plastic waste management, attributed to plastic waste flux into the marine environment. The extant marine plastic litter (MPL) literature focuses primarily on the monitoring and assessment of the problem, but it fails to acknowledge the link between the challenges and opportunities for MPL reduction. The study aimed to examine the practical challenges and opportunities influencing the reduction of marine plastic litter in Manila in the Philippines. Data collected through an online survey from 426 barangays were analyzed using structural equation modeling (SEM) and were then validated using interviews and focused group discussions. Good internal consistency (0.917) and convergent and discriminant validity were achieved. The empirical study has established structural model fit measures of RMSEA (0.021), SRMR (0.015), CFI (0.999), and TLI (0.994), with a good parsimonious fit of the chi-square/degrees of freedom ratio of 1.190. The findings revealed that environmental governance regarding waste management policies and guidelines, COVID-19 regulations for waste management, community participation, and socio-economic activities have positively affected marine plastic litter leakage and solution measures. Environmental governance significantly and partially mediates the effects of, e.g., COVID-19-related waste and socio-economic activities on MPL leakage. However, there is no relationship between the waste management infrastructure and environmental governance. The findings shed light on how to enhance environmental governance to reduce marine plastic litter and address Manila’s practical challenges.

1. Introduction

Without coordinated intervention, the annual flow of plastics into the ocean is expected to nearly triple by 2040, from 11 million tons today to 29 million metric tons, globally [1]. Marine plastic pollution presents significant risks to the marine environment and has been attributed to land-based plastic leakage from improper plastic waste management systems. Five ASEAN countries in 2016, including Indonesia (4.28 metric tons (Mt)), the Philippines (1.01 Mt), Vietnam (0.57 Mt), Thailand (1.16 Mt), and Malaysia (0.33 Mt)) are among the top ten countries with this problem in the world, accounting for 28 percent of the land-based marine plastic litter (MPL) that could end up in the ocean [2,3]. As a result, marine plastic litter issues should be addressed in a holistic, land-to-sea approach. According to reports, most ASEAN countries have developed a roadmap for reducing marine plastic litter in accordance with the ASEAN Framework of Action on Marine Debris. The country’s MPL roadmap must be enacted and translated into action at the local and city level.
The Philippines is no exception, ranking third in the world in terms of ocean plastic waste leakage, with 0.28–0.75 million Mt per year (after China and Indonesia, which are first and second, respectively) [4]. Manila Bay, situated in Manila, is where the challenges related to plastic pollution are of great importance nationally and, thus, make headlines globally, as plastic waste that is not properly managed has increased the economic and environmental effects of marine plastics.
Many notable scholars have argued that plastic leakages caused by land-based mismanagement are related to socio-economic activities along the value chain—plastic use and production and domestic and retail consumption, as well as plastic disposal (end-of-life) via unproductive waste management services [3,4]. Willis et al. (2018) [5] evaluated the most effective policies and strategies for reducing plastic pollution and provided a variety of evidence bases for decision-making in addressing the challenges of marine plastic litter and its pressures on the environment, the economy, and society. However, other scholars argue that designing and implementing legitimate, effective, and efficient actions need to be built on a complete understanding of the context of local governance at the city level [6,7]. Effective environmental governance at various levels, e.g., community and/or city level, is, thus, crucial for identifying solutions to the above-mentioned challenges and potential opportunities. The practices, guidelines, policies, and institutions that shape human interaction with the environment are referred to as environmental governance [8] (UNEP Factsheet Series, n.d.). At the global governance forum on 2 March 2022, at the UN Environment Assembly in Nairobi, 175 countries endorsed a historic resolution to end plastic pollution and forge an international, legally binding agreement by the end of 2024. The resolution, entitled “End Plastic Pollution: Toward an internationally legally binding instrument”, stipulated, among other provisions, “an affirmation of an urgent need to strengthen global governance to take immediate actions towards long-term elimination of plastic pollution” [9] (UNEP, 2022). With this global and binding agreement, cities like Manila could properly enforce measures to end this plastic pollution—which needs the political will of the administrators and the participation of the relevant constituents. In addition, action against marine plastic pollution has been linked to the UN’s Sustainable Development Goals (SDGs), such as SDG 6 (regarding clean water and sanitation); SDG 11 (“Make Cities and Human Settlements Inclusive, Safe, Resilient, and Sustainable”); SDG 12 (“Ensure Sustainable Consumption and Production Patterns”); and SDG 14 (“Conserve and Sustainably Use the Oceans, Seas, and Marine Resources for Sustainable Development”). Similarly, shifting to more sustainable production and consumption practices, which are also promoted by the SDGs, has been suggested as a solution to marine litter [7].
Whereas past studies have focused on the context of plastic waste pollution for upstream research activities, such as the circular economy and waste management, the research framework, and coordination, very little research on environmental governance, e.g., laws, administrative measures and action plans, guidelines, and current standards [10]. Yang, Y. et al. (2021) [11] proposed countermeasures, including environmental governance, to accelerate China’s abatement of marine plastic waste. Moreover, their research highlighted the importance of establishing and implementing an accountable and responsible marine plastic waste governance system. To the best of the authors’ knowledge, there has been no empirical research on the relationships between the challenges and opportunities among factors affecting the reduction of marine plastic litter. Although there are studies on the challenges and opportunities for MPL reduction, specifically, the clean-up campaign drive, waste separation, and recycling, most of them are descriptive and qualitative. It is necessary to conduct an empirical investigation into the relationships between factors (challenges and opportunities) affecting the reduction of marine plastic litter. Furthermore, because of the current COVID-19 pandemic there has been an increase in the use of plastics and their subsequent disposal, in the form of personal protective equipment such as face masks, single-use disposable food containers from food delivery services, and e-commerce from online package shipping. Several researchers emphasized how the disruption caused by COVID-19 can be a catalyst for change in global plastic waste management practices in the short and long term [12,13], as they proposed to mitigate the likely impacts of the COVID-19 pandemic on waste management systems.
It is evident that the financial, human, and environmental costs of poor waste management are rising. People living within or near disposal sites, for example, have insufficient access to clean water; tourism development, which is one of the key drivers of economic growth and investment, is linked to the coastal urban ecosystem, which is under threat from plastic found along ocean shorelines and on beaches. The study adds value in contributing to the existing literature for mitigating the challenges of marine plastic litter in coastal cities. Considering the challenges and opportunities for marine plastic pollution reduction, this study aims to examine the practical challenges and opportunities influencing the reduction of marine plastic litter in Manila in the Philippines.

2. Literature Review and Hypothesis Development

2.1. Waste Infrastructure and Environmental Governance

In terms of the changes of administration of most local governments, policy should include de-risking waste infrastructure investment to encourage private sectors to engage. Complex infrastructural systems comprising technologies, regulations, public services, and user practices are required to address urban waste, yet there were no links between waste infrastructure and governance in a previous empirical study [14]. Soltani et al., (2017) [15] report that the ideal waste facility and technology option will fit in with municipality/city objectives, as well as help to save resources in terms of the environmental and financial resources of the community. It was suggested that central and local governments will need to formulate policies to encourage private sectors to invest in their waste infrastructure or technology to effectively reduce MPL [16]. However, Kenisha, G. et al., (2017) [17] conceded that in terms of MSW facilities and infrastructures, public acceptance is vital to ensuring the effectiveness of waste strategies; the authorities in the municipality and city need to seek a practical approach in engaging communities and stakeholders in the decision-making process. Nevertheless, there is a need for waste infrastructure with local governments in public spaces for the effective and efficient implementation of SWM policy, e.g., waste bins along the shoreline or beaches; this will be part of the environmental governance actions at the city and barangay levels. Building on the literature, we propose the following hypothesis:
Hypothesis 1 (H1):
The available waste infrastructure (WInfras) will positively affect environmental governance (EG).

2.2. Environmental Governance Related to COVID-19 Waste

The contemporary literature suggests that environmental governance on some specific types of municipal waste has visibly increased during the COVID-19 pandemic, when communities and cities experienced the highest generation of waste for plastic packaging and food waste. While this situation has put additional pressure on waste management systems, it has proven useful in terms of insights for city administrations and municipal utilities on consumption patterns during emergency situations. Moreover, Benson, Fred-Ahmadu, et al. (2021) [18], and [19] Shiong et al. (2021) provided insights on plastic waste management status, especially PPE, during the COVID-19 pandemic—which emphasized the sudden spike of medical waste that has had a large impact on plastic waste management. Conversely, Benson, Bassey, et al. (2021) [20] suggested that designated waste separation facilities be provided at marked points in different areas to collect used PPEs—as part of the urgent need for effectively handling COVID-19-related healthcare waste. We observe from the above-mentioned studies that environmental governance is associated with emerging issues on COVID-19 waste management; however, there is no empirical research on the correlations between this challenge and MPL reduction. Based on these earlier studies, we propose the following hypotheses:
Hypothesis 2 (H2):
Environmental governance regarding the “management of COVID-19-related healthcare waste” (EGcv) will positively affect existing environmental governance (EG).
Hypothesis 3 (H3):
Environmental governance regarding the “management of COVID-19-related healthcare waste” (EGcv) will positively affect marine plastic litter solution measures (MPLr).

2.3. Community Participation

Regarding the community participation factor, GESAMP 2019 [21] reports an overview of key value-chain stages corresponding to stakeholders/interest groups, and the consequences of environmental plastics connected to each value stream and level. Conversely, Deutsche Gesellschaft für Internationale Zusammenarbeit (GIZ) [22] reported the fundamentals of extended producer responsibility (EPR) for packaging and the many roles that stakeholders might play in the plastic packaging value chain. The study goes through numerous possibilities for allocating duties, as well as the actions that must be followed to reach an agreement and lay the groundwork for the implementation of an EPR system. Producers, retailers, distributors, consumers, and local and central governments are key stakeholders in the plastic packaging value chain, e.g., most local governments are responsible for the collection of plastic packaging [23]. Wilson et al., 2015 [24] demonstrate that the SWM system is made up of two intersecting “triangles”, one for physical variables such as collection, recycling, and disposal, and the other for governance factors such as inclusion, financial sustainability, sound institutions, and proactive policies. Experience confirms the utility of indicators in allowing comprehensive performance measurement and comparison of both “hard” physical components and “soft” governance aspects, and in prioritizing the “next steps” in developing a city’s solid waste management system, by identifying both local strengths that can be built on and weak points that must be addressed [5,24,25,26]. The private sector, a powerful actor, is able to negotiate and adjust regulations for its own benefit [27]. The waste policy also has a contemplative and encompassing responsibility to the private sector in order that manufacturers, distributors, and importers who are contributing market products, which are eventually turned into waste, should also be responsible for contributing to the recycling or disposal cost. Implementation of the planned interventions needs commitment not only from the government but also from the public and private sectors [28]. Based on the above studies, we proposed the following hypotheses:
Hypothesis 4 (H4):
Community participation (CParty) is positively related to environmental governance (EG).
Hypothesis 5 (H5):
Community participation (CParty) is positively related to marine plastic litter leakage (MPLe).

2.4. Socio-Economic Activities Related to MPL Pollution

Large volumes of plastic litter are transported to the sea or ocean through rivers, adding to the serious environmental, economic, and social issues of marine litter contamination [29]. The study by Adam et al. (2021) [30] emphasizes the effect of residents’ attitudes and behaviors regarding single-use plastics in Ghana’s coastal cities of Accra and the Cape Coast. The significance of their results for reducing marine single-use plastic pollution includes policies and programs, particularly those that are behavioral in character and are built on the idea that the public has a variety of emotions and behaviors. Socio-economic activities differ depending on “socio-demographic factors” (e.g., gender), political orientation, marine contact factors (e.g., maritime occupations and participation in coastal recreation activities). There is a great deal of evidence that plastic has a harmful influence on marine wildlife and ecosystems [31]. Moreover, marine plastic litter is having an increasing influence on the environment, human health, and economies in the South Pacific [32]. However, the study findings demonstrate how general attitudes about climate change can influence both climate policy support and personal climate mitigation behavior in both direct and indirect ways, giving crucial insights useful for research and policy-making. From the previous studies discussed herein, we propose the following hypotheses:
Hypothesis 6 (H6):
Socio-economic activities (SEas) are positively associated with environmental governance (EG).
Hypothesis 7 (H7):
Socio-economic activities (SEas) are positively associated with marine plastic litter solution measures (MPLr).
Hypothesis 8 (H8):
Socio-economic activities (SEas) are positively associated with marine plastic litter leakage (MPLe).

2.5. Manila Public Behavior Related to MPL Pollution

The types and origins of marine plastic litter vary greatly, ranging from direct losses from recreational and commercial ships and vessels in seas and rivers to indirect losses produced by land-based sources in conjunction with the plastic value chain [29]. Several distinguished scholars have argued that plastic leakage caused by land-based mismanagement is related to plastic use and production and to domestic and retail consumption, as well as plastics disposal (end-of-life) via unproductive waste management services [3,4]. Asia has driven the growth in plastic production over recent decades. It is now the leading plastic consumer in this region, with per-capita plastic use growing at a faster rate than in other regions. The year 2017 saw the global production of 348 million tons of plastic [33] and in the next two decades, the total volume of plastics that will be produced is projected to double [34]. As a result of ocean currents, the leaked ocean plastic waste can potentially travel lengthy distances to other areas and countries—which makes it transboundary in nature. Plastic waste pollution has even started to travel to isolated places, leading to the current challenge and making its prevention globally significant [3]. There is evidence that marine plastic pollution has a substantial economic impact, especially on “fisheries, aquaculture, recreation, and heritage values”. Moreover, marine litter has a negative impact on Small Island developing states, owing to their limited waste disposal infrastructure. According to researchers, marine plastic waste has a spillover effect on aquatic marine life, posing severe health concerns for aquatic marine life and maybe even to humans if they consume it. However, the problem is exacerbated by population increase, economic industrialization, a lack of tools to improve collection rates, and the existence of landfills in metropolitan areas, which has a detrimental influence on public health [32,35,36,37]. Based on the previous studies, we propose the following hypotheses:
Hypothesis 9 (H9):
Manila public litter behavior or the MPL problem (SE) is positively associated with marine plastic litter leakage (MPLe).
Hypothesis 10 (H10):
Manila public litter behavior or the MPL problem (SE) is positively associated with marine plastic litter solution measures (MPLr).

2.6. Environmental Governance

Environmental governance brings forth the underlying institutional theory [38], which tends to be associated with the institutional environment, such as the political, cultural, and social processes. While environmental governance on SWM or marine plastic litter exists, waste and marine plastic pollution is governed by actors beyond formal government; however, it is not clear from the policy statements and documents how the various actors in the different spheres of governance interact. An amalgamation of institutional theory and resource dependence theory underpins this to enhance the strength of the theories utilized for enhancing environmental governance in the local context. Oliver’s contribution reveals how institutional and resource-dependence theories can be combined to discover a variety of strategic and tactical responses to the institutional environment and other elements [37]. While Oti-Sarpong, K., et al. (2022) [39] used institutional theory to examine the factors driving the increased use of offsite manufacturing to construct new housing in selected countries, their findings highlight the need for more institutional theory research into off-site manufacturing to better understand path dependence. We used these theories to investigate the relationship between environmental governance and resource availability in barangays and in the city of Manila for tackling SWM and marine plastic litter. The mentioned amalgamation of theories averred an integrated solution for the abatement of MPL. It is worthy of note that researchers continue to uncover vital approaches to the momentum of the diffusion of knowledge to aid decision-makers in addressing marine plastic pollution challenges, in order that they would, in turn, be able to assist the community and city. Previous studies have supported the evolution of environmental governance grounded on historical screening, on a level and integration that cannot be reflected upon without consideration of the temporal aspect [40]. However, Whiteman, A., Smith, P., and Wilson (2001) [41] explicitly elaborated on environmental governance to assess the performance of the three main aspects of governance, such as inclusivity of stakeholders, financial sustainability, and sound institutions and proactive policies. On the other hand, Glasbergen (1998) [42] “identifies and describes five main models of environmental governance, these include: regulatory, market regulation, civil society, co-operative, contextual control, and self-regulation”. The works of Willis et al. (2018) [5] suggest that the combined solution of the applied model to reduce waste volumes includes litter prevention, recycling, and illegal dumping—which result in the significant reduction of plastic waste in the local government’s coastal areas [5]. Furthermore, previous research suggests that municipalities or cities that invest and/or spend on waste management, as well as on a fund for coastal initiatives, have reduced the waste burden in their coastal areas. Other scholars, such as Breukelman et al. (2019) [43], acknowledge that more research is needed using diagnostic analysis regarding the failure of SWM services in the cities of developing countries to better enable interventions to address impacts such as marine plastic litter. “The success of a city’s SWM system can be used as a proxy indication of excellent governance,” according to one scholar. Most of the existing literature has stressed that the key practical challenge in SWM is a lack of data and data consistency when comparing cities. Moreover, the existing literature calls for indicator sets for integrated sustainable waste management (ISWM), for benchmarking SWM effectiveness in developed and developing cities, particularly for monitoring applications [23,44]. Based on the previous peer-reviewed research, we proposed the following hypotheses:
We postulate that the impacts of EG on COVID-19 waste management (EGcv) and socio-economic activities (SEas) on MPL leakage (MPLe) are mediated by environmental governance (EG), as follows.

2.6.1. Mediated Effects

Hypothesis 11 (H11):
Environmental governance (EG) mediates the relationship betweenEG on COVID-19 waste management (EGcv) and MPL leakage (MPLe).
Hypothesis 12 (H12):
Environmental governance (EG) mediates the relationship between socio-economic activities, the marine litter problem (SEas), and MPL leakage (MPLe).

2.6.2. Direct Effects

Hypothesis 13 (H13):
Environmental governance, in terms of strategies, guidelines, and implementation procedures (EG), will positively affect marine plastic litter solution measures (MPLr).
Hypothesis 14 (H14):
Environmental governance, in terms of strategies, guidelines, and implementation procedures (EG), will positively affect marine plastic litter leakage (MPLe).

2.7. Marine Plastic Pollution (MPL) Solution Measures

In terms of solution measures factor, Wu, (2020) [45] argued that rapid urbanization and industrialization cause a great deal of industrial and municipal waste, triggering environmental and human health issues. The impact leakage pathway framework explained by Alpizar et al. (2020) [29] identifies important policies for institutional aspects. However, scholars argued that legislation has improved waste-related practices in businesses, as it was observed that waste legislation is fragmented, and taxation incoherent [46,47,48]. It was contended that the abatement of marine litter generation will work directly at the local source (including sweeping, collection, single-use bag bans, and other activities) through financing and contracting out solid waste management systems. This stage should include educational campaigns, efforts toward litter reduction, cleanup activities, and law enforcement mechanisms [49]. In fact, the success of devices such as deposit–refunds is largely determined by consumers’ willingness to compensate for waste-related environmental damage [50]. Binetti et al. (2020) [32] suggested measures to minimize single-use plastic, enhance collection, reuse, and recycling, as well as creating public awareness campaigns, which might considerably reduce marine litter.

2.8. MPL Leakage

GIZ explicitly described cases in most of the ASEAN developing countries where most of the “uncollected plastic waste is either burned or disposed of into waterways, thus leading to the partial leakage of such plastic waste into rivers”. Marine litter comes from sources on land (UNEP, 2016) [51] and its localized abundance is linked to urbanization and the levels of waste management infrastructure, as well as to recreational activity [4,10]. People using the riverside as a recreational area, residents without access to adequate waste infrastructure, people illegally disposing of litter, wastewater treatment plant outlets or sewage overflow, and the plastic-producing or plastic-processing industry are all sources of anthropogenic litter at riversides. However, several studies have indicated an increase in waste volumes downstream of bigger urban areas, and many of these sources are linked to densely populated places (i.e., cities or urban spaces) [3,52,53,54,55,56].

Multigroup Effects

Hypothesis 15 (H15):
The positive relationship between socio-economic activities (SEas—plastic pollution problem) and MPL leakage is stronger for females.

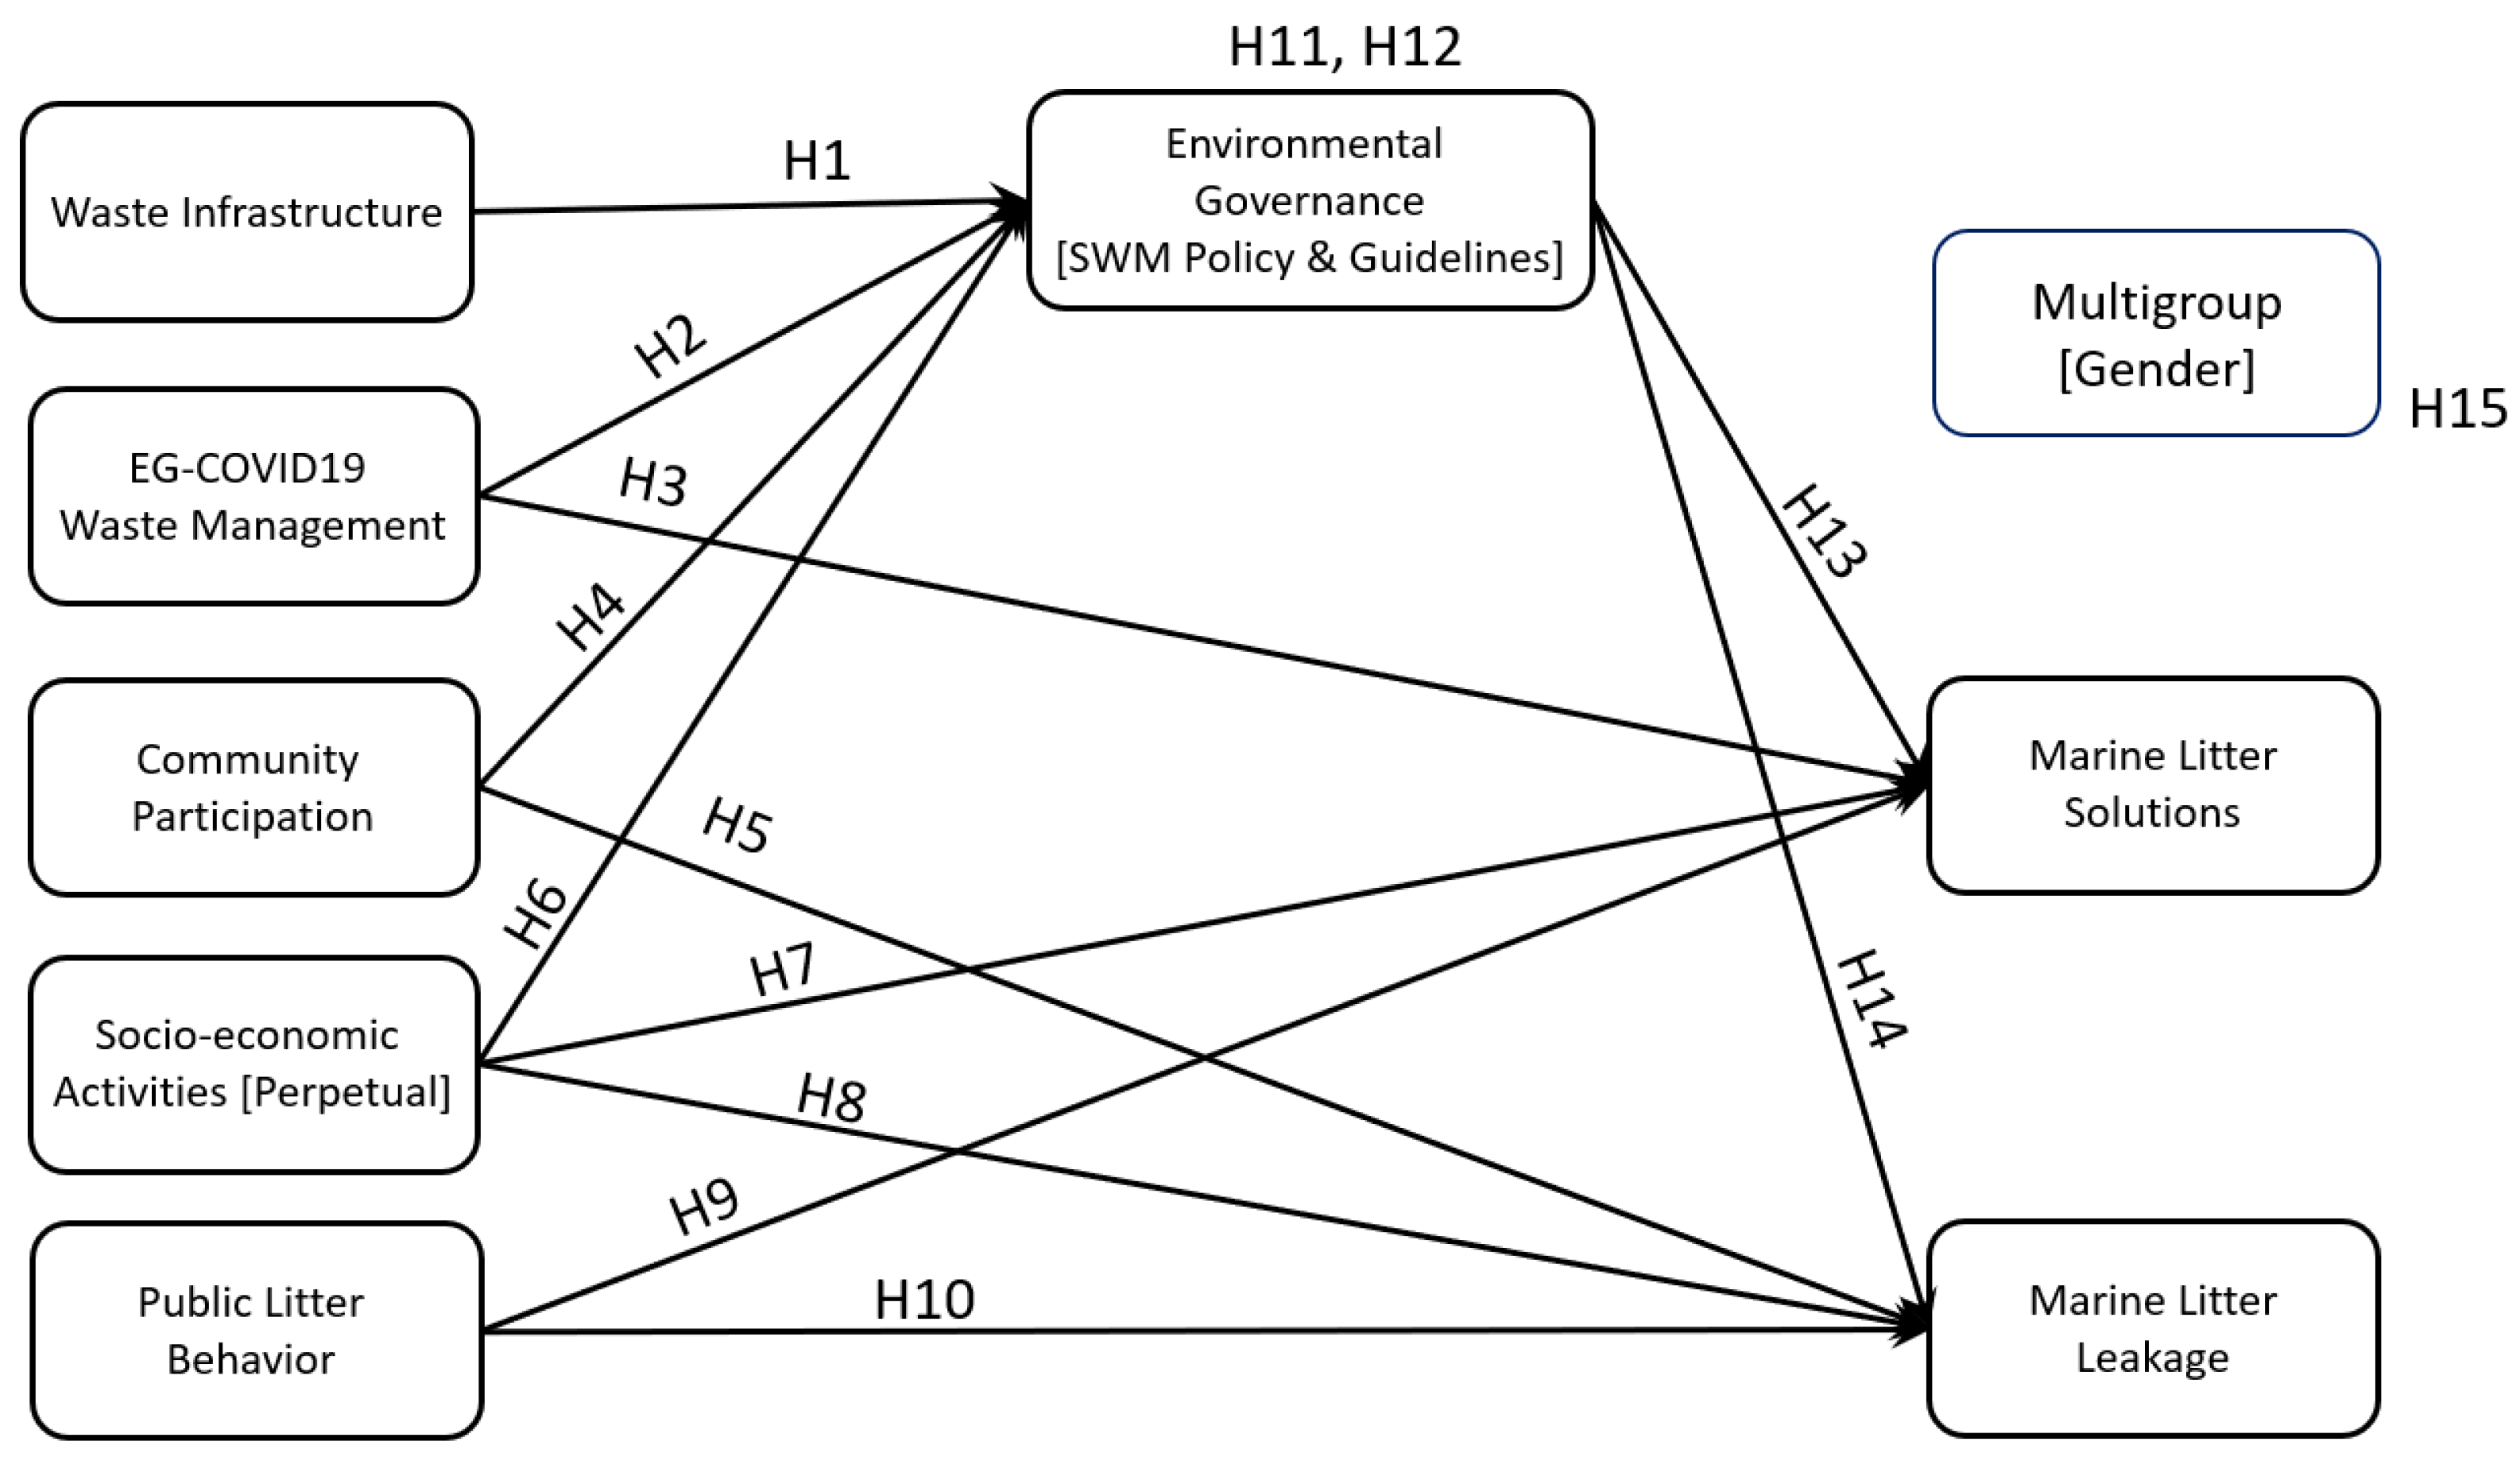
2.9. Theoretical Framework of MPL Reduction

Based on the literature, we established the following model, showing the practical challenges that influence the endogenous variables that marine plastic litter solution measures (MPLr) and marine plastic litter leakage (MPLe) may impact, with exogenous variables; this is anchored in institutional theory and resource dependence theory. Practical challenges include waste infrastructure, community participation, physical socio-economic activities, and, with environmental governance as a mediating variable, the need to address the mentioned specific research questions in the case of Manila in the Philippines (shown in Figure 1). The theoretical framework depicted in this section was used for the SEM analysis.

2.10. Structural Equation Modeling

Structural equation modeling (SEM) establishes the link between the measurement model and the structural model, based on the assumptions supported by theory. Factor analysis and linear regression are combined in this method of SEM [57]. The difference between regression and SEM decision-making approaches is that regression models are additive, whereas structural equation models are relational. Structural equation modeling also investigates the direct and indirect effects of mediators in the relationship between the independent and dependent variables, in order to support the acceptance or rejection of a hypothesis.
In line with the developed theoretical framework of marine plastic litter reduction (shown in Figure 1) and the existing literature presented in this paper, the model provides a framework to address the research questions: (1) Can the practical challenges of waste infrastructure, environmental governance, community participation, socio-economic activities and public litter behavior empirically influence the reduction of marine plastic litter in Manila? (2) What are the drivers of marine litter within Manila and the Philippines context? (3) What are the long-term opportunities for the reduction of marine plastic litter in Manila?

3. Materials and Methods

3.1. Manila Demography and SWM

A case study of Manila is the focus of this paper. Manila is the Philippines’ capital and the country’s most densely populated city. In 2015, Manila had a population of 1.78 million people. Manila is divided into 896 urban barangays, the Philippines’ smallest unit of local government. Each barangay has its own councilors and chairperson. All of Manila’s barangays are divided into 100 zones for administrative purposes, which are then divided into 16 administrative districts. There is no local government in these zones and districts. Trade and commerce are the city’s pillars. North Manila, which is located on the upper portion of the Pasig River, and South Manila, which is located on the lower portion of the river, have distinct characteristics. Manila Bay and Laguna de Bay are connected by the Pasig River, which is about 25 km long. Over 2000 factories and 70,000 families live in makeshift shelters along the river’s banks [58]. These bodies of water may have the potential for MPL littering and leakage to the ocean if environmental governance is not effectively acted upon.
Manila’s waste generation accounts for 69.87% of waste from residential sources, while 25.73% is commercial, 1.19% is institutional, 0.19% is industrial, 1.56% is from markets and 1.45% is from street-sweeping (2015 baseline data, [59] Manila DPS, 2020). For waste composition from household and non-household sources, kitchen waste was 39.73%; this was followed by plastic waste at 17.75%, and 9.04% of paper waste, among other wastes [59]. This indicates that the plastic waste stream is quite high in a highly urbanized city like Manila. In the Philippine MSW definition, waste components are composed of biodegradable, recyclable, special waste, and residual waste, wherein the Manila waste composition is at 50%, 32%, 13%, and 5%, respectively. In the baseline data in 2015, Manila has 0.607 kg/capita/day of waste generation, with an annual waste generation of 376,008.40 Mt per year [59]. Of this, 67.69% of waste was sent to landfills, while 32.31% was diverted waste. Through a private contract with the private sector, the city of Manila has a 100% coverage clean-all solid waste collection and disposal system. The Department of Public Services is responsible for the city’s solid waste management and environmental sanitation, under the direct supervision of the department head. The organizational structure of the DPS comprises four (4) divisions and six (6) district offices, to enhance the efficient dispensation of DPS activities. All municipal rules and ordinances related to solid waste management and other environmental problems in the city of Manila are implemented and enforced by the DPS.
Manila’s governance structure is governed by the City Solid Waste Management Board (CSWB), which was established in 2000 in accordance with the Philippine Ecological Solid Waste Management Act. The city has a 10-year SWM plan that has been approved (2015–2024). The City Mayor (Chairman), City Administrator (Vice-Chairman), and Head of DPS, among other relevant constituents, must actively participate in the CSWB’s specialized responsibilities and functions [59]. The Department of Public Services is in charge of enacting and enforcing all municipal rules and ordinances relating to solid waste management and other environmental issues in Manila (DPS). Over the years following its approval, the city legislators created and approved the necessary city ordinances, in accordance with the Ecological Solid Waste Management Act of 2000 (R.A. 9003). Executive Orders issued by the mayor (past and present) serve as a backbone for enjoining the involvement and commitment of the city and barangay authorities to implement, enforce, and support all local legislation related to SWM and environmental preservation.

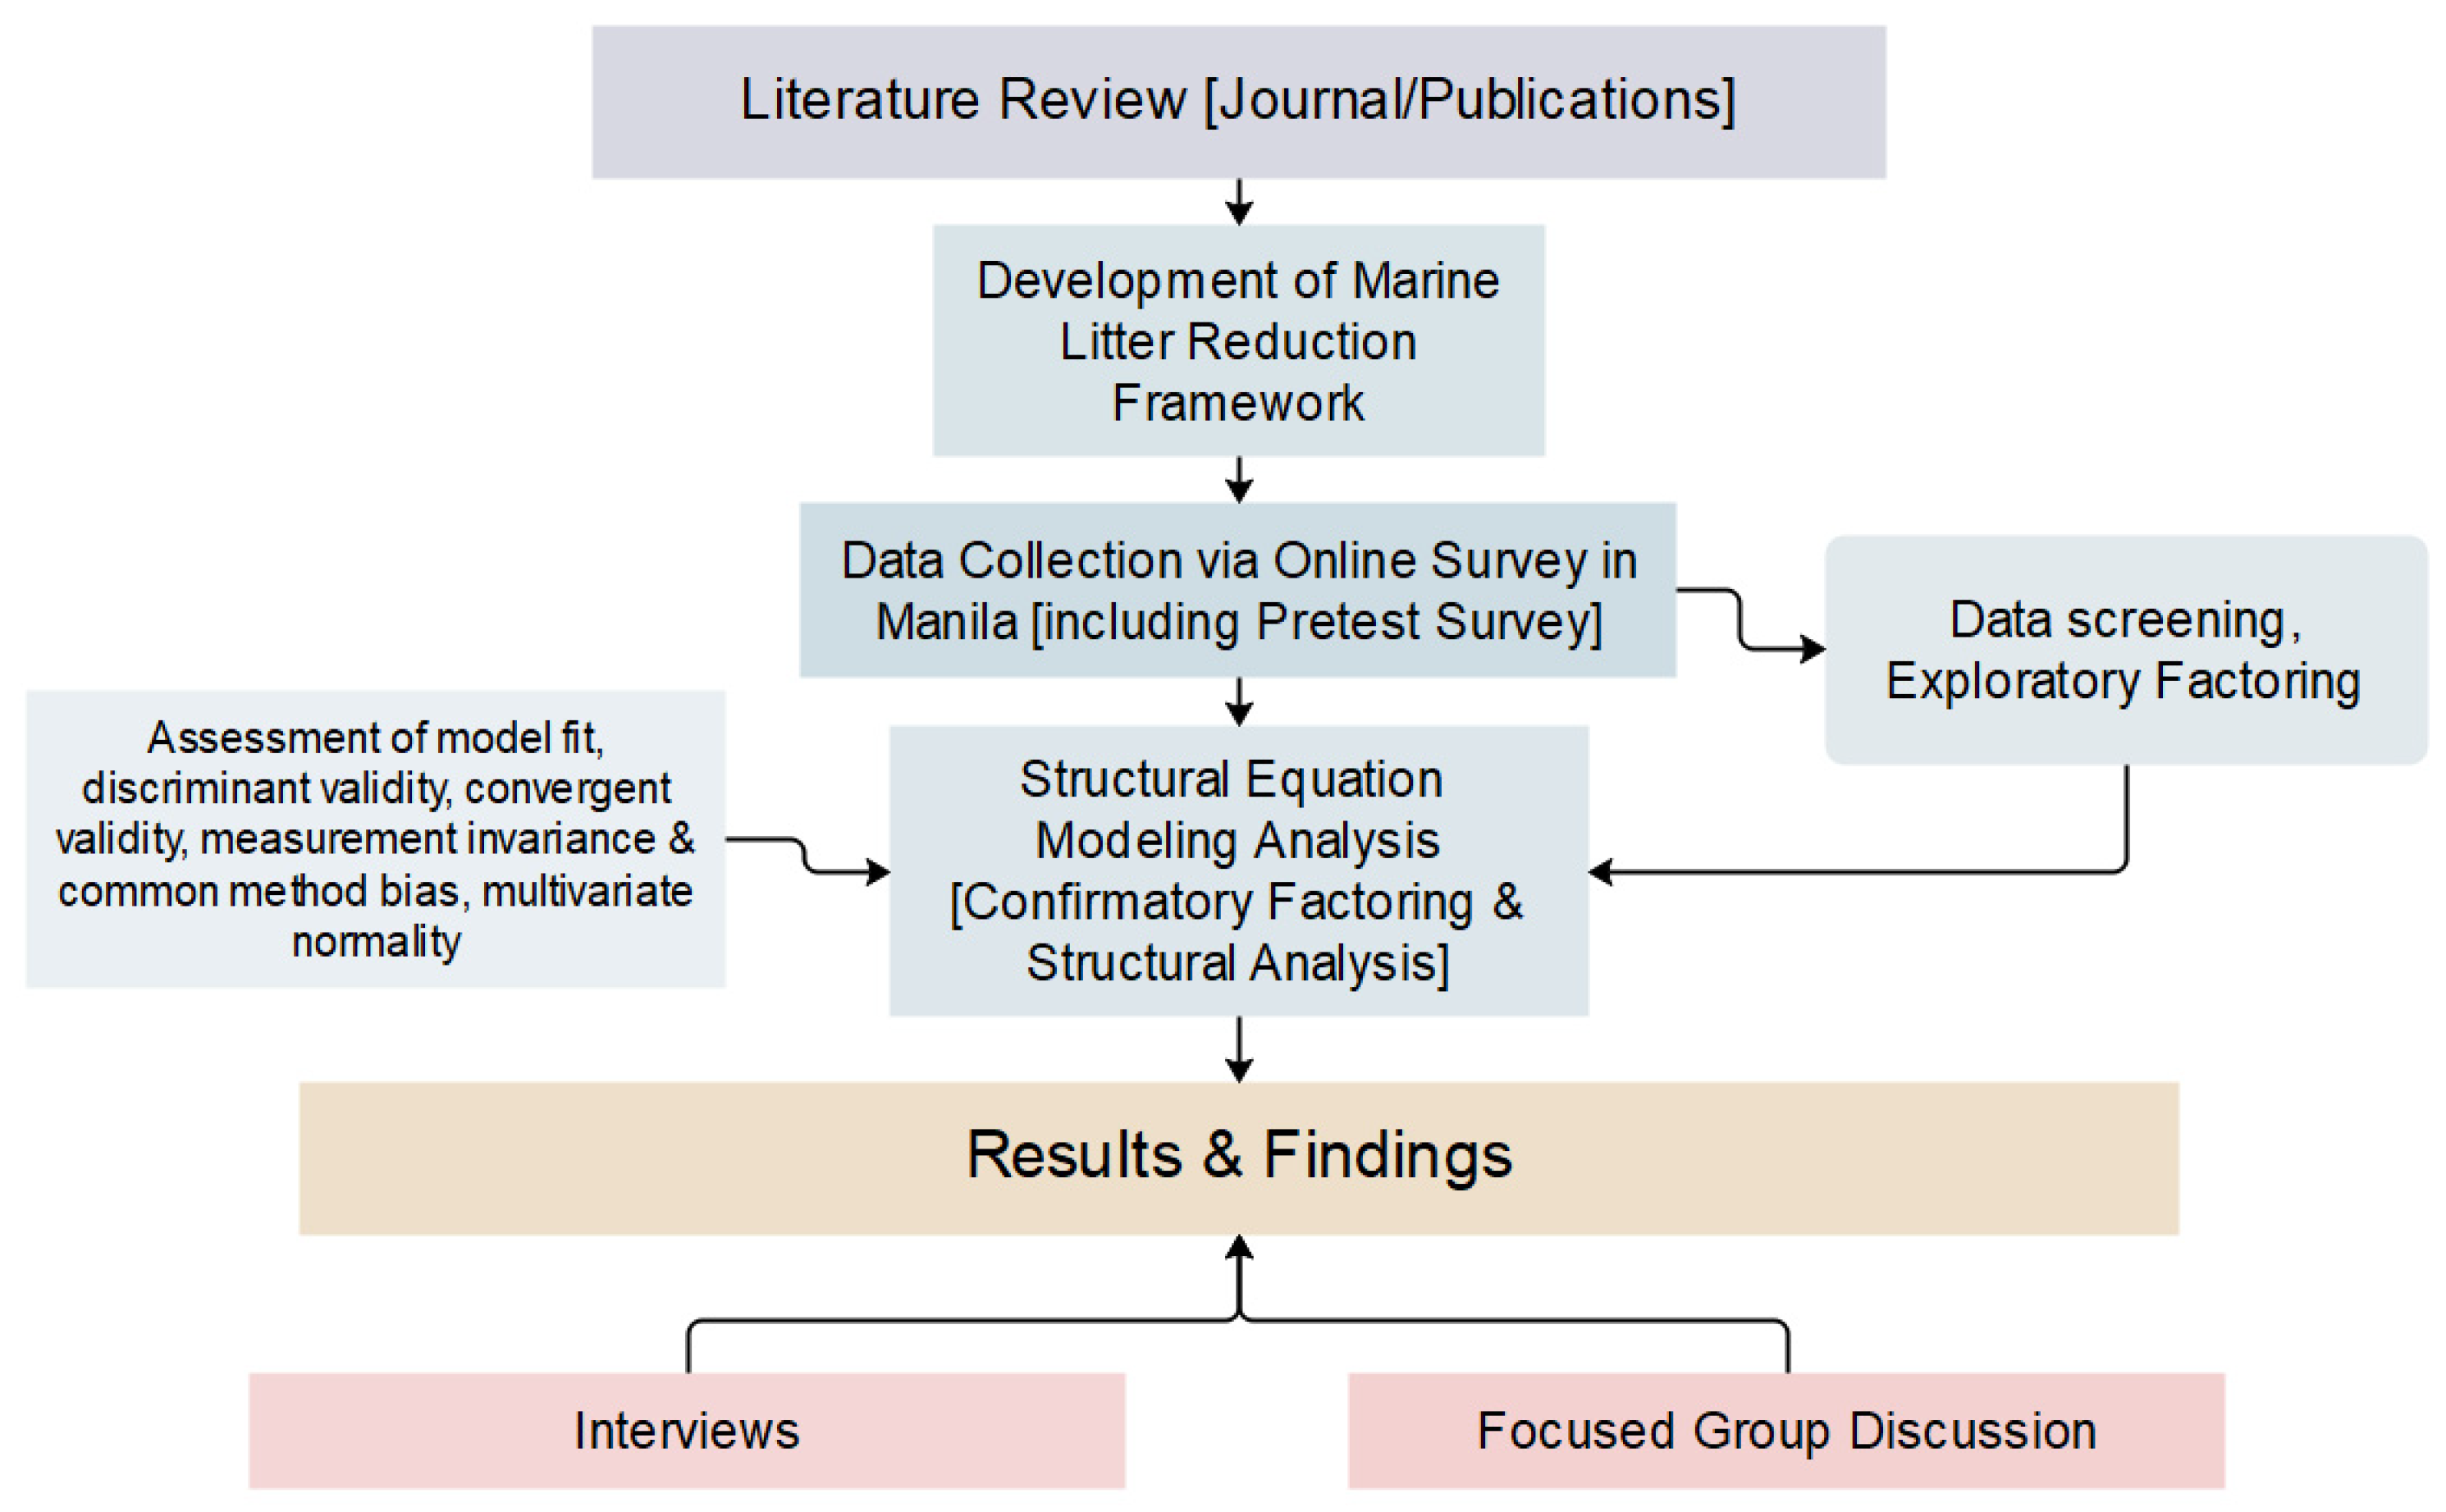
3.2. Framework Development, Data Collection, and Analysis

The conceptual framework process diagram in Figure 2 depicts the process flow of the empirical quantitative SEM method and qualitative approach used in this study, which began with the literature review phase. Data were gathered using a Google form for an online survey. The study’s survey items were adapted from previous studies (as described in Table 1) [3,4,5,29,30,32,34,35,60,61,62,63,64] related to the reduction of solid waste management and marine plastic litter from land-based sources. Additional survey items were developed and adapted from the Philippine interim COVID-19 waste management guidelines. Structural equation modeling was used to analyze the collected data. A pre-test survey was also conducted prior to the formal online survey distribution. Using the MPL reduction framework, we used exploratory factor analysis, confirmatory factor analysis, and structural equation modeling (SEM) analysis. The findings and suggested recommendations for the study were quantitatively analyzed using an empirical SEM method, validated through interviews and focused group discussions (FGD) in Manila with the relevant constituents/experts in SWM in the Philippines.

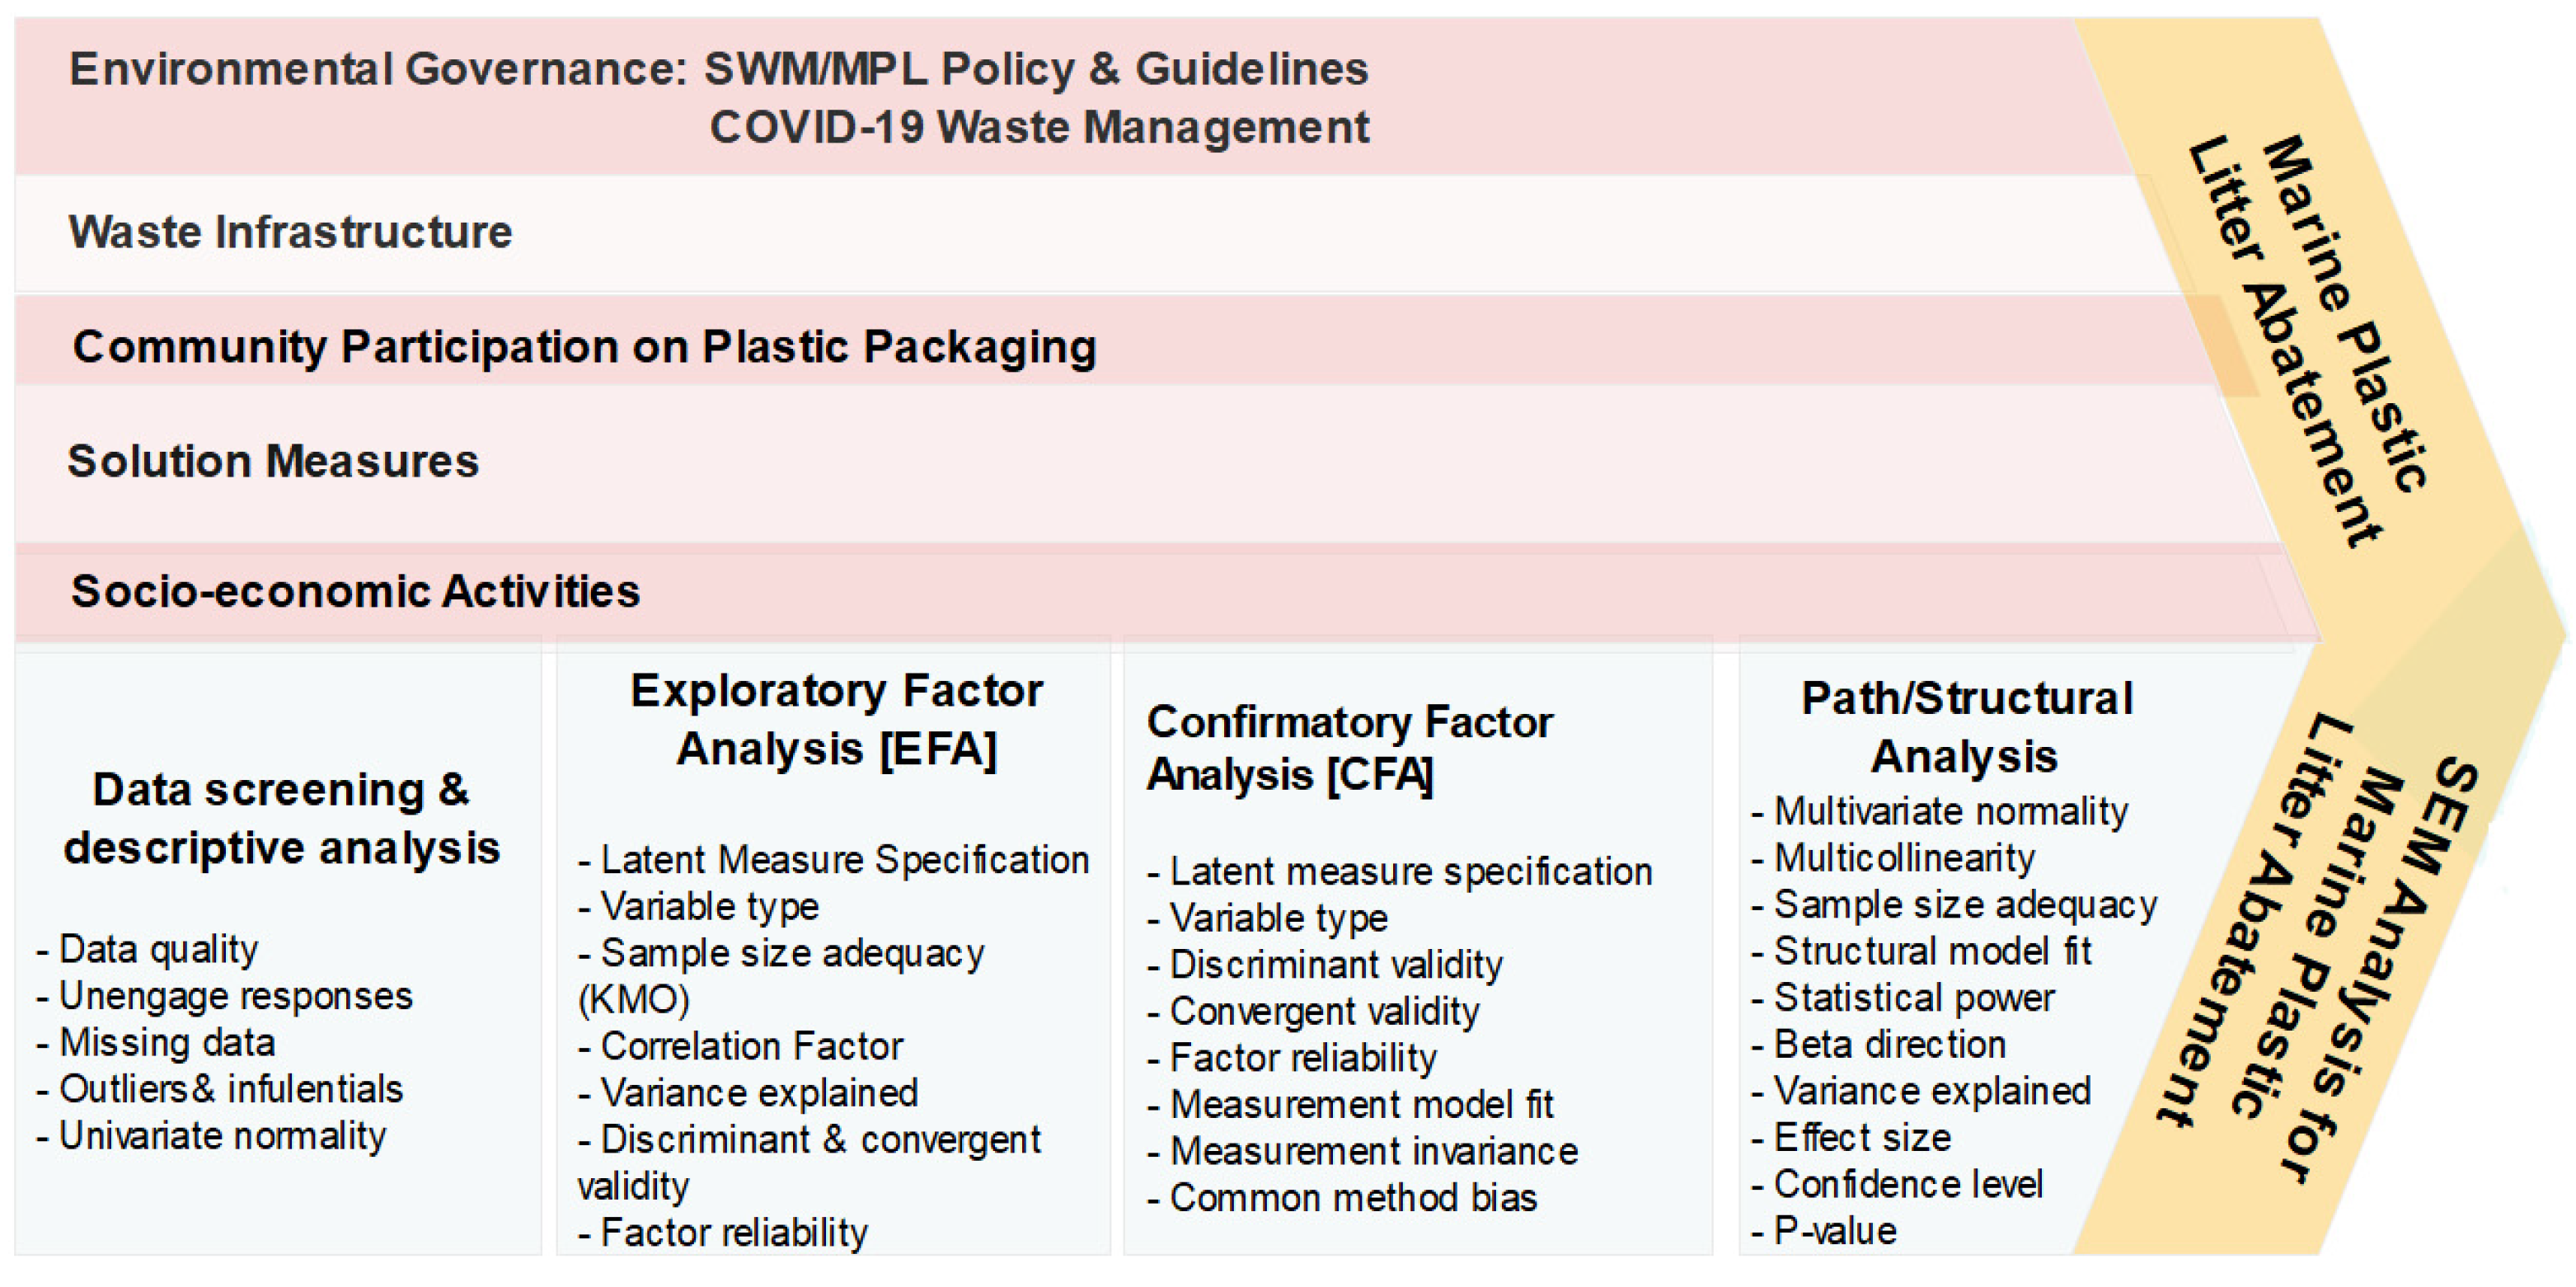
3.3. Data Analysis Methods for the MPL Reduction Framework

Figure 3 depicts the SEM analytical process at various stages of the analysis, including data screening, EFA, CFA, and the structural analysis of the manifest variables used in the article (both exogenous and endogenous variables). Starting with data screening and descriptive analysis, exploratory factor analysis (EFA), confirmatory factor analysis (CFA), and the path/structural analysis—covariance-based SEM method, the latent variables of socio-economic factors, environmental governance, community participation, waste infrastructure, and other latent variables were plugged into MPL as an abatement latent variable using SEM analysis. An online pre-test survey was conducted with 79 samples of 51 survey items in August 2021, to determine the appropriateness and fit of the use of the survey in the Manila local government unit (LGU) and respective barangays. The reliability statistics of the 79 cases have a Cronbach’s alpha value of 0.907. Any additions and revisions of the terms and statements for respondents regarding the usage of terms and ease of understanding of the survey items were performed. The formal online survey questionnaire, using Google Forms, was distributed in the period from 12 to 30 September 2021 to a total of 800 barangays and other Manila respondents. This sample size fits the recommendation of MacCallum, R. C., Browne, M. W., and Sugawara (1996) [67], who suggested a larger case-to-variable ratio. The actual total number of samples collected comprised 456 responses from barangays and Manila DPS respondents. These experiment samples were screened and processed to identify omissions, unengaged responses, and irrelevant items. Finally, 426 out of the 456-questionnaire sample size were processed and analyzed for the study.
A random sampling method was performed to collect data from the study population, who were asked to rate the 62 indicators based on their level of agreement, using a four-point Likert scale (e.g., anchored at 1 = strongly disagree, 2 = disagree, 3 = agree, and 4 = strongly agree).
An examination of the reliability of the instrument was necessary. For this reason, an attempt was made to check the item-total score correlations, indicating that items with higher correlations are better instruments [68]. At this stage, 62 interval Likert scale indicators and 28 categorical Likert items were utilized for the survey.
The marine plastic litter reduction framework was used to draw out suggested policy and action implications and address the research questions of the study. Moreover, the conceptual framework was validated through interviews and focused group discussions (conducted from 15 November to 10 December 2021) in Manila and with relevant Philippine SWM experts. Target participants for the virtual interview and FGD were the assistant city government head and technical staff from Manila DPS, a representative from the barangays, the NSWMC Officer in Charge, selected SWM contractors from the private sector, and NGOs/Civil Society “Solid Waste Association of the Philippines” (SWAPP) and Academe members working on SWM and marine plastic litter reduction. The contacts and/or email addresses that were used for the interview and FGD (through Google Meet and the WEBEX platform) came from the author’s existing established network in Metro Manila, the endorsement of the Manila Department of Public Services, and the League of Cities in the Philippines, as well as from the Philippine National Solid Waste Management Commission (NSWMC).

4. Results and Discussion

4.1. Demographic Characteristics of the Respondents

The demographic characteristics of the Manila respondents are illustrated in Table S1 (in the Supplementary Materials). Demographic information includes gender (male (35.7%) and female (64.3%)) and age group in years (under 25 years old (28.6%), 25–34 (28.6%), 35–44 (26.8%), 45–54 (12%), and over 55 years old (4%)). Most of the respondents have completed undergraduate studies (52.8%), while respondents completing secondary-level education and graduate studies are 24.2% and 23%, respectively. Most of the respondents who took part the survey had a range of income of PHP 10,001–15,000 (pesos) (40.8%). Of the respondents, 92.7% (395) were affiliated by their work to the barangay units, followed by Manila DPS at 4.7%, with 0.2% of representatives from an association/NGO. Similarly, 62.7% (267) of respondents were barangay secretaries who completed the survey forms on behalf of their respective barangay units, while 24.9% (106) of respondents were barangay chairmen/chairwomen, followed by barangay councilors at 8.9% (38). It is important to note that the Barangay Solid Waste Management Committee is composed of the barangay chairman, councilor, secretary, and barangay technical staff members—in line with the R.A. 9003. The number of years of affiliated work (in barangays and Manila LGU) of most of the respondents was 56.6% (241) with under 5 years, followed by 23.7% (101) with 6–10 years, 9.9% with 11–15 years, 5.2% with 16–20 years, and 4.7% with over 20 years of work. The target population of barangays in Manila is 896 barangays. The target sample size was determined to be 277 samples (barangays), which is substantially more than 200 samples, as determined, and was collected in a distributive pattern in demographic barangays/zones in Manila. The larger number of samples was not only desirable for adequate data collection but was intended to be segmented in separate analyses by barangays/zones demographics while still maintaining a credible sample size. In addition, as in the requirements for SEM in Amos version 28, the sample size is adequate to run the CFA and structural model.

4.2. Descriptive Statistics

A total of 62 socioeconomic, environmental governance and MPL variables were used to gauge the respondents’ level of agreement. The majority of the respondents expressed their satisfaction with most of the indicators. Factors of socio-economic perception related to Marine Plastic Pollution (MPL) had a mean (M) range of 2.44–3.64, and a standard deviation (SD) range of 0.494–0.819, with a level of agreement of “strongly agree”. MPL plastic leakage attributes (MPLe) have a mean (M) range of 3.19–3.37 and a standard deviation (SD) range of 0.615–0.662, which indicates a level of agreement of “very much”. In terms of socio-economic factors, public littering behavior had a mean range of 3.53–3.65 and an SD range of 0.517–0.546, which suggests a level of agreement of “very important”. The waste infrastructure (WInfras) was represented by 3 indicators, of which 3 indicators scored lower mean values at 2.41–2.60 and a standard deviation range of 0.901–0.988, suggesting a level of agreement of “low incidence to medium incidence”. Community participation regarding plastic packaging has a mean range of 3.48–3.65 and an SD range of 0.543–0.610, indicating a level of agreement of “very much”. Environmental governance related to policies and strategies/guidelines (EG) mean range was 2.73–2.89, with an SD of 0.705–0.842, suggesting a level of agreement of “medium compliance”. Environmental governance related to COVID-19 waste (EGcv) has a mean range of 3.16–3.26 and an SD range of 0.647–0.693, suggesting a level of agreement of “medium compliance”. MPL solution measures (MPLr) provided a mean range of 3.22–3.48 and an SD range of 0.595–0.702, indicating a level of agreement of “extremely likely”. Most of the indicators referring to socio-economic factors, MPL, environmental governance, and MPL solution measures reported good mean scores and standard deviations.

4.3. Assessment of Multivariate Normality and Multicollinearity

Before the EFA was performed, tests of multivariate normality and multicollinearity were conducted using SPSS 23. The observed values in the P-P plot are closely parallel to the straight line, indicating that the observed values are similar to what we would expect from a normally distributed dataset [69]. Skewness and kurtosis results do not exceed between +2 and −2 (see Table S2 for the data mean, standard deviation, skewness, and kurtosis). Furthermore, no correlation coefficient value greater than 0.8 was identified for any of the observable indicators in the correlation matrix [70]. Hence, multicollinearity is not a problem with these data.

4.4. Verifiability of Latent Factors

Principal component analysis (PCA) was performed using the ProMax rotation for the 62 manifest indicators in exploratory factor analysis (EFA), to assess the dimensionality of the environmental governance, socio-economic activities perception, and MPL indicators. The total variance explained by the thirteen (13) distinctive factors extracted was 68.02%, with an eigenvalue greater than 1.0 (see Table S2: Factors in MPL reduction with mean, SD, skewness, kurtosis, factor loadings, and Cronbach’s alpha in the Supplementary Materials). There were no correlations greater than 0.7, indicating convergent validity and discriminant reliability. The overall Cronbach’s alpha value was 0.917 for 62 manifest indicators, which is above the suggested benchmark of 0.6 [71,72]. All the commonalities in this study are above 0.400. There are 84 (3.0%) non-redundant residuals with absolute values greater than 0.05 in the residuals computed between the observed and replicated correlations, indicating that non-redundancy residual measures are not a concern.

4.5. Validity and Reliability Results

The KMO measure of sampling size adequacy value of 0.896 in this study is a great or meritorious degree of common variance [70,73]. The Bartlett test of sphericity tests the null hypothesis that the original correlation matrix is an identity matrix. The correlations between indicators were substantial enough for PCA, according to a statistically significant Bartlett’s test of sphericity (p < 0.05) [74,75]. For these data values, Bartlett’s test is highly significant (χ2 (20,143.984) = 2628, p < 0.000); thus, it is safer and appropriate to proceed with factor analysis and CFA. For validity tests in the exploratory factor analysis, 13 latent factors with 62 indicator variables were extracted with eigenvalues of 13.377 to 1.010 and account for 68.022% of the covariance among the manifest variables (as shown in Table S2: Factors in MPL reduction with mean, SD, skewness, kurtosis, factor loadings, and Cronbach’s alpha). Forty-seven (46) manifest variables were retained, while 16 indicator variables were removed, in conformity with the assumptions.
The nine (9) latent factors retained were MPL solution measures (13 manifest items), SE attributes (6 manifest items), MPL leakage (5 manifest items), community participation (5 manifest items), environmental governance: SWM policies (5 manifest items), EG on COVID-19 waste management (4 manifest items), socio-economic activities A (4 manifest items), waste infrastructure (3 manifest items) and socio-economic activities B (2 manifest items). From the extracted latent factors, manifest variables in environmental governance in the case of Manila—SWM policies, financial resources, and community participation—were combined based on the PCA (see Table S2: Factors in MPL reduction with mean, SD, skewness, kurtosis, factor loadings, and Cronbach’s alpha). Overall, Cronbach’s alpha of nine (9) latent factors for the 426 cases was 0.917. The individual latent factor reliability results have a Cronbach’s alpha of MPLr (0.957), SE (0.879), MPLe (0.885), CParty (0.913), EG (0.900), EGcv (0.904), SEas (0.780), WInfras (0.791), and SEc (0.708), respectively. The 9 latent factors have coefficient loadings greater than 0.500 (as illustrated in Table S2: Factors in MPL reduction with mean, SD, skewness, kurtosis, factor loadings, and Cronbach’s alpha values) were utilized in the study. Thus, we have a reliable and valid instrument with very good internal consistency.

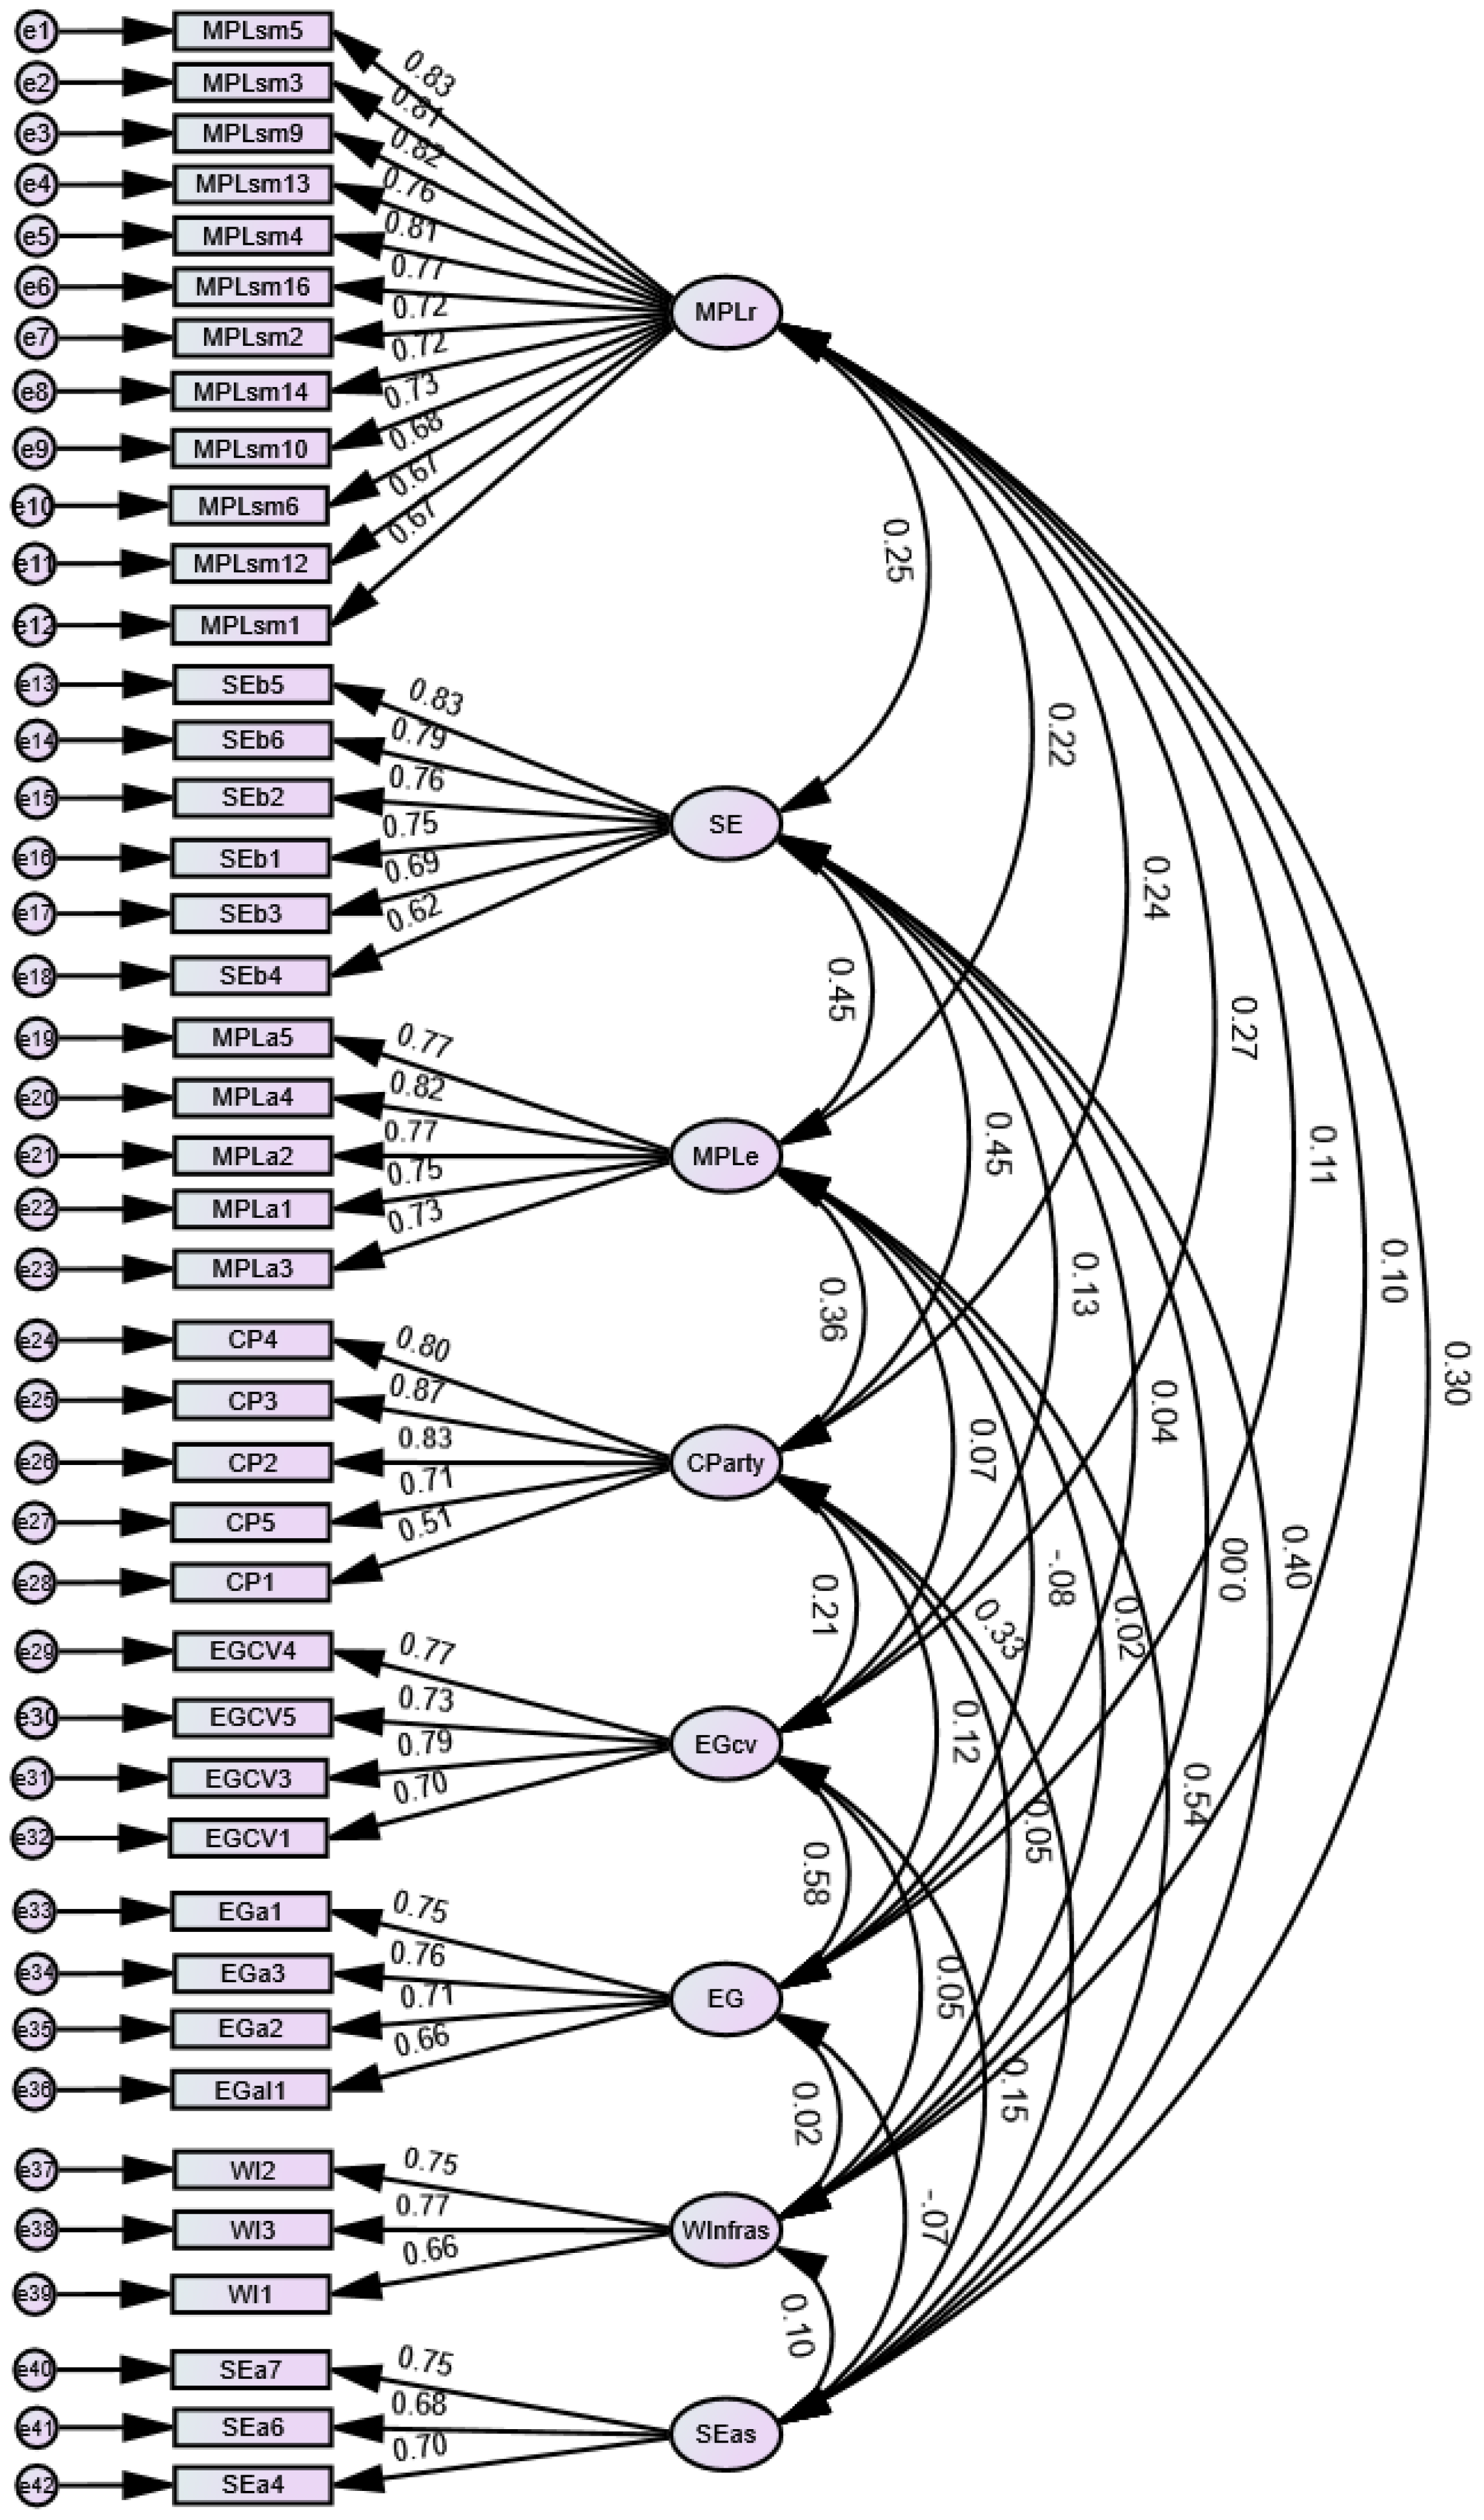
4.6. Confirmatory Factor Analysis

To examine the validity of the latent variables, confirmatory factor analysis (CFA) was performed. This “concept relates to the degree to which a scale or collection of measures accurately represents the topic of interest,” according to [70,73]. Convergent validity, discriminant validity, and content validity are all requirements of the CFA measurement model. The degree to which two scales of the same issue are correlated is measured by convergent validity [70]. For each construct or latent factor, the convergent validity was checked by computing the average variance extracted (AVE), standardized regression weight (SRW), and composite reliability (CR) [76]. All standard regression weights (factor loadings) in the measurement model were significant at p < 0.001, in the range of 0.514–0.871. The minimum level of acceptability for all factor variables was greater than 0.30 [74]. An AVE of 0.5 or above is required to evaluate the measurement model’s convergent validity. The square root of AVE, which must be larger than the latent variable correlations, is used to assess the discriminant validity [77]. The discriminant value must be greater than the correlation between the latent variables.

4.6.1. Measurement Model Fit Assessment

Using AMOS version 28, SEM was utilized to assess the measurement model fit through confirmatory factor analysis (CFA) of the study on enhancing environmental governance for MPL reduction in Manila in the Philippines. The model fit measures were unconstrained, and the chi-square goodness-of-fit test was significant [78], with χ2/df = 1.507, and p-value < 0.001. The RMSEA was excellent at 0.035 and the pClose test was not significant (p-value of 1.000), with a GFI of 0.885, for which the ideal is greater than (>) 0.95. The CFI (0.956), IFI (0.957), and TLI (0.952) were greater than (>) 0.95, while SRMR was 0.042 (see Figure 4). MPL reduction measurement model). Even though the values for GFI and AGFI do not exceed the threshold value of > 0.9, “they still met the requirements as suggested by [79,80] where the value is acceptable if above 0.800”. All fit indices of the measurement model of the latent factors were above the recommended threshold values [81], as shown in Table 2. Appropriately, the measurement model fit of the 8 latent factors and observed variables was found to be very satisfactory. Even though the p-value of the measurement model is significant (p < 0.05), “the model is strongly affected by the large sample size and dependent on the complexity of the current measurement model (sensitive to a complex model and large sample size)”. The current measurement model does not employ unnatural constraints to the set of measures. Thus, the overall model fit indices for the measurement model, suggest a very good model fit.

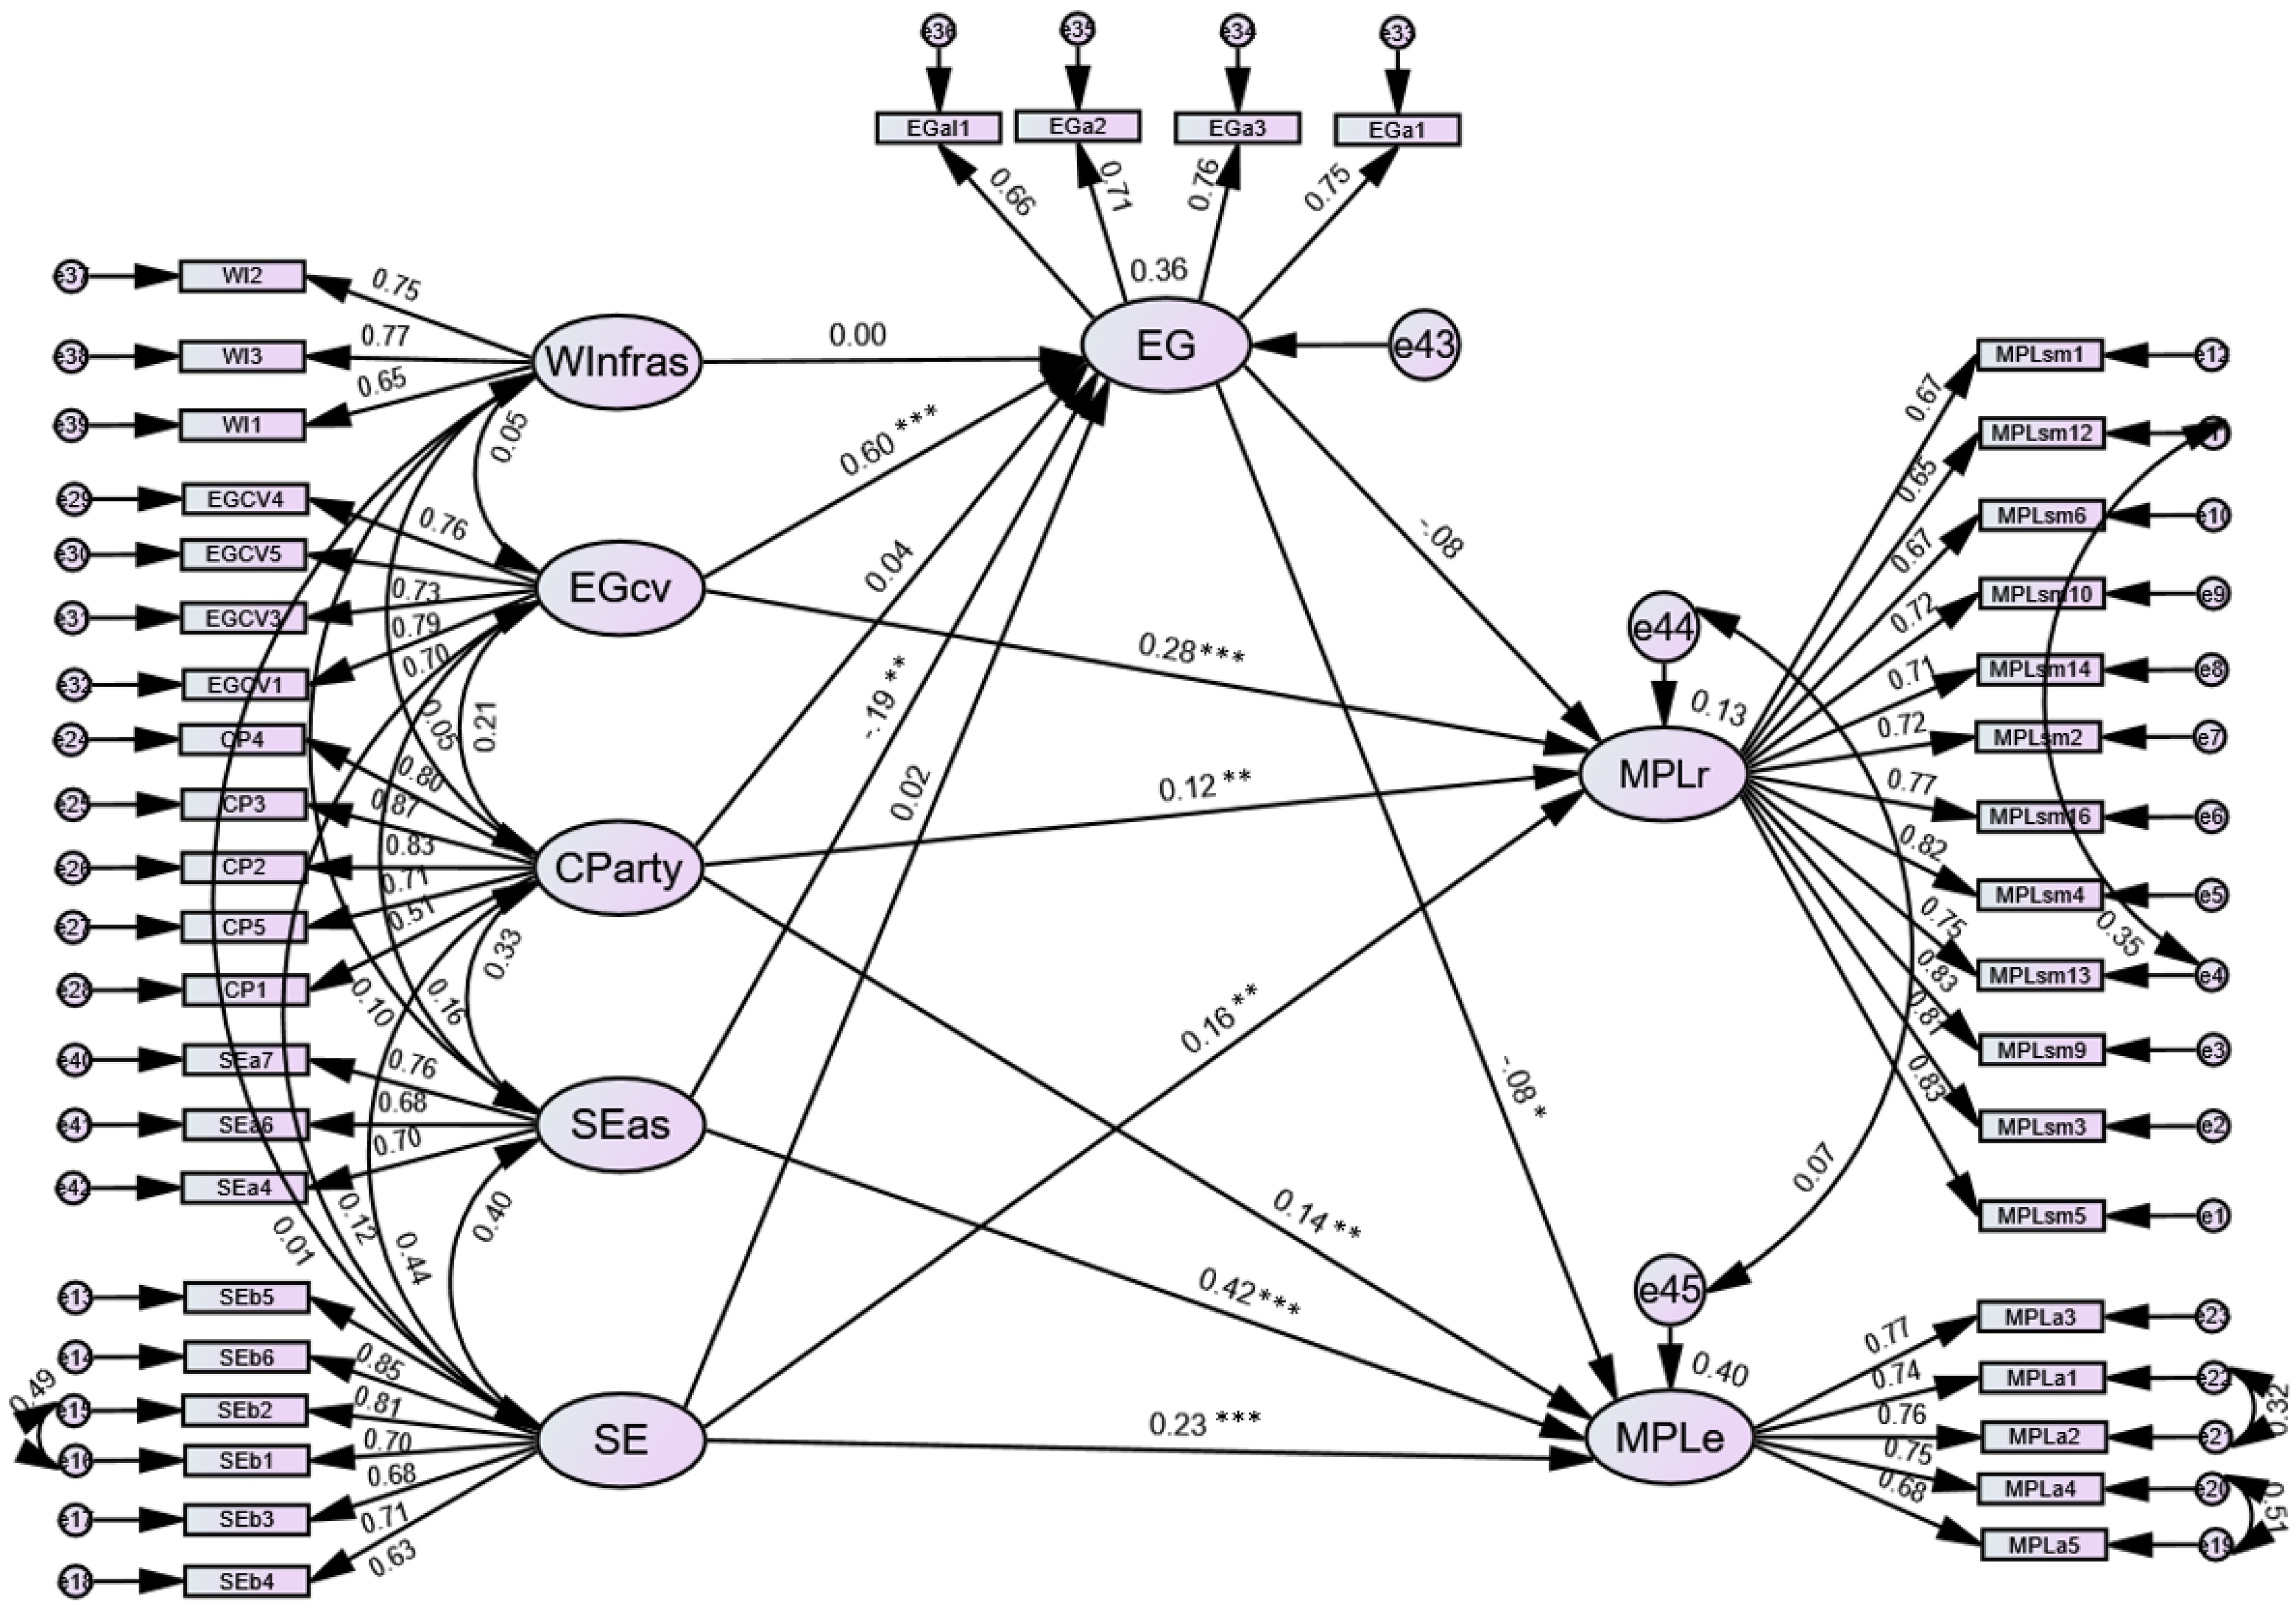
4.6.2. Measurement Model

The critical ratio (C.R.) value describes the statistics established by “dividing an estimate by its standard error”. In this study, since a sample size of 426 Manila barangays is adequate for CFA, the critical ratio resembles a normal distribution. In that case, a value of 1.96 indicates two-sided significance at the “standard” 5% level. The null hypothesis is rejected since the critical ratio (CR) for a regression weight is more than (>) 1.96, indicating that the path is significant at the 0.05 level, indicating that all the estimates (for respective latent factors to the manifest variables) were statistically different from zero, as indicated in Table S3: Results of the measurement model (CFA) for the manifest and latent variables.
All of the parameter estimates were positive and within the allowed range of values of 1.00; these corresponding manifest variables were all significant at p < 0.001. The path coefficient for the latent factor (MPLr) to the 12 manifest variables, with standardized regression weights, was within the range of 0.653 to 0.816 (as illustrated in Figure 5 and Table S3). These results, according to [82] Hair, J., Sarstedt, M., Hopkins, L., and G. Kuppelwieser (2014), established the validity and reliability of the manifest variables. The path coefficient for the SE latent factor to the 6 manifest variables and the standardized regression weights were within the range of 0.631 to 0.848. These results, according to Hair et al., (2014) [82] established the validity and reliability of the manifest variables. The path coefficient for the MPLe latent factor to the manifest variables was significant at p < 0.001 and the standardized regression weights were within the range of 0.658 to 0.820. The path coefficient for CParty latent factor to the manifest variables (CP4, CP3, CP2, CP5, CP1), and the standardized regression weights were within the range of 0.514 to 0.870. The path coefficient for the EGcv latent factor to the manifest variables (EGCV4, EGCV5, EGCV3, and EGCV1), and the standardized regression weights were within the range of 0.698 to 0.792. The path coefficient for the EG latent factor to the manifest variables and the standardized regression weights were within the range of 0.658 to 0.763. The path coefficient for the WInfras latent factor to the manifest variables and the standardized regression weights were within the range of 0.655 to 0.769. The path coefficient for the SEas latent factor to the manifest variables (SEa7, SEa6, SEa4) was within the range of 0.683 to 0.750 (as illustrated in Table S3). These results, according to Hair, J., Sarstedt, M., Hopkins, L., and G. Kuppelwieser (2014) [82] established the validity and reliability of the manifest variables.

4.6.3. Convergent and Discriminant Validity

Convergent and discriminant validity in the study was assessed using the Fornell and Larcker criterion and Heterotrait-Monotrait (HTMT) ratio. We observed the convergent and discriminant validity of the latent variables EGcv, MPLr, SE, MPLa, CParty, SEa, EG, and WInfras for our study in Manila, as evidenced by a convergent AVE of above 0.500. The discriminant is the square root of the AVE of the respective latent variables greater than the correlations, and reliability was evidenced by a composite reliability (CR) value above the threshold of 0.700. Cronbach’s alpha and composite reliability were used to assess the construct reliability. Cronbach alpha was found to be higher than the required limit of 0.70 for each construct in the study [83]. Using the Fornell-Lacker criterion, diagonal elements (in bold) show the average shared-squared variance (ASV) between the latent variables and their measures (AVE). Off-diagonal elements are the correlations among latent variables. For discriminant validity, diagonal elements are larger than off-diagonal elements, as illustrated in Table 3.
While the recommendation of examining shared variance to assess discriminant validity by Fornell, C., and Larcker, (1981) [84] was once widely accepted, recent research has begun to raise questions about how sensitive this test is in capturing discriminant validity issues between constructs [85]. Following that, the heterotrait–monotrait ratio of correlations (HTMT) technique was proposed as a modern approach to determining the discriminant validity between constructs.
The HTMT method compares the correlations of indicators across constructs to the correlations of indicators within a construct, examining the ratio of between-trait correlations to the within-trait correlations of two constructs [85]. Assumptions for HTMT value should be below (<) 0.85 [86] and 0.90 [77]; discriminant validity has been established between 8 reflective constructs (as illustrated in Table 4). Hence, the current measurement model has NO validity and reliability concerns in the latent variables; internal consistency was established with good Cronbach’s alpha values.

4.6.4. Assessment of Multi-Group Invariance

Group invariance was performed through configural, metric, and scalar invariance tests. We utilized the male and female groupings to test the invariance of the current measurement model. The results indicated that the configural invariance was good, as evidenced by the excellent model fit measures when estimating two groups freely, e.g., without constraints. Metric invariance was also excellent, as evidenced by a non-significant p-value of 0.567 (indicating invariant), a chi-square difference test between the unconstrained (χ2 of 2732.194, df. of 1914) and fully constrained models (χ2 of 2775.935, df. of 1960) where the regression weights were constrained. Scalar invariance has also an excellent result, with a p-value of 0.496 for the model measurement intercepts; hence, the current model is invariant.

4.6.5. Common Method Bias

When differences in responses are generated by the instrument rather than the actual tendencies of the respondents that the instrument aims to reveal, a common method bias (CMB) occurs, especially if the study is perpetual (e.g., opinions, perceptions). In other words, the instrument introduces a bias; hence, there are variances, which were analyzed in this research study in Manila. After conducting the validity test of the CFA, the common latent factor (CLF) was plugged into each manifest variable and the CMB was run in AMOS version 28. In the analysis of the CMB, the model fit was checked to fulfill the assumption measures. The difference between the standard regression weights of the common latent factor (CLF) in the zero-constrained model and the standard regression weights of the CLF (unconstrained model) was computed. The result difference of all regression weights is less than (<) 0.2 [87,88], indicating that there is no bias in the model in the CMB analysis.
After the measurement model confirmatory factor analysis, the outcome suggests an established composite reliability, convergent validity, discriminant validity, and no common method bias of the current measurement model. Table S3 summarizes the results of the measurement model of the 8 latent variables to the respective manifest variables. Overall, the parameter estimates or the path coefficients of the latent variables to the corresponding manifest variables were significant at p < 0.001.

4.6.6. Assessment of Multivariate Normality and Multicollinearity

Before proceeding with the SEM analysis, an assessment of multivariate normality and multicollinearity was conducted, using SPSS version 23. The observed values fall roughly along the straight line in the P-P plot, indicating that the observed values are similar to what we would expect from a normally distributed dataset [69]. The threshold level of the tests of skewness and kurtosis does not exceed between +2 and −2 (see Table S2). The multivariate influential value was examined using Cook’s distance analysis to identify any (multivariate) existence of influential outliers. In addition, we did not observe a Cook’s distance of greater than 1 [89]. Most of the case studies and Manila barangays’ data points were far less than 0.05. Similarly, using multiple linear regression analysis, we examined the variance inflation factors (VIFs) for all the predictors on our dependent variables, and observed that no VIFs were greater than 2, which is far less than the threshold of 10, ensuring that we are adding unique values.
A test for autocorrelation in the residuals from a statistical model or regression study is the Durbin–Watson (DW) statistic. The Durbin–Watson statistic has a range of values from 0 to 4. A score of 2.0 implies that the sample contains no autocorrelation. A rule of thumb is that DW test statistic values in the range of 1.5 to 2.5 are relatively normal [76]. Values outside this range could, however, be a cause for concern. The outcome of the autocorrelation test of the Durbin–Watson value of the current model is 2.049, which is within the indicated range; hence, the study datasets are relatively normal.

4.7. Discussion

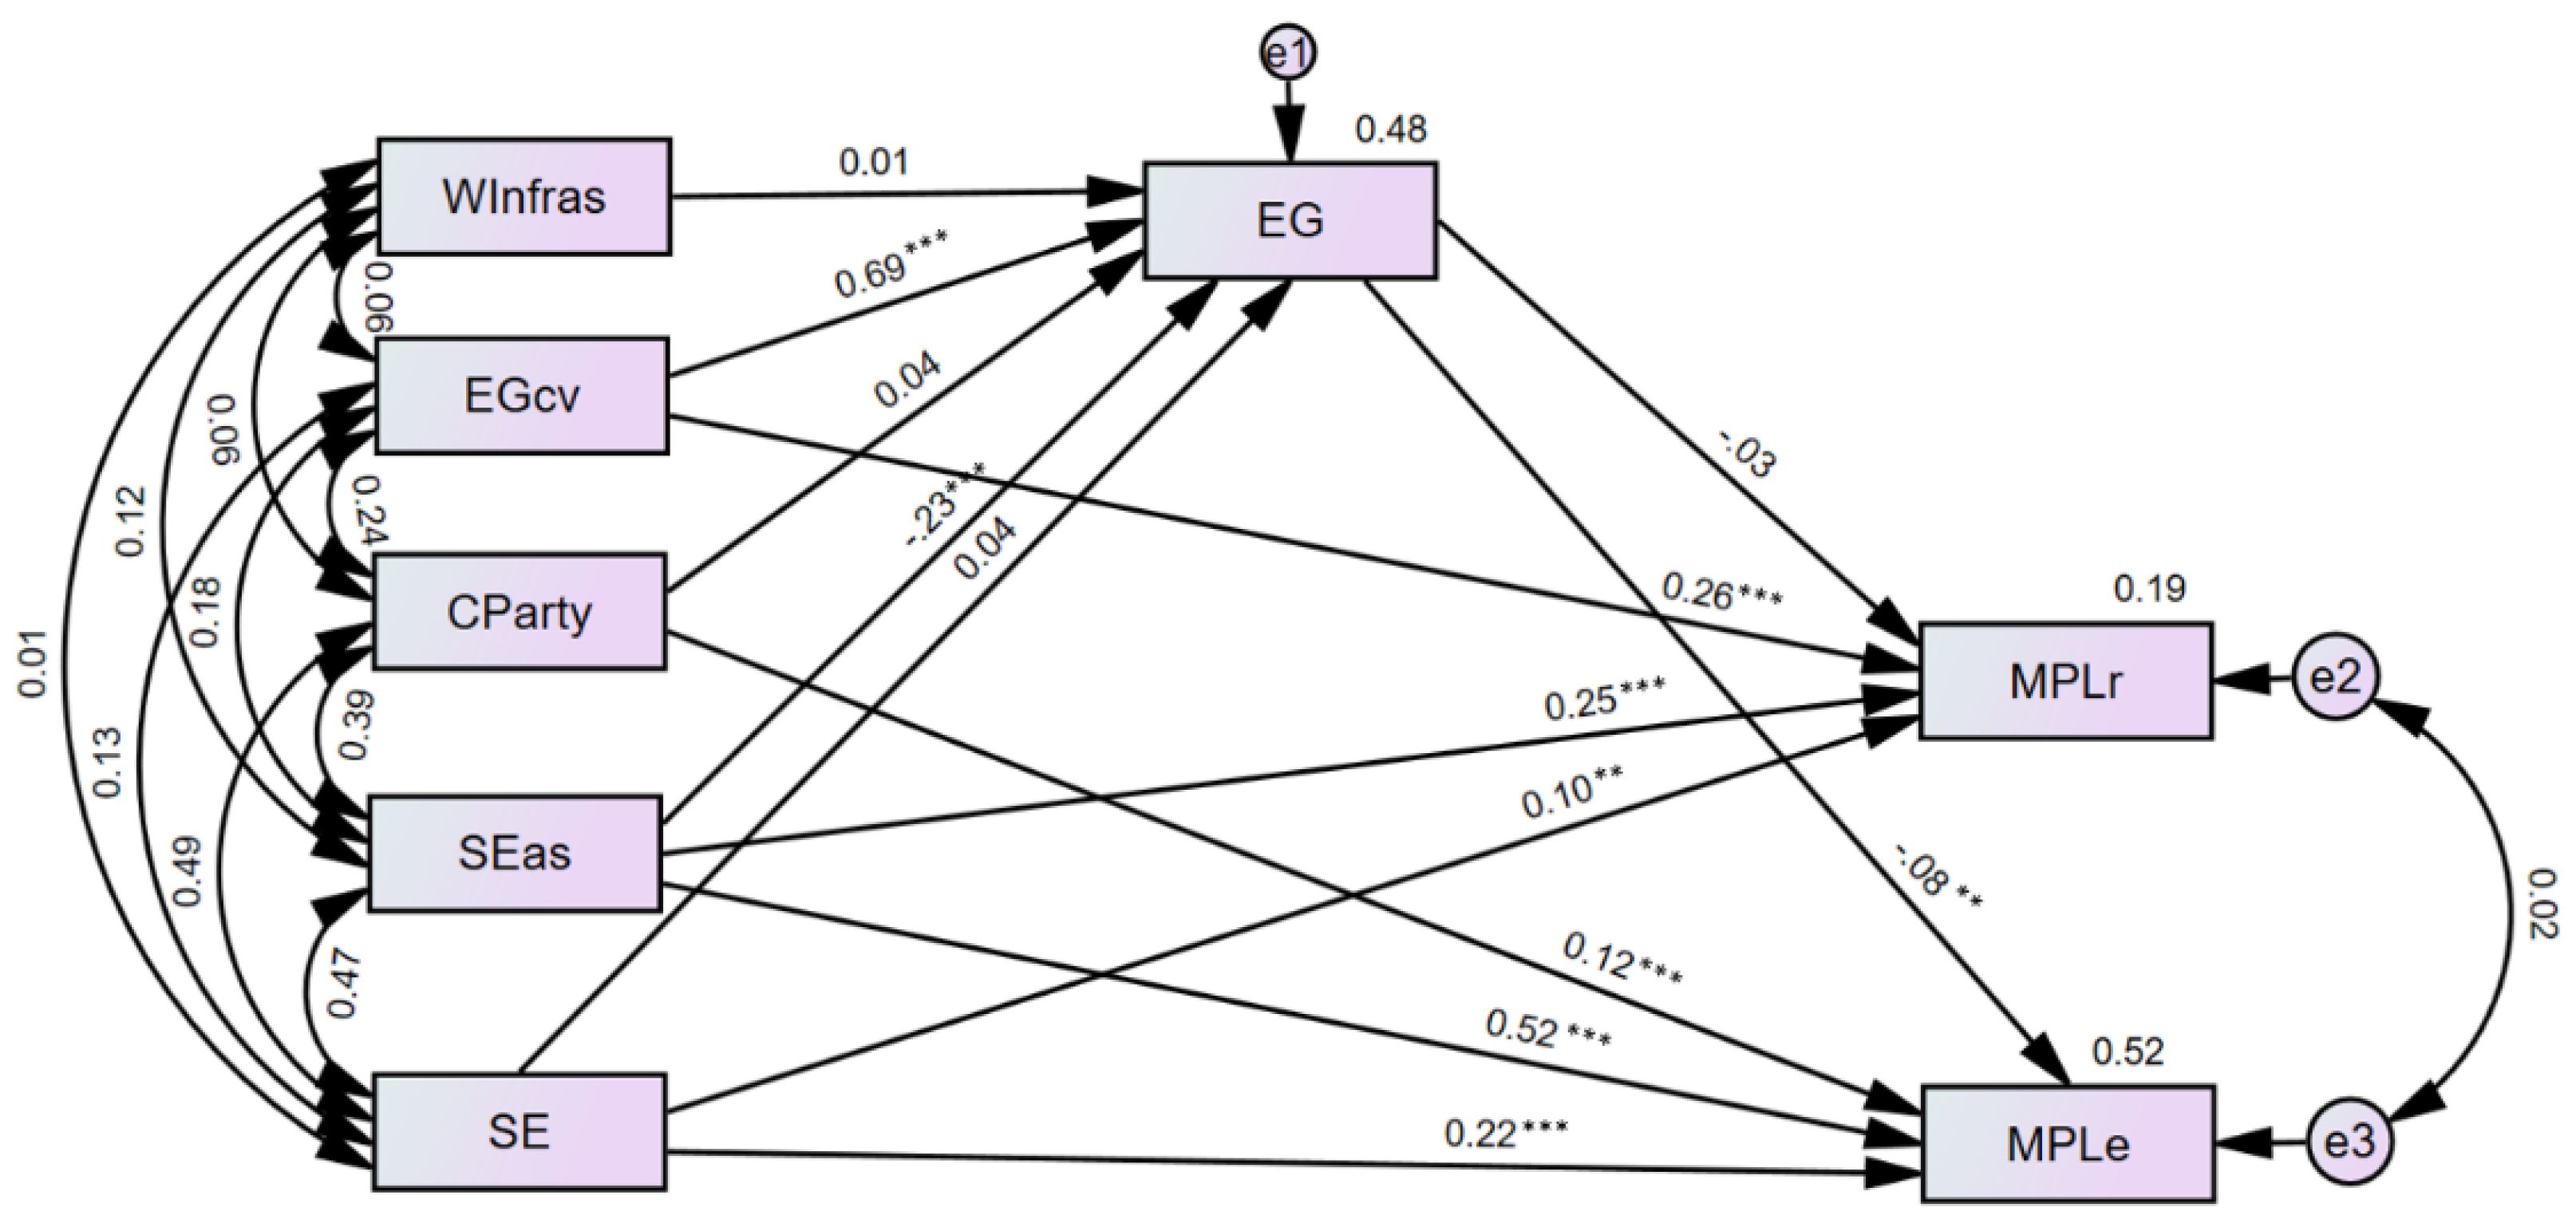
4.7.1. Path Model Fit

For the SEM model fit for this study in Manila, the chi-square goodness-of-fit test was not significant for the path model [78] (χ2/df = 1.190, p-value of 0.313), suggesting that the model fits the data very well. The RMSEA was excellent at 0.021, and the pClose test was not significant (p-value of 0.730), with a GFI of 0.997, which is greater than (>) 0.95. The CFI (0.999), IFI (0.999), and TLI (0.994) were greater than (>) 0.95, while the SRMR was 0.015. All these model fit indices for the causal path model on keystone factors influencing the reduction of marine plastic litter suggest a well-fitting model. Moreover, the structural model (Figure 5) fit indices also suggest a well-fitting model, with an RMSEA of 0.035 and an SRMR of 0.046. The threshold criteria for model fit indices are in reference to [42] Hu and Bentler (1999) and [90] Bollen (1989), as depicted in Table 5. The causal path model does not apply unnatural constraints to the set of measures. Similarly, the assessment of normality was also checked in AMOS; descriptively, all the skewness and kurtosis have substantial evidence of univariate normality. The multivariate normality of the variables suggested a normalized estimate of a less than five (5) critical ratio, which is indicative of a substantial multivariate assumption [91].

4.7.2. Structural Model Squared Multiple Correlations

Chinn (1998) [92] recommended R2 values for endogenous latent variables, based on: 0.67 (substantial), 0.33 (moderate), and 0.19 (weak). Moreover, Cohen’s (1988) [93] standard interpretation suggested that in terms of squared multiple correlations in SEM, “R-squared values of 0.12 or below indicate low (week effect size), between 0.13 to 0.25 values indicate medium, 0.26 or above, and above values indicate high effect size (substantial)”. However, Falk, R.F., and Miller (1992) [94] recommended that R2 values should be equal to or greater than 0.10 for the variance of a particular endogenous construct to be deemed adequate. The corresponding R2 of the three endogenous latent factors, EG, MPLr, and MPLe, of the structural model are 0.36, 0.13, and 0.40—which suggests a medium to high effect size.
Moreover, as depicted in Figure 6, the path model showed endogenous variables for EG, MPLr, and MPLe, with medium to high effect size R2 values of 0.48, 0.19, and 0.52, respectively. Here, 52% of the variance of MPLe is explained by five exogenous variables: EG, EGcv, CParty, SEas, and SE.
For the SEM path analysis, the study encapsulated the path coefficients, standard error, t-values (critical ratio), and significant p-values, using AMOS version 28, from standardized factor score weights in the validated CFA analysis with natural constraints, as illustrated in Table 6.

4.7.3. Mediation Analysis

The study assessed the mediating role of environmental governance (EG) on the relationship between EG regarding COVID-19 waste management (EGcv) and MPL leakage (MPLe) in Manila. The results of the bootstrapped test (2000 samples) revealed that the significant indirect effect of the impact of EGcv on MPLe was negative and significant (b = −0.051, t = −2.318, p-value = 0.023), supporting Hypothesis 11 (H11). Furthermore, the direct effect of EGcv on EG in the presence of a mediator was also found to be significant (b = 0.832, 0.001). Hence, EG partially mediated the relationship between EGcv and MPLe. A mediation analysis summary is presented in Table 7. Similarly, regarding the mediating role of EG on the relationship between socio-economic activities (SEas—socio-economic activities) and MPL leakage, the results revealed that the significant indirect effect of the impact of SEas on MPL leakage was positive and significant (b = 0.022, t = 2, p-value = 0.018), supporting Hypothesis 12 (H12). Furthermore, the direct effect of SEas on EG in the presence of the mediator was also found to be significant (b = 0.597, 0.001). Hence, EG partially mediated the relationship between SEas and MPLe.

4.7.4. Multigroup Analysis

From the constrained structural weights of multigroup analysis, the global chi-squared difference test for the current model was significant at a 90% confidence level (p-value = 0.098); we observed that the model is different between males and females. The p-value means that male and female reactions are different; they do not hold the same opinions. In Table 8, we have computed the group with a Z-score as an indication of significance. The effect size of R2 for MPLe is large, with 0.4324 (f-squared) from an R2 difference between 0.63 (male) and 0.47 (female) [95,96]. The standardized coefficient for males is −0.24, while the coefficient for females is −0.21. Hence, a positive relationship between socio-economic activities (SEas) and EG is stronger for females, supporting Hypothesis 15 (H15).

4.7.5. Discussion of the Path Model Results

Our findings revealed that waste infrastructure (WInfras) is not a predictor of environment governance (EG), with a path coefficient of 0.010. A weak positive correlation between the two variables was non-significant at a p-value of 0.774. as illustrated in Table 6 and Table 9. This implies that there is no relationship with waste infrastructure (WInfras) on EG; therefore, Hypothesis 1 (H1) is not supported. The result of this latent factor is not supported, due perhaps to the limited specific instrument or manifest variables under study. However, from the interview and FGD, Manila LGU requires robust evidence-based baseline data and information appropriate for policy; once the baseline data are established, they can be used to select the appropriate facilities/infrastructure and technologies in addressing MPL reduction, with the private sector’s involvement in SWM. It was argued that studies on improving waste management infrastructure would necessitate significant investments (and time), particularly in the least developed and developing economies and cities and that these countries’ primary focus should be on improving solid waste collection and management [7]. From the interviews and FGD, the city of Manila currently does not have a material recovery facility (MRF), particularly in the barangays; this is because of a lack of space to house a city MRF. The city instead mandated that every public school should practice a waste reduction scheme and resource recovery and should designate an area where used/soiled school and office papers, PET bottles, and old newspapers can be stored and eventually sold to a nearby junk shop for recycling.
Environmental governance regarding the “management of COVID-19-related healthcare waste” (EGcv) has a positive effect on existing environmental governance (EG). The result supports Hypothesis 2 (H2), which predicted a relationship, and implies that EGcv is a predictor for EG, with a strong and positive path coefficient of 0.685 (t = 18.873 ***). Environmental governance regarding the “management of COVID-19-related healthcare waste” (EGcv) has a positive effect on marine plastic litter solution measures (MPLr), with a positive path coefficient of 0.262 (t = 4.293 ***). This result supports Hypothesis 3 (H3), which predicted a positive relationship between the two variables. This is evidenced by the COVID-19 waste management interim guidelines set by the central government to the cities/LGUs in the Philippines for the proper management of related COVID-19 waste, e.g., proper waste segregation at the source and appropriate disposal. Most of the health care waste was managed by waste service providers. However, most of the barangays in Manila were not aware or oriented with the existing COVID-19 waste guidelines.
Moreover, community participation (CParty) is not a predictor of environment governance (EG), with an insignificant path coefficient of 0.040. This implies that there is no relationship between community participation (CParty) and EG, which does not support Hypothesis 4 (H4). However, community participation (CParty) is positively related to marine plastic litter leakage (MPLe), with a positive path coefficient of 0.120 (t = 3.029 **), supporting Hypothesis 5 (H5). This is evident in the current participation of the city SWM board, the city, the barangay, private entities and institutions, citizens, NGOs, and recycling companies in implementing effective SWM and marine plastic litter prevention. The city, in collaboration with the Manila Barangay Bureau, the Division of City Schools, the Manila Health Department, and the Bureau of Permits and Licensing Office, has launched a massive information, education, and communication (IEC) campaign targeting all sectors and generations to instill the basic requirements of waste segregation at source and segregated storage, pending collection. Moreover, the barangays are required to guarantee that their constituents follow the Barangay Solid Waste Management Committee’s ordinance to conduct waste segregation at the source and discourage the illegal disposal of household waste. However, there is a need for participation upstream by plastic industries stakeholders for MPL reduction. The authors believe that demand drives marine plastic waste in the Philippines. It was observed that researchers must follow the terms of reference of the development partners/donors in the MPL project. In addition, there is a weak relationship between science and policy in the Philippines, with most of the research conducted by local scholars ending up on the shelf rather than being translated into policy. The relationship between the government and academia should be enhanced.
The socio-economic activities factor (SEas) is a predictor of existing environmental governance (EG), with a path coefficient of −0.231 (t = −5.627 ***), and was found to be significant, which means that there is a correlation between the SEas and EG variables. Hence, Hypothesis 6 (H6) is supported. In the same way, socio-economic activities (SEas) have a positive association with marine plastic litter solution measures (MPLr), with a path coefficient of 0.253 (t = 4.877 ***), supporting Hypothesis 7 (H7). Socio-economic activities (SEas) have a positive association with marine plastic litter leakage (MPLe), with a path coefficient of 0.521 (13.292 ***), supporting Hypothesis 8 (H8). It should be underlined that the Manila government and the Philippine LGUs consider several socio-economic drivers when addressing the current practical challenges of marine plastic litter abatement. These drivers include the domestic and international market and economic forces, legislation, the design of products and services, urbanization and consumerism patterns, regional cooperation, and human behavior and convenience factors that affect sustainable consumption and production. Nevertheless, this is evident in the current SWM implementation in Manila through the Department of Public Services (DPS), which continues to send open letters to businesses to encourage them to practice source separation and to support the city’s environmental awareness program by maintaining the cleanliness of their surroundings and ensuring that no waste produced during their operations is disposed of in canals or estuaries that lead to the Pasig River. There are 17 major river systems that drain into Manila Bay, and the rivers are home to informal settler families. The DENR-led Manila Bay Cleanup Program, in cooperation with the Manila LGU, undertakes the following actions in compliance with the Writ of Continuing Mandamus: clean-up for water quality improvement, rehabilitation and resettlement, and education and sustainability. The DENR conducted 2025 clean-up drives with 25,595 volunteers in the fourth quarter of 2020, collecting and disposing of 1406 tons of waste, on top of activities by the PNP-MG, MMDA, and local government. The program also addresses informal settlements (sourced during an interview with Department of Environment and Natural Resources (DENR), 2021). With limited resources, frequent clean-up activities may not be sustainable since they entail substantial financial and human resources. However, Manila could showcase good practices of LGU environmental governance, to replicate the model in other neighboring cities to Metro Manila, e.g., the DPS Beach Warriors and estuary rangers cleaning up the city of Manila; initiatives such as LinISKOmaynila and Aling Tindira (the vendor waste-to-cash program), in partnership with the Coca-Cola company; most of the estuaries or rivers have screen traps; however, these artificial barriers may not be sustainable since they will be prone to damage during flash-flooding.
Likewise, Manila public litter behavior in terms of the MPL problem (SE) has a positive effect on marine plastic litter solution measures (MPLr), with a path coefficient of 0.105 (t = 2.102 *), supporting Hypothesis 9 (H9). Manila’s public behavior regarding the MPL problem (SE) has a positive association with marine plastic litter leakage (MPLe), with a path coefficient of 0.215 (t = 5.238 ***), supporting Hypothesis 10 (H10). SE is measured by variable indicators, such as a lack of enforcement of waste disposal directives, a lack of funding for waste collection, a lack of waste collection and separation, public behavior in terms of littering, a lack of adequate waste management infrastructure, and the intense consumption of single-use plastics. This is evident in the instrument for environmental governance (software component), which is not associated with the socio-economic activities factor. This also suggests the enforcement of SWM plans and cleanliness.
However, the mediated effects in Hypotheses H11 and H12 are supported, which implies that environmental governance is an intervening variable that partially relates to the mediated variables. The bootstrapped test for mediation for Hypothesis 11 (H11) revealed a significant indirect effect of the impact of EGcv on MPLe, which was negative and significant with a path coefficient of −0.051 (t = −2.318 *), suggesting that EG has partially mediated the relationship between EGcv and MPLe. Likewise, the mediating role of EG on the relationship between SEas and MPLe revealed a significant indirect effect of the impact of SEas on MPLe, which was positive and significant, with a path coefficient of 0.022 (t = 2.0 *), supporting Hypothesis 12 (H12)—implying that EG partially mediated the relationship between SEas and MPLe.
For environmental governance (e.g., SWM and MPL policy, strategy, and guidelines) the factor of EG is not a predictor of marine plastic litter solution measures, with a standard regression coefficient of −0.035 and a negative correlation between the two variables (latent and manifest variables) that was found to be insignificant. This suggests that enabling environmental governance (EG) may not be potentially correlated with MPL solution measures. This is evident in the instrument used in the study, as manifested by the measures of variable indicators for environmental governance (software), which described the need for clear guidelines and strategy for MPL/SWM; effective mechanisms in place for the waste facility; the openness, transparency, and accountability of bid processes in SWM; and public involvement at appropriate stages of the SWM decision-making. In contrast, the MPL solution measures entail mostly physical aspects (hardware), such as enhancing waste separation at all households and establishments, establishing material recycling facilities, awareness-raising campaigns, producing packaging made from alternative materials, and enhancing waste collection coverage in barangays, amongst other measures. The result does not support Hypothesis 13 (H13). Our findings, however, contradict the works of Scheinberg, A., Wilson, D.C., and Rodic, (2010) [97] showing overlapping components of integrated solid waste management and the physical and governance components; the reason for the difference might be due to the methodological techniques.
Environmental governance, in terms of strategies, guidelines, and implementation procedures (EG), positively impacts marine plastic litter leakage (MPLe), with a path coefficient of −0.084 (t = −2.456 **), supporting Hypothesis 14 (H14). This is evident in the existing scenario, where implementation progresses the 10-year Manila SWM plan and the developed roadmap for preventing marine plastic litter in Manila—in alignment with the approved national plan of action on marine litter prevention in the Philippines. Moreover, the existence of environmental governance, political will, and transparency are among the driving forces that spur effective waste management in Manila, which can be observed in the current administration. As mandated by R.A. 9003 (the Philippine ESWM Act), the DPS conducts IEC in every barangay to encourage source segregation and waste reduction. In addition, Manila is progressing in terms of implementing and enforcing its SWM strategies and plans through its existing segregation strategies. In addition, information, education, and communication (IEC), which are being promoted by the Manila DPS—e.g., source separation at the barangay level—is one of the environmental governance practices that the city is implementing, following their SWM strategy and plans. However, Manila is yet to institutionalize an SWM department to tackle the SWM in the city. For the city’s SWM spending, a total of PHP 602,588,348.00 (USD 12,297,721.39) was budgeted in 2015 for the collection and disposal of solid waste, including street-sweeping services and IEC activities. However, if the barangays encouraged recycling, the city’s SWM spending could be reduced and may make savings.
For the multigroup effect, the positive relationship between socio-economic activities (SEas) and MPL leakage (MPLe) is stronger for females, as evidenced by the path coefficients of −0.24 (male) and −0.21 (females, t = −5.374 ***); a global chi-squared difference test for the current model was significant at a 90% confidence level. Hence, we observed that the model is different according to gender (the p-value of males and females are different), which supports Hypothesis 15 (H15). These findings and results provided significant perspectives for Manila for enabling environmental governance for marine plastic reduction (illustrated in Table 9, Hypothesis analytics).

4.7.6. Bollen–Stine Bootstrap Test

Using bootstraps in AMOS version 28, the researcher performed a Bollen–Stine bootstrap test with 5000 bootstrap samples [98]. The result of the Bollen–Stine bootstrap test has a non-significant p-value of 0.320, suggesting that the current model is correct.

5. Conclusions

The keystone factors regarding the practical challenges, including socio-economic activities, environmental governance, community participation, waste infrastructure, and solution measures for marine plastic litter (MPL) reduction in Manila City, are cross-cutting and are related to the SDGs. Consequently, the data fits well with the measurement model, which suggests an established construct validity and reliability. Moreover, the structural model has established good test result fit measures, including the p-value = 0.313, RMSEA = 0.021, SRMR = 0.015, GFI = 0.997, CFI = 0.999, TLI = 0.994, IFI = 0.999, and the chi-square/degrees of freedom ratio = 1.190. We found that the environmental governance of SWM policies and guidelines (EG) and COVID-19 waste management (EGcv), community participation, socio-economic activities, and the public litter behavior factor have positively influenced MPL leakage and MPL solution measures. In addition, environmental governance (SWM policies and guidelines) mediating EGcv and SEas positively impacts MPL leakage. However, there is no relationship between waste infrastructure and environmental governance; Manila LGU has limited resources to effectively implement the existing national strategies and actions including the installation of waste infrastructure, e.g., appropriate artificial screen traps and MRF. Manila has a burden of pollution, and the challenge of current waste management is great, in particular, waste separation at source and the lack of a disposal facility, as the city relies on landfills in a neighboring city. Manila City also has a challenge related to healthcare waste collection, treatment, transportation, and disposal, as seen during the first year of the COVID-19 pandemic. Direct anthropogenic activities, such as population growth, urbanization, tourism, inward migration, intense plastic production [32,35,36,64], and slum residents along the river/canals and coastal areas are drivers that exacerbate marine plastic littering within Manila and in the Philippine context.
There is a great need to empower the barangays so that they can play a part in preventing and reducing marine plastic litter from leaking into the ocean. In this context, opportunities for showcasing dynamic innovation in Manila should be considered. In the Philippines, Manila and other LGUs should disseminate a wide range of practices that move away from the traditional linear (take-make-use-dispose) way of thinking [22], allowing barangays and LGUs to be more responsible in terms of achieving long-term waste management and circularity. However, due to COVID-19 pandemic restrictions, only a modest amount of baseline data was collected. Future research could include the plastics industry and informal recyclers, as well as the use of longitudinal data from Philippine cities/municipalities, combining an SEM and empirical DPSIR approach. The study would improve the efficacy of using SEM systematically and inclusively.

Supplementary Materials

The following are available online at https://www.mdpi.com/article/10.3390/su14106128/s1, Table S1. Demographic characteristics of respondents. Table S2. Factors in MPL Reduction with mean, SD, Skewness, Kurtosis, factor loadings and Cronbach’s Alpha. Table S3. Results of Measurement Model (CFA) for the manifest and latent variables.

Author Contributions

Conceptualization, G.B.; data curation, G.B.; formal analysis, G.B.; investigation, G.B.; methodology, G.B.; supervision, A.N.; validation, A.N.; writing—original draft, G.B.; writing—review and editing, G.B. and A.N. All authors have read and agreed to the published version of the manuscript.

Funding

This research received no external funding.

Institutional Review Board Statement

National Institute of Development Administration (protocol code ECNIDA 2021/0106 and 9 September 2021).

Informed Consent Statement

If you decide to participate in the research project, you will be asked to complete the questionnaire that will ask you some questions about the status of municipal solid waste and marine plastic litter even during the current COVID-19 pandemic - to identify gaps in waste management, local realities and draw out sustainable waste management solutions. The questionnaire contains more than 50 questions in 4 likert scale, divided into 10 parts/sections. We estimate that the questionnaire will take you about 20 min in one seating to complete. You are under no obligation to complete questions that you would prefer not to answer.

Data Availability Statement

Not applicable.

Acknowledgments

This research was supported by the National Institute of Development Administration, Thailand. The authors would like to acknowledge and thank the endorsement of the Manila Department of Public Services in the conduct of the survey, as well as for the interviews and focused group discussions.

Conflicts of Interest

The authors declare no conflict of interest. The authors declare that they have no known competing financial interests or personal relationships that could have appeared to influence the work reported in this paper.

References

  1. The Pew Charitable Trusts. Breaking the Plastic Wave; The Pew Charitable Trusts: Philadelphia, PA, USA, 2020; Volume 56, Available online: https://www.pewtrusts.org/-/media/assets/2020/07/breakingtheplasticwave_summary.pdf (accessed on 25 March 2022).
  2. Law, K.L.; Starr, N.; Siegler, T.R.; Jambeck, J.R.; Mallos, N.J.; Leonard, G.H. The United States’ contribution of plastic waste to land and ocean. Sci. Adv. 2020, 6, eabd0288. [Google Scholar] [CrossRef] [PubMed]
  3. Lebreton, L.C.M.; Van Der Zwet, J.; Damsteeg, J.W.; Slat, B.; Andrady, A.; Reisser, J. River plastic emissions to the world’s oceans. Nat. Commun. 2017, 8, 15611. [Google Scholar] [CrossRef] [PubMed]
  4. Jambeck, J.R.; Geyer, R.; Wilcox, C.; Siegler, T.R.; Perryman, M.; Andrady, A.; Narayan, R.; Law, K.L. Plastic waste inputs from land into the ocean. Science 2015, 347, 768–771. [Google Scholar] [CrossRef] [PubMed]
  5. Willis, K.; Maureaud, C.; Wilcox, C.; Hardesty, B.D. How successful are waste abatement campaigns and government policies at reducing plastic waste into the marine environment? Mar. Policy 2018, 96, 243–249. [Google Scholar] [CrossRef]
  6. Van Assche, K.; Beunen, R.; Duineveld, M. Evolutionary Governance Theory: An Introduction; Springer: Berlin/Heidelberg, Germany, 2014. [Google Scholar] [CrossRef]
  7. Löhr, A.; Savelli, H.; Beunen, R.; Kalz, M.; Ragas, A.; Van Belleghem, F. Solutions for global marine litter pollution. Curr. Opin. Environ. Sustain. 2017, 28, 90–99. [Google Scholar] [CrossRef] [Green Version]
  8. UNEP Factsheet Series. In Environmental Governance; UNEP: Vienna, Austria; Available online: http://www.unep.org/environmentalgovernance/ (accessed on 2 July 2020).
  9. UNEP. Resolution 3/4-United Nations Environment Assembly of the United Nations Environment Programme; United Nations Environment Programme: Nairobi, Kenya, 2022; pp. 1–6. Available online: https://papersmart.unon.org/resolution/uploads/k1900699.pdf (accessed on 25 March 2022).
  10. Lyons, B.P.; Cowie, W.J.; Maes, T.; Le Quesne, W.J.F. Marine plastic litter in the ROPME Sea Area: Current knowledge and recommendations. Ecotoxicol. Environ. Saf. 2020, 187, 109839. [Google Scholar] [CrossRef] [PubMed]
  11. Yang, Y.; Chen, L.; Xue, L. Chinese Journal of Population, Resources and Environment Looking for a Chinese solution to global problems: The situation and countermeasures of marine plastic waste and microplastics pollution governance system in China. Chin. J. Popul. Resour. Environ. 2022, 19, 352–357. [Google Scholar] [CrossRef]
  12. Kulkarni, B.N.; Anantharama, V. Repercussions of COVID-19 pandemic on municipal solid waste management: Challenges and opportunities. Sci. Total Environ. 2020, 743, 140693. [Google Scholar] [CrossRef]
  13. Klemeš, J.J.; Van Fan, Y.; Tan, R.R.; Jiang, P. Minimising the present and future plastic waste, energy and environmental footprints related to COVID-19. Renew. Sustain. Energy Rev. 2020, 127, 109883. [Google Scholar] [CrossRef]
  14. Bugge, M.M.; Fevolden, A.M.; Klitkou, A. Governance for system optimization and system change: The case of urban waste. Res. Policy 2019, 48, 1076–1090. [Google Scholar] [CrossRef]
  15. Soltani, A.; Sadiq, R.; Hewage, K. The impacts of decision uncertainty on municipal solid waste management. J. Environ. Manag. 2017, 197, 305–315. [Google Scholar] [CrossRef] [PubMed]
  16. Ocean Conservancy. The Next Wave: Investment Strategies for Plastic Free Seas; Ocean Conservancy: Washington, DC, USA, 2017. [Google Scholar]
  17. Garnett, K.; Cooper, T.; Longhurst, P.; Jude, S.; Tyrrel, S. A conceptual framework for negotiating public involvement in municipal waste management decision-making in the UK. Waste Manag. 2017, 66, 210–221. [Google Scholar] [CrossRef] [PubMed]
  18. Benson, N.U.; Fred-Ahmadu, O.H.; Bassey, D.E.; Atayero, A.A. COVID-19 pandemic and emerging plastic-based personal protective equipment waste pollution and management in Africa. J. Environ. Chem. Eng. 2021, 9, 105222. [Google Scholar] [CrossRef] [PubMed]
  19. Shiong, K.; Yiing, L.; Ren, H.; Yi, H.; Wayne, K. Plastic waste associated with the COVID-19 pandemic: Crisis or opportunity? J. Hazard. Mater. 2021, 417, 126108. [Google Scholar] [CrossRef]
  20. Benson, N.U.; Bassey, D.E.; Palanisami, T. COVID pollution: Impact of COVID-19 pandemic on global plastic waste footprint. Heliyon 2021, 7, e06343. [Google Scholar] [CrossRef]
  21. GESAMP. Guidelines for the monitoring and assessment of plastic litter in the ocean. In Reports and Studies; Kershaw, P.J., Turra, A., Galgani, F., Eds.; IMO/FAO/UNESCO-IOC/UNIDO/WMO/IAEA/UN/UNEP/UNDP/ISA Joint Group of Experts on the Scientific Aspects of Marine Environmental Prote; GESAMP: London, UK, 2019; Volume 99, Available online: http://www.gesamp.org/publications/guidelines-for-the-monitoring-and-assessment-of-plastic-litter-in-the-ocean (accessed on 25 March 2022).
  22. GIZ. Marine Litter Prevention: Reducing Plastic Waste Leakage into Waterways and Oceans through Circular Economy and Sustainable Waste Management; GIZ: Berlin, Germany, 2018. [Google Scholar]
  23. PREVENT Waste Alliance. EPR Toolbox: Know-How to Enable Extended Producer Responsibility for Packaging; PREVENT Waste Alliance: Bonn, Germany, 2020; pp. 1–205. Available online: https://prevent-waste.net/en/epr-toolbox/ (accessed on 25 March 2022).
  24. Wilson, D.C.; Rodic, L.; Cowing, M.J.; Velis, C.A.; Whiteman, A.D.; Scheinberg, A.; Vilches, R.; Masterson, D.; Stretz, J.; Oelz, B. “Wasteaware” benchmark indicators for integrated sustainable waste management in cities. Waste Manag. 2015, 35, 329–342. [Google Scholar] [CrossRef]
  25. Oke, A.; Osobajo, O.; Obi, L.; Omotayo, T. Rethinking and optimising post-consumer packaging waste: A sentiment analysis of consumers’ perceptions towards the introduction of a deposit refund scheme in Scotland. Waste Manag. 2020, 118, 463–470. [Google Scholar] [CrossRef]
  26. Ryberg, M.W.; Laurent, A.; Hauschild, M. Mapping of Global Plastics Value Chain and Plastics Losses to the Environment (with a Particular Focus on Marine Environment); UN Environ: Nairobi, Kenya, 2018; pp. 1–99. [Google Scholar]
  27. Soria, K.Y.; Palacios, M.R.; Morales Gomez, C.A. Governance and policy limitations for sustainable urban land planning. The case of Mexico. J. Environ. Manag. 2020, 259, 109575. [Google Scholar] [CrossRef]
  28. Carman, V.G.; Machain, N.; Campagna, C. Legal and institutional tools to mitigate plastic pollution affecting marine species: Argentina as a case study. Mar. Pollut. Bull. 2015, 92, 125–133. [Google Scholar] [CrossRef]
  29. Alpizar, F.; Carlsson, F.; Lanza, G.; Carney, B.; Daniels, R.C.; Jaime, M.; Ho, T.; Nie, Z.; Salazar, C.; Tibesigwa, B.; et al. A framework for selecting and designing policies to reduce marine plastic pollution in developing countries. Environ. Sci. Policy 2020, 109, 25–35. [Google Scholar] [CrossRef]
  30. Adam, I.; Walker, T.R.; Clayton, C.A.; Carlos Bezerra, J. Attitudinal and behavioural segments on single-use plastics in Ghana: Implications for reducing marine plastic pollution. Environ. Chall. 2021, 4, 100185. [Google Scholar] [CrossRef]
  31. Gall, S.C.; Thompson, R.C. The impact of debris on marine life. Mar. Pollut. Bull. 2015, 92, 170–179. [Google Scholar] [CrossRef] [PubMed]
  32. Binetti, U.; Silburn, B.; Russell, J.; van Hoytema, N.; Meakins, B.; Kohler, P.; Desender, M.; Preston-Whyte, F.; Fa’abasu, E.; Maniel, M.; et al. First marine litter survey on beaches in Solomon Islands and Vanuatu, South Pacific: Using OSPAR protocol to inform the development of national action plans to tackle land-based solid waste pollution. Mar. Pollut. Bull. 2020, 161, 111827. [Google Scholar] [CrossRef] [PubMed]
  33. Plastics Europe. Plastics–the facts 2018. In An Analysis of European Plastics Production, Demand and Waste Data; Plastics Europe: Brussels, Belgium, 2018. [Google Scholar]
  34. Geyer, R.; Jambeck, J.R.; Law, K.L. Production, use, and fate of all plastics ever made. Sci. Adv. 2017, 3, 25–29. [Google Scholar] [CrossRef] [Green Version]
  35. Davison, S.M.C.; White, M.P.; Pahl, S.; Taylor, T.; Fielding, K.; Roberts, B.R.; Economou, T.; Mcmeel, O.; Kellett, P.; Fleming, L.E. Public concern about, and desire for research into, the human health effects of marine plastic pollution: Results from a 15-country survey across Europe and Australia. Glob. Environ. Chang. 2021, 69, 102309. [Google Scholar] [CrossRef]
  36. Nelms, S.E.; Eyles, L.; Godley, B.J.; Richardson, P.B.; Selley, H.; Solandt, J.L.; Witt, M.J. Investigating the distribution and regional occurrence of anthropogenic litter in English marine protected areas using 25 years of citizen-science beach clean data. Environ. Pollut. 2020, 263, 114365. [Google Scholar] [CrossRef]
  37. Oliver, C. Strategic Responses to Institutional Processes. Acad. Manag. Rev. 1991, 16, 147–179. [Google Scholar] [CrossRef]
  38. DiMaggio, P.J.; Powell, W.W. The Iron Cage Revisited: Institutional Isomorphism & Collective Rationality in Organizational Field. Am. Sociol. Rev. 1983, 48, 147–160. [Google Scholar]
  39. Oti-Sarpong, K.; Shojaei, R.S.; Dakhli, Z.; Burgess, G. How countries achieve greater use of offsite manufacturing to build new housing: Identifying typologies through institutional theory. Sustain. Cities Soc. 2022, 76, 103403. [Google Scholar] [CrossRef]
  40. Bolognesi, T.; Nahrath, S. Environmental Governance Dynamics: Some Micro Foundations of Macro Failures. Ecol. Econ. 2020, 170, 106555. [Google Scholar] [CrossRef]
  41. Whiteman, A.; Smith, P.; Wilson, D.C. Waste management: An indicator of urban governance. In Proceedings of the UN-Habitat Global Conference on Urban Development, New York, NY, USA, 4 June 2001. [Google Scholar]
  42. Glasbergen, P. The Question of Environmental Governance. In Co-Operative Environmental Governance; public-private agreements as a policy strategy; Glasbergen, P., Ed.; Kluwer Academic Publishers: Dordrecht, The Netherlands, 1998. [Google Scholar]
  43. Breukelman, H.; Krikke, H.; Löhr, A. Failing services on urban waste management in developing countries: A review on symptoms, diagnoses, and interventions. Sustainability 2019, 11, 6977. [Google Scholar] [CrossRef] [Green Version]
  44. Cai, K.; Xie, Y.; Song, Q.; Sheng, N.; Wen, Z. Identifying the status and differences between urban and rural residents’ behaviors and attitudes toward express packaging waste management in Guangdong Province, China. Sci. Total Environ. 2021, 797, 148996. [Google Scholar] [CrossRef] [PubMed]
  45. Wu, H.H. A study on transnational regulatory governance for marine plastic debris: Trends, challenges, and prospect. Mar. Policy 2020, 136, 103988. [Google Scholar] [CrossRef]
  46. Cavalletti, B.; Corsi, M. By diversion rate alone: The inconsistency and inequity of waste management evaluation in a single-indicator system. Reg. Sci. 2018, 98, 307–329. [Google Scholar] [CrossRef] [Green Version]
  47. Citroni, G.; Lippi, A.; Profeti, S. Local public services in Italy: Still fragmentation. In Public and Social Services in Europe; Palgrave Macmillan: Houndmills, UK, 2019; pp. 103–117. [Google Scholar]
  48. Morseletto, P. A new framework for policy evaluation: Targets, marine litter, Italy and the Marine Strategy Framework Directive. Mar. Policy 2020, 117, 103956. [Google Scholar] [CrossRef]
  49. Rangel-Buitrago, N.; Williams, A.; Costa, M.F.; de Jonge, V. Curbing the inexorable rising in marine litter: An overview. Ocean Coast. Manag. 2020, 188, 105133. [Google Scholar] [CrossRef]
  50. Loukil, F.; Rouached, L. Resources, Conservation and Recycling Modeling packaging waste policy instruments and recycling in the MENA region. Resour. Conserv. Recycl. 2012, 69, 141–152. [Google Scholar] [CrossRef]
  51. UNEP. MARINE PLASTIC DEBRIS Global Lessons and Research to Inspire Action; UNEP: Vienna, Austria, 2016; pp. 1–192. [Google Scholar] [CrossRef]
  52. Magni, S.; Torre CDella Garrone, G.; Amato, A.D.; Parenti, C.C.; Binelli, A. First evidence of protein modulation by polystyrene microplastics in a freshwater biological model. Environ. Pollut. 2019, 250, 407–415. [Google Scholar] [CrossRef] [Green Version]
  53. Di, M.; Wang, J. Science of the Total Environment Microplastics in surface waters and sediments of the Three Gorges. Sci. Total Environ. 2018, 616–617, 1620–1627. [Google Scholar] [CrossRef]
  54. Mani, T.; Hauk, A.; Walter, U.; Burkhardt-Holm, P. Microplastics profile along the Rhine River. Sci. Rep. 2015, 5, 17988. [Google Scholar] [CrossRef]
  55. Gasperi, J.; Dris, R.; Bonin, T.; Rocher, V.; Tassin, B. Assessment of floating plastic debris in surface water along the Seine River. Environ. Pollut. 2014, 195, 163–166. [Google Scholar] [CrossRef] [Green Version]
  56. Morritt, D.; Stefanoudis, P.V.; Pearce, D.; Crimmen, O.A.; Clark, P.F. Plastic in the Thames: A river runs through it. Mar. Pollut. Bull. 2014, 78, 196–200. [Google Scholar] [CrossRef] [PubMed]
  57. Bentler, P.M.; Chou, C.P. Practical issues in structural modeling. Sociol. Methods Res. 1987, 16, 78–117. [Google Scholar] [CrossRef]
  58. Manila Department of Public Services (DPS). Socio-Economic Demography of Manila City; Manila DPS: Manila, Philippines, 2021.
  59. Manila DPS. Manila City 10-Year SWM Plan; Manila DPS: Manila, Philippines, 2020.
  60. Abate, T.G.; Börger, T.; Aanesen, M.; Falk-Andersson, J.; Wyles, K.J.; Beaumont, N. Valuation of marine plastic pollution in the European Arctic: Applying an integrated choice and latent variable model to contingent valuation. Ecol. Econ. 2020, 169, 106521. [Google Scholar] [CrossRef]
  61. Adam, I.; Walker, T.R.; Bezerra, J.C.; Clayton, A. Policies to reduce single-use plastic marine pollution in West Africa. Mar. Policy 2020, 116, 103928. [Google Scholar] [CrossRef]
  62. Gari, S.R.; Ortiz Guerrero, C.E.; A-Uribe, B.; Icely, J.D.; Newton, A. A DPSIR-analysis of water uses and related water quality issues in the Colombian Alto and Medio Dagua Community Council. Water Sci. 2018, 32, 318–337. [Google Scholar] [CrossRef] [Green Version]
  63. Krelling, A.P.; Williams, A.T.; Turra, A. Differences in perception and reaction of tourist groups to beach marine debris that can influence a loss of tourism revenue in coastal areas. Mar. Policy 2017, 85, 87–99. [Google Scholar] [CrossRef]
  64. Rochman, C.M.; Cook, A.M.; Koelmans, A.A. Plastic debris and policy: Using current scientific understanding to invoke positive change. Environ. Toxicol. Chem. 2016, 35, 1617–1626. [Google Scholar] [CrossRef]
  65. Plummer, R.; Armitage, D.R.; de Loë, R.C. Adaptive comanagement and its relationship to environmental Governance. Ecol Soc. 2013, 18, 21. [Google Scholar] [CrossRef] [Green Version]
  66. 66. National Solid Waste Management Commission, DENR Philippines. NSWMC Resolution No. 1363, Series of 2020. The Interim Guidelines on the Management of COVID-19 Related Healthcare Waste. Available online: https://nswmc.emb.gov.ph/wp-content/uploads/2021/06/2020-NSWMC-Reso-1364-series-of-2020.pdf (accessed on 20 July 2021).
  67. MacCallum, R.C.; Browne, M.W.; Sugawara, H.M. Power analysis and determination of sample size for covariance structure modeling. Psychol. Methods 1996, 1, 130–149. [Google Scholar] [CrossRef]
  68. Choi, H.S.C.; Sirakaya, E. Measuring Residents’ Attitude toward Sustainable Tourism: Development of Sustainable Tourism Attitude Scale. J. Tour. Res. 2005, 43, 380–394. [Google Scholar] [CrossRef]
  69. Field, A. Discovering statistics Using SPSS for windows; SAGE Publications: Thousand Oaks, CA, USA, 2000. [Google Scholar]
  70. Field, A. Discovering statistics Using SPSS; Sage Publications Limited: London, UK, 2009. [Google Scholar]
  71. Ferguson, E.; Cox, T. Exploratory factor analysis: A users’ guide. Int. J. Sel. Assess. 1993, 1, 84–94. [Google Scholar] [CrossRef]
  72. Reio, T.G., Jr.; Shuck, B. Exploratory factor analysis: Implications for theory, research, and practice. Adv. Dev. Hum. Resour. 2015, 17, 12–25. [Google Scholar] [CrossRef] [Green Version]
  73. Hair, J.F. Multivariate Data Analysis; Prentice Hall: Upper Saddle River, NJ, USA, 2005. [Google Scholar]
  74. Hair, J.F.; Black, W.C., Jr.; Babin, B.J.; Anderson, R.E. Multivariate Data Analysis, 7th ed.; Prentice-Hall: Upper Saddle River, NJ, USA, 2010. [Google Scholar]
  75. Fabrigar, L.R.; Wegener, D.T.; MacCallum, R.C.; Strahan, E.J. Evaluating the use of exploratory factor analysis in psychological research. Psychol. Methods 1999, 4, 272. [Google Scholar] [CrossRef]
  76. Tabachnick, B.G.; Fidell, L.S.; Ullman, J.B. Using Multivariate Statistics, 6th ed.; Pearson: Boston, MA, USA, 2014. [Google Scholar]
  77. Hu, L.T.; Bentler, P.M. Cutoff criteria for fit indexes in covariance structure analysis: Conventional criteria versus new alternatives. Struct. Equ. Model. A Multidiscip. J. 1999, 6, 1–55. [Google Scholar] [CrossRef]
  78. Bagozzi, R.P.; Yi, Y. Specification, evaluation and interpretation of structural equation models. J. Acad. Mark. Sci. 2012, 40, 8–34. [Google Scholar] [CrossRef]
  79. Baumgartner, H.; Homburg, C. Applications of Structural Equation Modeling in Marketing and Consumer Research: A review. Int. J. Res. Mark. 1996, 13, 139–161. [Google Scholar] [CrossRef] [Green Version]
  80. Doll, W.J.; Xia, W.; Torkzadeh, G. A confirmatory factor analysis of the end-user computing satisfaction instrument. MIS Q. 1994, 18, 453–461. [Google Scholar] [CrossRef]
  81. Hu, L.; Bentler, P.M. Fit indices in covariance structure modeling: Sensitivity to under parameterized model misspecification. Psychol. Methods 1998, 3, 424–453. [Google Scholar] [CrossRef]
  82. Hair, J.; Sarstedt, M.; Hopkins, L.; Kuppelwieser, V.G. Partial least squares structural equation modeling (PLS-SEM) An emerging tool in business research. Eur. Bus. Rev. 2014, 26, 106–121. [Google Scholar] [CrossRef]
  83. Nunnally, J.C.; Bernstein, I.H. The Assessment of Reliability. Psychom. Theory 1994, 3, 248–292. [Google Scholar]
  84. Fornell, C.; Larcker, D.F. Evaluating structural equation models with unobservable variables and measurement error. J. Mark. Res. 1981, 18, 39–50. [Google Scholar] [CrossRef]
  85. Henseler, J.; Ringle, C.M.; Sarstedt, M. A New Criterion for Assessing Discriminant Validity in Variance-based Structural Equation Modeling. J. Acad. Mark. Sci. 2015, 43, 115–135. [Google Scholar] [CrossRef] [Green Version]
  86. Kline, R.B. Priciples and Practice of Structural Equation Modeling, 3rd ed.; Guilford Publications: New York, NY, USA, 2011. [Google Scholar]
  87. MacKenzie, S.B.; Podsakoff, P.M.; Podsakoff, N.P. Construct measurement and validation procedures in MIS and behavioral research: Integrating new and existing techniques. MIS Q. 2011, 35, 293–334. [Google Scholar] [CrossRef]
  88. Podsakoff, P.M.; MacKenzie, S.B.; Lee, J.Y.; Podsakoff, N.P. Common method biases in behavioral research: A critical review of the literature and recommended remedies. J. Appl. Psychol. 2003, 88, 879. [Google Scholar] [CrossRef]
  89. Cook, R.D.; Weisberg, S. Residuals and influence in regression. In Chapman and Hall; Chapman and Hall: New York, NY, USA, 1982. [Google Scholar]
  90. Bollen, K.A.; Long, J.S. (Eds.) Testing Structural Equation Models; Sage: Newbury Park, CA, USA, 1993. [Google Scholar]
  91. Byrne, B.M. Testing for multigroup equivalence of a measuring instrument: A walk through the process. Psicothema 2008, 20, 872–882. [Google Scholar]
  92. Chinn, W.W. Issues and opinion on structural equation modeling. MIS Q. 1998, 22, 7–16. [Google Scholar]
  93. Cohen, J. Statistical Power Analysis for the Behavioral Science, 2nd ed.; Psychology Press: London, UK, 1988. [Google Scholar]
  94. Falk, R.F.; Miller, N.B. A Primer for Soft Modeling; University of Akron Press: Akron, OH, USA, 1992. [Google Scholar]
  95. Aiken, L.S.; West, S.G. Multiple Regression: Testing and Interpreting Interactions; Sage: Newcastle upon Tyne, UK, 1991. [Google Scholar]
  96. Aguinis, H.; Beaty, J.C.; Boik, R.J.; Pierce, C.A. Effect size and power in assessing moderating effects of categorical variables using multiple regression: A 30-year review. J. Appl. Psychol. 2005, 90, 94–107. [Google Scholar] [CrossRef] [Green Version]
  97. Scheinberg, A.; Wilson, D.C.; Rodic, L. Solid Waste Management in the World’s Cities: Water and Sanitation in the World’s Cities 2010; UN Habitat-Earthscan: Nairobi, Kenya, 2010; Available online: http://www.waste.nl/sites/waste.nl/files/product/files/swm_in_world_cities_2010.pdf (accessed on 25 March 2022).
  98. Collier, J.E. Applied Structural Equation Modeling Using AMOS: Basic to Advanced Techniques, 1st ed.; Routledge Taylor & Francis Group: New York, NY, USA, 2020. [Google Scholar]
Figure 1. The theoretical framework of MPL reduction.
Sustainability 14 06128 g001
Figure 2. The study’s conceptual framework process diagram.
Sustainability 14 06128 g002
Figure 3. SEM Analysis Process Diagram.
Sustainability 14 06128 g003
Figure 4. Measurement model of MPL reduction in Manila.
Sustainability 14 06128 g004
Figure 5. Structural latent model. Note: * p < 0.050; ** p < 0.010; *** p < 0.001.
Sustainability 14 06128 g005
Figure 6. Path model. Note: ** p < 0.010; *** p < 0.001.
Sustainability 14 06128 g006
Table 1. Model Latent Factor with corresponding manifest indicators, descriptions, and methodological backing.
Latent Factor
(Nomenclature)
Manifest
Indicator
DescriptionMethodological Backing
Environmental governance (EG: Policy and guidelines on SWM/MPL)EGa1Clear guidelines and strategy for MPL, SWMWillis, K., et. al. (2018); Wilson, D. C., et. al. (2015); [5,24],
F. Alpizar, F. Carlsson (2020). [29]
Glasbergen (1998) [42]
Plummer R., et al. (2013) [65]
Wilson, et al., (2015) [24]
Lyons et al., 2020 [10]
Allan Paul Krelling, et al., (2021) [63]
EGa2Effective mechanisms in place for waste facility
EGa3Openness, transparency, and accountability of bid processes in SWM
EGa4Institutional arrangements for SWM
EGa5Institutions SWM budget
EGa3F1SWM accounts reflect accurately the full costs of providing the service, the relative costs of the different activities within SWM
EGa3F2Annual budget adequate to cover the full costs of providing the SWM service
EGa3F3Percentage of the total number of households both using and paying for ‘primary waste collection services
EGa3F4Practices or procedures in place to support charges/fees
EGaI1Public involvement at appropriate stages of the SWM decision-making, planning and implementation process
Environmental governance (EGcv: COVID-19-related Healthcare Waste Management)EGCV1Awareness of the “Interim guidelines on the management of COVID-19-related healthcare waste”Interim COVID-19 Waste Guidelines (Adopted and modified from DENR, 2021) [66]
Benson, N.U. et al., 2021. [18]
Benson, Bassey, et al. (2021) [20]
Kuan Shiong Khoo, et al., 2021 [19]
EGCV2Use of the COVID-19 related waste management plan template
EGCV3Proper handling and management of all COVID-19-related health care waste
EGCV4Manage and contract waste service providers (“waste separation and collection, transport, treatment, and disposal”) in accordance with the adopted LGU COVID 19 plans
EGCV5Orientations on COVID 19 proper waste management
Waste Infrastructure (WInfras): Existing Technical/Waste FacilitiesT1Landfill is near waterways/riversWilson, D. C., et. al. (2015) [24]
Willis, K., et. al. (2018) [5]
T2Existing MRF
T3Artificial or special catching barriers (screen traps) to stop waste entering the sea
T4Boats cleaning the waterways, estuaries, rivers, or sea exist
T5Diversion programs, e.g., recycling to abate the marine plastic litter
WI1Waste of collection points/transfer stationsWillis, K. et al. (2018) [5]
Whiteman, A., Smith, P. and Wilson, D.C., 2001. [41]
B.P. Lyons, et al., (2020) [10]
WI2Effectiveness of street cleaning
WI3Efficiency and effectiveness of waste transport, e.g., garbage trucks
Community Participation (CParty): 3Rs and Circular Economy
Roles and responsibility to enhance packaging waste management (3Rs—reduce, reuse, recycle) in the Philippines)
CP1ConsumersCai et al., 2021 [44]
PREVENT Waste Alliance, 2020 [23]
Oke et al., 2020 [25]
Morten W. Ryberg, Alexis Laurent, 2018 [26]
Wilson, D. C., et. al. (2015) [24]
Willis, K., et. al. (2018) [5]
(GIZ, 2018) [22]
CP2Plastic producing industry (raw material)
CP3Filters and importers
CP4Retailers of plastic items (e.g., supermarkets)
CP5Government
CP6Local authorities
CP7Associations/NGOs
CP8Scientific institutions/academia
Marine Plastic Litter Reduction Solution Measures (MPLr)MPLsm1A law to introduce extended producer responsibility (EPR)(GIZ, 2018) [22]
PREVENT Waste Alliance, GIZ, 2021. [23]
Willis, K. et al. (2018) [5]
Wilson, D. C., et. al. (2015) [24]
UNEP (2016) [51]
MPLsm2Establishing deposit systems for plastic bottles
MPLsm3Establishing material recycling facilities
MPLsm4Enhancing waste collection coverage in barangays
MPLsm5Enhancing waste separation at all households and establishments
MPLsm6Co-processing of plastics in cement plants
MPLsm7Construction of incineration plants
MPLsm8Opening landfills
MPLsm9Awareness-raising campaigns
MPLsm10Conduct (beach/coastal) clean-ups
MPLsm11Banning of single-use plastic products
MPLsm12Producing packaging made from bioplastics
MPLsm13Producing packaging made from alternative materials
MPLsm14Making plastic packaging reusable and recyclable
MPLsm15Introducing (comprehensive) disposal fees
MPLsm16Introducing fines for littering
Socio-economic activities (SEas)SEa1Single-use plastic packaging is an expression of economic prosperity (plastic use from extraction, consumer, post-consumer, disposal, with links to the linear economy)GIZ, 2018 [22]
Jambeck et al., 2015 [4]; L.C.M. Lebreton et al., 2017 [3]
Faten Loukil and
Lamia Rouched 2012 [50]
Sophie M.C. Davison, et al., 2021 [35]
Nelms et al., 2020 [36]; Rochman et al., 2016 [64]
Binetti et al., 2020 [32]
SEa3Threat to the environment, human health, and economic prosperity (industrialization has been associated with an increase in packaging waste)
SEa4Plastic consumption contributes to climate change
SEa7Quantity of plastic pollution in the natural environment is increasing
MPL Leakage (MPLe: Pathways (routes) contribute to litter in the marine environment)MPLa1Litter reaches the sea from rivers, canals, creeks, and estuariesAlpizar et al., 2020 [29]
Gasperi et al., 2014 [55]; Morritt et al., 2014 [56]; Mani et al., 2015 [54]; Lebreton et al., 2017) [3],
Di and Wang, 2018 [53]; Magni et al., 2019) [52]
Jambeck et al., 2014 [4]; L.C.M. Lebreton et al., 2017 [3]
(GIZ, 2018) [22]
MPLa2Litter is blown into the sea from landfills
MPLa3Flooding and sewage overflows
MPLa4Direct release on the coast, e.g., beach users, coastal tourism
MPLa5Direct release in the sea (by fishing, ships, and offshore industries)
Manila Public Behavior and the MPL Problem (SE: factors in the city contributing to public plastic littering of the environment)SEb1Public behavior in terms of litteringIssahaku, Adam, et al. (2021) [61]
(GIZ, 2018) [22]
SEb2Lack of waste collection and separation
SEb3Lack of adequate waste management infrastructure and facility
SEb4Intense consumption of single-use plastics
SEb5Lack of enforcement of waste disposal directives
SEb6Lack of funding for waste collection
Table 2. Measurement of model fit.
Criterion of Model FitAbsolute Fit AcceptanceValues of Model FitTest Result
RMSEA<0.080.035Established
SRMR<0.080.042Established
pClose>0.051.000Established
GFI≥0.900.885Acceptable
AGFI≥0.900.868Acceptable
CFI≥0.900.956Established
IFI≥0.900.957Established
TLI≥0.900.952Established
χ2/df<3.001.507Established
Note: RMSEA = root mean square estimation approximation, GFI = goodness-of-fit index, CFI = comparative fit index. TLI = Tucker Lewis index, IFI = incremental fit index, adjusted goodness-of-fit index (AGFI), df = degrees of freedom.
Table 3. Fornell-Lacker criterion: reliability results, discriminant validity, correlation coefficient, and descriptive statistics.
CRAVEEGcvMPLrSEMPLeCPartySEasEGWInfras
EGcv0.8350.5590.748
MPLr0.9380.5600.269 ***0.748
SE0.8750.5400.116 *0.239 ***0.735
MPLe0.8640.5610.073 †0.226 ***0.437 ***0.749
CParty0.8650.5700.213 ***0.236 ***0.443 ***0.366 ***0.755
SEas0.7550.5080.15 **0.307 ***0.402 ***0.552 ***0.329 ***0.713
EG0.8100.5180.577 ***0.110 *0.036 †−0.075 †0.118 *−0.069 †0.719
WInfras0.7700.5290.049 †0.100 ***0.008 †0.039 †0.054 †0.101 †0.021 †0.727
Cronbach’s Alpha0.9040.9570.8790.8850.9130.7800.9000.791
Average Mean3.203.383.603.303.573.542.772.50
Average Std. Deviation0.670.650.530.640.570.550.780.95
Note: CR = composite reliability; AVE = average variance extracted; ASV = Average Shared Squared Variance. Interpretation for “Convergent Validity: CR > 0.7, CR > AVE, AVE > 0.5; for Discriminant Validity: ASV < AVE” (Fornell, C., and Larcker, 1981). Cronbach’s alpha reliability coefficient > 0.7. Significance correlations: † p > 0.100; * p < 0.050; ** p < 0.010; *** p < 0.001.
Table 4. HTMT analysis.
ConstructSEasWInfrasEGEGcvCPartyMPLeSEMPLr
SEas
WInfras0.101
EG−0.0690.021
EGcv0.1500.0490.578
CParty0.3300.0540.1190.213
MPLe0.5560.038−0.0840.0700.356
SE0.3960.0080.0350.1140.4380.434
MPLr0.3040.1080.1090.2680.2340.2310.232
Table 5. Path model fit.
Criterion of Model FitAbsolute Fit AcceptanceValues of Model FitTest ResultValues of Model FitTest Result
Structural Latent ModelPath Model
p-Value for X2-TestInsignificant0.000Significant0.313Insignificant
RMSEA<0.080.035Established0.021Established
SRMR<0.080.046Established0.015Established
pClose>0.051.000Established0.730Established
GFI≥0.900.882Acceptable0.997Established
AGFI≥0.900.866Acceptable0.975Established
CFI≥0.900.955Established0.999Established
IFI≥0.900.955Established0.999Established
TLI≥0.900.951Established0.994Established
χ2/df<3.001.524Established1.190Established
Note: Root mean square estimation approximation (RMSEA), standardized root mean square residual (SRMR), goodness-of-fit index (GFI), adjusted goodness-of-fit index (AGFI), a comparative fit index (CFI), incremental fit index (IFI), and Tucker–Lewis index (TLI).
Table 6. Parameter estimates of the path model.
Causal RelationshipStandardized βUnstandardized βS.E.C.R.p-Value
WInfrasEG0.0100.0090.0310.2870.774
EGcvEG0.6850.8320.04418.8730.001
CPartyEG0.0400.0500.0520.9530.341
SEEG0.0390.0510.0560.9000.368
SEasEG−0.231−0.3640.065−5.6270.001
EGMPLr−0.035−0.0300.052−0.5770.564
SEasMPLe0.5210.5970.04513.2920.001
EGMPLe−0.084−0.0610.025−2.4560.014
CPartyMPLe0.1200.1090.0363.0290.002
SEMPLe0.2150.2050.0395.2380.001
SEMPLr0.1050.1170.0562.1020.036
EGcvMPLr0.2620.2730.0634.2930.001
SEasMPLr0.2530.3410.0704.8770.001
Table 7. Mediation results.
RelationshipDirect Effect
(Unstd. β (p-Value))
Indirect EffectConfidence Intervalp-ValueInterpretation
Lower BoundUpper Bound
EGcv → EG → MPLe0.832 (0.001)−0.051−0.095−0.0080.023Partial mediation
SEas → EG → MPLe0.597 (0.001)0.0220.0040.0470.018Partial mediation
Table 8. Multigroup differences (male and female).
Causal Path RelationshipMaleFemale
Estimatep-ValueEstimatep-Valuez-Score
WInfrasEG−0.0220.6760.0240.5400.701
EGcvEG0.7670.0000.8780.0001.250
CPartyEG0.0190.8230.0690.2950.466
SEEG−0.0360.6910.0850.2331.049
SEasEG−0.2080.053−0.4320.000−1.658 *
EGMPLr0.0840.350−0.0800.208−1.488
SEasMPLe0.6020.0000.5950.000−0.075
EGMPLe−0.1130.003−0.0370.2451.523
CPartyMPLe0.1210.0230.1050.026−0.225
SEMPLe0.1940.0000.2070.0000.164
SEMPLr0.0880.3510.1340.0550.392
EGcvMPLr0.2680.0070.2610.001−0.050
SEasMPLr0.4360.0000.2810.001−1.060
Note: * p-value < 0.10.
Table 9. Hypothesis analytics.
Hypothesis Path RelationshipCoefficientt-ValueInterpretation
H1: WInfras → EG0.0100.287Not Supported
H2: EGcv → EG0.68518.873 ***Supported
H3: EGcv → MPLr0.2624.293 ***Supported
H4: CParty → EG0.0400.953Not Supported
H5: CParty → MPLe0.1203.029 **Supported
H6: SEas → EG−0.231−5.627 ***Supported
H7: SEas → MPLr0.2534.877 ***Supported
H8: SEas → MPLe0.52113.292 ***Supported
H9: SE → MPLr0.1052.102 *Supported
H10: SE → MPLe0.2155.238 ***Supported
H11: EGcv → EG → MPLe (Mediation)−0.051−2.318 *Supported
H12: SEas → EG → MPLe (Mediation)0.0222.000 *Supported
H13: EG → MPLr−0.035−0.577Not Supported
H14: EG → MPLe−0.084−2.456 **Supported
H15: SEas → EG (Multigroup)−0.208−5.374 ***Supported
Note: *** p-value < 0.001, ** p-value < 0.01; * p-value < 0.05.
Publisher’s Note: MDPI stays neutral with regard to jurisdictional claims in published maps and institutional affiliations.

