
Insulator Breakage Detection Based on Improved YOLOv5


Abstract
:1. Introduction
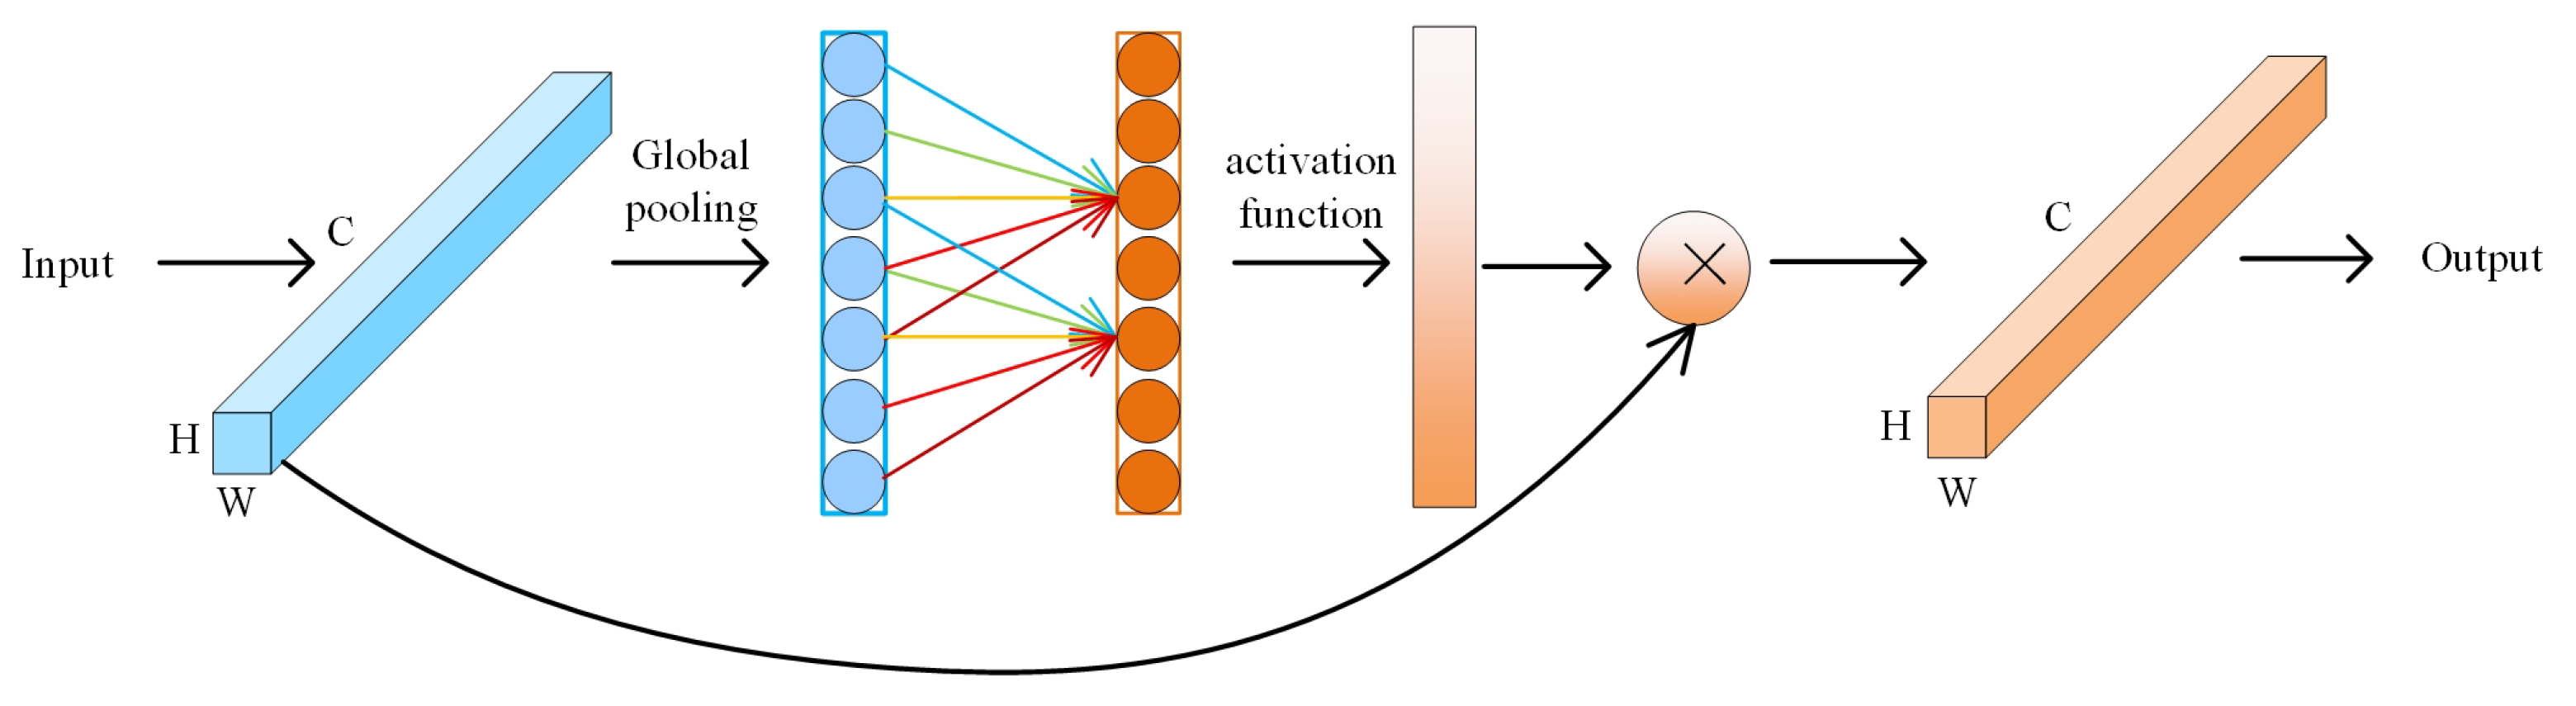
- Fuses the attention mechanism ECA-Net [42] in its backbone feature extraction layer to compensate for the lack of information between channels by enhancing the information interaction between each channel and adaptively assigning the weights of background and target features;
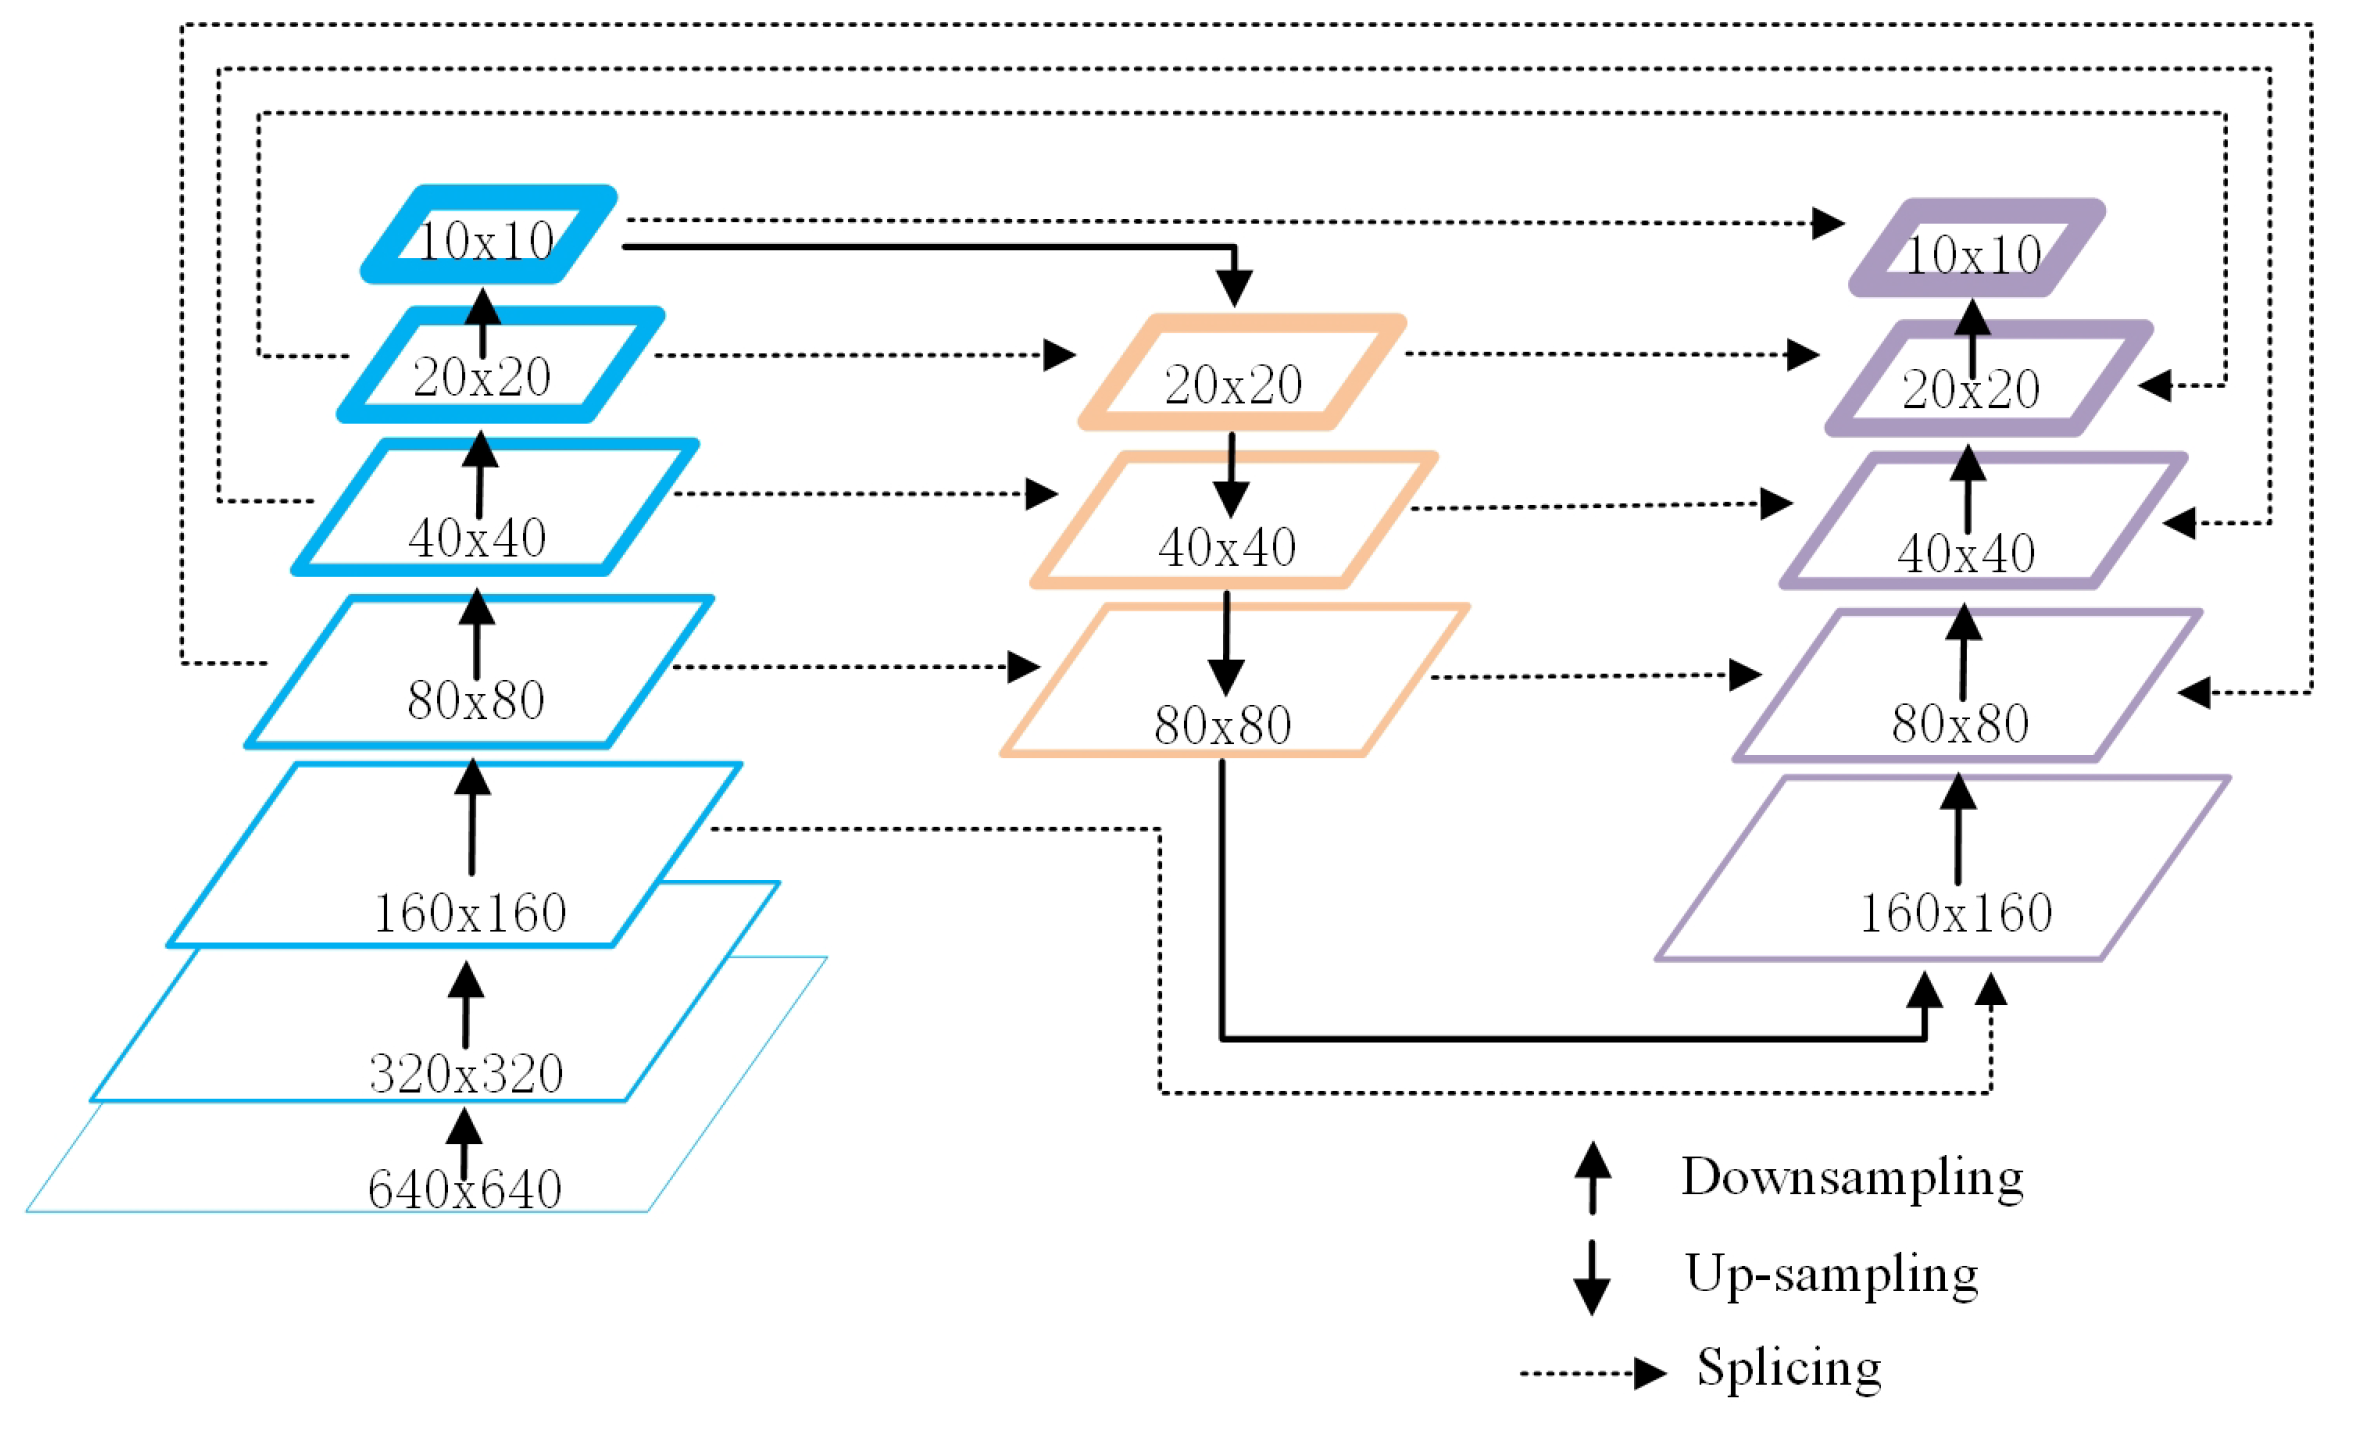
- Increases the proportion of small target feature maps in the feature fusion layer of the network through a two-way feature fusion network; the proportion of small target feature maps in the network is increased to effectively prevent the loss of small target information to detect small targets;
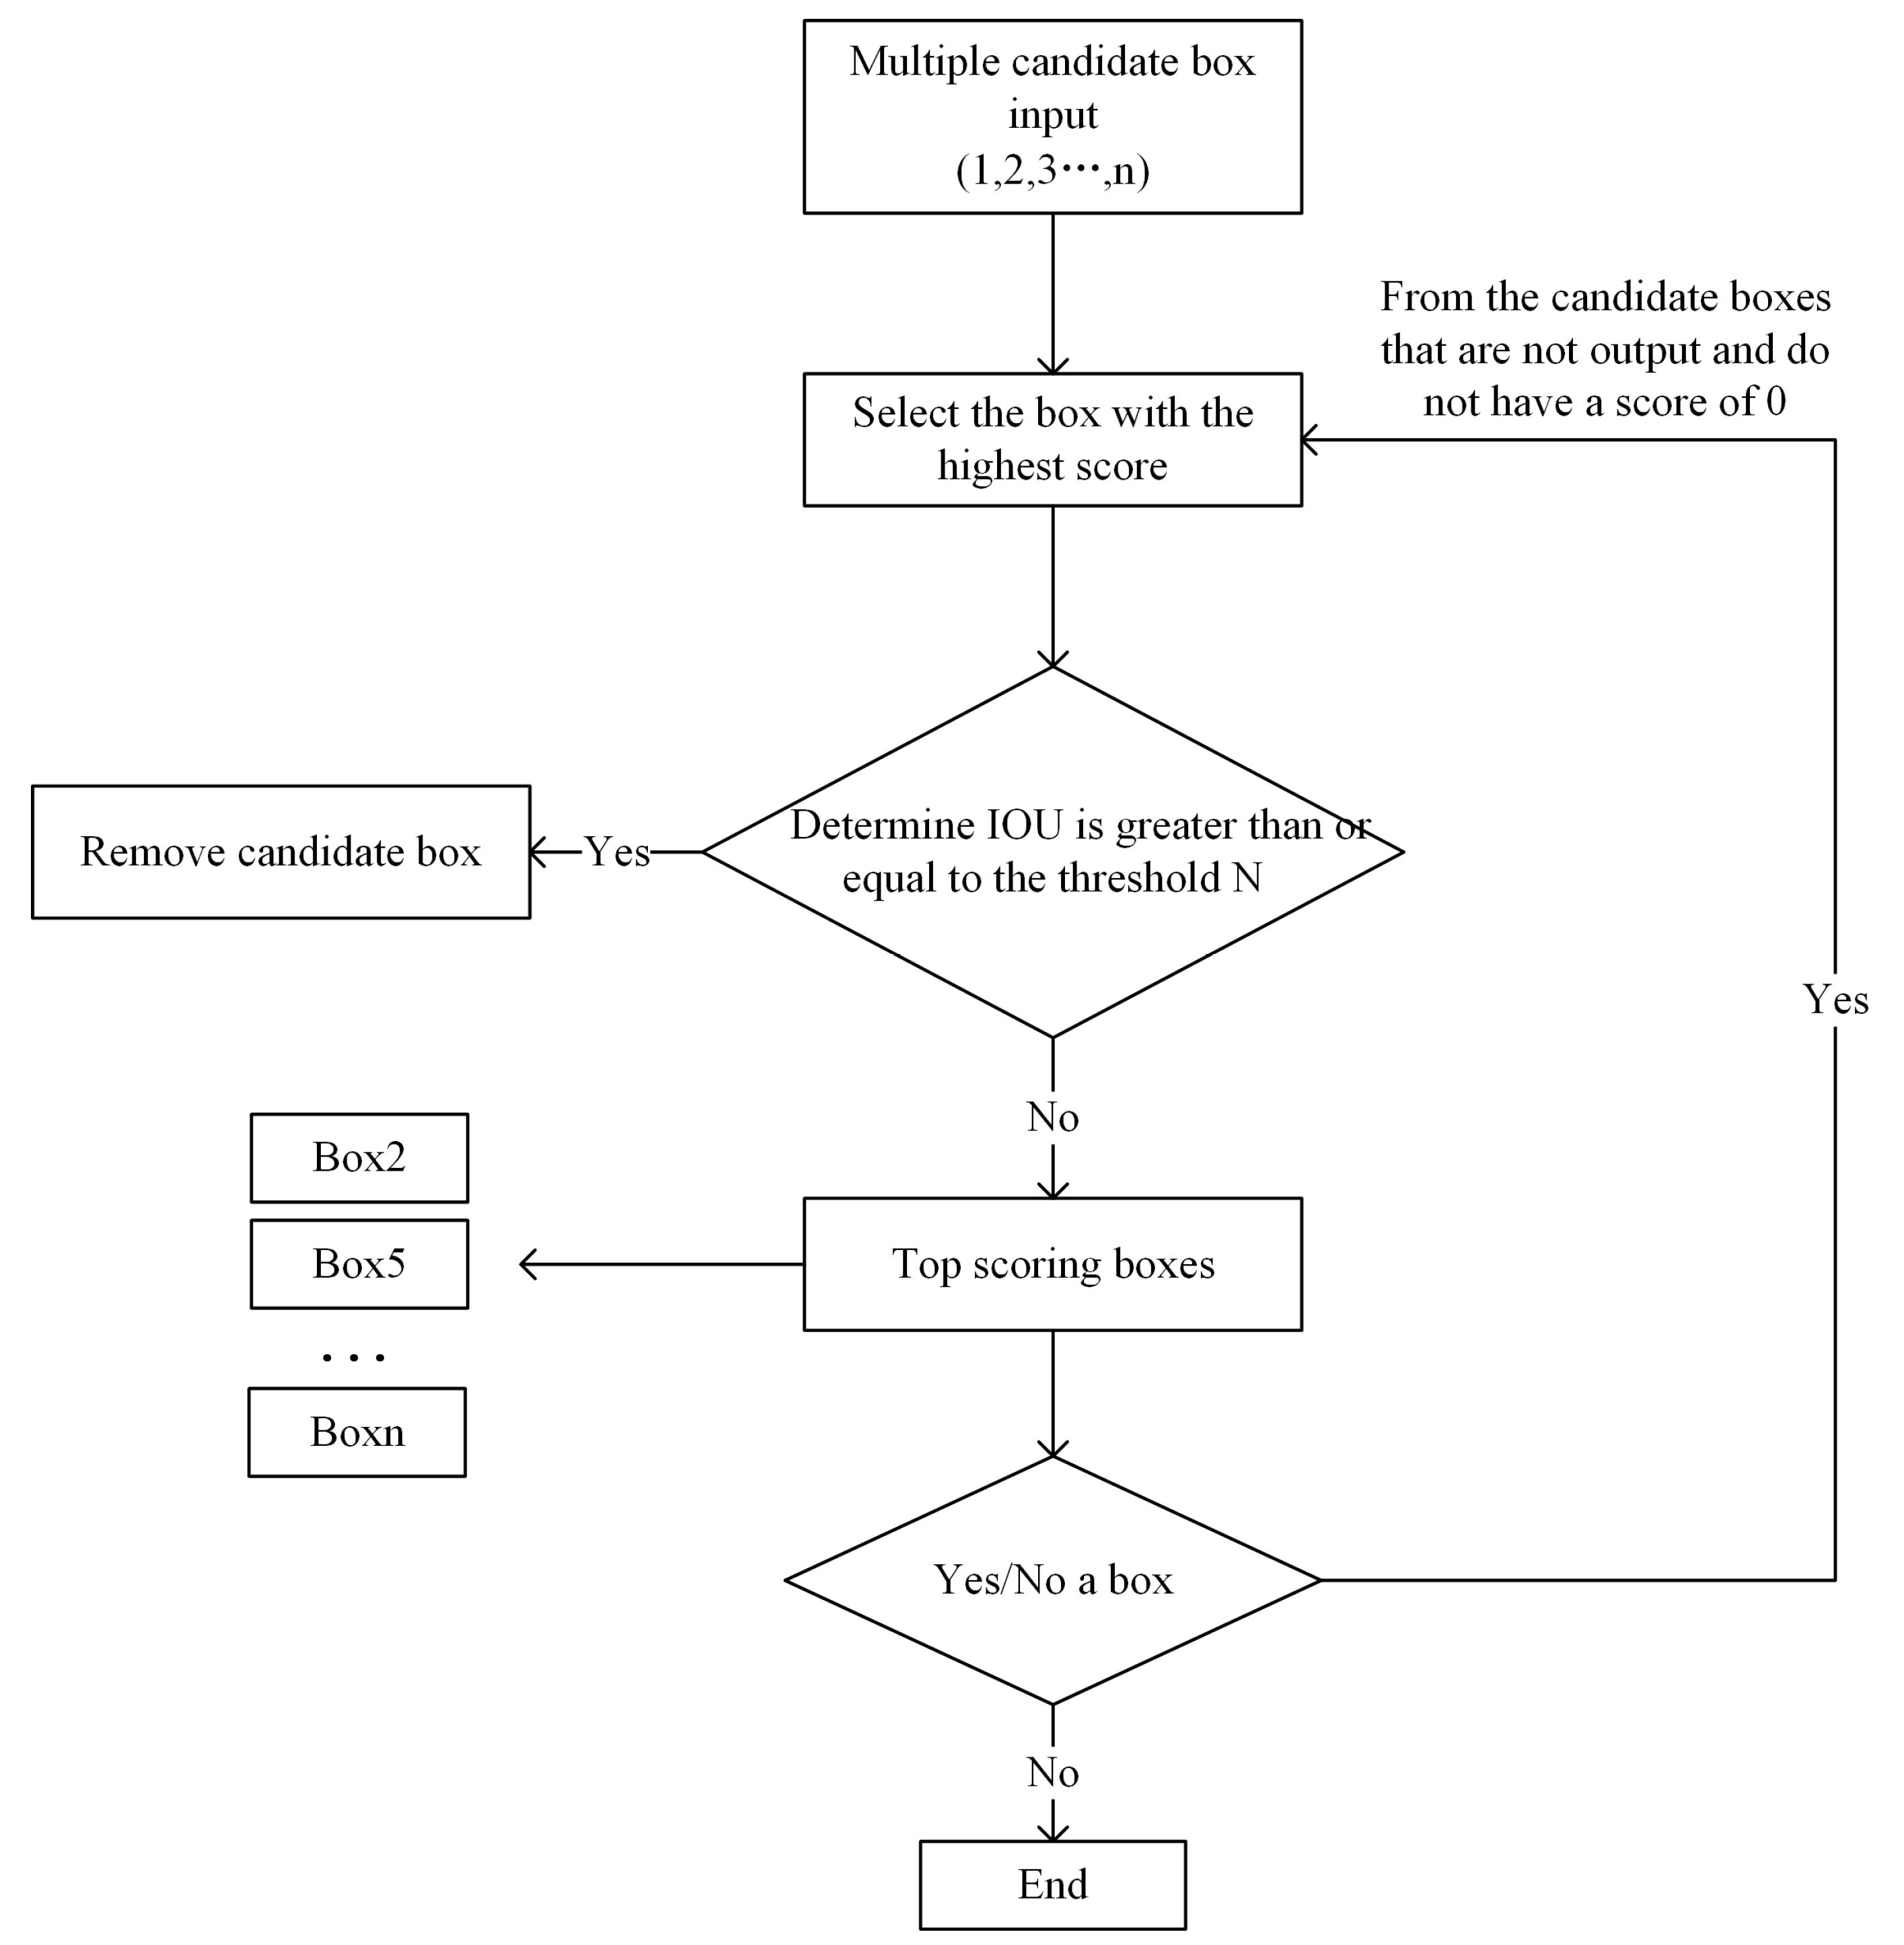
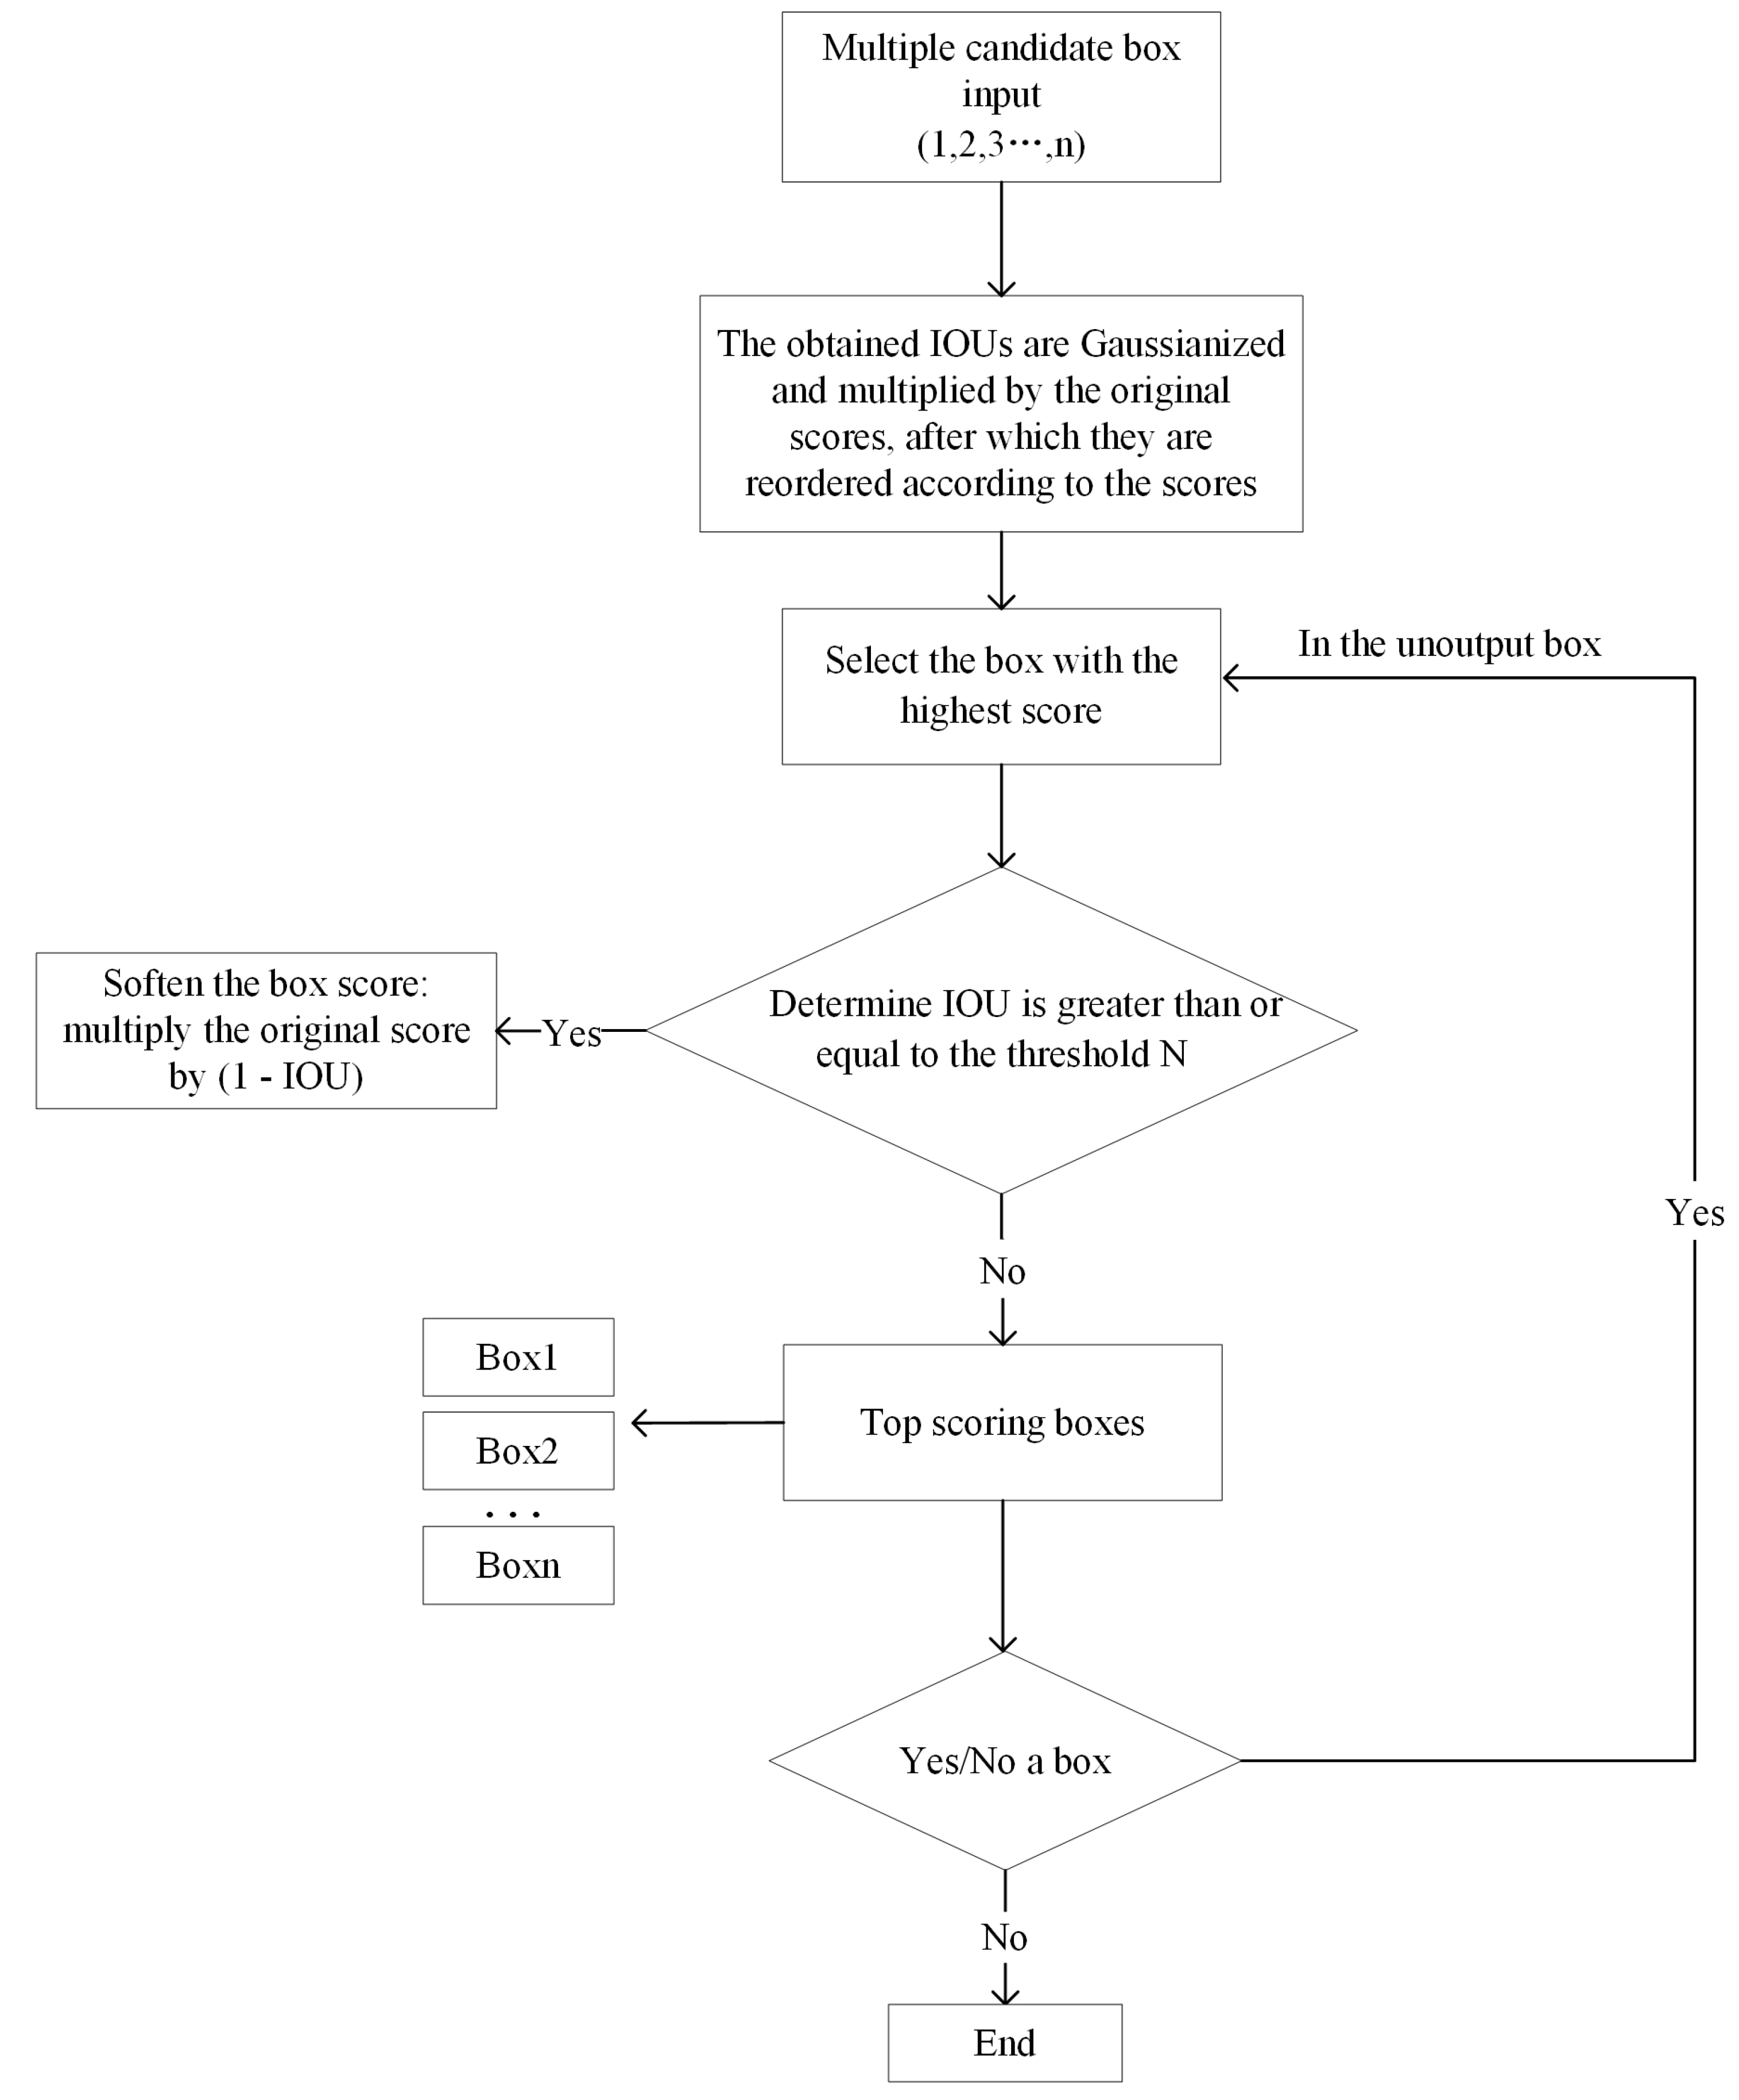
- The Soft-NMS algorithm [43], which uses a reassignment of the scores of the original candidate frames to prevent overlapping candidate frames from being rejected, improves the detection accuracy of overlapping insulators.
2. Yolov5 Model
2.1. Principle of YOLOv5 Algorithm
2.1.1. Principle of YOLOv5 Algorithm
2.1.2. Feature Fusion Layer
2.1.3. Prediction Layer
2.1.4. Loss Function
2.1.5. Comparison of YOLOv5 and Each Model
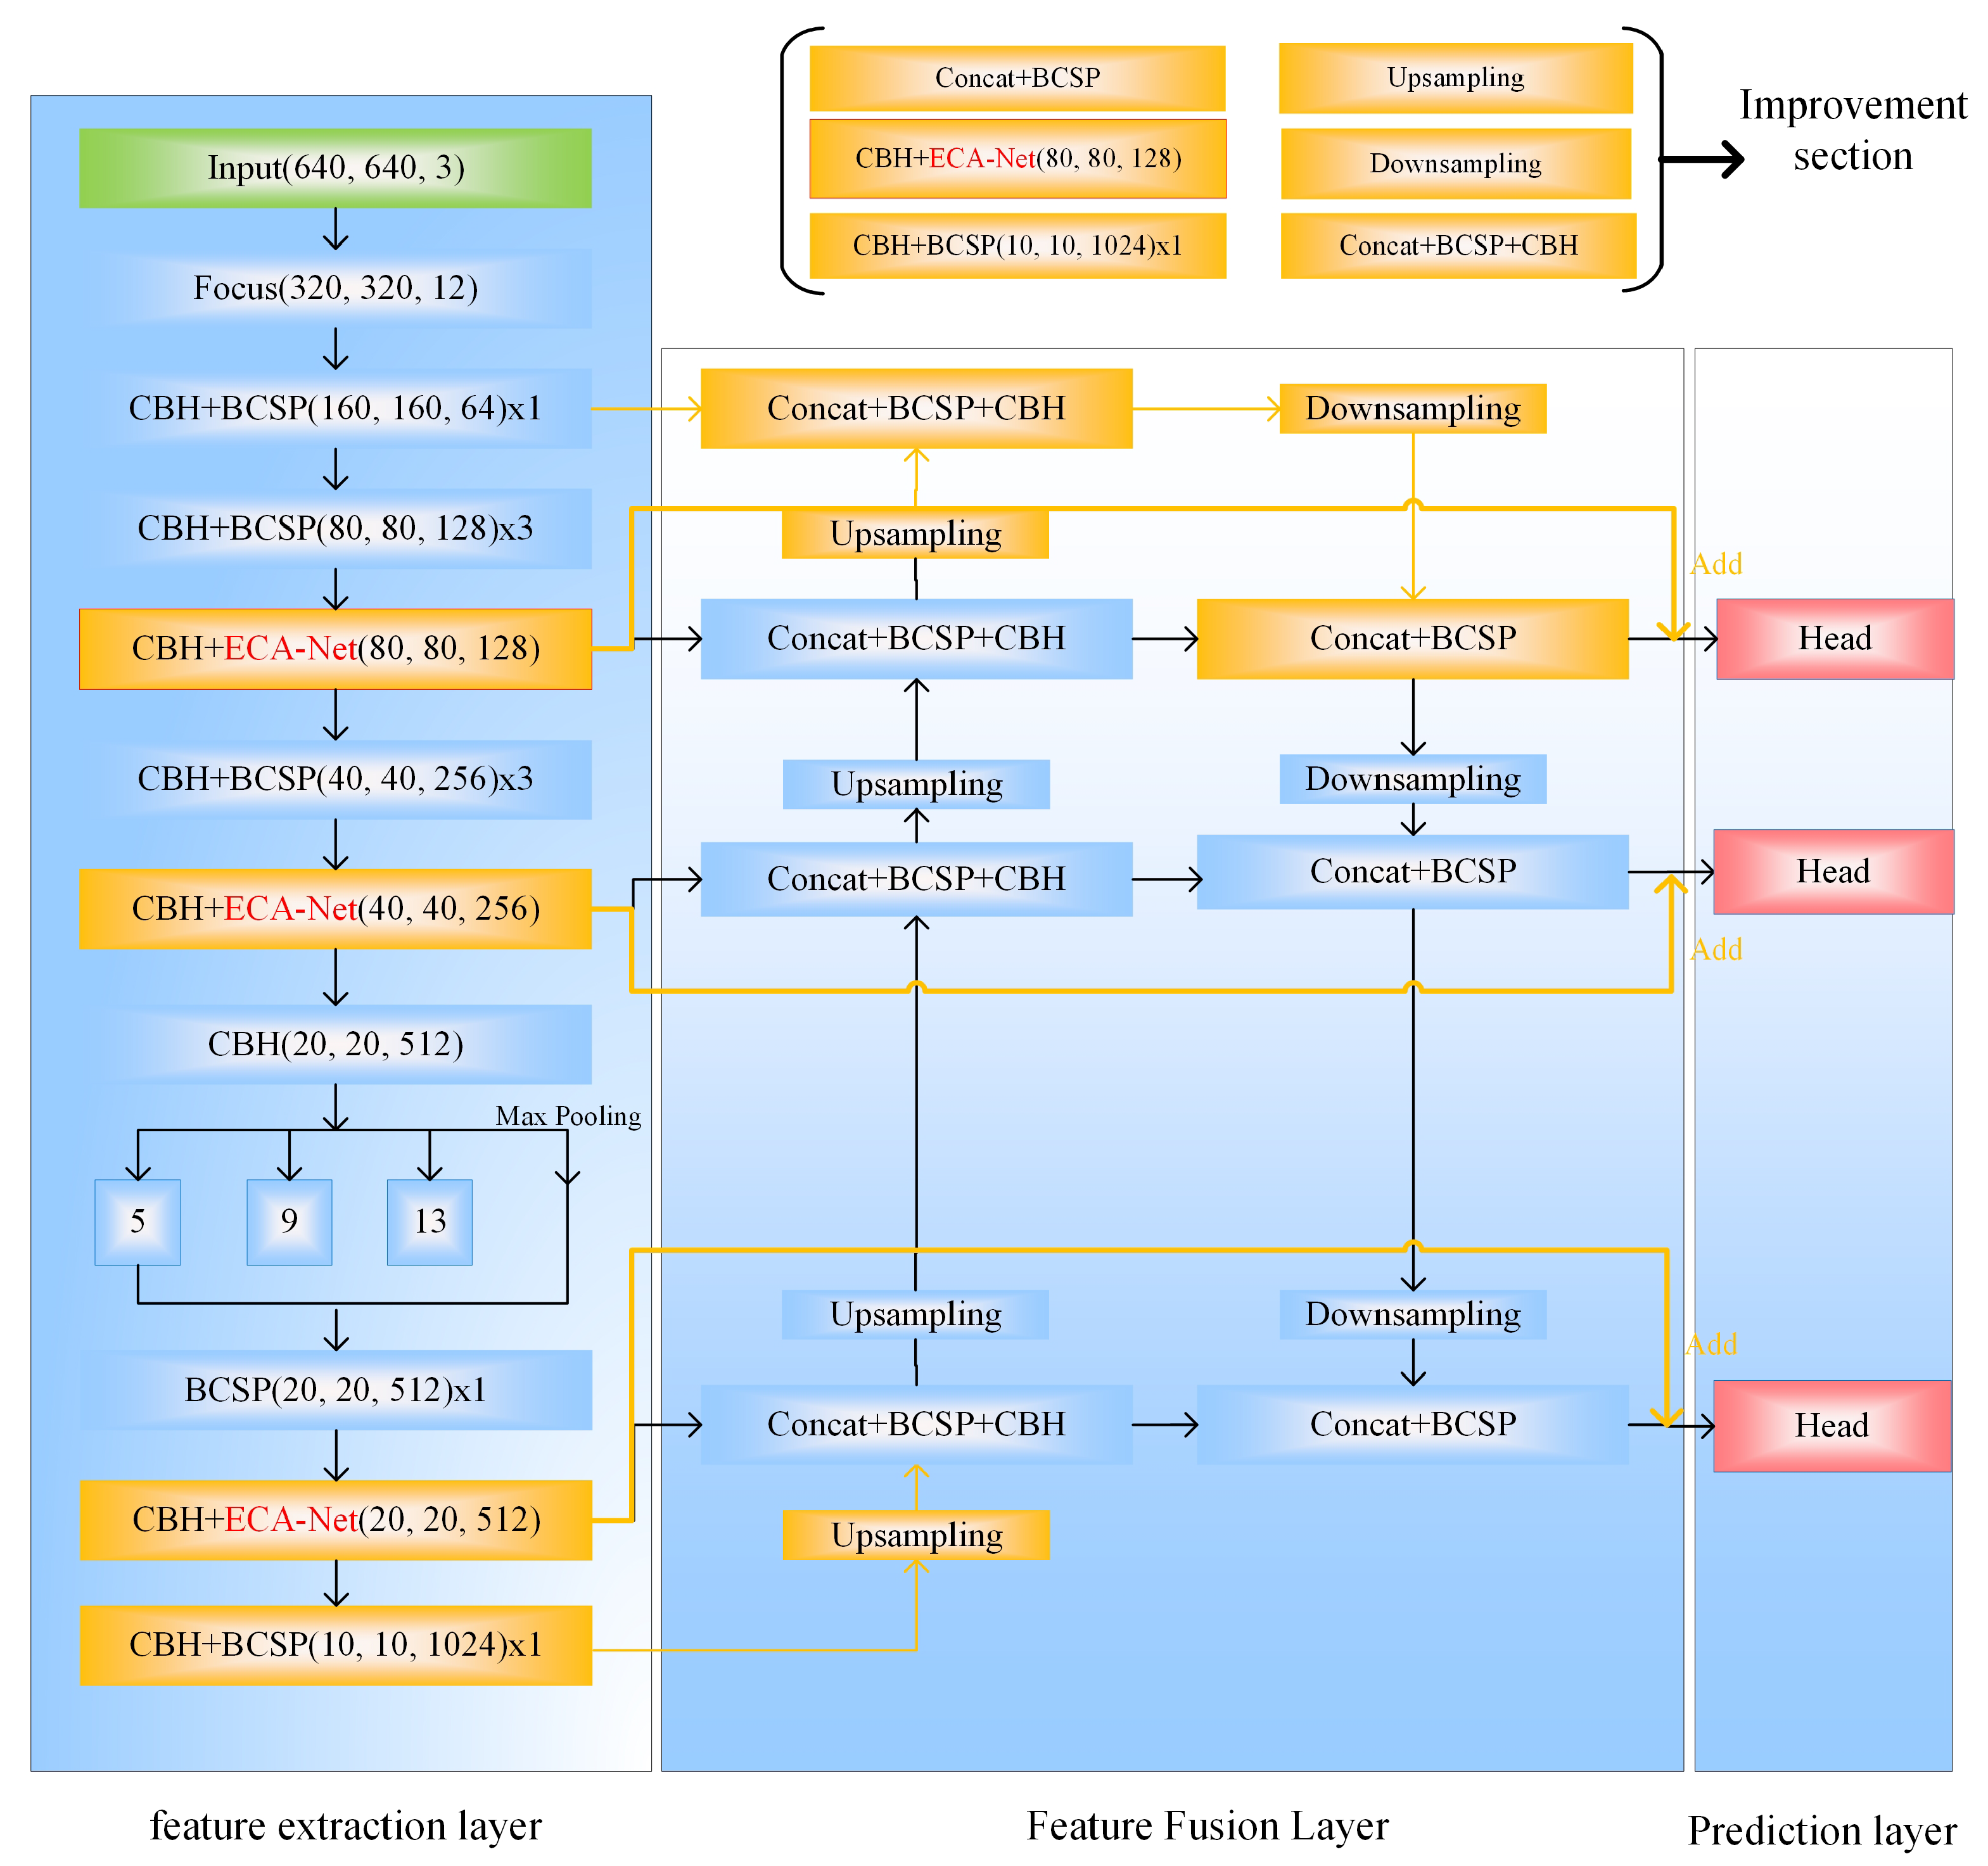
3. Improved Algorithm Based on YOLOv5
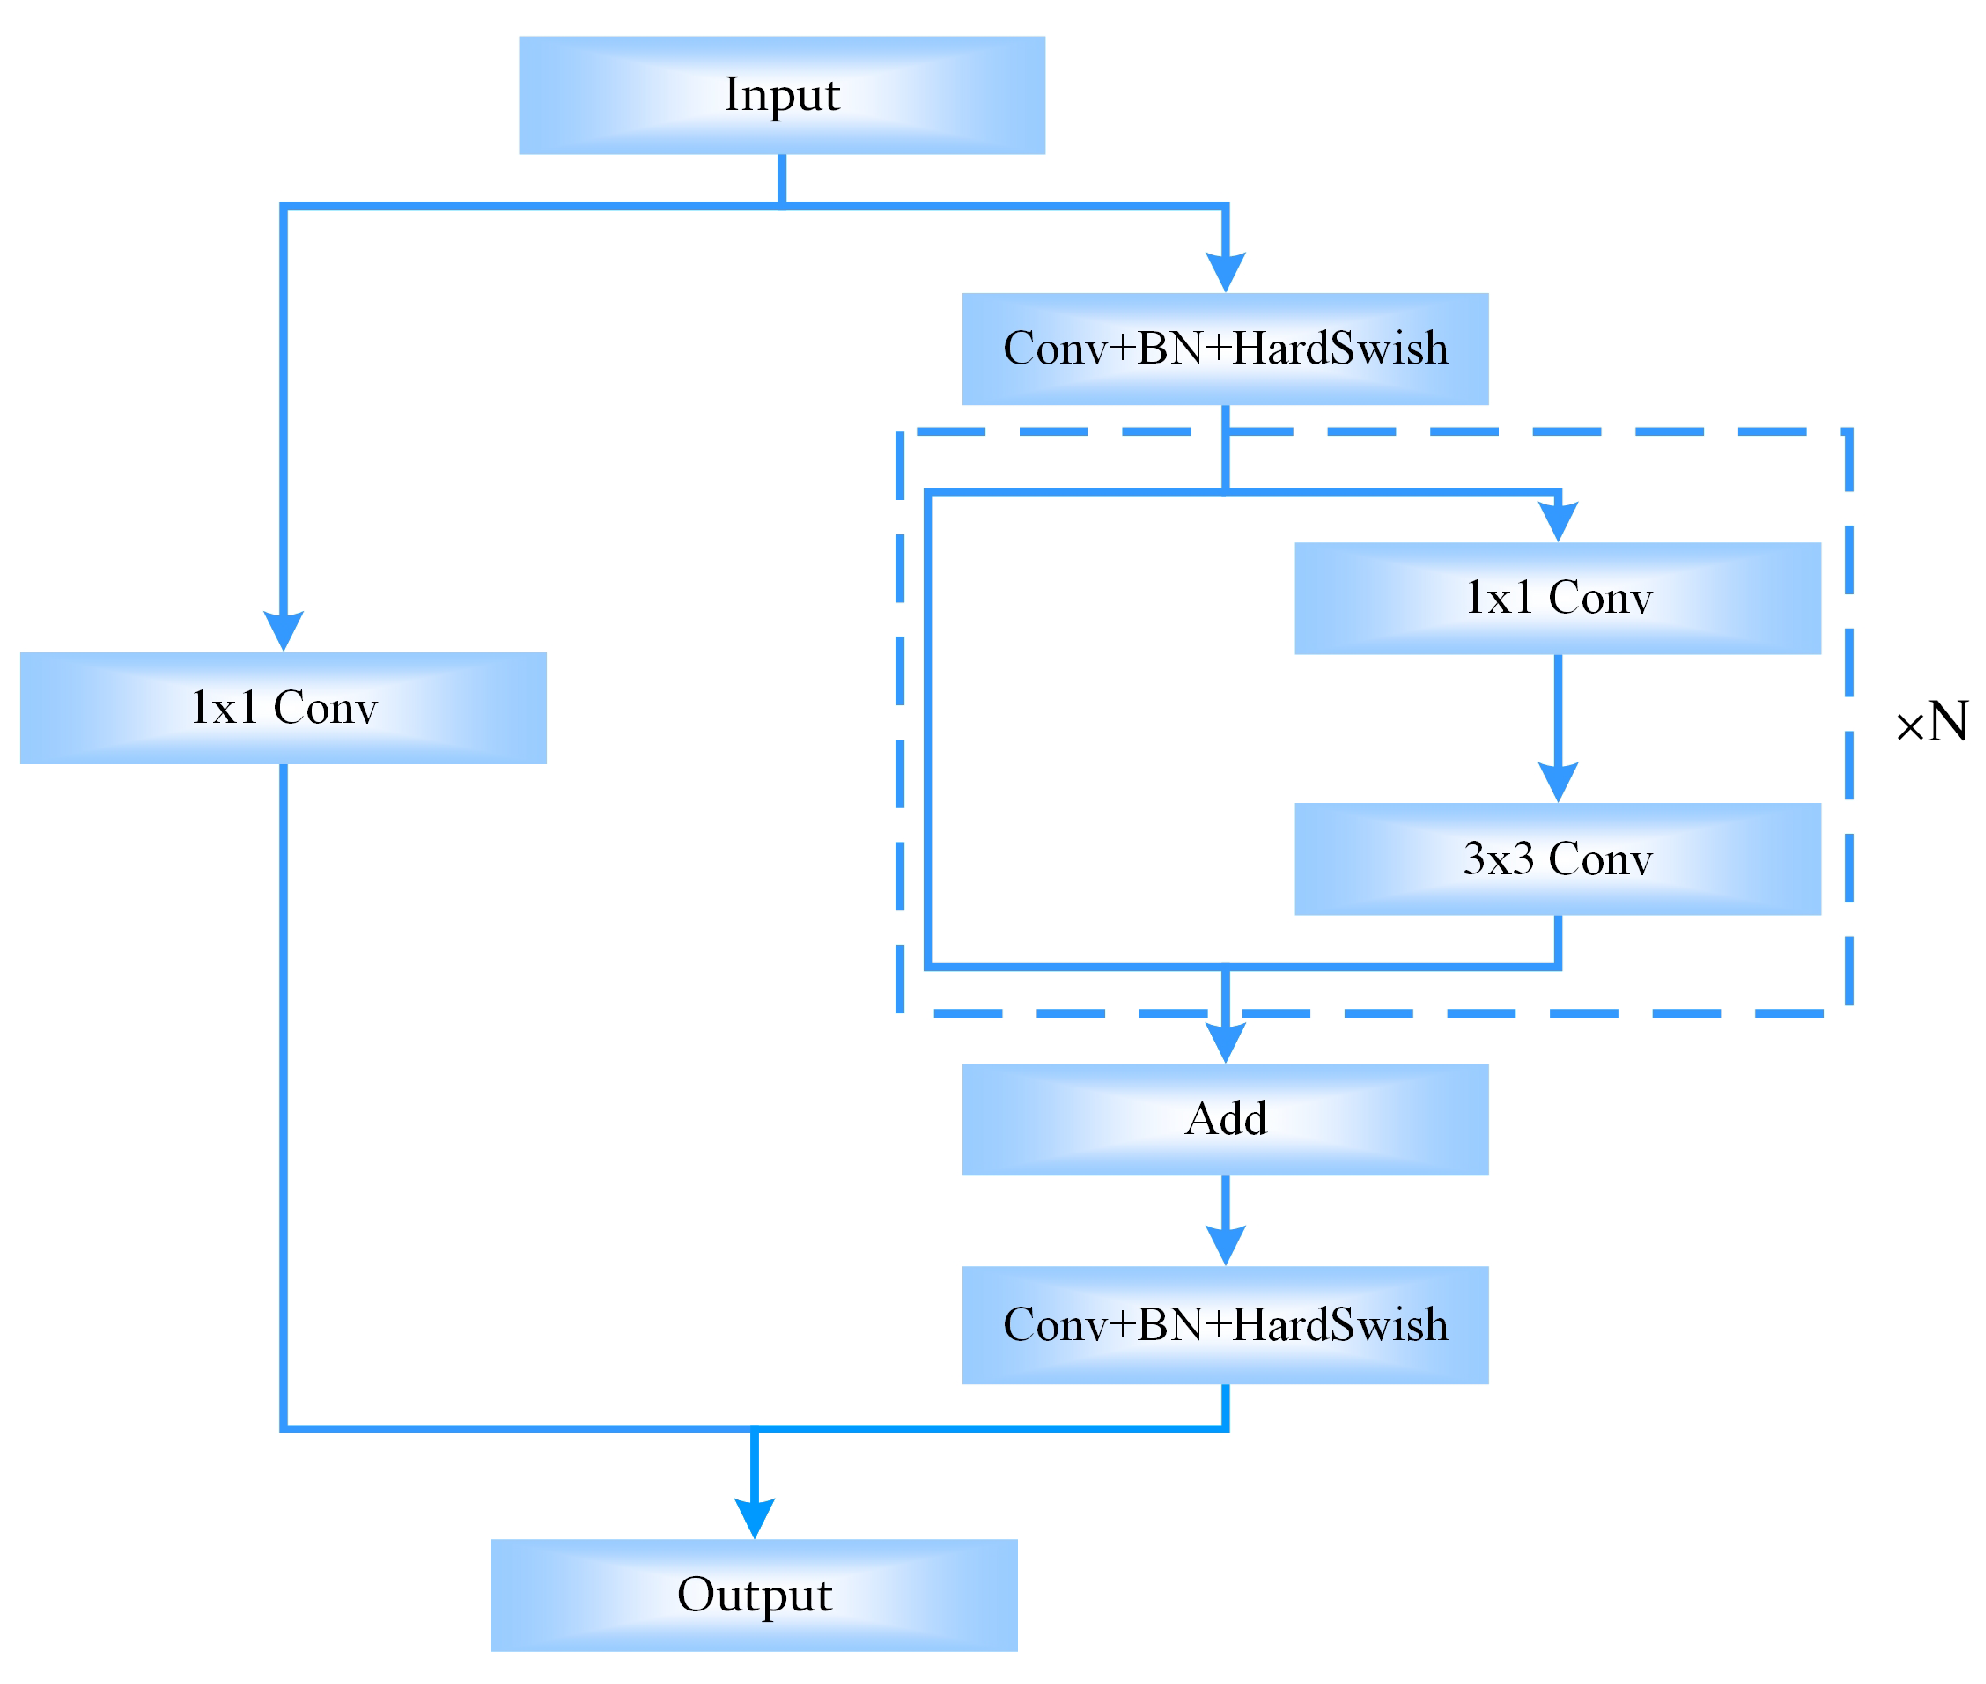
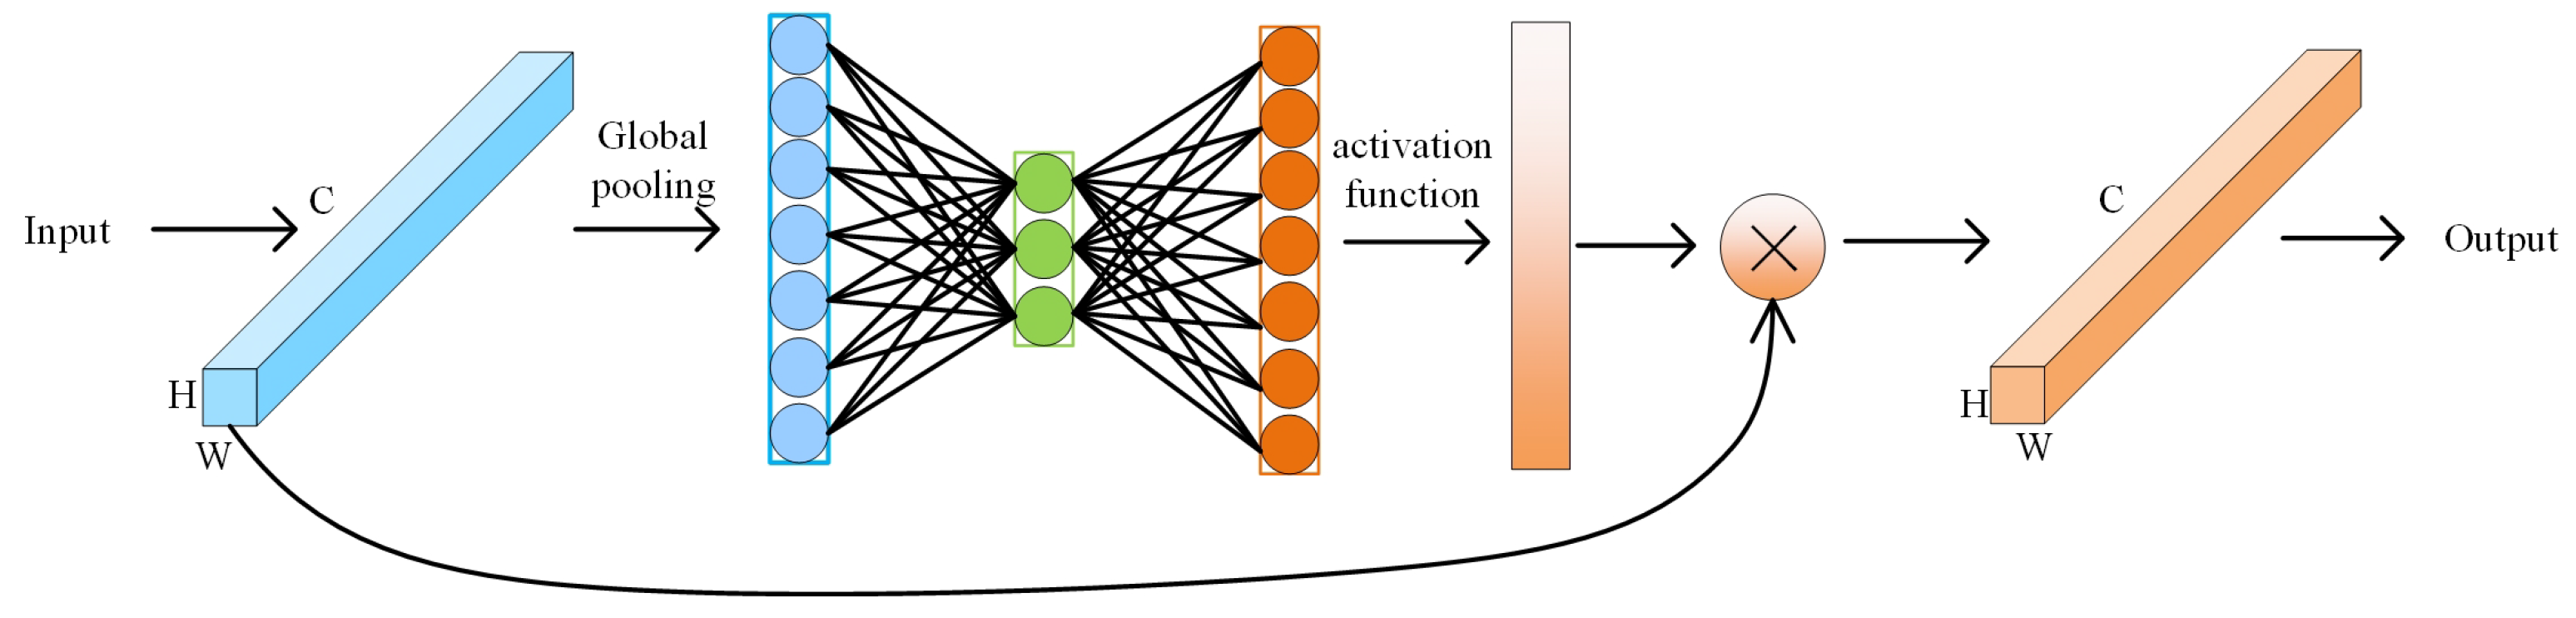
3.1. Backbone Feature Extraction Based on Attention Mechanism ECA-Net
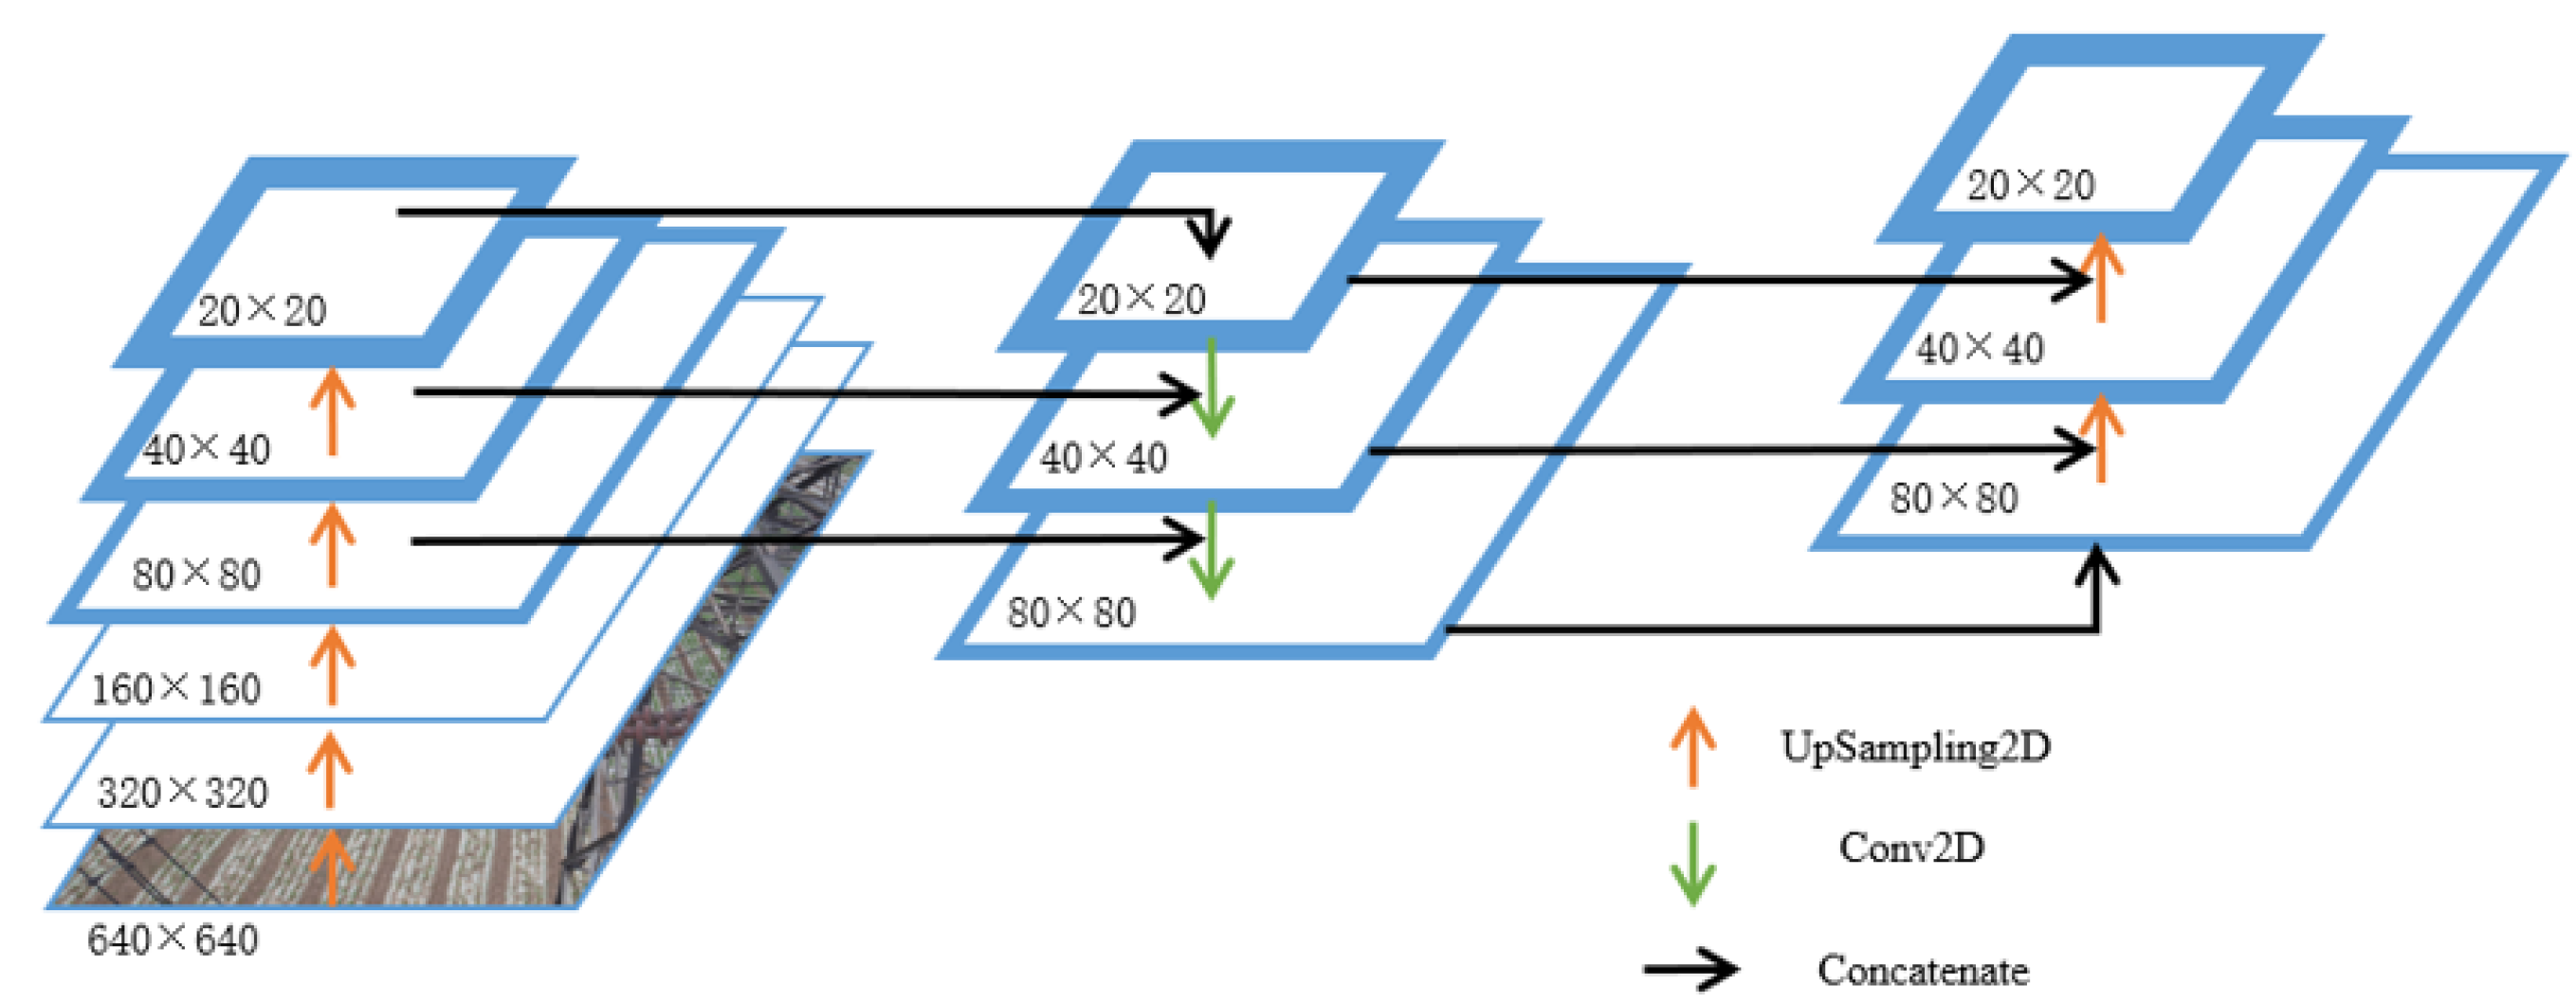
3.2. Bi-Fpn-Based Feature Fusion Network
3.3. Soft-NMS-Based Candidate Frame Algorithm
3.4. Improved YOLOv5 Algorithm Structure
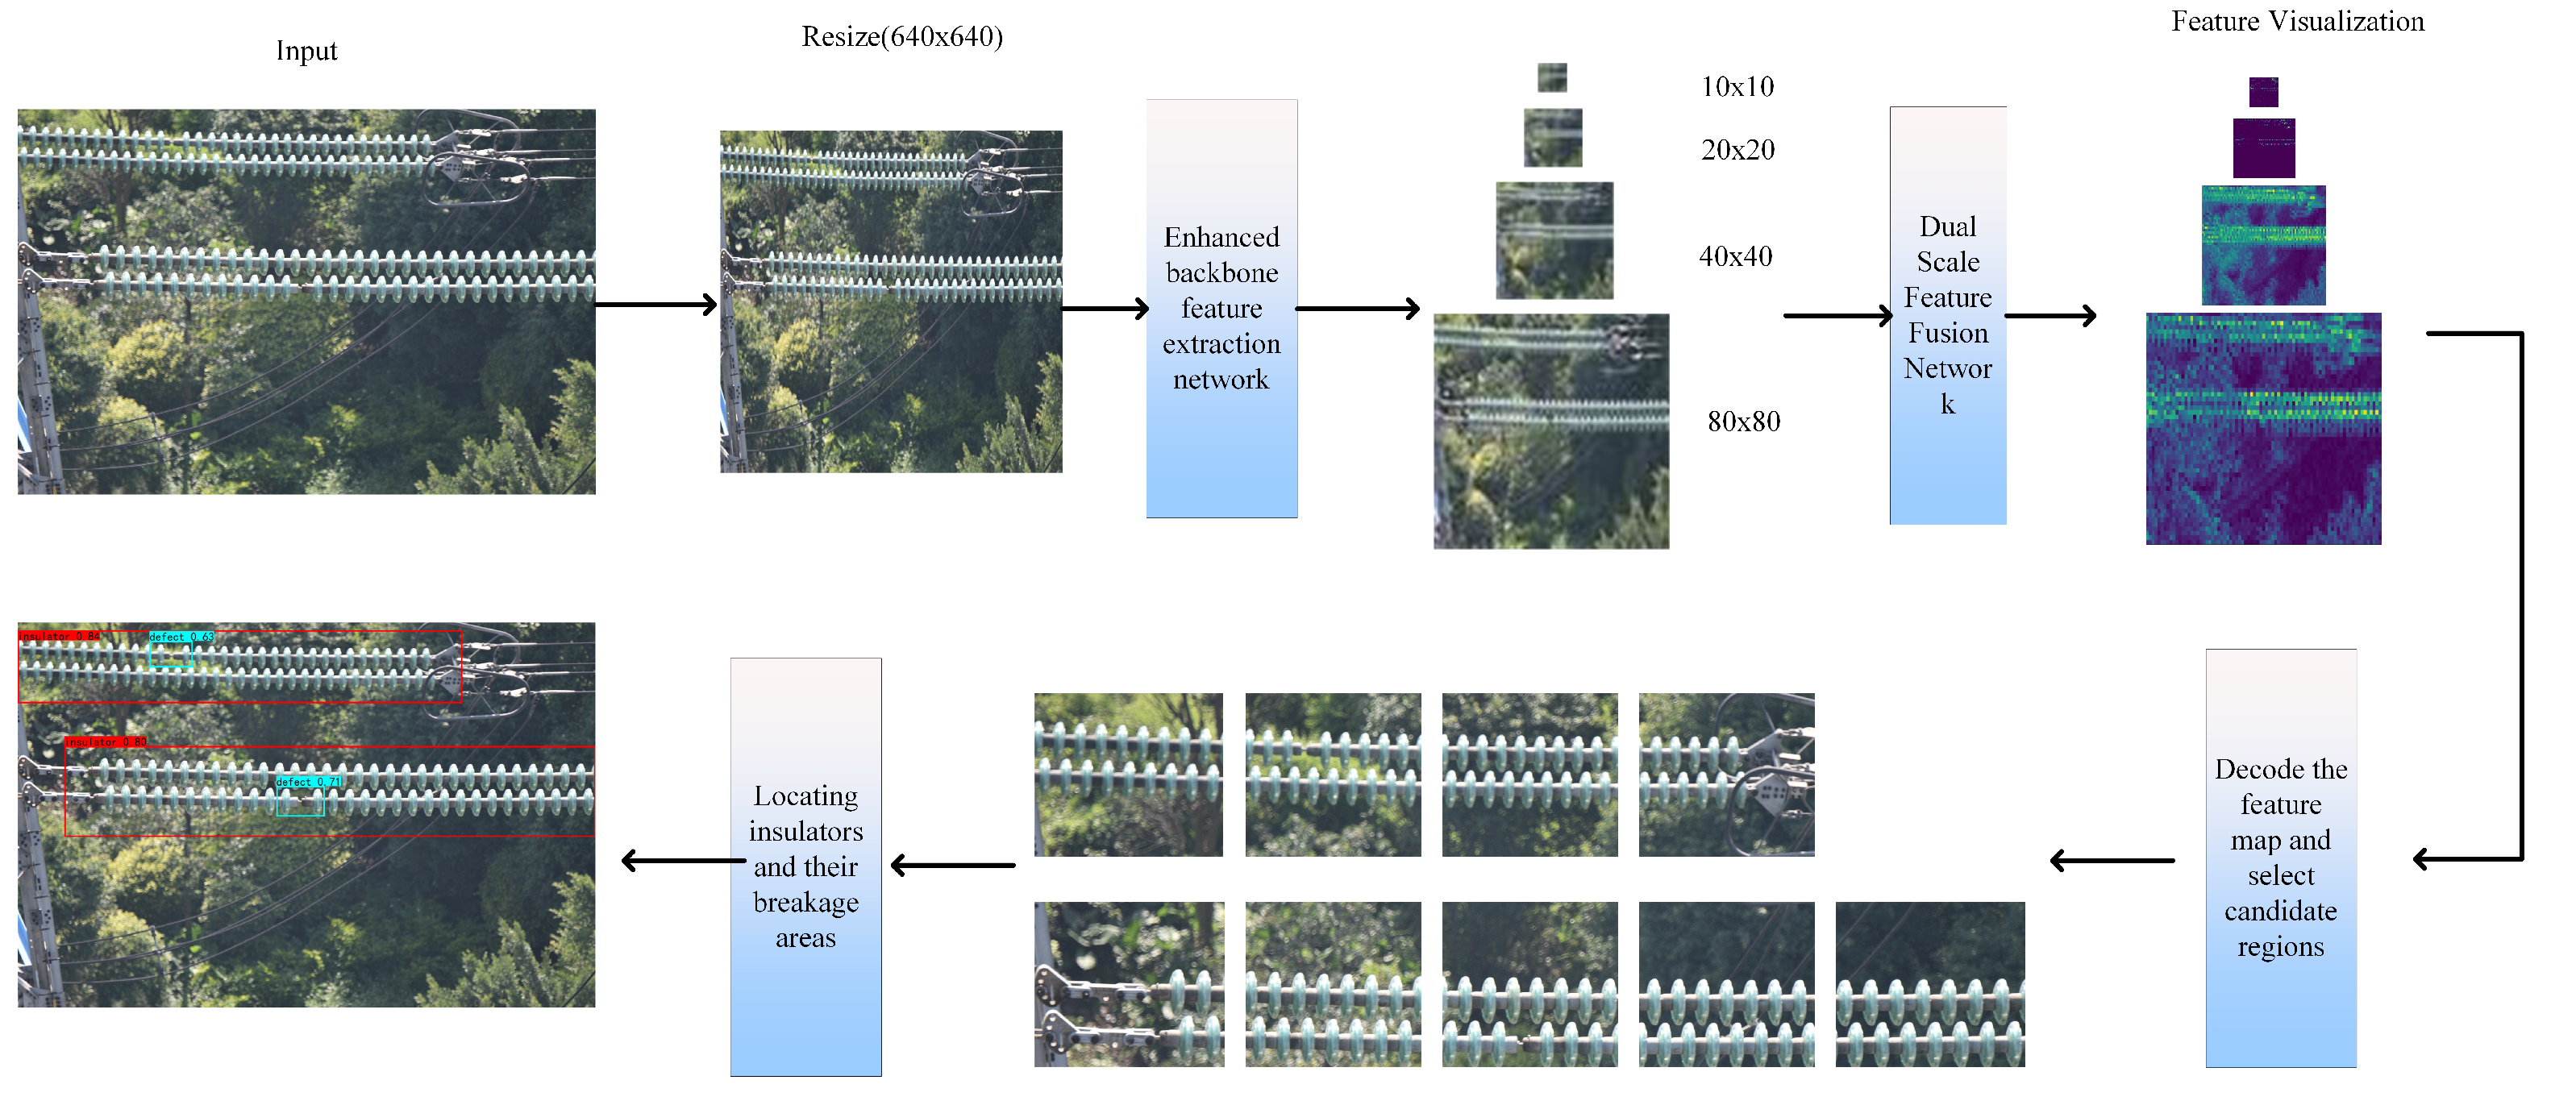
4. Example Analysis
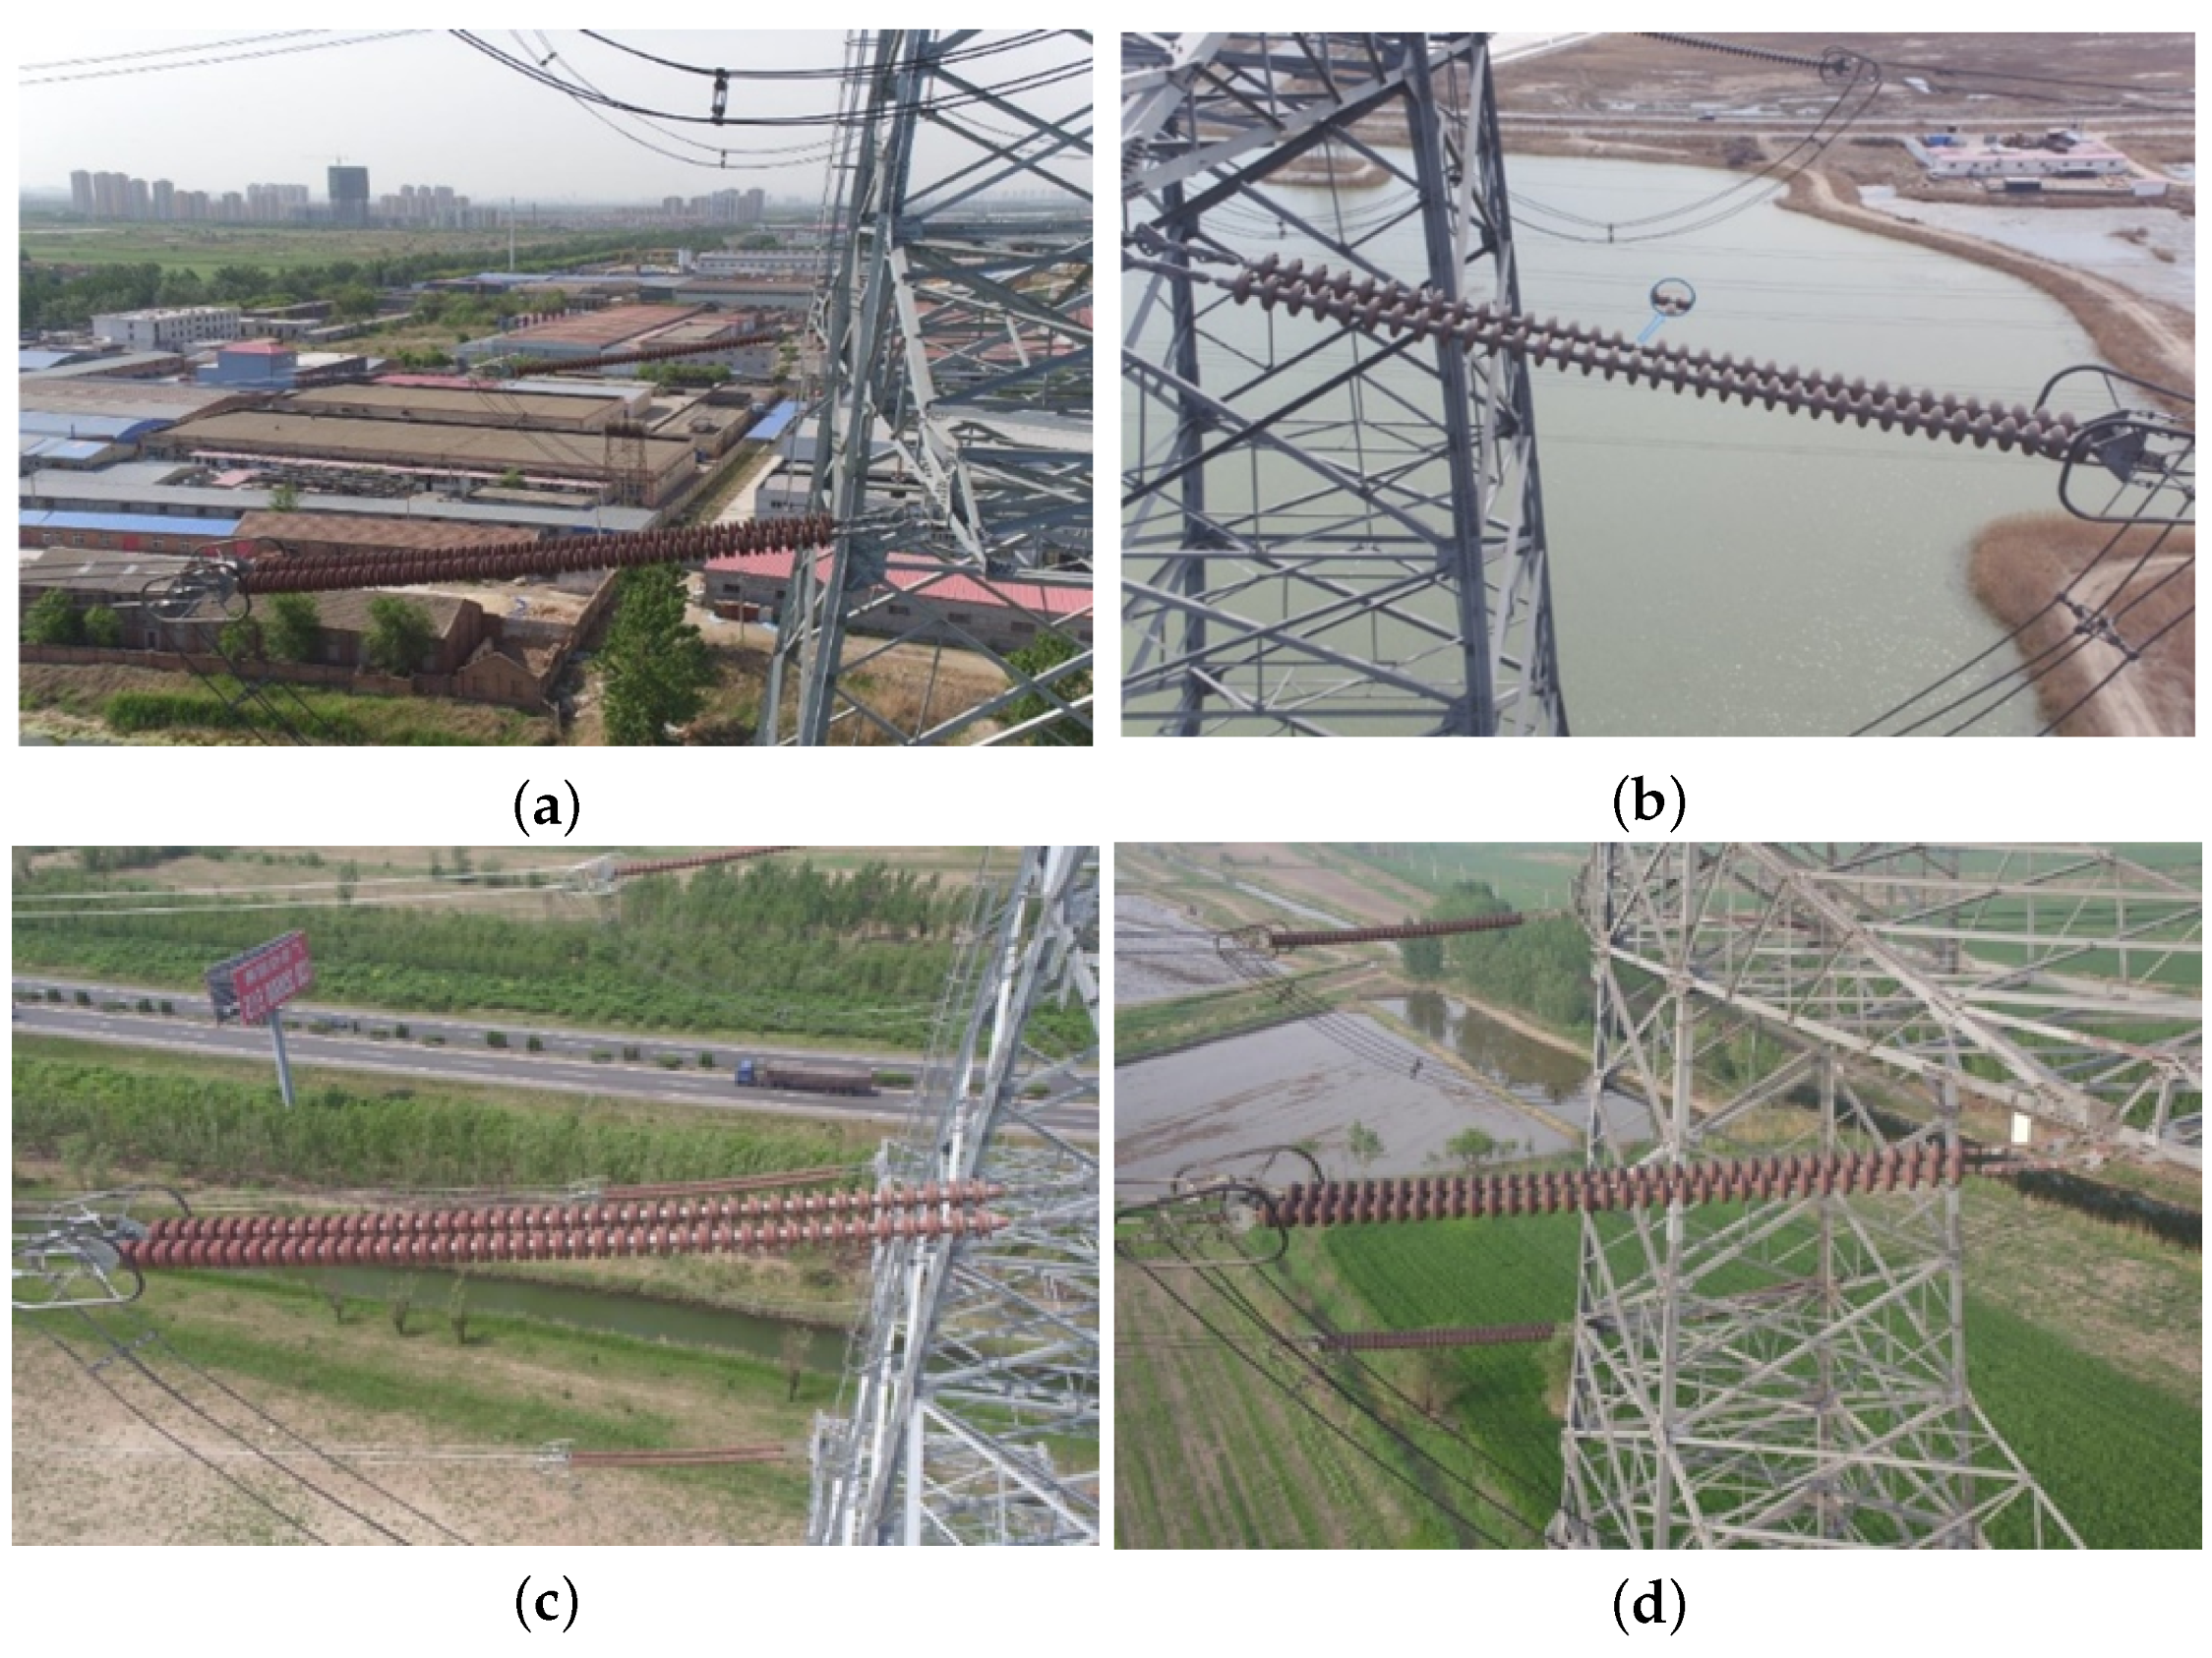
4.1. Insulator Aerial Image Data Processing
4.2. Experimental Environment
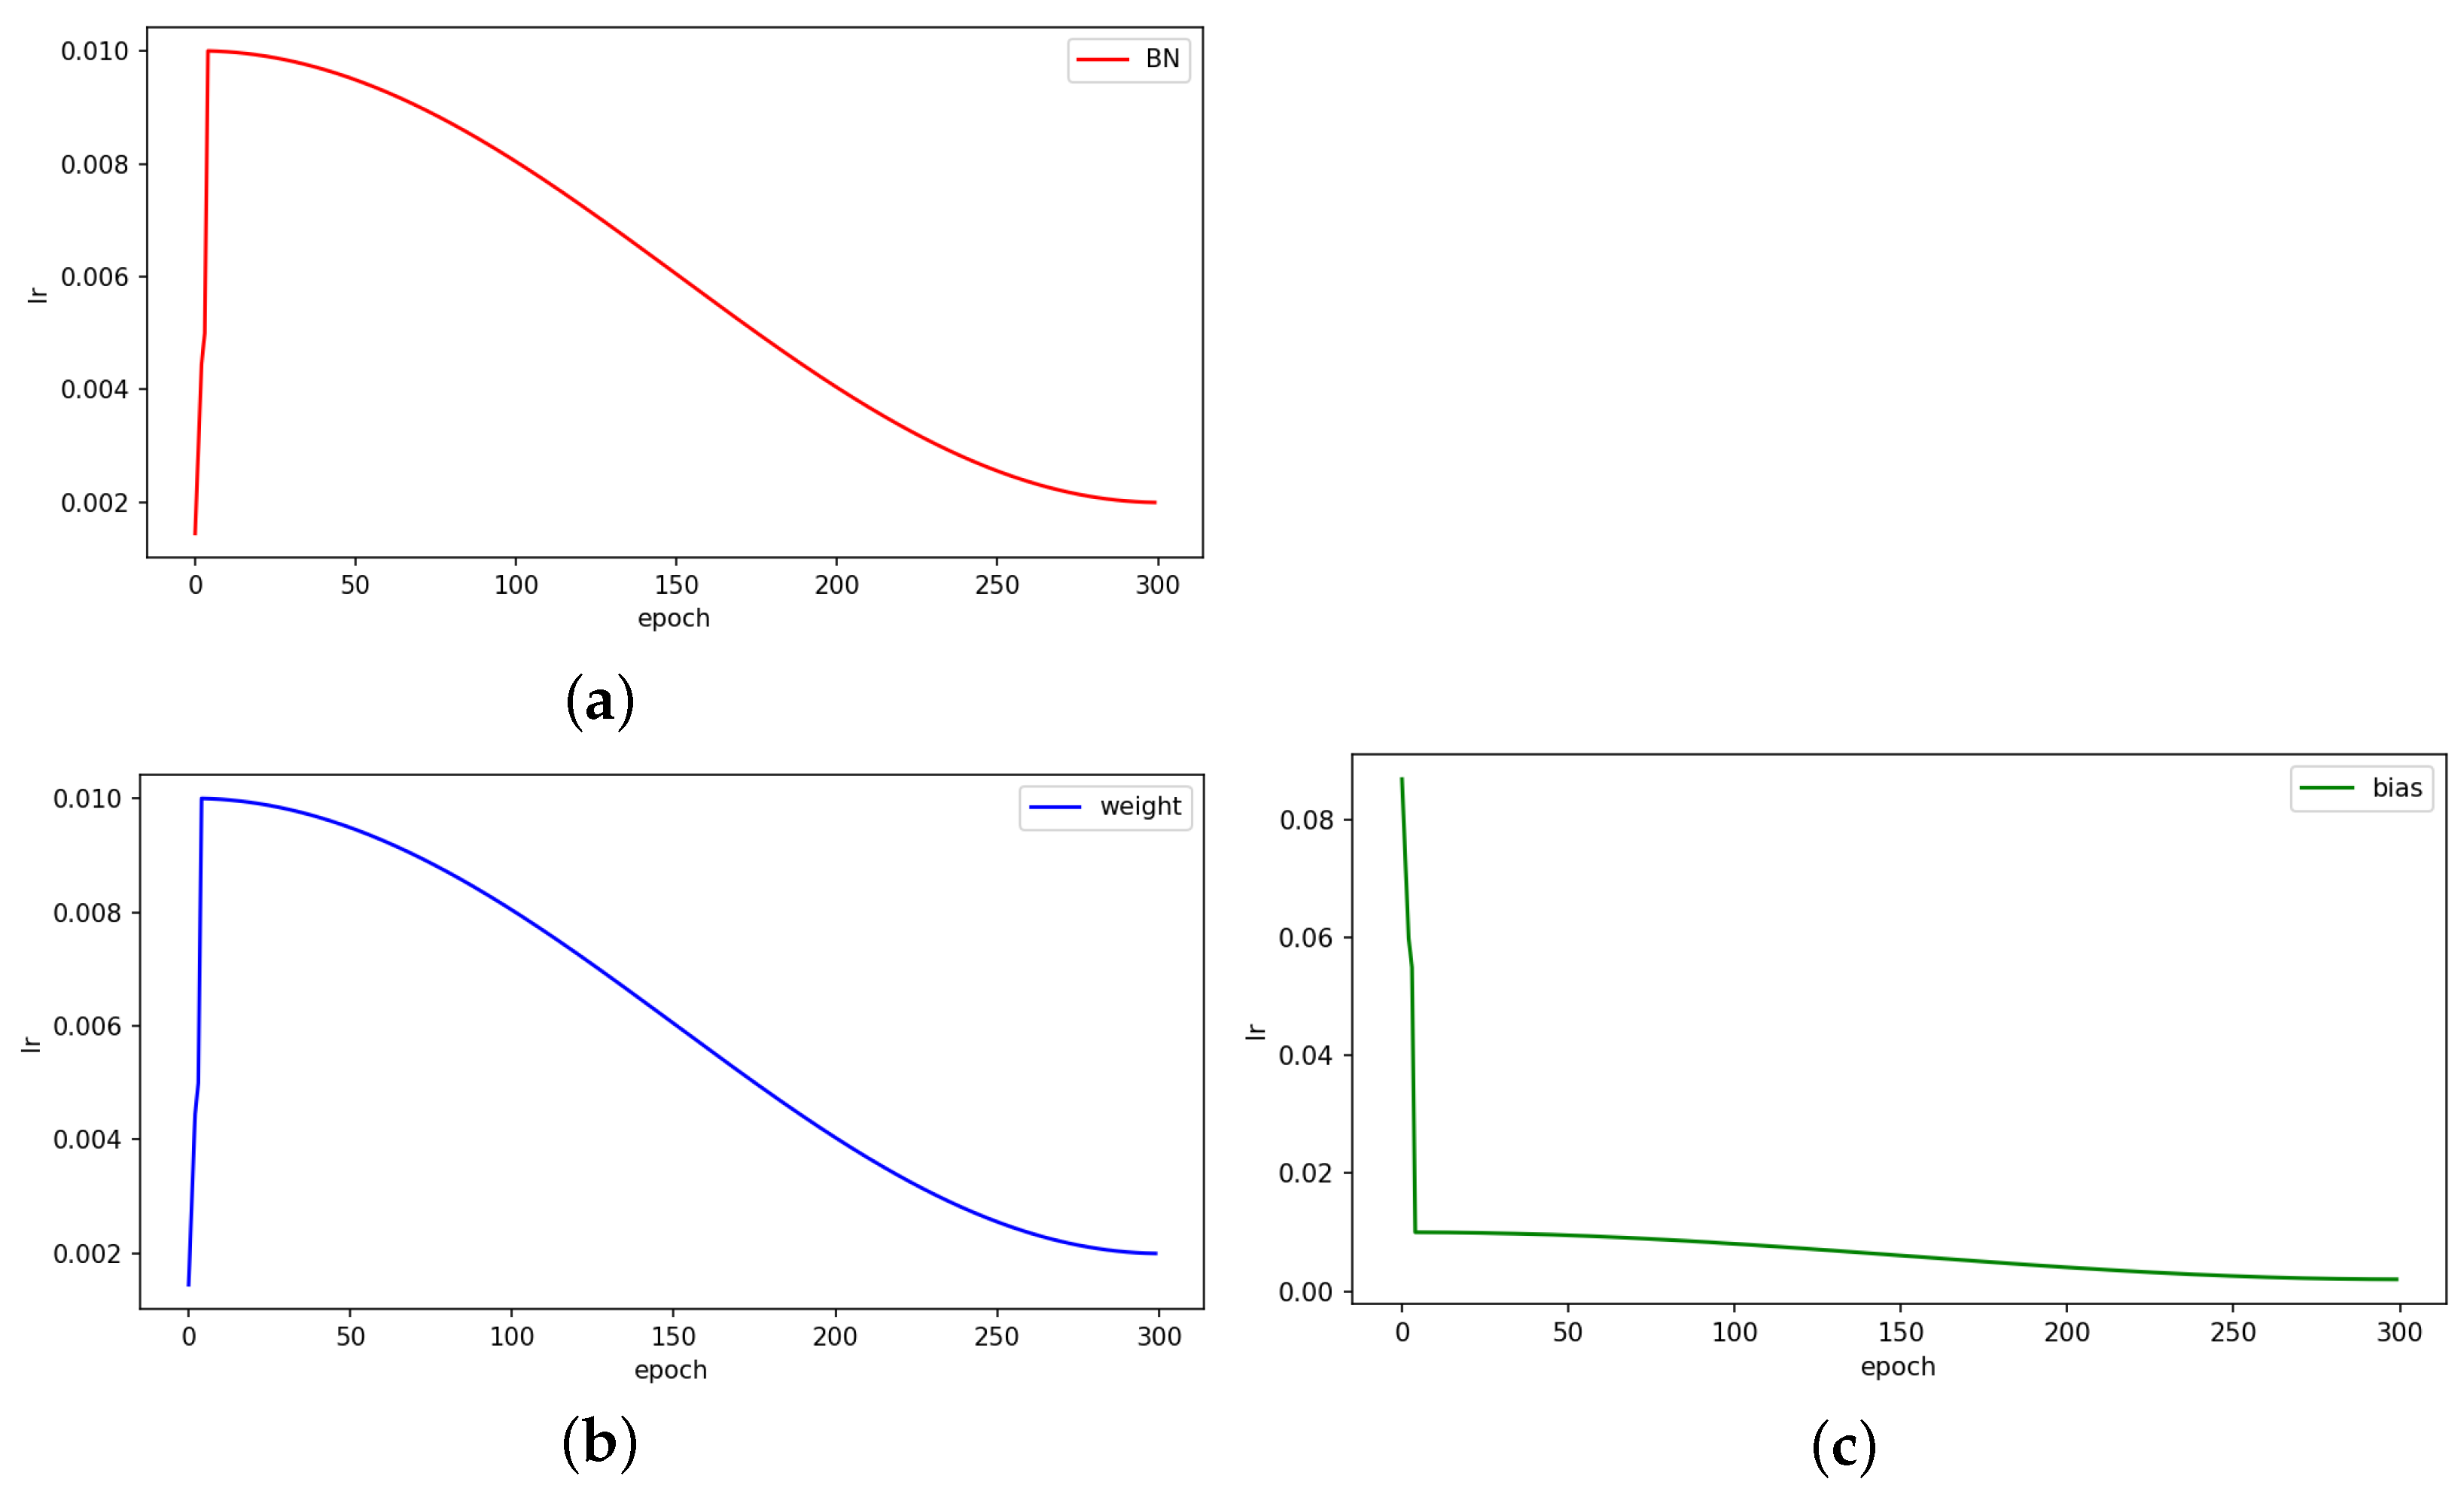
4.3. Experimental Procedure
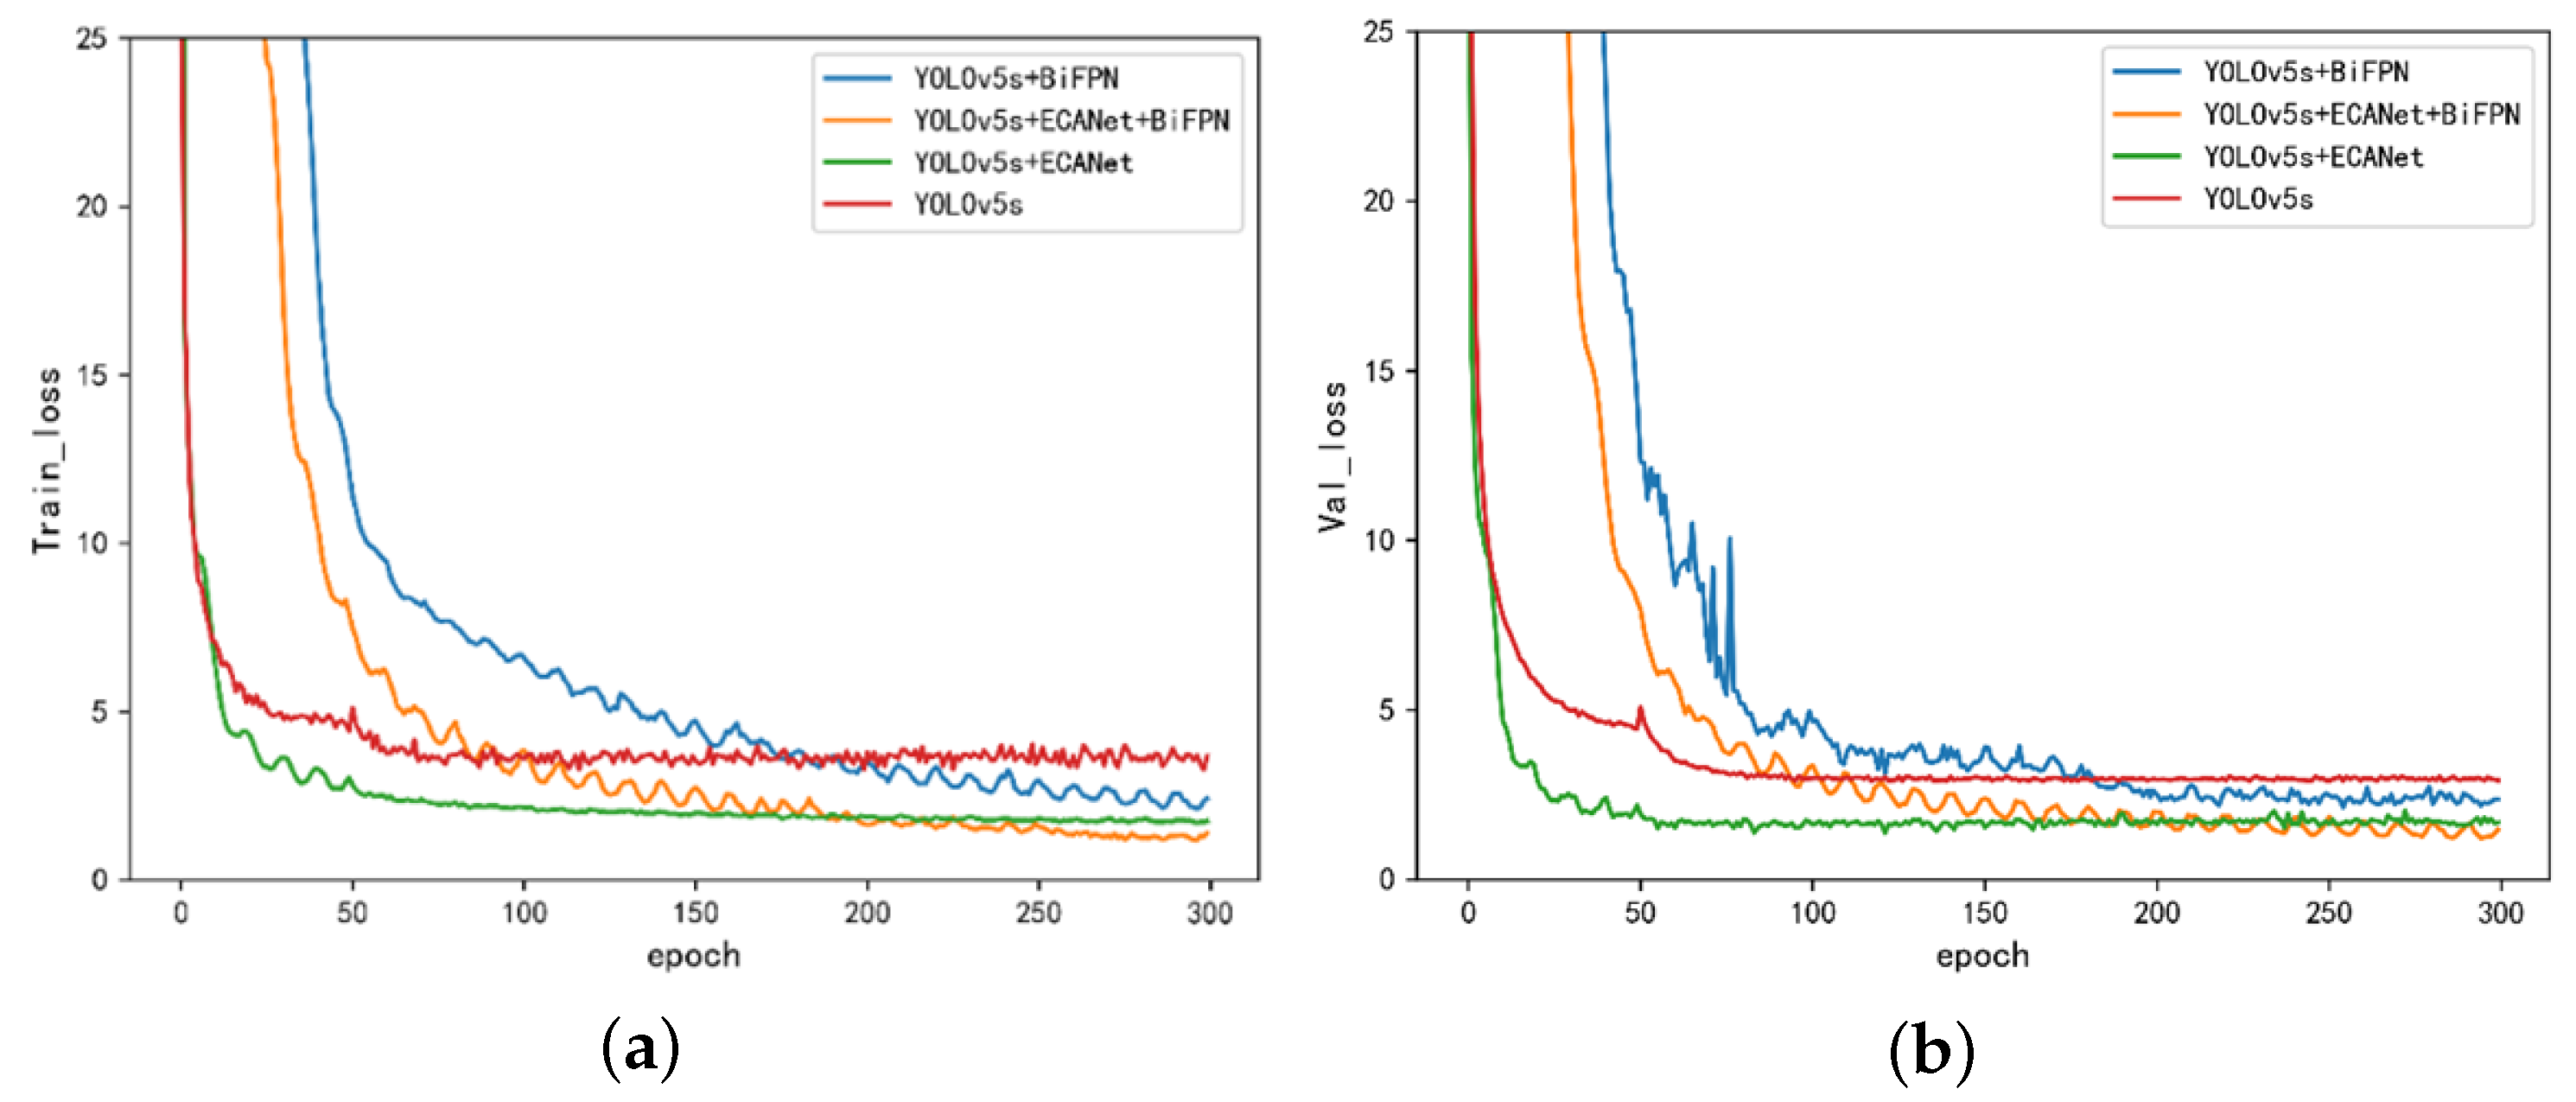
4.4. Experimental Results
5. Conclusions
Author Contributions
Funding
Institutional Review Board Statement
Informed Consent Statement
Data Availability Statement
Conflicts of Interest
References
- Bo, T.; Qiao, Q.; Li, H. Aerial image recognition of transmission line insulator strings based on color model and texture features. J. Electr. Power Sci. Technol. 2020, 35, 13–19. [Google Scholar]
- Tan, P.; Li, X.F.; Xu, J.M.; Ma, J.E.; Ning, Y. Catenary insulator defect detection based on contour features and gray similarity matching. J. Zhejiang Univ. Sci. Appl. Phys. Eng. 2020, 21, 64–73. [Google Scholar] [CrossRef]
- Wu, Q.; An, J. An Active Contour Model Based on Texture Distribution for Extracting Inhomogeneous Insulators From Aerial Images. IEEE Trans. Geosci. Remote Sens. 2014, 52, 3613–3626. [Google Scholar] [CrossRef]
- Wang, H.; Cheng, L.; Liao, R.; Zhang, S.; Yang, L. Nonlinear Mechanical Model of Composite Insulator Interface and Nondestructive Testing Method for Weak Bonding Defects. Zhongguo Dianji Gongcheng Xuebao/Proceedings Chin. Soc. Electr. Eng. 2019, 39, 895–905. [Google Scholar]
- Tian, Y.; Si, Y.; Mengyu, X.; Lisong, Y.; Zhengyan, L.; Xudong, X. Laser detection method for cracks in glass insulators. Power Grid Technol. 2020, 44, 3156–3163. [Google Scholar]
- Zijian, Z.; Enji, M.; Xufeng, L.; Youtong, F. Insulator fault detection based on deep learning with Hu-invariant moments. J. Railw. 2021, 43, 71–77. [Google Scholar]
- Zhai, Y.; Chen, R.; Yang, Q.; Li, X.; Zhao, Z. Insulator Fault Detection Based on Spatial Morphological Features of Aerial Images. IEEE Access 2018, 6, 35316–35326. [Google Scholar] [CrossRef]
- Liu, T. Porcelain Insulator Crack Location and Surface States Pattern Recognition Based on Hyperspectral Technology. Entropy 2021, 23, 486. [Google Scholar]
- Rahman, E.U.; Zhang, Y.; Ahmad, S.; Ahmad, H.I.; Jobaer, S. Autonomous Vision-Based Primary Distribution Systems Porcelain Insulators Inspection Using UAVs. Sensors 2021, 21, 974. [Google Scholar] [CrossRef]
- Siddiqui, Z.A.; Park, U. A Drone Based Transmission Line Components Inspection System with Deep Learning Technique. Energies 2020, 13, 3348. [Google Scholar] [CrossRef]
- Choi, I.H.; Koo, J.B.; Son, J.A.; Yi, J.S.; Yoon, Y.G.; Oh, T.K. Development of equipment and application of machine learning techniques using frequency response data for cap damage detection of porcelain insulators. Appl. Sci. 2020, 10, 2820. [Google Scholar] [CrossRef] [Green Version]
- Zhai, Y.; Cheng, H.; Chen, R.; Yang, Q.; Li, X. Multi-saliency aggregation-based approach for insulator flashover fault detection using aerial images. Energies 2018, 11, 340. [Google Scholar] [CrossRef] [Green Version]
- Hosseini, M.M.; Umunnakwe, A.; Parvania, M.; Tasdizen, T. Intelligent Damage Classification and Estimation in Power Distribution Poles Using Unmanned Aerial Vehicles and Convolutional Neural Networks. IEEE Trans. Smart Grid 2020, 11, 3325–3333. [Google Scholar] [CrossRef]
- Davari, N.; Akbarizadeh, G.; Mashhour, E. Intelligent Diagnosis of Incipient Fault in Power Distribution Lines based on Corona Detection in UV-Visible Videos. IEEE Trans. Power Deliv. 2020, 36, 3640–3648. [Google Scholar] [CrossRef]
- Wei, C.; Peiwei, X.; Zhiyong, Y.; Xinhao, J.; Bo, J. Detection of small and dim targets in infrared images under complex background. Appl. Opt. 2021, 42, 643–650. [Google Scholar] [CrossRef]
- Redmon, J.; Farhadi, A. Yolov3: An incremental improvement. arXiv 2018, arXiv:1804.02767. [Google Scholar]
- Sadykova, D.; Pernebayeva, D.; Bagheri, M.; James, A. IN-YOLO: Real-Time Detection of Outdoor High Voltage Insulators Using UAV Imaging. IEEE Trans. Power Deliv. 2019, 35, 1599–1601. [Google Scholar] [CrossRef]
- Akbari, M.; Liang, J. Semi-recurrent CNN-based VAE-GAN for sequential data generation. In Proceedings of the IEEE International Conference on Acoustics, Speech and Signal Processing (ICASSP), Calgary, AB, Canada, 15–20 April 2018; pp. 2321–2325. [Google Scholar]
- Bochkovskiy, A.; Wang, C.Y.; Liao, H.Y.M. Yolov4: Optimal speed and accuracy of object detection. arXiv 2020, arXiv:2004.10934. [Google Scholar]
- Jianpeng, B.; Fan, L.; Peixu, H.; Yamin, L.; Xiaoyun, S. Breakage identification and location of transmission line insulators under complex environment. High Volt. Technol. 2022, 48, 8. [Google Scholar]
- Redmon, J.; Farhadi, A. YOLO9000: Better, Faster, Stronger; IEEE: Piscataway, NJ, USA, 2017; pp. 6517–6525. [Google Scholar]
- Sabour, S.; Frosst, N.; Hinton, G.E. Dynamic routing between Capsules. Available online: https://proceedings.neurips.cc/paper/2017/hash/2cad8fa47bbef282badbb8de5374b894-Abstract.html (accessed on 11 April 2022).
- Hai, L.; Yang, L.; Zhengrong, Z. Luminous remote sensing building area detection with complex background. J. Infrared Millim. Waves 2021, 40, 369–380. [Google Scholar]
- Hu, J.; Shen, L.; Sun, G. Squeeze-and-excitation networks. In Proceedings of the IEEE Conference on Computer Vision and Pattern Recognition, Salt Lake City, UT, USA, 18–23 June 2018; pp. 7132–7141. [Google Scholar]
- Liu, W.; Anguelov, D.; Erhan, D.; Szegedy, C.; Reed, S.; Fu, C.Y.; Berg, A.C. Ssd: Single shot multibox detector. In Proceedings of the European Conference on Computer Vision, Amsterdam, The Netherlands, 8–16 October 2016; pp. 21–37. [Google Scholar]
- Xiaojun, L.; Wei, X.; Yunpeng, L. Small Target Detection Algorithm for UAV Aerial Photography Images Based on Enhanced Underlying Features. Comput. Appl. Res. 2021, 38, 1567–1571. [Google Scholar]
- Lin, T.Y.; Dollár, P.; Girshick, R.; He, K.; Hariharan, B.; Belongie, S. Feature pyramid networks for object detection. In Proceedings of the IEEE Conference on Computer Vision and Pattern Recognition, Honolulu, HI, USA, 21–26 July 2017; pp. 2117–2125. [Google Scholar]
- Ren, S.; He, K.; Girshick, R.; Sun, J. Faster R-CNN: Towards Real-Time Object Detection with Region Proposal Networks. IEEE Trans. Pattern Anal. Mach. Intell. 2017, 39, 1137–1149. [Google Scholar] [CrossRef] [PubMed] [Green Version]
- Xu, L.F.; Huang, H.F.; Ding, W.l.; Fan, Y.l. Detection of small fruit target based on improved DenseNet. J. Zhejiang Univ. (Eng. Sci.) 2021, 55, 377–385. [Google Scholar]
- Iandola, F.; Moskewicz, M.; Karayev, S.; Girshick, R.; Darrell, T.; Keutzer, K. Densenet: Implementing efficient convnet descriptor pyramids. arXiv 2014, arXiv:1404.1869. [Google Scholar]
- Shu, Z.; Haotian, W.; Xiaochong, D.; Yurong, L.; Ye, L.; Yinxin, W.; Yingyun, S. Bolt detection technology for transmission lines based on deep learning. Power Grid Technol. 2021, 45, 2821–2828. [Google Scholar]
- Ruisheng, L.; Yanlong, Z.; Denghui, Z.; Dan, X. Detection of pin defects in transmission lines based on improved SSD. High Volt. Technol. 2021, 47, 3795–3802. [Google Scholar]
- Haibin, W.; Xiying, W.; Meihong, L.; Aili, W.; He, L. Combining cavity convolution and migration learning to improve the detection of dangerous goods in X-ray security inspection of yolov4. China Opt. 2021, 14, 9. [Google Scholar]
- Chen, L.C.; Papandreou, G.; Kokkinos, I.; Murphy, K.; Yuille, A.L. DeepLab: Semantic Image Segmentation with Deep Convolutional Nets, Atrous Convolution, and Fully Connected CRFs. IEEE Trans. Pattern Anal. Mach. Intell. 2018, 40, 834–848. [Google Scholar] [CrossRef] [Green Version]
- Zhe, D.; Wenzong, L.; Fenting, Y. Research on target detection method based on multi-feature information fusion. Comput. Appl. Softw. 2020, 37, 122–126. [Google Scholar]
- Dalal, N.; Triggs, B. Histograms of oriented gradients for human detection. In Proceedings of the IEEE Computer Society Conference on Computer Vision and Pattern Recognition (CVPR’05), San Diego, CA, USA, 20–25 June 2005; Volume 1, pp. 886–893. [Google Scholar]
- Neubeck, A.; Van Gool, L. Efficient non-maximum suppression. In Proceedings of the 18th International Conference on Pattern Recognition (ICPR’06), Hong Kong, China, 20–25 June 2006; Volume 3, pp. 850–855. [Google Scholar]
- Tao, X.; Zhang, D.; Wang, Z.; Liu, X.; Zhang, H.; Xu, D. Detection of Power Line Insulator Defects Using Aerial Images Analyzed With Convolutional Neural Networks. IEEE Trans. Syst. Man, Cybern. Syst. 2020, 50, 1486–1498. [Google Scholar] [CrossRef]
- Cai, Z.; Vasconcelos, N. Cascade r-cnn: Delving into high quality object detection. In Proceedings of the IEEE Conference on Computer Vision and Pattern Recognition, Salt Lake City, UT, USA, 18–23 June 2018; pp. 6154–6162. [Google Scholar]
- Cristi, F. Pre-commit-ci[bot] and Glenn-jocher. Ultralytics, Yolov5. 2020. Available online: https://github.com/ultralytics/yolov5/ (accessed on 11 April 2022).
- Rezatofighi, H.; Tsoi, N.; Gwak, J.; Sadeghian, A.; Reid, I.; Savarese, S. Generalized intersection over union: A metric and a loss for bounding box regression. In Proceedings of the IEEE/CVF Conference on Computer Vision and Pattern Recognition, Long Beach, CA, USA, 15–20 June 2019; pp. 658–666. [Google Scholar]
- Wang, Q.; Wu, B.; Zhu, P.; Li, P.; Hu, Q. ECA-Net: Efficient Channel Attention for Deep Convolutional Neural Networks. In Proceedings of the IEEE/CVF Conference on Computer Vision and Pattern Recognition (CVPR), Seattle, WA, USA, 14–19 June 2020. [Google Scholar]
- Bodla, N.; Singh, B.; Chellappa, R.; Davis, L.S. Soft-NMS–improving object detection with one line of code. In Proceedings of the IEEE International Conference on Computer Vision, Venice, Italy, 22–29 October 2017; pp. 5561–5569. [Google Scholar]
- Howard, A.; Sandler, M.; Chu, G.; Chen, L.C.; Chen, B.; Tan, M.; Wang, W.; Zhu, Y.; Pang, R.; Vasudevan, V.; et al. Searching for mobilenetv3. In Proceedings of the IEEE/CVF International Conference on Computer Vision, Seoul, Korea, 27–28 October 2019; pp. 1314–1324. [Google Scholar]
- Liu, S.; Qi, L.; Qin, H.; Shi, J.; Jia, J. Path aggregation network for instance segmentation. In Proceedings of the IEEE Conference on Computer Vision and Pattern Recognition, Salt Lake City, UT, USA, 18–23 June 2018; pp. 8759–8768. [Google Scholar]
- Roy, K.; Hasan, M.; Rupty, L.; Hossain, M.S.; Mohammed, N. Bi-FPNFAS: Bi-Directional Feature Pyramid Network for Pixel-Wise Face Anti-Spoofing by Leveraging Fourier Spectra. Sensors 2021, 21, 2799. [Google Scholar] [CrossRef] [PubMed]
- Tan, M.; Pang, R.; Le, Q.V. Efficientdet: Scalable and efficient object detection. In Proceedings of the IEEE/CVF Conference on Computer Vision and Pattern Recognition, Seattle, WA, USA, 14–19 June 2020; pp. 10781–10790. [Google Scholar]
- Wang, Z. Insulator Data Set, Chinese Power Line Insulator Dataset. 2018. Available online: https://github.com/InsulatorData/InsulatorDataSet (accessed on 11 April 2022).
- Wang, H.; Wang, Z.; Du, M.; Yang, F.; Zhang, Z.; Ding, S.; Mardziel, P.; Hu, X. Score-CAM: Score-weighted visual explanations for convolutional neural networks. In Proceedings of the IEEE/CVF Conference on Computer Vision and Pattern Recognition Workshops, Seattle, WA, USA, 16–17 June 2020; pp. 24–25. [Google Scholar]


| Algorithm Model | Model Size (MB) | Video Detection Speed (FPS) | FLOPs (G) |
|---|---|---|---|
| YOLOv3 | 235 | 25.00 | 66.096 |
| YOLOv4 | 244 | 22.21 | 60.334 |
| YOLOv5s | 27.8 | 68.18 | 17.060 |
| YOLOv5m | 83.2 | 40.62 | 51.427 |
| YOLOv5l | 182 | 25.12 | 115.603 |
| YOLOv5x | 340 | 10.00 | 219.026 |
| Models | Insulators (AP%) | Insulator Broken (AP%) | (mAP%) | Model Size (MB) | Video Detection Speed (FPS) |
|---|---|---|---|---|---|
| YOLOv3 | 93.21 | 88.34 | 90.78 | 235 | 25.00 |
| YOLOv4 | 93.32 | 91.56 | 92.44 | 244 | 22.21 |
| YOLOv5s | 93.30 | 90.63 | 91.96 | 27.8 | 68.18 |
| YOLOv5m | 93.52 | 94.50 | 94.01 | 83.2 | 40.62 |
| Ours1 | 94.35 | 95.51 | 94.93 | 28.1 | 63.81 |
| Ours2 | 92.57 | 93.19 | 92.88 | 74.6 | 53.02 |
| Ours3 | 94.68 | 95.36 | 95.02 | 74.8 | 49.40 |
| Models | Image 1 | Image 2 | Image 3 |
|---|---|---|---|
| YOLOv5s |  | 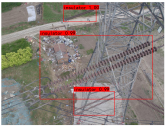 |  |
| Ours 1 | 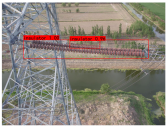 | 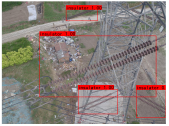 | 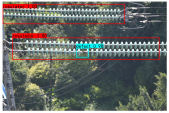 |
| Ours 2 |  | 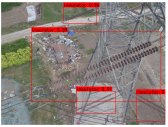 | 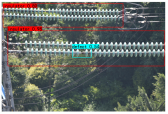 |
| Ours 3 | 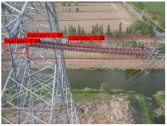 | 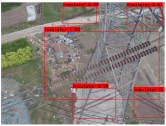 | 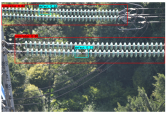 |
Publisher’s Note: MDPI stays neutral with regard to jurisdictional claims in published maps and institutional affiliations. |
© 2022 by the authors. Licensee MDPI, Basel, Switzerland. This article is an open access article distributed under the terms and conditions of the Creative Commons Attribution (CC BY) license (https://creativecommons.org/licenses/by/4.0/).
Share and Cite
Han, G.; He, M.; Gao, M.; Yu, J.; Liu, K.; Qin, L. Insulator Breakage Detection Based on Improved YOLOv5. Sustainability 2022, 14, 6066. https://doi.org/10.3390/su14106066
Han G, He M, Gao M, Yu J, Liu K, Qin L. Insulator Breakage Detection Based on Improved YOLOv5. Sustainability. 2022; 14(10):6066. https://doi.org/10.3390/su14106066
Chicago/Turabian StyleHan, Gujing, Min He, Mengze Gao, Jinyun Yu, Kaipei Liu, and Liang Qin. 2022. "Insulator Breakage Detection Based on Improved YOLOv5" Sustainability 14, no. 10: 6066. https://doi.org/10.3390/su14106066
APA StyleHan, G., He, M., Gao, M., Yu, J., Liu, K., & Qin, L. (2022). Insulator Breakage Detection Based on Improved YOLOv5. Sustainability, 14(10), 6066. https://doi.org/10.3390/su14106066